
Analysis of Rearranged T-cell Receptor /?-Chain Genes by
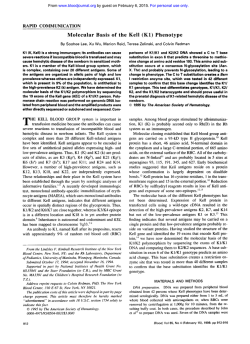
From www.bloodjournal.org by guest on February 6, 2015. For personal use only.
Analysis of Rearranged T-cell Receptor /?-Chain Genes by Polymerase
Chain Reaction (PCR) DNA Sequencing and Automated High Resolution
PCR Fragment Analysis
By M. Kneba, I. Bok, B. Linke, and W. Hiddemann
Polymerase chain reaction (PCR)-directedamplification and
sequencing of rearranged immune genes for identificationof
clone-specific markers are increasingly being used in acute
lymphoblastic leukemia(ALL) and non-Hodgkin's lymphoma
INHL) patients instead of the timeconsuming and labor intensive Southern analysis. In previous reports, no single
common VP and JP sequence had been identified that allowed reliable amplification of the majorityof rearranged Tcell antigen receptor (TCR)-p V-D-J junctions at the DNA
level because of therelatively large number of
possible TCRP variable (VPl and joining [JP) gene segments involved
in the rearrangement processes. In the present study we
designed highly degenerate PCR primers directed against
conserved sequences of the JP genes. In combination witha
previously publishedconsensus Vp primer, these Jp primers
specifically amplify TCR-/3 V-NID)N-J junctions from genomic DNA. Using this approach we studied DNA extracted
from biopsy material of nine patients with
T-cell lymphoproliferative disorders, one c-ALL patient, and five patients with
nonmalignant diseases. T-cell lines Molt 3, Jurkat, and HM
2 served as monoclonal controls. Individual PCR products
were sequenced after cloning. The nucleotide sequences of
96 randomly chosen recombinant vectors were determined.
In the polyclonal controls allanalyzed clones differed in their
TCR-p V-N(D)N-J junctions. In the T-cell lines, in all of the
T-cell malignancies, and in the c-ALL, monoclonal PCR products could be identified by
demonstration of clonally restricted V-N(D)N-J junctions. The PCR results were confirmed by automated fluorescence quantification and size
determination of PCR products after separation in a highresolution polyacrylamide gel. The procedure allows rapid
and specific characterization of clonal TCR-p rearrangements from genomic DNA and will significantly simplify current experimental approaches t o identify and t o quantitate
malignant T cells during initial staging and follow-upof Tlineage NHL and ALL patients.
0 1995 by The American Societyof Hematology.
T
arrangements,12-17.?l~?~
These studies demonstrated a rearrangement of TCR-y andlor TCR-S genes in the far majority of T-ALL and precursor B-ALL. Subsequently several
investigators studied the TCR-y and TCR-Sjunctional diversity by PCR-directed sequencing. The observed extensive
junctional diversity especially of the TCR-S junctional regions was applied in clinical follow-up studies as unique
clonal markers for detection of clinically occult leukemic
cells by use of sensitive PCR approaches.12.1~.21.22.24
These
PCR studies were facilitated by the fact that the structure
of the TCR-yIb locus is relatively simple and allows PCR
amplification of rearranged TCR-y/S genes at the DNA level
with a limited set of V and J region primer pairs. However,
in contrast tothe TCR-yIS locus, thebetachain V (VD)
region gene cluster is far more complex. It contains at least
64 functional VD genes, which have been grouped into 25
VD families, two diversity segments (D81. l and DP2. I),
TCR-S gene in peripheral T-NHL have been reporteddemonand 13 joining (J8l.l-1.6, 382.1-2.7) elements.'"'
strating the TCR-S gene to be deleted in most cases but
Several PCR approaches have been described for the analrearranged only in rare cases.12.1y,2"
In contrast, a large numysis of expressed V 8 and JP genes or of the structure of
ber of T-ALL and precursor B-ALL were examined in detail
TCR-8 V-D-J regions including anchor PCR, the use of
by Southern and PCR analysis for TCR-S and TCR-y reeither a panel of family- and subfamily-specific primers for
V8 or degenerate primers for conserved V 8 gene segments
in combination with a C 8 primer.'4~'7~25-35
Most of these pubFrom the Department of Internal Medicine, Division of Hematollished PCR approaches for the molecular definition of the
ogy/Oncology, Georg-August University, Goettingen, Germany.
TCR-&chain repertoire have fundamental shortcomings
Submitted February 20, 1995; accepted July 14, 1995.
Supported by Deutsche Krebshilfe Grant No. 70523.
such as dependence on RNA or impracticability due to the
Address reprint requests to Michael Kneba, MD, PhD, Departnecessity to perform analyses with a panel of multiple primment of Internal Medicine, Division of Hematology/Oncology,
ers. However, DNA is considerably more easy to isolate and
Georg-August University, Robert-Koch-Str. 40, D 37075 Goettingen, is more stable than RNA and there is no need
for reverse
Germany.
transcription before performing PCR amplification. To bring
The publication costs ofthis article were defrayed in part by page
analysis of rearranged TCR-8 V-D-J joints within the range
charge payment. This article must therefore be hereby marked
of a practical diagnostic methodology, we developed a less
"advertisement" in accordance with 18 U.S.C. section 1734 sole131 to
complex strategy that allows amplification and characterizaindicate this fact.
tion of rearranged TCR-8 V-D-J joints from genomic DNA
0 1995 by The American Society of Hematology.
in a single PCR. We designed highly degenerate PCR prim0006-4971/95/8610-0034$3.00/0
HE TWO TYPES of T-cell antigen receptors (TCR)
denoted as TCR-a/P and TCR-y/S consist of covalently linked heterodimeric glycoproteins and are made up
of either alpha and beta or gamma and delta chains. The
TCR chains are encoded by four gene segments designed
variable (V), diversity (D), joining (J), and constant (C) region elements that are joined together by a complex rearranging process early during T-cell development to generate a
complete functional TCR gene.'"" Rearranged TCR genes
identified by Southern blotting or polymerase chain reaction
(PCR) have been shown to represent useful diagnostic markers for clonality in acute lymphoblastic leukemias (ALL)
and non-Hodgkin's lymphomas (NHL) ofT-celllineage."""
In most studies on gene rearrangements in T-NHL by Southern analysis only TCR-fl and/or TCR-y genes havebeen
1.12.16,2" Few studies about the configuration of the
3930
Blood, Vol 86, No 10 (November 15), 1995:pp 3930-3937
From www.bloodjournal.org by guest on February 6, 2015. For personal use only.
3931
ANALYSIS OF REARRANGEDTCRPGENES
ers directed against conserved sequencesof the JP genes. In
combinationwithapreviouslypublishedconsensusV/?
primer these JP primers amplify specific TCR-/?
V-N(D)NJ junctions from genomic DNA. The PCR results were confirmedbyautomated
fluorescencequantificationand size
determination of PCR products after separation on a highresolution polyacrylamidegel?6-39
MATERIALS AND METHODS
Table 1. Clonality of TCR-p Gene Rearrangements Detected by
Southern Blotting, PCR-Directed Sequencing,or Genescan Analysis
Clonalitv Detected bv
PCR
No.
1
2
3
4
5
6
7
8
9
10
11
12
13
14
15
16
17
18
Southern
(TCR-P)
Diagnosis
Reactive lymphadenitis
Reactive lymphadenitis
Toxoplasmosis
Reactive lymphadenitis
Reactive lymphadenitis
Jurkat
Molt
3
HM 2
T-ALL
T-ALL
T-ALL
T-ALL
C-ALL
T-NHL
T-NHL
T-NHL
T-NHL
CD8 Ty-lymphocytosis
Sequencing*
G
G
G
G
G
R
ND
ND
2R
2R
ND
1R
ND
1R
1R
2-3 R
1R
1R
015
018
ND
ND
ND
10/10
212
4/4
2/10
8/10,
2/7; 2i7
6/6; 5/5$
314
5/5
2/8; 4/8
314
5/7; 2/7
219; 219; 219
214
Genescan
Analysist
P
P
P
P
P
m
m
m
m (oligo)
m (biallelic)
m (biallelic)
m
m
m (p)
m
m (p)
oligo
oligo
Abbreviations: R, rearrangement; G, germline configuration; ND,
not determined; m, monoclonal; p, polyclonal.
* No. of sequence-identical cloneslno. of totally sequenced clones.
t Oligo, oligoclonal PCR product as indicated by the electrophoretic
fluorescence-intensity1PCR product-size pattern on gene scanning. m
(oligo), denotes a dominant monoclonalproduct peak and in addition
a few minor side bands; m (biallelic), signifies the presence of two
distinct monoclonal PCR products in one DNA sample indicating the
presence of two rearranged TCR p alleles in the neoplastic T-cell
population; m (p)denotes a monoclonalproduct peak in a background
of polyclonal bands.
In case 11, the 284-bp and the 249-bp DNA fragments were cloned
separately.
*
Sequence
VD Con
5‘ CTCGAAlTCT (T/G) T (M)
(Cff) TGGTA (CF) C (G/A)
(T/A) CA 3’
5’CTCGGATCC (T/A) GAG (Cff) C I (G/A) GT (C/T) CC I I
I l CCAAA 3’
5’ CTCGGATCCAC I G (T/A) GAG (CF) C l (G/A) GT (C/T
cc 3‘
5’CTCGGATCCT(G/C)AGCC (T/G) I GTGCC I G (GIG) I
CCGAA 3’
5’ CTCGGATCCAC I GT (G/C) AGCC (TIG) I GTGCC3’
JP I (1)
JP I t2)
JP II (1)
Clinical samples and cell lines. Nine patients with T-cell lymphoproliferative disorders, one patient with c-ALL, and five patients
with nonmalignant diseases were selected for this study (Table 1).
All patients were admitted to the Department of Internal Medicine
of the University of Gottingen between 1986 and 1991 (4T-ALL,
1 case with Philadelphia chromosome positive c-ALL, 4 peripheral
T-NHL, and 1 case with large granular CD8 lymphocytosis [LGL]).
The lymphomas were categorized according to the updated Kiel
classification,40using conventional morphologic and immunohistologic techniques. The T-cell lines Jurkat, Molt 3, and HM 2 (obtained
from ATCC [Rockville, MD]) served as monoclonal controls. Four
cases with unspecific lymphadenitis and one case with toxoplasmosis
were used as polyclonal samples.
Case
Table 2. Oligonucleotide PrimersUsed for TCR-p PCR
Primer
Jp II (2)
Sequencesare adopted from published germline sequences.’”o
Joining region (downstream) primers are complementary inverse to
the germline sequences. Artificial restriction enzyme recognition sequences (EcoRI, BarnHl) at the 5‘ ends are underlined.
Genomic Sourhem blot analysis. Southern analysis of genomic
DNA for identification of TCR-P rearrangements was performed as
previously de~cribed~’.~’
with a radiolabeled TCR-P constant-region
probe after EcoRI and BamHI restriction enzyme digestion.
PCR conditions. The oligonucleotide primers used in this study
are shown in Table 2. The VP consensus primer (VP con) was
adopted from the published sequence of Lessin et
This consensus primer was designed to anneal to a region of 88% to 100%
homology among the different VD gene families. PCR was performed on an automated thermocycler (Model 480; Perkin-Elmer,
Cetus, Foster City, CA) in SO pL of 1X PCR buffer. Standard
reaction buffer, [SO mmoVL Tris-HCI pH 9.0, 20 mmoVL
(NH,),S04, 3 mmollL MgClz, 200 pmoVL of dATP, dGTP, dCTP,
and dTTP] containing S00 ng DNA template and 1 U TflDNA
Polymerase (Biozym, Hameln, Germany) was used. Primers were
used at a concentration of 10 pmoVL. For the automated fluorescent
fragment analysis, PCR was performed under the same conditions
except with a lower MgCI2 (1.S mmoVL) and primer concentration
(3 prnoVL). Incorporation of EcoRI and BamHI restriction sites at
the 5’ ends of the primers facilitated the insertion of PCR products
into the cloning site of the vector pUCI9. For fluorescent PCR
fragment analysis primer Vpcon was labeled at its S‘ end with
a chlorinated equivalent to 6-carboxyfluorescein (HEX) and high
performance liquid chromatography (HPLC) purified (Applied Biosystems, Weiterstadt, Germany). For TCR-P PCR two rounds of
amplification were performed in which first primer set VP Con with
a mixture or primers JP I(2) and JP II(2) wasused followed by
sequential amplification of aliquots [2% v01 of the products of the
first PCRwith primer set V@ CodJO I(1) and JP II(I)]. Cycle
conditions with primers VD CodJP I(2) and JP II(2) were 1 minute
at 92°C (denaturing), 40 seconds at 50°C (annealing), and 30 seconds
at 72°C (strand elongation) for 40 cycles. The first denaturation and
last primer extension step were extended to S minutes. In a second
round of 30 cycles with 1 minute at 92”C, 40 seconds at SVC, and
I
(1) PCR
30 seconds at 72°C and primer set VP CodJP I( 1) and JP I
products of around 255 bp (range ”240 to 290 bp) were generated.
Amplification products were analyzed by electrophoresis in an ethidium bromide containing 2.5% agarose gel (Sigma, Deisenhofen, Germany).
Cloning and DNA sequencing. Cloning of PCR products was
performed as previously described.lb Recombinant plasmids were
sequenced by the Taq-cycle-sequencing method involving the universal forward sequencing primers for pUC 19 and the Ready Reaction Dye Deoxy Terminator Cycle Sequencing kit (Applied Biosystems, Weiterstadt, Germany). For each DNA sample 2 to 11
randomly chosen clones were sequenced. Sequencing reaction prod-
From www.bloodjournal.org by guest on February 6, 2015. For personal use only.
KNEBAETAL
3932
4 3 2 1
5
6 1817
716158141312
9 1110
bp
Fig 1. Ethidium bromide stained 2.5% agarose gel of PCR products synthesized with the TCR V p and JP consensus primers and DNA from
polyclonal controls (1-51, cell lines Jurkat (61, Molt 3 (71, and HM 2 (81,9 cases with T-cell lymphoproliferations(cases9-12 and 14-18], and one
c-ALL (case 131. Cases are numbered according to Tables 1 and 3 and are identical to those in Fig 2. PCR size marker (Promega, Madison, WI;
Cat. No. 631611 is in the right lane. Note that intense and relatively sharp bands are seen with polyclonal as well as clonal PCR products.
ucts were analyzed on the auton1;ltcd DNA sequencer (Model 373A:
Applied Riosystems). Sequence determination of the cornplcte PCR
fragment allowed the identilication of the particular Vg. DO.and
JP segments and N-regions i n each VOlJp combination hy computer
assisted comparison with puhlishcd V@. DO. and JP sequences' l''
(SeqEd'" 675 DNA Sequence Editor: Applied Riosystcms).
F/liorc,.sccvrr, / k q q m w r coltrlysis ( , p m ' . w t r l r l i r r , q ) . For automatctl
fluorescent fragment analysis PCR products were generated in a
semi-nested PCR with the JP I( I ) and JP I I ( I ) primers and the
fluorescent dye-labeled primer V 0 con. One microliter of the PCR
product was mixed with 3 pL formamide and 0.5 pL of the internal
size standard Genescan-2500 ROX (Applied Biosystems). After denaturation for 3 minutes at 90°C PCR products were size separated
o n a high resolution polyacrylamide gel and analyzed hy automatic
fluorescence quantilication and size determination using the computer program GENESCAN 672 in the autolnated DNA sequencer."'
and 984 bp in the absence of other background bands. As
couldbe shown by sequencing, both bands representthe
two clonally rearranged TCR-P alleles in this particular case
(Table 3).
Seq~~ellc.ill,q
c ~ f c l o r l c ~PCR
c l pmrlrccts. As previously seen
with amplified TCR-y genes, visual analysis after electrophoresis in agarose gels alone didnot allow us to distinguish
exactlybetweenmonoclonalandpolyclonal
TCR-P PCR
products.Forverificationofthespecificityofthe
TCR-P
PCR and to demonstrate the polyclonality or monoclonality
of the PCR fragments. we therefore excised the PCR products that mode up the dominant band of around 255 bp from
the gel and cloned them after ligation into the polylinker site
of the pUCI9 sequencing vector. In case I I the 284 bp and
the 249bpDNAfragments
were cloned separately. The
TCR VP-N(DP)N-JP sequences of the cloned inserts were
RESULTS
determined by isolation of recombinant clones from 2 to I I
Sorrthet-11blot crrwlysis of TCR-P t - e n t - t - c r l l ~ ~ c ~Thir~~~~~~~t~.
randomly chosen separate bacterial colonies for each patient
teen DNA samples were studied by Southern analysis for
or cell line. The sequencing approach confirmed the speciTCR-P rearrangements. The results are shown in Table 1.
ficity of the PCR demonstrating TCR VP-N(DP)N-JP juncWhereas Southern blotting demonstrated monoclonal TCRtions in all cases.The results are shown in Table 3. By
P rearrangements in all T lymphoproliferations tested. only
sequencing a total of 96 TCR VP-N(DP)N-JP junctions in
germline bands were obtained in the four cases with unspeI S samples (samples I , 2, and 6 through 18), clonality could
cific lymphadenitis andin the case with toxoplasmosis (polybe
demonstrated exclusively in the T-cell lines. in 5 of S of
clonal controls). as expected. In cases 17 and I8 relatively
the
ALLs. in 4 of 4 of the lymphomas, and in the case with
weak rearranged TCR-B bands were observed obviously as
T lymphocytosis. In onecase(no.
17) nine clones were
a result of a lowlymphoma T cell content in these diagnostic
sequenced and threerearrangementsappearedtwice,
and
samples.
three
only
once.
suggesting
that
three
clonally
restricted
TCR-P PCR. After two roundsofamplification
all l8
junctions and at least three background rearrangements were
DNA samples generated a PCR product in the expected size
present in this case (Table 3). However, GENESCAN analyrange between 240 and 290 bp for TCR-P
V-D-J recombinasis showed an oligoclonal pattern with at least eight distinct
tions as directly visualized after electrophoresis in an ethidproduct peaks in this case (Fig 2). Given the peak heights
ium bromide containing agarose gel (Fig I ) . Under standard
in the Genescan analysis, it is likely that more than three
PCR conditions(see Materials andMethods) in thepolynonrandom rearrangements exist in theT-cellpopulation,
clonal controls and the T-NHL samples (cases I to S and 14
whichprobablywould
have beendiscovered if additional
to 18. respectively) several bands of unknown origin were
clones had been analyzed. A similar situation exists for case
seen above and below the dominant specific TCR-P PCR
no. 18. in which four clones were sequenced and one was
product (data not shown).However, useof GENESCAN
found twice. In all sequenced clones a distinct VD and J P
fluorescent-primer reaction buffer containingHPLC-purified
gene segment could be identified. A DP element was found
primersand in additionamuch
lower primer (3 pmol/L)
in all except four clones. The junctional regions showed an
and MgCL? ( 1 .S mmol/L) concentration markedly improved
extensive diversity due to the addition of N-region nucleothe specificity of the reaction
(Fig l). Case I I was exceptidesbetween the VP-DP and DD-JP junctions andseem
tional as it produced two clearly separated bands of 249 bp
From www.bloodjournal.org by guest on February 6, 2015. For personal use only.
3933
ANALYSIS OF REARRANGED TCRB GENES
Table 3. TCR-p V-N(D)NJ Junctional Sequences
Case
1
2
6
7
8
9
10
11
12
13
14
(n)
VP
Region
DP
JP
5.4
17
17
2.2
13
17
17
2.2
13
17
4.2
4.2
4.2
8.l
2.2
17
4.2
13
20
6
13
14
17
13
13
5.4
13
3.3
3.3
13
1.1
1.1
2.1
1.1
1.1
2.1
1.1
2.1
2.3
2.1
2.3
2.2
2.1
2.3
2.3
2.3
1.6
2.1
2.7
2.7
2.3
1.2
2.1
2.4
2.3
2.3
2.1
2.4
2.7
2.3
2.3
2.7
2.3
2.2
2.3
2.7
2.7
1.6
2.3
2.7
2.1
2.1
2.1
2.6
2.7
2.7
2.3
2.7
2.3
2.4
2.1
2.3
2.3
1
15
16
17
18
17
6.4
12.2
12
2.2
17
17
17
17
17
4.2
17
17
17
-
1.1
1.1
1.1
1.1
-
2.1
2.1
2.1
-
1.1
2.1
1.1
2.1
1.1
1.1
-
2.1
2.1
-
1.1
2.1
1.1
1.1
1.1
2.1
1.1
2.1
2.1
1.1
1.1
2.1
1.1
2.1
1.1
1.1
NDN
V Region
TATCTGCGCCAGCAGCT
TCTATCTCTGTGCCAGT
TCTATCTCTGTGCCAGTAG
GCTTCTACATCTGCAGTGC
GTGTACTTCTGTGCCAGCA
CTATCTCTGTGCCAGTAGT
ATCTCTGTGCCAGTAGTAG
GNAGCTCTACATCTGCAG
GTGTACTTCTGTGCCAGCA
CTGTCTCTGTGCCAGTAGT
ATATCTCTGCAGCGTGAA
CAGNATATNTCTCTGCAGC
CAGCATATATCTCTGCAGC
NCTTCTGTGCCAGCAGTTT
ACATCTGCAGTGCTAGAGA
CTATCTCTGTGCCAGTAGT
ATATATCTCTGCAGCGTTG
GTACTTCTGTGCCAGCAGT
CTATCTCTGTGCCTGGAGT
ATGTATCTCTGTGCCAGCA
TGTACTCTGTGCCAGCAG
TCTATCTCTGTGCCAGTAG
TTCTATCTCTGTGCCAGTA
ACTTCTGTGCCAGCAGTTA
GTACTTCCGTGCCAGCAGT
TCTTTGCGCCAGCAGCrrG
GTACTTCTGTGCCAGCAGT
ACTCTGTGCCAGCAGT
GTAGTTCTGTGCCAGCAGT
TGTACTCTGTGCCAGCAG
TTTGTATTTCTGTGCCAGC
TCTATCTCTGTGCCAGTAG
TGTATCTCTGTGCCAGCAG
AGACATCTGTGTATCTG
GACATCTGTGTATCTGC
GCTTCTACATCTGCAGTGC
TATCTCTGTGCCAGTAGTA
TATCTCTGTGCCAGTAGTA
TATCTCTGTGCCAGTAGTA
CTATCTCTGTGCCAGTAGT
CTATCTCTGTGCCAGTAGT
CAGCATATATCTCTGCAGC
TATCTCTGTGCCAGTAGTA
TATCTCTGTGCCAGTAGTA
TATCTCTGTGCCAGTAGTA
J Region
CAAGCGGGGGGGCAAG
ACCCAGGGACAGGGGGTACCT
CGTAAAAGAAA
GGGGGCGGGATT
GGCTGACCGGGACAGGGGCTG
ATGeAATGG
TGACAGGGGTTATGG
GGCTTTKCCCTTCGG
GTTACTCTACACCGTGGAATAAC
CCCAACCGCGGGGACAGGGN
CTCCCGACAGGGTCGGT
GTGAACTCCCGACAGGGTCGG
G T T T A T e
CTCGACCTGTTCGG
TGCGACTAGCGATCCAAAA
CCCTTENAACGAG
GGAGGGTACCCAA
CACCGGT
AAAGGTTGGGAGGGGGGTCCCG
GCTTAGGTTAGTACGCGGCTAGAGACC
AGATACGCAGTATTTCG
AATGAGCAGTTCTCGG
TACGCAGTATTTCGGCC
CACAGATACGCAGTATT
GAGCAGTTCITCGGNCC
AGCACAGATACGCAGTA
AGATACGCAGTATTTCG
ACAGATACGCAGTATTT
TCACCCCTCCACTCGG
CTACAATGAGCAGTTCT
CTACGAGAAGTACTTCG
CCTACGAGCAGTACTTC
GATACGCAGTATITGG
CTAACTATGGCTACACC
AATGAGCAGTTCTCGG
CAGTACTTCGGCGCCGC
CACAGATACGCAGTAT
CAGATACGCAGTATTTC
ATGAGCAGTTCTTCGGC
CAGTACTTCGGCGCCGG
CCTACGAGCAGTACTTC
C~CACAGGGGGGG
GGCCCCGGCACCCGGCT
CCTAACCCCC-CTACAATGAGCAGTTCTTC
TTTGGCCCCGGAACCCG
CCACCGACAGGGTATCACCCCTCCAC
CTACGAGCAGTACTTCG
CTCGAACACTTTAACCAGCCCGCCCCAAACCGGGACAAGAG
CACAGATACGCAGTATT
CCACCTT
ACCGGGGAGCTGlllT
ACTAGTATTGAGGGN
ACAGATACGCAGTATTT
TACTAGAACGCCGACTAGCGGGAGTTATCTTA
CCTACGAGCAGTACTTC
C
GAGCAGTTCTTCGGCCC
CAAAGGAAl
TCCTATAATCACCCCT
CCGTCCCGGGACAGGGAAA
AGCACAGATACGCAGTA
AGCGATTCTAGCGGGGAT
CTCCTACGAGCAGTACT
CCCCAACAGGGNNAA
CCTACAATGAGCAGTTC
NGAAAAGACAGGGGTGG
CTCCTACAATGAGCAGT
CGNCAGBANNNCTT
CTCCTACAATGAGCAGT
GCCAGCAGGGAGGCCTT
TGGGGCCAACGTCCTGA
GGGGACAGGGGA
TCCTACGAGCAGTACTT
TATTCTAGCGGGAGGTATT
CCTACGAGCAGTACTTC
TTGTC-CCC
CACAGATACGCGTATTT
TTCGGCANAGAGTA
CTCCTACGAGCAGTACT
AGCACAGATACGCAGTA
CAGTACTTCGGCGCCNG
CAATGAGCAGTTCTCG
AGATACGCAGTATCG
GCACAGATACGCAGTAT
TCR-P V-N(D)N-J junctional sequences are shown. The PCR-derived sequences are aligned t o the known germline Vp and JP sequences.’”’ DO elements flanked by
the template independent IN) sequences are underlined. The PCR products were generated from genomic DNA under the described PCR conditions with standard
reaction buffer (see Materials and Methods), cloned intopUC19. and sequenced by the Taq cycle sequencing method. Unclear readable nucleotides are written as N.
T w o t oeleven randomly chosen clones were sequenced pereach PCR product. (n), denotes number of clones with thisparticular sequence. Case numbers are identical
t o those in Table 1
ideally suited as clone-specific identification sequences.
Comparison of the junctional regions that we obtained for
the Jurkat and Molt 3 cell lines revealed complete agreement
with published sequences as an independent test for the PCR
res~lts.*,~,~
Gene scanning of Juorescent dye labeled PCR products.
PCR products were size separated on a high resolution polyacrylamide gel and analyzed by automatic fluorescence
quantification and size determination using the computer
program GENESCAN672 in the automated DNA sequencer.
The sensitivity and specificity of this new approach was
assessed using DNA extracts o f a
l
l 18 DNA samples, most
of which had been previously analyzed by Southern blotting
and hybridization with a radioactively labeled TCR-P gene
probe. The scanning results are shown in Fig 2. Because of
the hypervariable character of rearranged TCR-P V-N(D)NJ junctions, the size distribution pattern o f a given PCR
product characterizes the corresponding T-cell population.
Whereas DNA extracts from polyclonal lymphoid-cells
(samples 1 to 5) yielded a “fluorescence spectrum” of DNA
bands composed of polyclonal PCR fragments of different
sizes, products derived from homogeneous clonal cell populations-the cell lines, the acute leukemias, and the T-NHL
cases 13 and 15-produced one or two sharp and dominant
peaks of fluorescence corresponding to the PCR-amplified
clonally rearranged alleles. Case 9, which showed a biallelic
Southern rearrangementpattern, yielded only one sharp and
prominent peak in addition to four clearly separated small
peaks. In two leukemias (cases 10 and 11) the TCR-/?PCR
demonstrated a clear biallelic rearrangement in agreement
with the Southern blot data. The T-NHL samples 14, 16, 17,
and 18, however, showed one or two prominent peaks of
fluorescence over a background of polyclonal PCR products.
As could be demonstrated by sequencing of cloned PCR
From www.bloodjournal.org by guest on February 6, 2015. For personal use only.
3934
KNEBA ET AL
CASE 2
CASE 1
r
1
CASE 5
CASE 4
CASE 11
CASE 10
CASE 13
:I
CASE 3
I I
1
CASE 9
CASE 12
CASE 14
CASE 15
CASE 17
CASE 18
'l' -
CASE 16
Fig 2. Electrophoretic profiles of fluoreecent TCR-PPCR products from five polyclonal controls (cases 1-51. one c-ALL, and nine patients
with malignant T-cell prolierations analyzed with the GENESCAN 612 software on the automated
sequencer. Relative fluorescence intensities
(y-axis) are plotted as a function of PCR fragment size (x-axis) for each PCR product. Cases are numbered according t o Tables 1 and 3. The xaxis reflects the PCR product size in base pairs.
From www.bloodjournal.org by guest on February 6, 2015. For personal use only.
ANALYSIS OF REARRANGED TCRB GENES
products (Table 3 ) and by the weak rearranged bands on
Southern analysis in cases 17 and 18, this fluorescence pattern is most likely caused by coamplification of monoclonal
as well as polyclonal TCR-P V-N(D)N-J junctions of neoplastic and admixed “contaminating” nonmalignant T cells,
which can make up a substantial cell fraction in some of the
nodal T-cell lymphomas.
To confirm the specificity of the gene scanning results we
reamplified plasmid DNA extracted from randomly selected
recombinant clones of PCR products from which the DNA
sequences shown in Table 3 had been derived. Gene scanning of the fluorescent PCR products of the cloned plasmids
clearly demonstrated that their sizes were in complete
agreement with the most prominent PCR fragments generated in separate PCR runs with the corresponding diagnostic
DNA samples (data not shown).
DISCUSSION
In the present study we characterized the TCR-P VN(D)N-J junctions from a variety of hematologic malignancies including not only T-ALL but also peripheral T-cell
NHL by PCR amplification of genomic DNA and sequencing. We previously described a technique that allows accurate distinction between monoclonal and polyclonal TCR-7
V-N-J junctions by temperature gradient gel electrophoresis
(TGGE) of TCR-7 PCR products. However, our attempts to
analyze the TCR-P PCR products by TGGE gave unsatisfactory results (not shown). The most likely explanation for this
observation is the use of highly degenerate TCR-P PCR
primers, which also contained inosine residues. This leads
to double stranded TCR-P PCR products that are thermally
unstable during TGGE resulting in relatively broad bands or
a diffuse smear. In search for a more robust procedure that
is not influenced by thermal instability of PCR fragments
we analyzed the PCR products after fluorescent labeling by
a new method, automated fluorescence quantification and
size determination after separation on a high-resolution polyacrylamide gel in an automated DNA ~ e q u e n c e r . As
~ ~ we
.~~
have shown here, complete agreement with respect to clonality and size of the predominant PCR fragments was obtained between this new method and PCR-directed sequencing. However, it should be noted that with both methods
unequivocal results were obtained only with the polyclonal
control samples and in cases in which leukemidymphoma
cells were in high abundance (the cell lines, the leukemias,
and the T-NHL cases no. 14 to 16). In cases in which the
neoplastic cells were in low abundance or probably truly
oligoclonal (cases 17 and l8), the interpretation of the data
was much less clear-cut. A similar approach, for which the
term “spectratyping” was proposed, has been described for
the analysis of circulating T-cell repertoire complexity in
normal individuals and bone marrow recipients3’ or the Vpspecificity of superantigen a ~ t i v a t i o nIn
. ~this
~ procedure, the
TCR-P repertoire complexity is measured based on CDR3
size-heterogeneity within VP families and was used as an
indicator for immunocompetence in individuals or of reconstitution of the immune system after bone marrow transp l a n t a t i ~ nAs
. ~ ~we have shown here, the TCR-P spectratype
3935
can also be useful as marker for clonality in ALL and TNHL and for discrimination between monoclonal and polyclonal T-cell populations. A similar technique has been described for detection of immunoglobulin gene rearrangement
in one case with
Despite the complexity of the TCR-P locus, several techniques using the PCR amplification of TCR-8 regions have
been d e ~ e l o p e d . ’ ~ . ’ The
~ . * ~published
-~~
strategies for TCR-P
DNA PCR are rather complex and unpractical for routine
diagnostics. In addition, most of the previous studies using
PCR techniques to investigate the use of TCR repertoires in
the clinical setting rely strongly on strategies that target
TCR-@ RNA transcripts. The analysis of mRNA reverse
transcribed cDNA sequences places certain constraints on
the minimal quality of the genetic material necessary to perform PCR analysis. Unfortunately, fresh or snap frozen diagnostic material from ALL or T-NHL patients for extraction
of RNA is often not available in clinical practice. However,
DNA suitable for PCR is more easy to isolate, even from
paraffin embedded material and is more stable than RNA
and there is no need for reverse transcription before performing PCR. The described convenient and nonradioactive
strategy that targets genomic DNA for analysis of rearranged
TCR P-chain genes by PCR in combination with computer
assisted size determination and nonradioactive DNA sequencing of clonal TCR-P V-D-J joinings circumvents a
number of the problems encountered with RT-PCR. In addition, in dilution experiments it should be possible to get
quantitative information on the amount of distinct T-cell
clones in diagnostic samples from the intensity of the fluorescence signal if the PCR is carried out with a clone-specific
primer.23This would provide the means for the broad application of analyzing disease-related clonal T cells in DNA
samples from patients with T-lymphoproliferative diseases
by sensitive PCR-based techniques. In mixing experiments
the lower detection limit for the detection of a fluorescent
clone-specific PCR product was as low as 1 Jurkat cell diluted in 10’ peripheral blood mononuclear cells in a single
35 cycle allele-specific PCR run with a Jurkat-specific DON-JP region primer and a Jurkat-specific VP (8.1)-primer
(data not shown). The extensive junctional and combinatorial
diversity favor the TCR-P gene as a target for detection of
MRD especially in T-NHL using PCR-mediated amplification techniques.
This technique has several advantages compared with conventional Southern analysis such as speed, safety, comfort,
low cost, and it requires no radionucleotides. Since fluorescent TCR-P-PCR products appearing as a relatively pure
monoallelic peak of fluorescence in the absence of significant
background side bands can be sequenced by direct cycle
sequencing without cloning, the method can also be used as
a first step in a sequencing strategy. The procedure will
significantly simplify current experimental approaches to detect and to quantitate malignant T cells during initial staging
and follow-up of NHL and ALL patients. It is anticipated
that this efficient and simple method of detecting monoclonal
rearranged TCR-fl genes and clonotypic TCR-P sequences
from DNA could have vast application in the study of T-
From www.bloodjournal.org by guest on February 6, 2015. For personal use only.
3936
KNEBA ET AL
NHL and ALL patients. Furthermore, this technique should
also be applicable for the analysis of PCR amplified TCRy. TCR-6, and IgH-CDR 3 regions.
REFERENCES
1. Leiden JM, Strominger JL: Generation of diversity of the P
chain of the human T-lymphocyte receptor for antigen. Proc Natl
Acad Sci USA 83:4456, 1986
2. Tillinghast JP, Behlke MA, Loh DY: Structure and diversity
of the human T-cell receptor 0-chain variable region genes. Science
2332379, 1986
3. Kimura N, Toyonaga B, Yoshikai Y, Triebel F, Debre P, Minden MD, Mak TW: Sequences and diversity of human T cell receptor
0 chain variable region genes. J Exp Med 164:739, 1986
4. Kimura N, Toyonaga B, Yoshikai Y, Du RP, Mak T W : Sequences and repertoire of the human T cell receptor a and 0 chain
variable region genes in thymocytes. Eur J Immunol 17:375, 1987
5. Concannon P, Pickering LA, Kung P, Hood L: Diversity and
structure of human T-cell receptor @chain variable region genes.
Proc Natl Acad Sci USA 83:6598, 1986
6. Doherty PJ, Roifman CM, Pan S, Cymerman U, Ho SWK,
Thompson E, Kamel-Reid S , Cohen A: Expression of the human T
cell receptor V0 repertoire. Mol Immunol 28:607, 1991
7. Ferradini L, Roman-Roman S, Azocar J, Michalaki H, Triebel
F, Hercend T: Studies on the human T cell receptor a/0 variable
region genes. 11. Identification of four additional VP subfamilies.
Eur J Immunol 21:935, 1991
8. Robinson MA: The human T cell receptor 8-chain gene complex contains at least 57 variable gene segments. J Immunol
146:4392, 1991
9. Toyonaga B, Yoshikai Y, Vadasz V, Chin B, MakTW: Organization and sequences of the diversity, joining and constant region
genes of thehuman T-cell receptor 0 chain. Proc NatlAcad Sci
USA 82:8624, 1985
10. Wei S, Charmley P, Robinson MA, Concannon P: The extent
of the human germline T-cell receptor V beta gene segment repertoire. Immunogenetics 40:27, 1994
11. Minden MD, Mak TW: The structure of the T cell antigen
receptor genes in normal and malignant T cells. Blood 68:327. 1986
12. Van Dongen JJM, Woivers-Tettero E M : Analysis of immunoglobulin and T cell receptor genes. 11. Possibilities and limitations
inthe diagnosis and management of lymphoproliferative diseases
and related disorders. Clin Chim Acta 198:93, 1991
13. Breit TM, Wolvers-Tetter0 ILM, Beishuizen A, Verhoeven
MAJ, van Wering ER, Dongen JM: Southern blot patterns, frequencies, and junctional diversity of T-cell receptor-&gene rearrangements in acute lymphoblastic leukemia. Blood 82:3063,1993
14. Hodges E, Edwards SE, Howell WM. Smith JL: Polymerase
chain reaction amplification analyses of clonality in T-cell malignancy including peripheral T-cell lymphoma. Leukemia 8:295, 1994
15. Bonati A, Zanelli P, Savi M,NeriTM: TCR-P chain gene
rearrangement and expression in human T-cell development and in
leukemia. Leukemia 8:918, 1994
16. Kneba M, Bolz I, Linke B, Bertram J, Rothaupt D, Hiddemann W: Characterization of clone-specific rearranged T-cell receptor y-chain genes in lymphomas and leukemias by the polymerase
chain reaction and DNA sequencing. Blood 84:574, 1994
17. McCarthy KP, Sloane JP, Kabarowski JHS, Matutes E, Wiedemann LM: The rapid detection of clonal T-cell proliferations in
patients with lymphoid disorders. Am J Pathol 138:821, 1991
18. Lessin SR, Rook AH, Rovera G: Molecular diagnosis of cutaneous T-cell lymphoma: Polymerase chain reaction amplification of
T-cell antigen receptor 0-chain gene rearrangements. J Inv Dermatol
96:299, 1991
19.DyerMJS: T-cell receptor blcy rearrangements in lymphoid
neoplasms. Blood 74:1073, 1989
20. Knowles DM: Immunophenotypic and immunogenotypic approaches usefulin distinguishing benignand malignant lymphoid
proliferations. Semin Oncol 20583, 1993
21.Dombret H, Loiseau P, Bones JC, Sigaux F: Unexpected
consistent involvement of V 0 gene segments in appropriate T-cell
receptor P gene rearrangements occurring in B-lineage acute lymphoblastic leukemias. Blood 80:2614, 1992
22. CavCH, Guidal C, Rohrlich P, Delfau MH, Broyart A, Lescoeur B, Rahimy C, Fenneteau 0, Monplaisir N. d’Auriol L, Elion
J, Vilmer E, Grandchamp B: Prospective monitoring and quantitation
of residual blasts in childhood acute lymphoblastic leukemia by
polymerase chain reaction study of 6 and y T-cell receptor genes.
Blood 83:1892, 1994
23. Macintyre EA, D’Auriol L, Duparc N, Leverger G, Galibert
F, Sigaux F: Use of oligonucleotide probes directed against T cell
antigen receptor gamma delta variable-(diversity)-joiningjunctional
sequences as a general method for detecting minimal residual disease
in acute lymphoblastic leukemias. J Clin Invest 86:2125, 1990
24. Potter MN, Cross NCP, Van Dongen JJM, Saglio G, Oakhill
A, Bartram CR, Goldman JM: Molecular evidence of minimal residual disease after treatment for leukaemia and lymphoma: An updated
meeting report and review. Leukemia 7:1302, 1993
25. Champagne E, Huchenq A, Sevin J, Casteran N, Rubin B:
An alternative method for T-cell receptor repertoire analysis: Clustering of human V-beta subfamilies selected in responses to staphylococcal enterotoxins B and E. Mol Immunol 305377, 1993
26. Rosenberg WMC, Moss PAH, Bell JI: Variation in human T
cell receptor Vp and JP repertoire: Analysis using anchor polymerase chain reaction. Eur J Immunol 22541, 1992
27. Broeren CPM, Verjans GM, Van Eden W, Kusters JG, Lenstra JA, Logtenberg T: Conserved nucleotide sequences at the 5’ end
of T cell receptor variable genes facilitate polymerase chain reaction
amplification. Eur J Immunol 21569, 1991
28. Obata F, Tsunoda M, Ito K, Ito I, Kaneko T, Pawelec G,
Kashiwagi N:A single universal primer for the T-cell receptor (TCR)
variable genes enables enzymatic amplification and direct sequencing of TCRP cDNA of various T-cell clones. Hum Immunol36: 163,
1993
29. Moonka D, Loh EY: A consensus primer to amplify both cy
and P chains of thehuman T cell receptor. J Immunol Methods
169:41, 1994
30. Chen PF, Platsoukas CD: Development of the non-palindromic adaptor polymerase chain reaction (NPA-PCR) for the amplification of alpha- and beta-chain T-cell receptor cDNAs. Scand J
Immunol 35539, 1992
3 1. Beers T, Du TL, Rickert M, Overturt P, Choi Y, Greenberg
SJ: Ex vivo clonotype primer-directed gene amplification to identify
malignant T cell repertoires. J Leukoc Biol 54:343, 1993
32. Kono DH, Baccala R, Balderas RS,Kovac SJ, Heald PW,
Edelson RL, Theofilopoulos AN: Application of a multiprobe RNase
protection assay and junctional sequences to define VD gene diversity in Sezary syndrome. Am J Pathol 140823, 1992
33. Weidmann E, Whiteside TL, Giorda R, Herberman RB,
Trucco M: The T-cell receptor VP gene usage in tumor-infiltrating
lymphocytes and blood of patients with hepatocellular carcinoma.
Cancer Res 52:5913, 1992
34. Kohsaka H, Taniguchi A, Chen PP, Ollier WER, Carson DA:
The expressed T cell receptor V gene repertoire of rheumatoid arthritis monzygotic twins: Rapid analysis by anchored polymerase chain
From www.bloodjournal.org by guest on February 6, 2015. For personal use only.
ANALYSIS OF REARRANGED TCRP GENES
reaction and enzyme-linked immunosorbent assay. Eur J Immunol
23:1895, 1993
35. Nitta T, Sat0 K, Okumura K, Steinman L: An analysis of Tcell receptor variable-region genes in tumor-infiltrating lymphocytes
within malignant tumors. Int J Cancer 49:545, 1991
36.Frkgeau CF, Fourney M:DNA typing with fluorescently
tagged short tandem repeats: A sensitive and accurate approach to
human identification. Biotechniques 15:100, 1993
37. Gorski J, Yassai M, Zhu X,Kissella B, Keever C, Flomenberg
N: Circulating T cell repertoire complexity in normal individuals
and bone marrow recipients analyzed by CDR3 size spectratyping.
J Immunol 1525109, 1994
38. Cottrez F, Auriault C, Capron A, Groux H: Analysis of the
Vg specificity of superantigen activation with a rapid and sensitive
3937
method using RT PCR and an automatic DNA analyser. J Immunol
Methods 172:85, 1994
39. Shiach CR, Evans PA, Short MA, Bailey CC, Lewis LT, Kinsey SE: Detection and accurate sizing of PCR product by automated
scanning: Improved detection of immunoglobulin gene rearrangement in ALL. Br J Haematol 85:431, 1993 (letter)
40. Stansfield AG, Diebold J, Noel H, Kapanci Y:Updated Kiel
classification for lymphomas. Lancet 1:292, 1988
41. Sambrook J, Fritsch EF, Maniatis T: Molecular cloning: A
laboratory manual. Cold Spring Harbor Laboratory, New York,
1989, p 1
42. Kneba M, Bergholz M, Bolz I, Hulpke M, Baetge R, Schauer
A, Krieger G: Heterogeneity of immunoglobulin gene rearrangements in B-cell lymphomas. Int J Cancer 45:609, 1990
From www.bloodjournal.org by guest on February 6, 2015. For personal use only.
1995 86: 3930-3937
Analysis of rearranged T-cell receptor beta-chain genes by
polymerase chain reaction (PCR) DNA sequencing and automated
high resolution PCR fragment analysis
M Kneba, I Bolz, B Linke and W Hiddemann
Updated information and services can be found at:
http://www.bloodjournal.org/content/86/10/3930.full.html
Articles on similar topics can be found in the following Blood collections
Information about reproducing this article in parts or in its entirety may be found online at:
http://www.bloodjournal.org/site/misc/rights.xhtml#repub_requests
Information about ordering reprints may be found online at:
http://www.bloodjournal.org/site/misc/rights.xhtml#reprints
Information about subscriptions and ASH membership may be found online at:
http://www.bloodjournal.org/site/subscriptions/index.xhtml
Blood (print ISSN 0006-4971, online ISSN 1528-0020), is published weekly by the American
Society of Hematology, 2021 L St, NW, Suite 900, Washington DC 20036.
Copyright 2011 by The American Society of Hematology; all rights reserved.


![Download [ PDF ] - journal of evolution of medical and dental sciences](http://s2.esdocs.com/store/data/000488959_1-4dca276881c4179da54bcce462126ef6-250x500.png)
© Copyright 2026