
COMPARISON OF LARGE AND MID
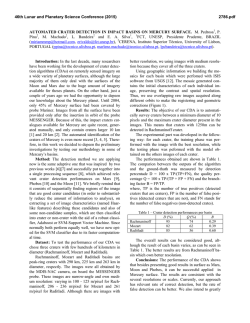
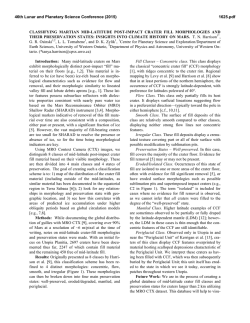
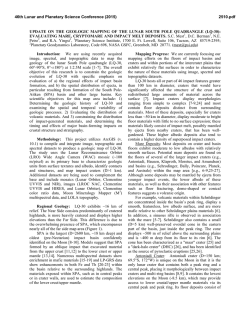
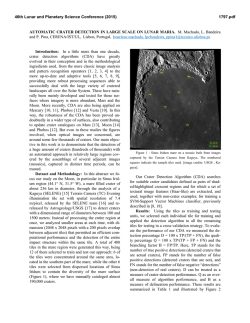
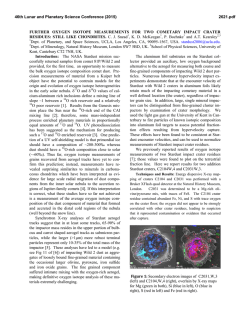
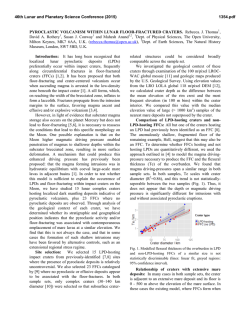
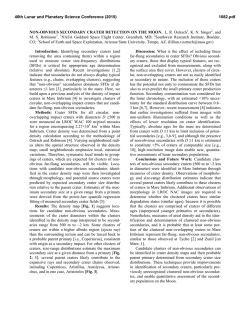
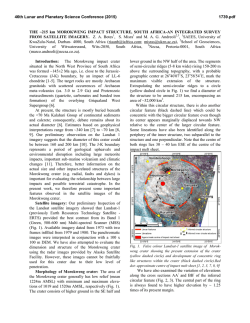
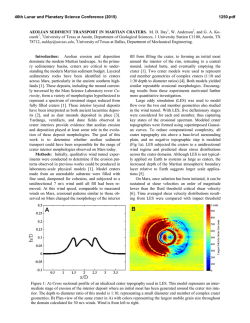
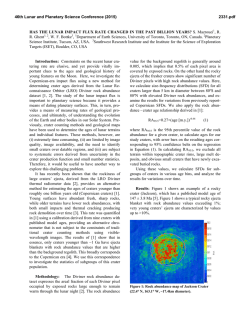
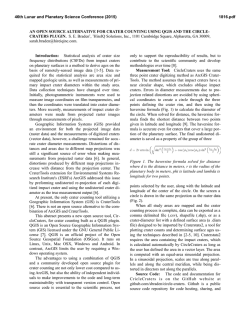
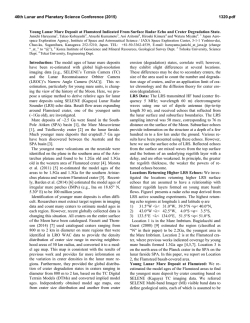
46th Lunar and Planetary Science Conference (2015)
2880.pdf
COMPARISON OF LARGE AND MID-SIZE LUNAR CRATER DISTRIBUTIONS. R. Z. Povilaitis1, M. S.
Robinson1, D. M. Nelson1, L. R. Ostrach1, C. H. van der Bogert2, and H. Hiesinger2, 1School of Earth and Space
Exploration, Arizona State University, Tempe, AZ 85287 ([email protected]), 2Institut für Planetologie, Westfälische Wilhelms-Universität, Münster, Germany.
Introduction: The rims of a total of 22,746 craters
5 to 20 km in diameter were digitized from a WAC
Lunar Reconnaissance Orbiter Camera (LROC) Wide
Angle Camera (WAC) mosaic and WAC stereo derived shaded relief maps. A global areal crater density
map was created from this crater database ([1] Fig. 1)
and compared to a ≥20 km diameter crater density map
produced from Lunar Orbiter Laser Altimeter data [2].
Subtracting the 5-20 km diameter density map from
the >20 km density map revealed several regions with
significant crater density differences.
Crater Counts: All craters between ~4 km and
~21 km in diameter (to ensure completeness) were
digitized at a scale between 1:250,000 and 1:500,000
in ArcGIS. Basemaps used included: 1) a 100 m/pixel
scale WAC monochrome (643 nm) mosaic with an
average solar incidence of 60°, and 2) a 100 m/pixel
LROC WAC Digital Elevation Model (GLD100 [3])
based shaded relief to help demarcate craters in shadowed regions at the poles and/or subdued craters. Craters outside the 5-20 km diameter range were not used
in the creation of the global crater density map.
Crater Density: We determined areal crater density for each diameter range (5-20 km and ≥20 km) independently using a moving neighborhood method
with a radius of 500 km and an output cell size of 15
km. Density magnitude values for each map were divided into 10 equal-interval bins and reclassified with
a ranking of 1 to 10 (1 being lowest density and 10
being highest). The resulting 5-20 km density map
(Fig. 1) was subtracted from the ≥20 km density map
to produce a crater density difference map (Fig. 2).
Output cell values of the difference map range from -4
to +5. Positive difference values represent a high density (red) of ≥20 km craters relative to 5-20 km craters,
and negative values represent low density (blue) of
≥20 km craters relative to 5-20 km craters.
Discussion: The crater density ratio map allows the
investigation of regional and global variations in the
densities of mid- to large-scale craters, which provide
information about both the ages and resurfacing history
of the Moon. The crater density map (Fig. 1) represents
a proxy for age, such that it can be used to separate
younger (blue) mare units from older (red) highlands
units, an aspect also noted by [2] for the density map
of ≥20 km diameter craters. Crater size-frequency distributions can be directly extracted for desired count
areas from the data set. The ratio of the two density
maps allows for the investigation of discrepancies be-
tween the two crater-size populations, which draws
attention to anomalous regions of interest for more
focused studies.
For example, the difference map shows a high density difference west of the Mare Australe region (50°S
to 70°S, 15°E to 45°E) with a value of +5 (Fig. 3) due
to an excess of larger craters relative to the 5-20 km
population. In addition, weaker small crater retention
due to topographic, regolith, and/or target property
effects may also have affected the smaller crater sizes
in this area (secondary effect). This +5 region encompasses an area of approximately 1.5x10⁵ km2 and is
surrounded by a roughly 6.4x10⁵ km2 positive (+4)
relative crater density region (40°S to 80°S, 16°W to
83°E). This area is composed of a variety of ancient
geologic units [5] and may be situated at sufficient
distance from large resurfacing events (Imbrium, Orientale, and Schrödinger basins) to have retained a larger population of >20 km diameter craters. If this hypothesis is correct, the difference maps elucidate the
efficiency of basin forming events to erase craters with
diameters greater than 20 km.
Two regions south of Mare Moscoviense exhibit a
negative crater density difference of -4 (Fig. 4). The
two regions (13°N to 28°N, 138°E to 145°E) and
(11°N to 24°N, 147°E to 157°E) encompass areas of
approximately 5.1x10⁴ km2 and 7.3x10⁴ km2, respectively. Two other negative crater density difference (4) regions east of Mare Moscoviense (10°N to 20°N,
164°E to 179°E) and (2°N to 17°N, 170°W to 159°W)
encompass areas of approximately 7.8x10⁴ km2 and
9.9x10⁴ km2, respectively. Previously unrecognized
secondaries [4] may have contributed to an overabundance of smaller craters in these four regions.
Outlook: We are currently studying the anomalous
regions in detail, by incorporating geological maps,
data from other studies, and new crater size-frequency
distribution measurements with corresponding absolute
model ages. These data will help support or refute the
proposed effects responsible for the greatest differences shown in the difference maps.
References: [1] R. Z. Povilaitis et al. (2013), NLSI
Lunar Science Forum [2] Head J.W. et al. (2010) Science 329, 1504-1507 [3] Scholten F. et al. (2012) JGR
117, E00H17 [4] McEwen A.S. and Bierhaus E.B.
(2006) Ann. Rev. Earth Planet. Sci. 34, 535–567 [5]
Wilhelms, D.E. et al (1979) USGS I-1162 Geologic
Map of the South Side of the Moon.
46th Lunar and Planetary Science Conference (2015)
2880.pdf
6 2 Figure 1. Crater density map generated from the measurement of 22,746 craters 5 to 20 km in diameter.
Figure 2. Density difference map (>20 km map minus the 5-20 km crater), allowing the comparion of the density of
large lunar craters [1], with that of mid-size craters shown in Fig. 1.
Figure 3. Anomalous high >20 km crater density
area west of Mare Australe.
Figure 4. Anomalous high 5-20 km crater density
area adjacent to Mare Moscoviense.
© Copyright 2026