
Analysis of landscape fragmentation processes and
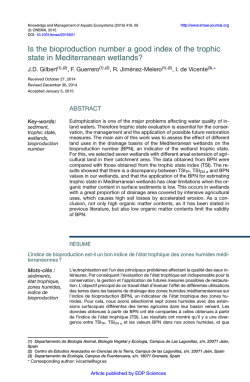
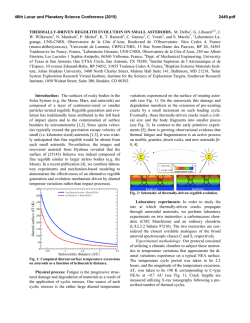
Ecological Indicators 46 (2014) 240–252
Contents lists available at ScienceDirect
Ecological Indicators
journal homepage: www.elsevier.com/locate/ecolind
Analysis of landscape fragmentation processes and driving forces in
wetlands in arid areas: A case study of the middle reaches of the Heihe
River, China
Penghui Jiang a,c , Liang Cheng a,b,c, *, Manchun Li a,b,c, **, Ruifeng Zhao d ,
Qiuhao Huang a,b,c
a
Jiangsu Provincial Key Laboratory of Geographic Information Science and Technology, Nanjing University, Nanjing, 210093, China
Collaborative Innovation Center for the South Sea Studies, Nanjing University, Nanjing 210093, China
c
Department of Geographic Information Science, Nanjing University, Nanjing 210093, China
d
College of Geography and Environment, Northwest Normal University, Lanzhou, Gansu Province 730070, China
b
A R T I C L E I N F O
A B S T R A C T
Article history:
Received 3 September 2013
Received in revised form 30 April 2014
Accepted 18 June 2014
Landscape fragmentation in wetlands usually implies degradation of its ecological functions. Landscape
fragmentation divides wetlands into isolated islands, which disturbs the energy flow and nutrient cycling
within the wetland. Research into the development and causes of landscape fragmentation in wetlands is
urgently needed for effective monitoring and protection of wetlands. We use a combination of techniques
including remote sensing, a landscape index model, and redundancy analysis to analyze landscape
fragmentation and its driving forces in the middle reaches of the Heihe River from both temporal and
spatial perspectives. A new mathematic morphological method that enhances the credibility of
landscape fragmentation analysis without changing the original pixel size of the interpreted data is
proposed for the calculation of landscape indices. The combination of this new mathematic
morphological method and traditional landscape pattern indices enhances the evaluation strategy for
landscape fragmentation. Our results demonstrate that the fragmentation processes that affect the
wetland landscape of the study area are primarily represented as the shrinking of core wetland area and
decrease in mean size of wetland patches. Our results also show an increase in the fragmentation index
(FS) of the landscape in recent decades. The impacts of natural factors on wetland landscape
fragmentation processes are typically reflected in changes in climate and hydrology. In the study area,
temperature, which is more important than precipitation in driving wetland landscape fragmentation
processes, cannot be omitted. In addition, our analysis proves that unnecessary human activity is a major
threat for sustainable development and maintenance of wetlands.
ã 2014 Elsevier Ltd. All rights reserved.
Keywords:
Wetlands
Fragmentation
Driving forces
Heihe River
Landscape indices
1. Introduction
Wetlands are unique ecosystems formed as a result of
interactions between the forces affecting land and water (Zhang
et al., 2010). As key parts of the global ecological system and carbon
pool, wetlands offer important ecological functions and effects that
cannot be replaced: they mitigate pollution, provide habitats for
wildlife, regulate climate, and preserve biodiversity, among other
* Corresponding autho at: Department of Geographic Information Science,
Nanjing University. Tel.: +86 25 83597359; fax: +86 25 83597359.
** Corresponding author at: Department of Geographic Information Science,
Nanjing University. Tel.: +86 25 83593660; fax: +86 25 83593660.
E-mail addresses: [email protected] (L. Cheng), [email protected]
(M. Li).
http://dx.doi.org/10.1016/j.ecolind.2014.06.026
1470-160X/ ã 2014 Elsevier Ltd. All rights reserved.
things (Mander and Mitsch, 2009, Copeland et al., 2010; Sulman
et al., 2013). However, the Organization of Economic Cooperation
and Development has estimated that approximately 50% of global
wetlands could have been lost since 1900, with the remainder
experiencing increased fragmentation in recent years (Lienert
et al., 2002; Erwin, 2008; Khaznadar et al., 2009; Zhang et al., 2010;
Wang et al., 2011). Similarly, incomplete statistics suggest that two
thirds of wetlands in France were lost during 1900–1993 (Westerberg et al., 2010). In general, climatic change accompanied by
increased disturbance caused by human activity has placed
wetlands at greater risk, particularly in arid zones (Zhao et al.,
2009). Wetlands in arid zones are key nodes and represent critical
areas in the landscape patterning that is crucial to the functioning
of arid environments; they also play a key role in providing water,
energy, and other resources to sustain human life (Zhou, 2005;
P. Jiang et al. / Ecological Indicators 46 (2014) 240–252
Mwakaje, 2009). However, owing to a lack of consideration of their
role in sustainable resource use, wetlands in arid areas continue to
fragment, resulting in decreased wetland biodiversity (Soomers
et al., 2013; Walz and Syrbe, 2013).
Wetland landscape fragmentation plays a major role in the
degradation of ecological systems (Liu et al., 2014) and the
reduction of wetland biodiversity; in particular, this fragmentation
results in complex spatial distributions of vegetation and reduced
functioning of wetlands (Alexandridis et al., 2009; Liu et al., 2009;
Song et al., 2012). As such, fragmentation can be considered as one
of the most significant expressions of wetland degradation and has
been recognized as a core component of landscape ecology and
landscape conservation because it affects cycles of material and
energy directly (Wiens, 1994; Cerian and Keys, 2009). As a key
factor exerting pressure on biodiversity, wetland fragmentation
also has a negative effect on the functioning of wetland ecosystems
(Opdam and Wascher, 2004). In most cases, fragmentation
represents the first step in the process of wetland degradation.
Accordingly, research into the processes underlying wetland
landscape fragmentation should improve our understanding of
typical wetland evolution and help advance techniques to protect
wetlands. The underlying processes and driving forces of wetland
landscapes are core research topics in current wetland science (Liu
et al., 2009).
The wetlands distributed along the middle reaches of the Heihe
River have great significance for the eco-environmental protection
of northwestern China. In particular, as the primary westward
route for migratory birds of China, the wetlands in the middle
reaches of the Heihe River also act as a staging point along the East
Asia–India section of the eight global migratory channels.
Additionally, these wetlands act as an environmental barrier that
prevents the southward invasion of the Badain Jaran desert and
play a key role in maintaining the ecosystem balance of the Heihe
River basin. However, the wetlands have been partially destroyed
by human activity and climate change in recent years, with
fragmentation and ecosystem degeneration of these wetlands
241
becoming increasingly pronounced over time. Such degeneration
has induced the southward expansion of the Badain Jaran desert,
exposing large expanses of grassland and oasis to the threat of
desertification, and endangering the survival and development of
the Heihe River basin. At worst, such changes could have a
profound influence on the ecological security of the Hexi Corridor
and northwestern China as a whole. Consequently, research into
the wetlands of the Heihe River basin is urgently required. Previous
studies of the Heihe River focused on various aspects of the
environment, including landscape evolution, hydrological change
and its ecological effects, water consumption, evapotranspiration,
vegetation cover, and carbon sequestration (Lu et al., 2003; Kang
et al., 2007; Kong et al., 2009; Wang et al., 2009; Zhao et al., 2010; Li
et al., 2012; Wang et al., 2012; Li et al., 2013). However, many
features of these wetlands remain unknown; in particular,
knowledge of landscape fragmentation in the region remains
insufficient (Li and Zhao, 2010).
Here, we adopt remote sensing (RS), geographical information
system (GIS), redundancy analysis (RDA), and techniques of
morphological image processing to explore the processes and
driving forces of wetland landscape fragmentation in the Heihe
River basin. The primary aims of this study are: (1) to characterize
the processes of wetland fragmentation in the middle reaches of
the Heihe River during 1975–2010 at the landscape and pixel
levels; and (2) to analyze the driving forces that promote wetland
landscape fragmentation, distinguishing between the effects of
human activity and natural environmental changes in the middle
reaches of the Heihe River.
2. Study area
The middle reaches of the Heihe River (98 570 –100 52 0 E,
38 390 –39 59 0 N) are located in the western part of Gansu Province,
northwestern China, spanning three counties (Ganzhou, Gaotai,
and Linze) and covering an area of 10,753 km2 (Fig. 1). The climate
of the region is characterized by cold winters, hot summers, and
Fig. 1. Location of the study area.
242
P. Jiang et al. / Ecological Indicators 46 (2014) 240–252
generally dry weather. The mean annual precipitation and
evaporation are 50–250 mm and 2000–3500 mm, respectively.
The terrain of the study area can be divided primarily into
mountain and plain areas and includes the Hexi Corridor plain and
the Qilian and Heli mountains that are located to the south and
north of the Heihe River, respectively. The study area lies at
altitudes of 1234–3633 m above sea level, with maximum altitudes
in the Qilian Mountains. As a result of human activity and the
presence of the Heihe River, cropland and forest cover much of the
piedmont alluvial fan and floodplain, with farmland, grassland,
and the Gobi desert constituting the primary land use types. The
vegetation in the middle reaches of the Heihe River consists
primarily of temperate shrubs and desert vegetation.
In recent decades, the social and economic landscapes of
Ganzhou, Gaotai, and Linze have changed considerably. Grain
output and the income of farmers have continued to rise, resulting
in corresponding increases in gross domestic product and the total
population of the study area (to 14.7 109 yuan and 82.55 104,
respectively, by 2010).
In the study area, wetlands are distributed mainly along the
Heihe River and occur as marshes, lakes, and bottomlands, among
others. Wetland flora and fauna such as Elsholtzia ciliata, Scirpus
validus, and the black stork occur extensively in these wetlands. To
protect these wetland resources and ensure that this unique
ecosystem is protected from disturbance by desertification or
climate change, the Chinese State Council established the Heihe
River Basin Nature Reserve in 2011. The reserve covers a total area
of 41,164.56 ha.
3. Materials and methods
3.1. Data sources and processing
We extracted all data relating to the wetlands in the middle
reaches of the Heihe River for the period from 1975 to 2010 from
remote sensing images (Table 1). We combined the extracted data
with land use/land cover data for the study area (acquired at a scale
of 1:100,000 for 1985; and 1996) obtained from the Chinese
Academy of Science (http://westdc.westgis.ac.cn/) and a topographic map at the 1:50,000 scale (obtained by a field study in
1972). The selection of yearly images was conducted based on
historical events (e.g., the initiation of reform and openness in the
1980s, the influx of western development in the 1990s), policy
changes (e.g., water diversion work in the middle reaches of the
Heihe River that began in 2001), and image availability. Conversely,
the selection of monthly images was conducted based on the
occurrence of major changes in vegetation, such as that in summer
and at the beginning of autumn.
Image processing was performed using EDRAS Imagine (version
9.2), and data preprocessing involved several steps, including
image adjustment, image enhancement, and image cutting.
Moreover, MSS (58 m), TM (30 m), and ETM+ (30 m) images were
resampled to a 60 m 60 m pixel size using the nearest-neighbor
resampling method. Then, the wetland areas were categorized into
rivers, lakes, marshes, bottomlands, reservoirs, and ponds based on
the China Wetland Classification System (Zhao et al., 2009) and the
Fig. 2. Distribution of wetlands in the middle reaches of the Heihe River in1975 and
2010.
landscape characteristics of the study area (Fig. 2). Five land use/
land cover types were also identified according to the classification
criteria of Liu et al. (2010).
The extraction of wetlands and other land use and land cover
information for 1975, 1987, and 1992 required the use of the
topographic map at scale 1:50,000 (produced in 1972) and land use
Table 1
Data sources of landscape information for the study area.
Year
Data source
Remote sensing image
1975
1987
1992
2001
2010
MSS
TM
TM
ETM+
ETM+
143/33, 1975.10.07; 145/32, 1975.10.09; 144/33, 1976.07.04
133/33,1987.08.15; 134/33, 1987.10.09; 134/32,1989.09.28
133/33, 1992.09.05; 134/33, 1992.08.27; 134/32, 1991.09.02
133/33, 1999.07.07; 134/33, 2001.07.03; 134/32, 2001.08.20
134/33, 2010.08.05; 133/33, 2010.08.14; 134/32, 2010.08.21
P. Jiang et al. / Ecological Indicators 46 (2014) 240–252
and land cover data from 1985 to 1996 acquired from the Chinese
Academy of Science (http://westdc.westgis.ac.cn/); all these
products have high accuracy. Therefore, the present study focuses
primarily on assessing the accuracy of the classification of the 2001
and 2010 data based on field surveys and high-resolution images.
We calculated the kappa coefficient as follows:
N
K¼
et al., 2011). MPS and PD were calculated using FRAGSTATS version
3.3 and ArcGIS version 9.3. FS1 and FS2 were calculated according to
Eqs. (2)–(4).
1
MSI
1
FS2 ¼ 1 ASI
FS1 ¼ 1 m
m
X
X
Pli ðPpi Pl i Þ
i¼1
i¼1
(1)
m
X
N ðPpi Pl i Þ
2
243
MSI ¼
(2)
N
X
SIðiÞ ¼ PðiÞ
ffiffiffiffiffiffiffiffi
SIðiÞ=N; p
4
AðiÞ
i¼1
(3)
i¼1
where K is the kappa coefficient, N is the total number of samples,
and Ppi and Pli are the total number of samples in the row and rank,
respectively, of a given land use/land cover type. Our results show
that the accuracies of the classified images for 2001 and 2010 are
84.06% and 81.18%, respectively (Table 2).
To increase our understanding of the dynamics of wetland
landscape fragmentation, we considered land use and land cover
change, socioeconomic development, hydrology, and climate
change in our analysis of the driving forces of fragmentation.
We adopted ten socioeconomic indices: gross domestic product,
primary industrial output, secondary industrial output, revenue,
expenditure, total population, grain yield, total investment, total
retail sales, and rural per capita net income. The data for these
indices were obtained from the 1984–2011 yearbooks from Gansu
Province, and we selected data from a 60-year period (1949–2008)
to illustrate the effects of socioeconomic development on wetland
fragmentation. Similarly, we used annual precipitation and annual
temperature data for 1967–2010 obtained from the China
Meteorological Data Sharing Service System (http://cdc.cma.gov.
cn/) to investigate the effects of climate change on fragmentation.
Finally, we used runoff data acquired from monitoring at the
Yingluoxia and Zhengyixia stations between 1956 and 2005 to
investigate the effects of changes in hydrology on wetland
landscape fragmentation.
3.2. Analysis
3.2.1. Fragmentation processes at landscape level
Landscape fragmentation studies typically adopt a selection of
landscape indices. In this study, we selected the mean patch size
(MPS), patch density (PD), mean patch shape fragmentation index
(FS1), and area-weighted mean shape fragmentation index (FS2) for
use in quantitative analysis of the processes involved in wetland
landscape fragmentation. Further details of these indices can be
found in previous studies (Lu et al., 2003; Zhao et al., 2009; Wang
ASI ¼
N
N
X
X
AðiÞSIðiÞ=A; A ¼
AðiÞ
i¼1
(4)
i¼1
Here, MSI is the mean shape index, ASI is the area-weighted
shape index, and SI (i), A (i), and P (i) are the shape index, area, and
perimeter, respectively, of patch i. SI (i) is typically calculated for a
square shape index; accordingly, the square patch shape index is 1
and other shape indices are greater than 1.
3.2.2. Fragmentation processes at pixel level
We developed four area indices using morphological image
processing to explore the process of wetland fragmentation. First,
two 3 3 SEs were defined according to the research of Vogt et al.
(2006) and Riitters et al. (2009). Then, four wetland types (Core,
Edge, Patch, and perforated wetlands) were obtained from the
binary images (Fig. 3). ‘Core wetland’ is the wetland that is
separated from non-wetlands by a buffer zone. Spatially, they are
generally expressed as wetlands with a large area and high
concentration. ‘Patch wetland’ refers to wetlands that are much
smaller than ‘core wetlands’ and they are surrounded by nonwetlands. ‘Edge wetlands’ and ‘perforated wetlands’ are the buffer
zones between ‘core wetlands’ and non-wetlands. ‘Perforated
wetlands’ are located in the interior of core wetlands and ‘edge
wetlands’ in the exterior. In most cases, increases in ‘patch wetland’
and ‘perforated wetland’ indicate an increase in fragmentation. The
specific steps undertaken for extraction of the different wetlands
from the binary image are as follows (Fig. 4):
Step 1: The extraction of core wetland: SE1 was used to perform
an operation of erosion on wetland pixels. If all the neighbors are
wetlands, we define the center pixel as the core wetland. The other
pixels are then taken to be different from core wetlands and nonwetlands and they are the patch, edge, and perforated wetlands,
which are distinguished by the following operations.
Step 2: The extraction of patch wetland: SE2 was used to
perform an operation of dilation on core wetlands. Since patch
Table 2
Error matrix for the interpretation of 2010/2001 data.
GPS
and google
earth samples
A1
A2
A3
A4
A5
A6
A7
A8
A9
A10
Total
Classification
A1
A2
A3
A4
A5
A6
A7
A8
A9
A10
Total
21/1
1/0
2/0
1/0
0
0
0
0
1/0
0
26/1
2/1
61/8
7/1
1/0
0
0
2/0
0
0
0
73/10
2/0
2/0
18/2
1/0
0
0
0
0
0
0
23/2
0
6/0
1/0
39/5
0
0
3/0
0
0
0
49/5
0/5
0
0
0
16/191
0
0
0
0
0
16/196
0
0
0
0
0
3/0
0
0
0
0
3/0
0
0
0
0
0
0
13/2
0
0
0
13/2
0
0
0
0
0
0
0
3/0
0
0
3/0
0
0
0
0
0
0
0
1/0
2/0
0
3/0
0
0
0
0
0
0
0
0
0
8/1
8/1
25/7
70/8
28/3
42/5
16/191
3/0
18/2
4/0
3/0
8/1
217
Notes: A1: farmland; A2: grassland; A3: forest; A4: desert; A5: construction; A6: river; A7: bottomland; A8: lake; A9: marsh; A10: reservoir and pond. The left number is the
sample number of 2010 and the right is the sample number of 2001.
244
P. Jiang et al. / Ecological Indicators 46 (2014) 240–252
wetland pixels are indirectly connected with the core wetland, we
applied a repeated dilation on core wetlands with SE2. Only when
all indirectly connected wetland pixels are identified can the
dilation be stopped.
Step 3: The extraction of edge wetland: In contrast to the
extraction of core and patch wetlands, edge wetlands were
identified by set non-wetland pixels to perform the dilation
operation.
Step 4: The extraction of perforated wetland: Since the core,
patch, and edge wetlands were subtracted, the remaining undefined wetland pixels were classified as perforated wetlands.
Fig. 3. Four classes of wetland patterns defined in this study.
3.2.3. Driving forces of wetland landscape fragmentation
The forces driving wetland landscape fragmentation can be
divided into two groups: factors related to human activity and
natural factors. We selected annual temperature and annual
precipitation as primary variables to investigate the effects of
natural factors on fragmentation based on the characteristics of the
study area. In addition, factors such as total population, rural per
capita net income, gross domestic product, primary industrial
output, secondary industrial output, total investment, total retail
sales, and grain yield, were chosen to explore the effects of
socioeconomic development on fragmentation. Then, we performed redundancy analysis (RDA) to calculate the cumulative
Fig. 4. Extraction process of the four classes of wetland patterns defined in this study.
P. Jiang et al. / Ecological Indicators 46 (2014) 240–252
contribution ratio of socioeconomic development and climate
change. In this manner, the effects of socioeconomic development
and natural variations on wetland landscape fragmentation could
be assessed quantitatively.
Furthermore, we conducted other, more qualitative, analyses to
derive the relationship between landscape fragmentation and
changes in hydrology and land use/cover, which are detailed in the
discussion section. In this manner, we identified and quantified the
effects of human activity and natural changes on wetland
landscape fragmentation.
4. Results
4.1. Fragmentation processes in wetland landscapes
4.1.1. Fragmentation processes at landscape level
Our results demonstrate that the MPS of the wetlands in the
study area decreased each year during 1975–2010 (Fig. 5a and b),
with particularly marked reductions during 1975–1987 and 2001–
2010 (reductions of 22.56% and 19.35%, respectively). Conversely,
PD, FS1, and FS2 in the study area increased considerably in recent
years, particularly during 1975–1987 and 1992–2010. PD increased
from 0.008 Ind/ha to 0.111 Ind/ha and from 0.012 Ind/ha to
0.014 Ind/ha during 1975–1987 and 1992–2010, respectively.
During these same intervals, FS1 increased from 0.565 to 0.575
and from 0.270 to 0.275, and FS2 increased from 0.524 to 0.556 and
from 0.269 to 0.276, respectively.
In general, the indices used here suggest increased fragmentation of the wetland landscape, particularly in the 1990s and 2000s.
The Ninth Five-Year Program was implemented during 1996–2000
and the Western Development Program and a water diversion
project in the middle reaches of the Heihe River were initiated in
245
2001. The resulting high-density human activity in the study area
likely resulted in accelerated fragmentation of the wetland
landscape; this fragmentation would have been exacerbated by
factors such as the expansion of farmland, excessive use of water
resources, and wetland reclamation. Therefore, our results suggest
that, even with different evolutionary pathways or components,
landscape fragmentation is the primary manifestation of landscape pattern changes in the study area and will likely persist over
relatively long periods.
4.1.2. Fragmentation processes at pixel level
The change in area of the core, patch, edge, and perforated
wetlands shows a significant process of fragmentation of the
wetland landscape in the past decades. The area of core wetlands
decreased by 42.54% from 1975 to 2010 (Fig. 5c, Fig. 5d).
Correspondingly, the proportion of its pixels in the total wetland
pixels reduced from 49.17% to 36.83% during 1975–2010
(Fig. 5d). Along with the reduction of core wetlands, edge
wetlands also decreased. However, the area of patch and
perforated wetlands increased by 586.8 ha and 34.20 ha, respectively (Fig. 5c). Thus, the core wetlands in the study area are
observed to have gradually fragmented into patch and perforated
wetlands.
Furthermore, we can directly observe that the spatial pattern
of wetlands in the Heihe River basin is characterized by
fragmentation. As Fig. 6 shows, core wetlands were the dominant
landscape in 1975. Patch and perforated wetlands were scattered
and only covered a small area in the wetland landscape. However,
in 2010, this situation had gradually changed. In this period, the
area of perforated wetlands had enlarged significantly and large
numbers of core wetlands had been replaced by patch and edge
wetlands.
Fig. 5. Landscape indices of wetlands in the middle reaches of the Heihe River.
246
P. Jiang et al. / Ecological Indicators 46 (2014) 240–252
Fig. 6. Spatial distribution of the four classes of wetland patterns in five periods from 1975 to 2010.
4.2. Driving forces of wetland landscape fragmentation
When performing RDA analysis, landscape indices, such as FS1,
FS2, MPS, PD, and area of core, patch, edge, and perforated wetlands,
were selected as dependent variables, and factors reflecting
socioeconomic and natural change were selected as independent
variables (Fig. 7). Prior to the RDA analysis, a significant test (Monte
Carol Permutation Tests, Number of permutation: 499) for each
variable was performed to primarily screen the important factors.
As the results in Table 3 show, the PIO (primary industrial output), T
(annual temperature) and GDP (gross domestic product) passed the
hypothetical testing under the 0.05 significance level. Therefore,
only the PIO, T, and GDP were selected for the RDA analysis.
According to the results of RDA analysis, the first three
eigenvalues reported above are canonical and the fourth is not
since only three independent constraints can be formed from the
environmental variables. As Table 4 and Table 5 show, the
cumulative percentage variance of species data and speciesenvironment relations are high, at 84.6% and 100%, in the first three
axes. This demonstrates that the environmental variables we
selected interpret the process of wetland landscape fragmentation
appropriately. Based on the angles between the landscape indices
and environmental variables, we found that the PIO and GDP have a
significant positive correlation with PD and perforated wetlands,
but a significant negative correlation with MPS and core wetlands
(Fig. 8). Furthermore, T also has a significant positive correlation
with FS1, FS2, PD, and patch wetlands, but a significant negative
correlation with MPS and core and edge wetlands. Moreover, T-test
results for the influence of T, PIO, and GDP on the landscape indices
of wetlands also show that FS2 and patch wetlands have a
significant positive correlation with T, PIO, and GDP (Fig. 8).
However, it is obvious that PIO and GDP contribute more to
wetland landscape fragmentation than T according to the length of
the arrow. This further demonstrates that human activities are the
most important driving forces in our study area as compared with
natural changes.
5. Discussion
5.1. Extraction of wetland information
Accurate extraction of wetland information is the most critical
step in the analysis of long time series of wetland landscapes
P. Jiang et al. / Ecological Indicators 46 (2014) 240–252
247
Fig. 7. Changes of the environmental variables selected in this study for different periods.
(Wang et al., 2011). However, in the present study, the selected
landscape pattern indices were all calculated from data obtained
from remote sensing images; this technique often results in
considerable errors relating to incorrect classification during the
calculation of landscape pattern indices (Langford et al., 2006).
Using the topographic maps and land use data described above,
we were able to extract precise wetland information for 1975, 1987,
and 1992. Therefore, we considered only the accuracy of
information extracted for 2001 and 2010 explicitly in the present
study, placing more importance on the collection of historical atlas
data, high-resolution Google Earth images, and field survey data
for these periods. Moreover, wetlands can be distinguished more
easily than other land cover types in arid regions on TM and ETM+
images, and the primary error in our technique arises from
classification. However, by selecting different band combinations
and collecting data from different channels, we were able to
confirm the high quality of our results through accuracy
assessment.
5.2. High-density human activity as a primary cause of wetland
landscape fragmentation
The relationship between wetland landscape pattern evolution
and human activity is currently the subject of considerable debate
in the field of landscape ecology. Many previous studies have
posited that high-density human activity is the primary factor
controlling the evolution of wetland landscape pattern (Khaznadar
et al., 2009; Li and Zhao, 2010; He et al., 2011; Song et al., 2012).
Based on our results, we believe this to be the case in the middle
reaches of the Heihe River.
Known for their oasis agriculture, reclaimed wetlands (Fig. 9b)
have long been considered an important means by which to
increase available arable land (Table 6). During recent decades,
5410.82 ha of wetland has been transferred into farmland
(Table 6). Moreover, agricultural activities such as flood irrigation
and application of insecticide and chemical fertilizers can also
damage wetland ecosystems and alter their pattern. Statistical
data have shown that agriculture accounts for 95% of the total
consumption in the study area (Wang et al., 2009), although
various forms of construction engineering (such as artificial sand
excavation; Fig. 9a), the Binhe New Zone, and the Second Railway
between Lanzhou and Urumqi in Ganzhou, are likely to place
additional stress on the wetland landscape as the economy of the
region develops further. Throughout the study period, 434.24 ha
of wetlands were developed for construction and used as
residential land (Table 6); as the population in the study areas
continues to increase, yet more land will be required to meet
demand.
Table 3
P-value and F-value of the environmental variables
P
F
GY
TRS
PIO
GDP
T
SIO
RPCIN
TI
TP
P
0.068
2.816
0.052
2.784
0.042a
2.767
0.044a
2.748
0.044a
2.722
0.058
2.699
0.060
2.698
0.076
2.607
0.080
2.536
0.898
0.440
Notes: GY (grain yield), TRS (total retail sales), PIO (primary industrial output), GDP (gross domestic product), T (annual temperature), SIO (secondary industrial output),
RPCIN (rural per capita net income), TI (total investment), TP (total population), P (annual precipitation).
a
P < 0.05.
248
P. Jiang et al. / Ecological Indicators 46 (2014) 240–252
Table 4
Correlation matrix between axes and environmental variables.
Table 5
Summary of the results of the redundancy analysis (RDA).
1. Correlations between axis and environmental variables
SPEC
AX1
SPEC
AX2
SPEC
AX3
SPEC
AX4
ENVI
AX1
ENVI
AX2
ENVI
AX3
ENVI
AX4
PIO
GDP
T
SPEC
AX3
SPEC
AX4
ENVI
AX1
ENVI
AX2
Axes
SPEC
AX1
1.00
SPEC
AX2
ENVI
AX3
ENVI
AX4
0.07
1.00
0.19
0.19
1.00
0.26
0.27
0.72
1.00
0.96
0.00
0.00
0.00
1.00
0.00
0.96
0.00
0.00
0.00
1.00
0.00
0.00
0.69
0.00
0.00
0.00
1.00
0.00
0.00
0.00
0.00
0.00
0.00
0.00
0.00
0.87
0.87
0.90
0.41
0.39
0.04
0.04
0.09
0.26
0.00
0.00
0.00
0.90
0.90
0.93
0.43
0.41
0.05
0.05
0.14
0.37
0.00
0.00
0.00
PIO
1
0.99
0.84
GDP
T
1
0.81
1
2
0.538
0.965
3
0.227
0.964
4
0.081
0.694
Total
variance
0.154 1.000
0.000
53.8
76.5
84.6
100.0
63.6
90.4
100.0
0.0
1.000
0.846
Notes: The first three eigenvalues reported above are canonical and the fourth is not
since only three independent constraints can be formed from the environmental
variables.
2. Correlations between environmental variables
PIO
GDP
T
Eigenvalues
Species-environment
correlations
Cumulative percentage
variance of species data (%)
Cumulative percentage
variance of speciesenvironment relation (%)
Sum of all eigenvalues
Sum of all canonical
eigenvalues
1
Notes : GY (grain yield), TRS (total retail sales), PIO (primary industrial output), GDP
(gross domestic product), T (annual temperature), SIO (secondary industrial
output), RPCIN (rural per capita net income), TI (total invest), TP (total population),
P (annual precipitation).
5.3. Land use/land cover change and wetland fragmentation
Land use and land cover changes are closely linked to
socioeconomic development (Wang et al., 2011). In fact, in most
cases, such changes are the most appropriate proxies for human
activity, and they have been shown to have a significant influence
on all aspects of river ecosystems (Strayer et al., 2003).
In the middle reaches of the Heihe River, land use and land
cover changes play a key role in driving wetland landscape
fragmentation. Our results demonstrate an overall loss of
11,536.99 ha of wetlands (Table 6), which appears to have been
converted primarily to farmland, desert, or grassland. In particular,
during 1975–2010, about 5410.82 ha of wetlands were converted
into farmland; this transition represents 46.89% of the total
wetland loss and is likely due primarily to the well-known
historical development of agriculture in the study area. The
concept of farmland as a source of wealth is well established in the
region, and wetlands are widely known to offer the greatest
potential for cultivation owing to their fertile soils. Therefore, it is
logical that wetlands were extensively cultivated. This cultivation
resulted in the division of the wetlands into ever smaller patches,
eventually resulting in fragmentation.
Despite the extensive transition from wetland to farmland,
considerable amounts of wetland also transitioned to grassland
and desert. According to our transition matrix (Table 6), approximately 3498.16 ha and 2028.16 ha of wetlands transitioned into
grassland and desert, respectively, and was likely caused by overexploitation of groundwater resources and water diversion in the
middle reaches of the Heihe River. Previous studies have shown
that the groundwater recharge rate decreased by 2.168 108 m3/a
during the 1970s and 1980s, whereas the amount of groundwater
storage decreased by 0.545 108 m3/a since 1986 (Wang et al.,
2005). The water surplus also tended to decrease, in particular,
since the implementation of the water diversion policy in 2001.
Ignorance of the dwindling water helped increase the farmland
area in the study area by 7798.14 ha during 1975–2010. Accordingly, increasingly small amounts of water were available for the
wetlands, causing those without adequate water to degenerate and
be replaced by desert or grassland. Accordingly, wetlands with a
sufficient water supply have formed vegetation mosaics within
grassland and desert landscapes.
5.4. Key of water diversion in the middle reaches of the Heihe River in
wetland fragmentation during 2001–2010
Water is a critical factor controlling the formation and
development of wetland vegetation and soil, particularly in arid
environments (Kong et al., 2009). Accordingly, in most cases,
changes in hydrology have direct effects on the energy cycle and
material flow in wetland systems; such systems are particularly
sensitive to hydrological changes such as variations in the quantity
and quality of their water sources (Wang et al., 2011).
Water diversion (Fig. 7f) in the middle reaches of the Heihe
River was initiated in 2001 and was directly responsible for the
decrease in the water surplus during 2001–2010 (Table 7). This
water diversion also had a profound effect on the processes
involved in the maintenance of the wetland landscape pattern.
Wetlands are particularly sensitive to changes in water supply; in
our study area, such changes affected the productivity of aquatic
plants and animals and disrupted the regional water balance. Our
results show that these intervals with decreased water availability
coincided with periods of obvious landscape fragmentation. For
example, the water surplus during 1975–1987 was less than that at
any other time, and FS1 and FS2 for wetlands as a whole increased
from 0.565 to 0.575 and from 0.270 to 0.275 (Fig. 5), respectively,
during this period. Similarly, the water surplus in 2001–2005 was
only 6.50 108 m3 (Table 7) owing to the influence of water
diversion; this period of low surplus corresponded to decreases in
MPS (19.35%) and PD (from 0.012 Ind/ha to 0.015 Ind/ha) but
increases in FS1 and FS2 (from 0.272 to 0.276 and from 0.539 to
0.556, respectively) (Fig. 5). Thus, our results demonstrate a direct
relationship between hydrology and wetland landscape fragmentation.
Water demand in the region will continue to increase with
increases in industrialization and urbanization, resulting in tension
as competition grows for the available resources. Such human
intervention has altered the hydrological cycle in the wetland
ecosystem, reducing the supply of water from upstream and
endangering the balance between supply and demand and
disrupting the wetlands in the middle reaches of the Heihe River.
Moreover, because the area requiring irrigation in the study area
P. Jiang et al. / Ecological Indicators 46 (2014) 240–252
249
Fig. 8. T-test results for GDP (a), PIO (b), and T (c) influencing landscape indices (red circle means negative correlation and grey circle means positive correlation); Redundancy
analysis results for landscape indices and environmental variables (d).
has been maintained since the water diversion, farmers have
begun to develop groundwater resources to meet irrigation needs
(Table 8), resulting in reductions in exploitable groundwater and
overall groundwater level described above (Wei et al., 2007).
Groundwater flow has a considerable influence on the chemical
properties of groundwater in the aquifer that feeds the study area,
and it has been shown that river water is preferable for irrigation
(Qin et al., 2011). Therefore, high-density exploitation of the
groundwater will likely induce soil salinization without maximizing the potential of the regional water balance and may have a
considerable negative effect on plant life and soil characteristics.
Accordingly, we believe that decreasing groundwater levels may be
primarily responsible for the degradation of wetland landscape
patterning and that the wetlands in the middle reaches of the
Heihe River will continue to fragment and even disappear without
intervention.
5.5. Effects of climate change on wetlands
Climate is the primary factor controlling the dynamics of
wetland formation and material exchange (Sutula et al., 2003),
and the influence of climate change on wetlands is expressed
primarily through changes in precipitation and temperature,
which determine wetland plant physiology (Dawson et al., 2003).
Accordingly, changes in precipitation and temperature can induce
changes in wetland hydrology (Milzow et al., 2010), causing
wetlands to expand or contract. Furthermore, as previous studies
have shown, temperature is the most fundamental factor
controlling the dynamics of wetland landscape patterning (Song
et al., 2012).
Wetland systems are particularly vulnerable to changes in
climate and water supply, particularly in arid regions, where such
changes threaten the continued existence of wetlands. In particular, climate change often affects the landscape pattern of wetlands
through its effects on wetland hydrology, and fluctuations in
precipitation or temperature are known to affect water availability
and stream flow (Dawson et al., 2003).
Throughout our study period, a significant increase in
temperature and fluctuations in precipitation occurred in the
middle reaches of the Heihe River: temperature increased from
7.53 C to 8.72 C in recent decades, whereas precipitation
decreased from 121.78 mm to 118.74 mm between 1992–2001
and 2001–2010 (Fig. 7e). Generally speaking, the region has
250
P. Jiang et al. / Ecological Indicators 46 (2014) 240–252
Fig. 9. Wetland degradation resulting from (a–c) human activity and (d) climate change.
Table 6
Transition matrix of land use during 19752010 (units: ha)
2010
1975
Construction land
Desert
Forest
Grassland
Farmland
Wetland
Total
Construction land
Desert
Forest
Grassland
Farmland
Wetland
Total
15387.40
1951.64
112.14
632.58
2839.37
434.24
21357.37
0.58
624650.00
1174.38
16931.70
1445.90
2028.16
646230.72
24.52
3749.15
11952.40
2588.06
391.13
165.62
18870.87
35.14
14577.80
2140.37
128635.00
2593.61
3498.16
151480.08
608.38
18284.10
4155.81
39704.00
144148.00
5410.82
212311.11
51.61
1593.02
62.08
1736.47
528.13
21118.60
25089.92
16107.63
664805.71
19597.18
190227.81
151946.14
32655.59
1,075,340.06
become warmer and drier, and the wetlands have exhibited some
evidence of fragmentation in response to these changes.
5.6. Recommendations for wetland protection
Wetlands in the middle reaches of the Heihe River are crucial
factors for the sustainable development of the area and its
surroundings. However, landscape fragmentation has caused these
wetlands to shrink and even disappear. It can be predicted that
these wetlands will vanish in the near future if measures are not
taken to protect them. Therefore, measures to protect wetlands
from fragmentation are urgently needed.
Table 7
Mean surplus of water during different time periods ( 108 m3).
1975–1987
1987–1992
1992–2001
2001–2005
5.61
7.23
8.01
6.50
Notes: Water surplus = influx from Yingluoxia valley outflow from Zhengyixia
valley.
First,a general investigation of the wetland resource should be
carried out to monitor its dynamic changes. Satellite remote
sensing technology, GIS technology, and field investigation, among
other techniques, can be used for real time analysis of the process
of landscape pattern change in the wetland from spatial and
temporal perspectives. In this manner, we can protect the wetland
resources from being fragmented. In addition, these investigations
can contribute to the scientific management and rational use of
wetland resources.
Second, artificial restoration measures need to be undertaken to
restore fragmented wetlands. In wetland reserves, any reclamation
of wetland must be forbidden and the reclaimed wetlands should
be returned. The water diversion that began in 2001 has caused the
wetlands in the study area to face the threat of a lack of water
supply and, therefore, the critical artificial restoration measure is
to guarantee sufficient ecological water supply. Thus, it is
necessary to undertake ecological water transport projects during
the period of water diversion or in arid times. Water supply
engineering, such as water diversion works and impounded water
projects, can also be undertaken to ensure sufficient water supply
to wetlands.
P. Jiang et al. / Ecological Indicators 46 (2014) 240–252
251
Table 8
Changes in groundwater in the middle reaches of the Heihe River during 2001–2005 (based on Wei et al. (2007)).
County
Study area
(north–south east–west, km2)
Mean change in groundwater level
(m)
Change in groundwater storage
(108 m3)
Ganzhou
Linze
Gaotai
43.40 39.10
43.23 25.68
27.72 44.66
2.68
1.55
1.30
4.90
1.72
1.61
Laws for the protection of wetlands must be enacted and
improved in a timely manner in order for wetlands to come under
the unfailing aegis of law.
6. Conclusions
The results of our study show that the indices we chose reveal
the process of landscape fragmentation in wetlands at landscape
and pixel levels well. A new mathematic morphological method
was proposed for the calculation of four indices. Compared with
the landscape pattern index, the indices based on this new method
can better support the analysis of landscape fragmentation
without changing the original pixel size of the interpreted data;
this enhances the credibility of the analysis. In addition, this new
method is useful for researchers to evaluate landscape fragmentation not only for wetlands but also for forests, farmlands, and other
land types.
Redundancy analysis was performed to analyze the driving
forces of landscape fragmentation in wetlands. In addition,
qualitative analyses were also performed to explore the effects
of changes in hydrology and land use/cover on the landscape
fragmentation in wetlands. By combining quantitative analysis
with qualitative analysis, we were able to comprehensively analyze
the cause of the landscape fragmentation in the wetlands in our
study area. The results show that PIO (primary industrial output), T
(annual temperature), and GDP (gross domestic product) were the
major factors causing wetland fragmentation in our study area. Our
results indirectly show that human activities are not the sole
reason for landscape fragmentation of wetlands in arid zones.
Natural changes, such as increases in temperature, also play a key
role and cannot be ignored. In addition, the driving forces analysis
that we propose in this study provides a reference for related
studies.
Acknowledgments
This work is supported by the National Natural Science
Foundation of China (Grant No. 41371017, 41001238), the National
Key Technology R&D Program of China (Grant No. 2012BAH28B02).
Sincere thanks are given for the comments and contributions of
anonymous reviewers and members of the editorial team.
References
Alexandridis, T.K., Lazaridou, E., Tsirika, A., Zalidis, G.C., 2009. Using earth
observation to update a Natura 2000 habitat map for a wetland in Greece. J.
Environ. Manage. 90, 2243–2251.
Cerian Gibbes, J.S., Keys, E., 2009. Wetland conservation: change and fragmentation
in Trinidad's prtected areas. Geoforum 40, 91–104.
Copeland, H.E., Tessman, S.A., Girvetz, E.H., Roberts, L., Enquist, C., Orabona, A., Patla,
S., Kiesecker, J., 2010. A geospatial assessment on the distribution, condition,
and vulnerability of Wyoming's wetlands. Ecol. Indic. 10, 869–879.
Dawson, T.P., Berry, P.M., Kampa, E., 2003. Climate change impacts on freshwater
wetland habitats. J. Nat. Conserv. 11, 25–30.
Erwin, K.L., 2008. Wetlands and global climate change: the role of wetland
restoration in a changing world. Wetl. Ecol. Manage 17, 71–84.
He, X.H., Gao, Y.J., Niu, J.X., Zhao, Y.F., 2011. Landscape pattern changes under the
impacts of urbanization in the yellow river wetland—king Zhengzhou as an
example. Procedia Environ. Sci. 10, 2165–2169.
Kang, E., Lu, L., Xu, Z., 2007. Vegetation and carbon sequestration and their relation
to water resources in an inland river basin of Northwest China. J. Environ.
Manage. 85, 702–710.
Khaznadar, M., Vogiatzakis, I.N., Griffiths, G.H., 2009. Land degradation and
vegetation distribution in Chott El Beida wetland, Algeria. J. Arid. Environ. 73,
369–377.
Kong, W., Sun, J., Xu, W., Chen, Y., 2009. Changes in vegetation and landscape
patterns with altered river water-flow in arid West China. J. Arid Environ. 73,
306–313.
Langford, W., Gergel, S., Dietterich, T., Cohen, W., 2006. Map misclassification can
cause large errors in landscape pattern indices: examples from habitat
fragmentation. Ecosystems 9, 474–488.
Li, S.B., Zhao, W.Z., 2010. Landscape pattern changes of desert oasis wetlands in the
middle reach of the Heihe River, China. Arid. Land Res. Manage. 24, 253–262.
Li, X.M., Lu, L., Yang, W.F., Cheng, G.D., 2012. Estimation of evapotranspiration in an
arid region by remote sensing—A case study in the middle reaches of the Heihe
River Basin. Int. J. Appl. Earth Obs. Geoinf. 17, 85–93.
Li, X.Q., Gan, Y.Q., Zhou, A.G., Liu, Y.D., Wang, D., 2013. Hydrological controls on the
sources of dissolved sulfate in the Heihe River, a large inland river in the arid
northwestern China, inferred from S and O isotopes. Appl. Geochem. 35, 99–
109.
Lienert, J., Diemer, M., Schmid, B., 2002. Effects of habitat fragmentation on
population structure and fitness components of the wetland specialist Swertia
perennis L. (Gentianaceae). Basic Appl. Ecol. 3, 101–114.
Liu, H.Y., Li, F., Cao, X., Hao, F., Hu, N., N, Zheng., 2009. The Current Problems and
Perspectives of Landscape Research of Wetlands in China. Acta. Geogr. Sin. 64,
1394–1401 (in Chinese).
Liu, J.Y., Zhang, Z.X., Xu, X.L., Kuang, W.H., Zhou, W.C., Zhang, S.W., Li, R.D., Yan, C.Z.,
Yu, D.S., Wu, S.X., Jiang, N., 2010. Spatial patterns and driving forces of land use
change in China during the early 21st century. J. Geogr. Sci. 20, 483–494.
Liu, S., Dong, Y., Deng, L., Liu, Q., Zhao, H., Dong, S., 2014. Forest fragmentation and
landscape connectivity change associated with road network extension and city
expansion: a case study in the Lancang River Valley. Ecol. Indic. 36, 160–168.
Lu, L., Li, X., Cheng, G.D., 2003. Landscape evolution in the middle Heihe River Basin
of north-west China during the last decade. J. Arid. Environ. 53, 395–408.
Mander, Ü., Mitsch, J., 2009. Pollution control by wetlands. Ecol. Eng. 35, 153–158.
Milzow, C., Burg, V., Kinzelbach, W., 2010. Estimating future ecoregion distributions
within the Okavango Delta Wetlands based on hydrological simulations and
future climate and development scenarios. J. Hydrol. 381, 89–100.
Mwakaje, A.G., 2009. Wetlands, livelihoods and sustainability in Tanzania. Afr. J.
Ecol. 47, 179–184.
Opdam, P., Wascher, D., 2004. Climate change meets habitat fragmentation: linking
landscape and biogeographical scale levels in research and conservation. Biol.
Conserv. 117, 285–297.
Qin, D.J., Qian, Y.P., Han, L.F., Wang, Z.M., Li, C., Zhao, Z.F., 2011. Assessing impact of
irrigation water on groundwater recharge and quality in arid environment using
CFCs, tritium and stable isotopes, in the Zhangye Basin, Northwest China. J.
Hydrol. 405, 194–208.
Riitters, K., Vogt, P., Soille, P., Estreguil, C., 2009. Landscape patterns from
mathematical morphology on maps with contagion. Landsc. Ecol. 24, 699–709.
Song, K.S., Wang, Z.M., Li, L., Tedesco, L., Li, F., Jin, C., Du, J., 2012. Wetlands shrinkage,
fragmentation and their links to agriculture in the Muleng-Xingkai Plain, China.
J. Environ.Manage. 111, 120–132.
Soomers, H., Karssenberg, D., Soons, M., Verweij, P., Verhoeven, J.A., Wassen, M.,
2013. Wind and water dispersal of wetland plants across fragmented
landscapes. Ecosystems 16, 434–451.
Strayer, D.L., Beighley, R.E., Thompson, L.C., Brooks, S., Nilsson, C., Pinay, G., Naiman,
R.J., 2003. Effects of land cover on stream ecosystems: roles of empirical models
and scaling issues. Ecosystems 6, 407–423.
Sulman, B., Desai, A., Mladenoff, D., 2013. Modeling soil and biomass carbon
responses to declining water table in a wetland-rich landscape. Ecosystems 16,
491–507.
Sutula, M.A., Perez, B.C., Reyes, E., Childers, D.L., Davis, S., Day, J.W., Rudnick, D., Sklar,
F., 2003. Factors affecting spatial and temporal variability in material exchange
between the Southern Everglades wetlands and Florida Bay (USA). Estuar.,
Coast. Shelf Sci. 57, 757–781.
Vogt, P., Riitters, K.H., Estreguil, C., Kozak, J., Wade, T.G., Wickham, J.D., 2006.
Mapping spatial patterns with morphological image processing. Landsc. Ecol.
22, 171–177.
Walz, U., Syrbe, R.-U., 2013. Linking landscape structure and biodiversity. Ecol. Indic.
31, 1–5.
Wang, G.X., Yang, Y.L., Chen, L., Jumpei, K., 2005. Impacts of land use changes on
groundwater resources in the Heihe River Basin. Acta. Geogr. Sin. 60, 456–466
(in Chinese).
252
P. Jiang et al. / Ecological Indicators 46 (2014) 240–252
Wang, X.F., Ma, M.G., Huang, G.H., Veroustraete, F., Zhang, Z.H., Song, Y., Tan, J.L.,
2012. Vegetation primary production estimation at maize and alpine meadow
over the Heihe River Basin, China. Int. J. Appl. Earth Obs. Geoinf. 17, 94–101.
Wang, Y., Xiao, L., F, Lu., 2009. Analysis of water consumption using a regional input–
output model: model development and application to Zhangye City,
Northwestern China. J. Arid. Environ. 73, 894–900.
Wang, Z.M., Huang, N., Luo, L., Li, X.Y., Ren, C.Y., Song, K.S., Chen, J.M., 2011. Shrinkage
and fragmentation of marshes in the West Songnen Plain, China, from 1954 to
and its possible causes. Int. J. Appl. Earth Obs. Geoinf. 13, 477–486.
Wei, Z., Jin, H.J., Nan, Y.C., Yang, S.Z., Wu, J.K., Wang, S.Z., 2007. The effect on water
environment in middle and downstream area of Heihe River after water
allocation. J. Irrig. Drain. 26, 34–37 (in Chinese).
Westerberg, V.H., Lifran, R., Olsen, S.B., 2010. To restore or not? A valuation of social
and ecological functions of the Marais des Baux wetland in Southern France
Ecol. Econ. 69, 2383–2393.
Wiens, J.A., 1994. Habitat fragmentation island landscape perspectives on bird
conservation. Ibis 137, S97–S104.
Zhao, R.F., Chen, Y.N., Zhou, H.R., Li, Y.Q., Qian, Y.B., Zhang, L.H., 2009. Assessment of
wetland fragmentation in the Tarim River basin, western China. Environ. Geol.
57, 455–464.
Zhao, W.Z., Liu, B., Zhang, Z.H., 2010. Water requirements of maize in the middle
Heihe River basin, China. Agric. Water Manage. 97, 215–223.
Zhou, H.R., 2005. Prospect on Multifunctional Landscapes of Marshes in Arid Areas.
Arid. Land Geogr. 16–20 (in Chinese).


© Copyright 2026