
A NEW ENCELADUS BASE MAP AND GLOBAL CONTROL
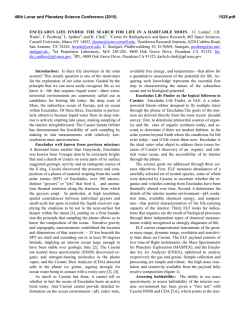
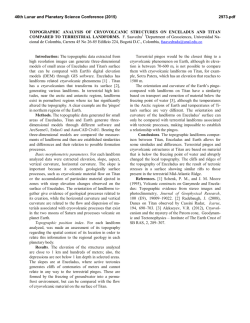
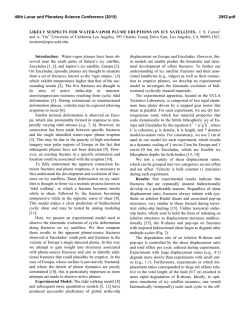
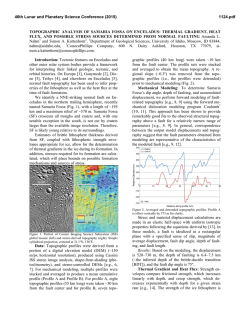
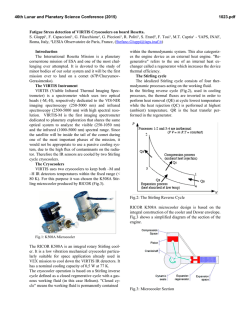
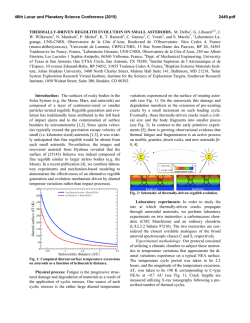
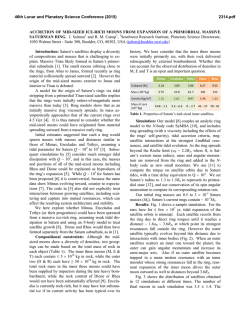
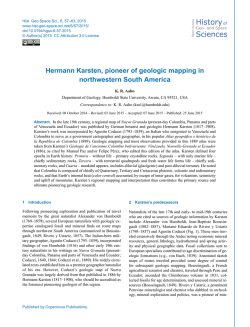
46th Lunar and Planetary Science Conference (2015)
2303.pdf
A NEW ENCELADUS BASE MAP AND GLOBAL CONTROL NETWORK IN SUPPORT OF GEOLOGIC
MAPPING. M. T. Bland1, T. L. Becker1, K. L. Edmundson1, G. W. Patterson2, G. C. Collins3, R. T. Pappalardo4, S.
A. Kattenhorn5, T. Roatsch6, and P. M. Schenk7, 1U. S. Geological Survey, Astrogeology Science Center, Flagstaff
AZ ([email protected]), 2The Johns Hopkins University/Applied Physics Laboratory, Laurel, MD, 3Department of
Physics and Astronomy, Wheaton College, Norton, MA, 4Jet Propulsion Laboratory, California Institute of Technology, Pasadena CA, 5Dept. Geological Sciences, U. of Idaho, Moscow, ID, 6Institute of Planetary Research, DLR,
Berlin, 7Lunar and Planetary Institute, Houston, TX.
Summary: From its active south polar terrain, to
its heavily tectonized equatorial regions, to its midlatitude viscously relaxed craters, Enceladus presents a
diverse set of geologic provinces that record a complex
geologic history. Fully unraveling the evolution of
Enceladus’ surface requires integrating disparate observations and insights from across the satellite into a
single self-consistent geologic history–a task that requires global geologic mapping. In support of a new
global mapping effort, we have begun preliminary
work on an updated global control network and base
map for Enceladus. The new, technically robust, datarich, well-documented network and base map will enable high-fidelity mapping of Enceladus and enhance
future investigations of the satellite.
Motivation for a New Control Network and
Base Map: The creation of a global geologic map requires a robust control network from which a global
base map can be created. Several base maps have already been produced for Enceladus [e.g., 1, 2, 3, 4].
Here we expand upon these existing maps by creating
a new control network that has both high tie-point spatial density and depth (multiple image measurements
per surface point). The resulting updated NAIF SPICE
kernels [5] will be used to create a global mosaic for
mapping, and will subsequently be documented and
made available to the community through the Integrated Software for Imagers and Spectrometers (ISIS3) [6]
environment. The updated kernels also permit the accurate projection and placement of additional images
selected by the mapper on an as-needed basis, facilitating dynamic analysis of images taken at different
times, phase angles, and resolution in a given region.
Enceladus Imaging Data: The Enceladus imaging
dataset acquired by Cassini provides a number of challenges to those mapping or analyzing its surface.
Whereas near-global coverage is available at resolutions better than 200 m/px (image resolution is lower
near the North Pole), the small size of Enceladus, the
geometry of Cassini’s flybys, and the desire to acquire
high-phase images for plume observations has resulted
in a broad range of viewing geometries. The identification of linear surface features, which dominate large
regions of Enceladus, depends strongly on viewing
angle (Fig. 1). Image registration between high phase
and low phase images is therefore challenging. Comparing and mapping geographically co-located images
therefore necessitates the development of a robust control network.
Basic Approach: Our preliminary global control
network is being created from ~370 Cassini Imaging
Science Subsystem (ISS) images with resolution better
than 1 km/px. We initially focus on clear and green
filter images (651 and 569 nm effective wavelength,
respectively), supplemented by other filters in a limited
number of regions with low image coverage. Additional filters will be included as resources permit. All images were ingested into ISIS3 for processing and control network development.
Fig. 1: (A, B) Examples of calibrated, un-projected image
cubes used in the control network. Red crosses indicate locations of control points. Yellow box in A indicates approximate position of image in C. Portion of images A and B are
shown in C and D (respectively) but sub-pixel registered and
re-projected (polar stereographic). Note how prominent
east-west oriented features in D are harder to identify in C.
Because the south pole has been more extensively
imaged than the satellite in general, we have subdivided control network development into a higherresolution south pole network consisting of 94 images
with resolution better than 160 m/px, and a lowerresolution global network. The two networks will ulti-
46th Lunar and Planetary Science Conference (2015)
mately be combined into a single global network. The
south pole network is near completion (results described here) and work has begun on the global network. Control points are distributed with sufficient
density to ensure complete coverage across each image
(Fig. 1A and B). Each control point ties together multiple images (i.e., “measures”), creating a “deeper”
control network than previous efforts (Figs. 1 and 2).
Our south polar control network currently includes
1504 control points and 5108 total measures. More
than 63% of the control points have >2 measures and
20% have >4 –a substantial increase over previous
networks (Fig. 2).
2303.pdf
provided to community users in the form of updated
(smithed) pointing (CK) kernels, which replace the
original reconstructed kernels. These improved kernels
will facilitate future analysis of the Cassini imaging
dataset. Additionally, by solving for local radius, the
control network may help determine Enceladus’ largescale topography [cf. 9], and plausibly constrain the
satellite’s physical libration [10].
Acknowledgements: This work is supported by
NASA’s PGG #NNX14AM89G.
References: [1] Roatsch, T. et al. (2008) Planet. Space
Sci., 56, 109-116. [2] Roatsch, T. et al. (2013) Planet. Space
Sci., 77, 118-125. [3] Schenk, P. M. (2014) Planet. Rep. 34,
no 3, 8-13. [4] Crow-Willard, E. N. and Pappalardo, R. T.
(submitted) Icarus. [5] Acton, C.H., et al. (1996) Planet.
Space Sci., 44(1), 65-70. [6] Kestay, L., et al. (2014) LPS
XLV, Abstract #1686. [7] Edmundson, K. L. et al. (2012)
ISPRS Ann. Photogramm. Remote Sens. Info. Sci., I-4, 203208. [8] Edmundson, K. L. et al. (2015) this conf. [9] Schenk
P. M. and McKinnon W. B. (2009) GRL, 36, L16202. [10]
Giese, B. et al. (2011) EPSC-DPS Joint Meeting, 6, 976.
Fig. 2: A. Number of control points with a given number of
measures (images). Inset zooms in on region with >7
measures. B. Percentage of control points with a given number of measures. Nearly 40% of control points have at least
four measures–a substantial increase over previous efforts.
For each control point, images are registered with
sub-pixel accuracy using a maximum correlation algorithm. Bundle adjustment is performed using the ISIS3
jigsaw module [7,8] to update spacecraft pointing. The
updated pointing is then used to project images with
consistent resolution and geometry for use in constructing the global base map.
Preliminary Results: Our current south polar control network has undergone bundle adjustment to update spacecraft pointing and the 3D coordinate of each
point, resulting in an image measure RMS residual of
0.56 pixels. We continue to work to refine our control
network to further decrease residual magnitude. An
example of the improvement in registration afforded
by the bundle adjustment is illustrated in Fig. 3.
Community Benefit and Lagniappes: Once a final control network is complete, the results will be
Fig. 3: Example of uncontrolled (A) and controlled (B) mosaic illustrating the improved registration provided by jigsaw. Images are ~39 km across.


© Copyright 2026