Latvian Macro Monitor
Latvian Macro Monitor
January 2015
2A, Republikas Square, Riga LV-1010, Latvia
Tel. +371 67010345, Fax +371 67010253;
www.citadele.lv
Regulator – FCMC, www.fktk.lv
Zigurds Vaikulis
Senior Economist
[email protected]
Simona Strizevska
Economist
[email protected]
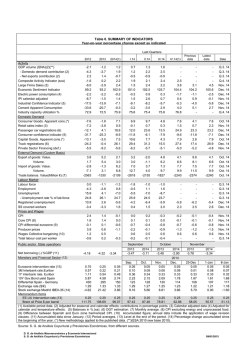
The latest high frequency indicators in Latvia showed rather mixed dynamics. On an annual basis, the
growth of the manufacturing sector slid back into negative territory, with the output contracting by 3.8% yo-y in November, following a growth of roughly 1.5% y-o-y in the preceding two months. While the retail
sales turnover in Latvia maintained a relatively solid pace of growth of 4-5% y-o-y, the aggregate growth
number hid the divergence between the dynamics of the major sales categories. The sales of food products
paused in autumn, with the annual growth rate coming to nearly a standstill in November, whereas the
growth of non-food sales reaccelerated to 4.0-5.0% y-o-y and the turnover of automotive fuels picked up in
autumn.
Inflation averaged 0.6% y-o-y in Latvia in 2014 – a relatively low level from a historical perspective. A sharp
decline in energy prices since June 2014 is thought to contain inflationary pressures in 2015, whereas the
liberalization of electricity market for households and a respective increase in electric energy tariffs is
about to drive inflation higher, adding roughly 0.6-0.8 percentage points to the inflation number in 2015.
Considering all available facts, market tendencies and our estimates, we expect annual inflation to fluctuate
around 1% threshold in 2015 – in the range between 0.5% and 1.5%.
Inflation
According to the CSB, average consumer
prices dropped by 0.6% m-o-m in the last
month of the year. Deflation in December
was caused by a drop in the prices of fuel
and heating tariffs and seasonal sales of
clothing and footwear. Annual inflation
decelerated to 0.2% y-o-y in December,
down from 0.9% y-o-y in the preceding
month. Thereby, inflation averaged 0.6% y-oy in 2014 – a relatively low level from a
historical perspective.
CPI components, weighted % change y-o-y
20
Food
Housing costs
CPI
15
Fuels
Other
10
5
0
-5
2007
2008
Source: CSB
2009
2010
2011
2012
2013
2014
2015
In general, an increase in consumer prices in
2014 was noticeably lower compared to our projections a year ago, but the reasons were relatively clear. First of all,
the liberalization of the electricity market and hence a hike in electric energy tariffs was postponed till 2015, limiting
the upward pressure on inflation in 2014. Secondly, the Russian import embargo dampened the price of milk powder
in the global financial markets and put a downward pressure on milk and dairy product prices in Latvia in autumn
and apparently also facilitated a decline in vegetable and potato prices. And finally, the major game changer for the
inflation picture in 2014 both in Latvia and globally was a nearly 50% drop in energy prices in the global financial
markets in the second half of 2014, which brought fuel prices in Latvia down by roughly 20-25% and subtracted
roughly 0.8 percentage points from Latvian inflation number.
1
Due to a sharp decline in oil prices, another significant event – the euro adoption has moved out of focus. Albeit the
introduction of the euro and its impact on Latvian inflation has attracted much attention, in line with our expectations,
the effect on consumer prices has been rather limited and has been pronounced only in certain services sectors.
According to our estimates, the changeover to the euro and the rounding of prices on average has added 0.3-0.4
percentage points to the inflation number in 2014.
A sharp decline in energy prices since June is thought to contain inflationary pressures in 2015. Whereas a decline
in global energy prices translates into fuel prices in Latvia relatively fast, the price of natural gas and heating tariffs
react to these changes with a certain lag. Assuming that oil prices are about to stabilize close to the levels seen by
the end of 2014, natural gas tariffs for households may decline by 10% and heating tariffs, e.g. in Riga, may drop by
roughly 20% in the coming months.
Nevertheless, the liberalization of electricity market for households and the respective increase in electric energy
tariffs is about to drive inflation number higher. According to our estimates, on average a household bill will increase
by roughly 15-25%, depending on the consumption volume, and is about to add roughly 0.6-0.8 percentage points to
the inflation number in 2015.
Considering all available facts, market tendencies and our estimates, we expect annual inflation to fluctuate around
1% threshold in 2015 – in the range between 0.5% and 1.5%.
Retail trade
Retail trade, SA, Dec 2009 = 100
350
200
According to the CSB, the seasonally
Non-f ood (lhs)
Total (excl. f uels) (lhs)
300
adjusted retail trade turnover at constant 180
Food (lhs)
prices (excluding fuels) rose by 0.7% m-o-m
Motor vehicles (rhs)
250
in November, reaching its highest level since 160
the end of 2008. On a monthly basis, an
200
increase was fueled by a pickup in trade 140
150
turnover of non-food products, whereas sales
120
of food products, in turn, declined over the
100
preceding month. While on an annual basis
100
50
the total retail sales turnover maintained a
Source:
CSB
relatively solid pace of growth of roughly 40
80
5% y-o-y, the aggregate growth number hid
2007
2008
2009
2010
2011
2012
2013
2014
the divergence between the dynamics of the
major sales categories. The sales of food products paused in autumn, with the annual growth rate coming to nearly
a standstill in November, whereas the growth of non-food sales reaccelerated to 4.0-5.0% y-o-y respectively.
Moreover, the turnover of automotive fuels (in real terms) picked up in autumn, rising by nearly 16% y-o-y in
November, as lower fuel prices probably boosted the demand. The sales of motor vehicles and parts thereof grew
by 5.3% y-o-y in November, whereas on a monthly basis, the dynamics still stayed relatively volatile.
Manufacturing
According to the CSB, the seasonally adjusted manufacturing output dropped by 2.0% m-o-m in November to its
lowest level since June. On a monthly basis, a decline was relatively broad-based, with the output of food, wood,
machinery and other sectors shrinking over the preceding month. The manufacturing output of basic metals and
chemicals, in turn, rose in November over the previous months, partly offsetting declines elsewhere. On an annual
basis, the growth of the manufacturing sector slid back into negative territory, with the output contracting by 3.8% yo-y in November, following a growth of roughly 1.5% y-o-y in the preceding two months. For the time being, the
2
adverse impact on the manufacturing sector from the imposed Russian sanctions has been relatively limited,
affecting only certain food segments, most notably producers of milk and dairy products. The production of food
shrank by 3.5% y-o-y in November. The impact of deteriorating Russian economic environment and weaker ruble
has continued to take its toll on the manufacturing output of certain manufacturing sectors, including beverages,
textiles and wearing apparel, etc. Moreover, the annual growth of the manufacturing output of wood slowed to 3.7%
y-o-y in November, following an increase by roughly 8-10% y-o-y in the preceding months.
The seasonally adjusted manufacturing
turnover (at current prices) dropped by 0.9%
m-o-m in November, as lower sales in
export market dragged it down. On an
annual basis, the manufacturing turnover
contracted by 7.0% y-o-y, suppressed by a
decline in the domestic market by 9% y-o-y
in November. The manufacturing turnover
in exports market dropped by 4.0% y-o-y,
with the sales in the Eurozone countries
shrinking by nearly 8% y-o-y and reporting a
decline by 2.1% y-o-y in non-Eurozone
market in November.
Manufacturing output, working day adj.,
% y-o-y change (3m MA)
50%
30%
20%
100%
50%
10%
0%
0%
-10%
-50%
-20%
-30%
-100%
2004
Source: CSB
Banking sector
According to the FCMC, the cumulative
earnings of the Latvian commercial banks
have reached 301 million EUR by the end
of November, up from 262 million EUR in
the respective period of the previous year.
The provisions for bad and doubtful loans
in commercial banks declined to 5.8% of
the total loan portfolio in November,
following an increase in the spring of
2014.
150%
Food
Wood
Manuf acturing
Basic metals (rhs)
40%
2006
2008
2010
2012
2014
Total loan portfolio, 3m change, mln EUR
(adjusted for MFI licence cancellation)
2000
Government
Fin. institutions
Non-residents
Nonf in. corporations
Households
Loan portf olio
1500
1000
500
0
-500
Source: Bank of Latvia
-1000
According to the Bank of Latvia, the
2004 2005 2006 2007 2008 2009 2010 2011 2012 2013 2014
banking sector loan portfolio stayed
broadly unchanged in November over the preceding month, whereas the outstanding volume of loans shrank by
nearly 2% y-t-d in the first eleven months of the year (adjusted for cancellation of licenses of two banks). The
household loan portfolio contracted by 4.8% y-t-d by the end of November and nonfinancial resident corporate loan
portfolio declined by nearly 4% y-t-d respectively. As opposed to shrinking resident portfolio, non-resident loan
portfolio has increased by 3.6% y-t-d in November. The commercial banks have issued 2.3 billion EUR in new loans
in the first eleven months of 2014, down from more than 2.9 billion EUR in the respective period of 2013. The
volume of newly granted loans to corporate sector and non-residents has been somewhat weaker compared to the
previous year, while the newly granted loans to households, in turn, rose by nearly 12 million EUR from January to
November over the respective period of 2013. The total share of overdue loans in the banking sector loan portfolio
rose to 14.3% in November. Albeit the credit quality has slightly deteriorated in November, the share of loans more
than 90 days overdue has continued to shrink, reaching 7.4% of the total loan portfolio.
The amount of deposits (excluding the deposits by central and local governments) rose by 2.0% m-o-m in
November, mostly driven by an increase in non-resident and corporate savings. Household deposits have also risen
by 0.6% m-o-m in November, already advancing by 5.5% y-t-d from January to November. The volume of deposits
3
of non-financial resident companies rose by 1.6% m-o-m in November, reaching its highest level since March. The
volume of non-resident deposits stayed above 10 billion EUR mark for the third consecutive month, advancing by
16.5% y-t-d by the end of November.
Treasury
Latvia posted monthly general government
budget deficit of 467 million EUR in
December, the largest negative reading
since the end of 2010. Hence, based on the
cash flow method, cumulative general
government budget deficit reached 399
million EUR in 2014, compared to a 128
million EUR deficit in the preceding year.
Deterioration in the country’s fiscal position
was mostly attributable to a pickup in
government outlays, with the latter rising by
5% y-o-y in 2014, whereas budget revenue
increased by 1.9% y-o-y respectively.
Gen. government consolidated budget,
12 month rolling, bln EUR
10
5
8
4
6
3
4
2
2
1
0
0
-2
-1
Source: Treasury
-4
-2
2004 2005 2006 2007 2008 2009 2010 2011 2012 2013 2014 2015
Financial def icit (rhs)
Expenditure (net, lhs)
Revenue (net, lhs)
Tax collections in both general and local government budgets rose by 5.7% y-o-y in 2014, broadly in line with the
annual plan, while in 2013 tax collections were by more than 2% ahead of the annual plan. Among the major tax
revenue sources, VAT collections registered the fastest growth in 2014, rising by more than 8% over the preceding
year, followed by an increase in personal income tax collections by nearly 4% y-o-y and a pickup in excise tax
collections by 2.4% y-o-y respectively. Corporate income tax was the only major source of tax revenue that fell short
to meet the annual plan, with tax collections contracting by 2.1% y-o-y in 2014 and reaching only 88% of the annual
plan.
External trade and current account
100%
Exports of goods, % y-o-y change, rolling 3m/3m
80%
According to the Bank of Latvia, the current
account fell back into negative territory in
60%
November, registering a deficit of 37 million
40%
EUR. Deterioration in the current account
20%
balance was mostly attributable to higher
0%
trade deficit with goods and a decline in
current transfers to Latvia in November. -20%
Agriculture and f ood
Metals
The cumulative current account deficit -40%
Machinery
widened to 613 million EUR by the end of
Wood
-60%
November, up from 533 million EUR in the
Exports
Source: CSB
respective period of the previous month. -80%
2007
2008
2009
2010
2011
2012
2013
2014
The worsening in the current account
balance in the first eleven months of 2014 was mainly driven by lower net current transfers, whereas trade balance
with goods, in turn, improved over the previous year.
According to the CSB, exports of goods declined by 13.4% m-o-m in November, following an upsurge in the
preceding month, as exports of cereals partly reversed gains reported in the preceding month, and lower exports of
beverages and machinery contributed negatively to the exports dynamics. Imports dropped by 5.7% m-o-m in
November, driven by a decline in imports of base metals and vehicles. On an annual basis, exports dropped by a
4
minor 0.8% y-o-y in November, as an increase in exports of wood and re-exports of mineral fuels was leveled down
by a drop in exports of food, agriculture products, machinery, etc. Imports stayed essentially unchanged in
November over the previous year, as an increase in imports of machinery and mineral fuels was offset by a drop in
other major imports categories. Country-wise, exports to Russia dragged exports dynamics in November, reporting
a drop for the first time in four months and shrinking by more than 18% y-o-y in November. Whereas the dynamics
of exports to Eurozone countries has stayed rather mixed, on an annual basis, exports to Poland and Estonia have
been shrinking since the mid-year, and exports to Lithuania and UK have been steadily rising over the preceding
year.
Real estate
Riga's real estate market
According to Arco Real Estate, a price of a 2500
2000
square meter in an average standard type
apartment in Riga declined for the third 2000
1600
consecutive month, following a steady
increase since the early 2013. The average 1500
1200
standard type apartment price in Riga slid to
637 EUR/m2 in December and the annual
1000
800
growth decelerated to 3.9% y-o-y in
December. On the whole, the standard type
500
400
apartment prices rose by 5.2% y-o-y in
Property purchase contracts, Riga (LHS)
2014, posting its fastest annual increase
Avg. standard type apartment price, Riga, Euro/m2 (RHS)
0
0
since 2007. Lately, the number of property
2002
2004
2006
2008
2010
2012
2014
purchase contracts in Riga has stayed
Source: ArcoReal Estate, Latio, Land Register
relatively stable, whereas on an annual
basis, the activity in the real estate market has weakened since September, when the amendments to the
Immigration Law took effect. Similar to the preceding years, the number of apartments for sale in Riga declined in
the end of the year. On an annual basis, the number of offers grew by 9.1% y-o-y in December, mostly reflecting an
increase in the number of offers in the central part of the city.
The Baltics
Retail trade, % annual change, 3m MA
The high frequency indicators showed rather
30
mixed dynamics across the Baltics in
20
November. On an annual basis, exports in
both Latvia and Estonia contracted by
10
roughly 1% y-o-y in November, after growing
by 6-7% y-o-y in the preceding month, and
0
advanced for the third consecutive month in
-10
Lithuania (+2.8% y-o-y in November). The
Lithuania
manufacturing sector’s growth has stayed
Estonia
-20
Latvia
positive in Estonia and Lithuania and slid to
negative territory in Latvia. The output grew
-30
by roughly 3% y-o-y in Lithuania and
2004 2005 2006 2007 2008 2009 2010 2011 2012 2013 2014
Source: Eurostat
expanded by 6.1% y-o-y in Estonia, fueled by
an increase in the manufactures of
computers and electronics. The growth of the private consumption has stayed relatively solid across the Baltics.
According to Eurostat, the growth in retail sales accelerated to 9% y-o-y in Estonia in November and stayed within a
range of 5-6% y-o-y in Lithuania since the middle of 2014.
5
This material is solely of an informational nature and should not be construed as advice to buy, hold or sell any of the mentioned financial
instruments. The authors of this material, as well as JSC Citadele banka or any of its affiliates, subsidiaries or representatives assume no
responsibility for any inaccuracies or errors, for the possible use of the information contained in this material, such as explicit and implicit losses
(including unearned profits), as well as for any penalties, even in case when they are informed about such possibility. The information contained in
this report was obtained from sources believed to be reliable (www.bloomberg.com, www.reuters.com, other mass media, stock exchanges, central
banks, national statistics authorities, company websites etc.), however JSC Citadele banka does not guarantee the accuracy and completeness of
the information. The information and opinions expressed in this report reflect information and opinions as of the time of writing, and can be changed
without any prior notice.
In case of quotation, reference to the JSC Citadele banka or the relevant sources is mandatory.
Any investment you make shall be based solely on your own evaluation of your financial circumstances and investment objectives.
For the full text of disclaimer, please visit http://www.citadele.lv/lv/research/disclaimer/
6
© Copyright 2026
