WEEKLY ECONOMIC BULLETIN
SPAIN
WEEKLY ECONOMIC BULLETIN
JANUARY 30th 2015
NIPO: 720-15-014-5
Elaboración y coordinación: Secretaría de Estado de Economía y Apoyo a la Empresa
Dirección General de Análisis Macroeconómico y Economía Internacional
Subdirección General de Análisis Coyuntural y Previsiones Económicas
INDEX (1)
Table 1. Quarterly National Accounts. Main Aggregates. Year-on-year change
Table 1a. Quarterly National Accounts. Main Aggregates. Quarter-on-quarter change
Table 1b. Quarterly National Accounts: Wages, Productivity and Labour Costs
Table 2. General and Industry Activity Indicators
Table 3. Construction and Services Activity Indicators
Table 4. Domestic Demand (Private Consumption and Equipment Investment)
Table 4a. Housing Indicators
Table 5. External Demand, Balance of Payments and Net External Reserves
Table 6. Labour Market
Table 7. Prices and Wages
Table 8. Public Sector: State Operations
Table 9. Monetary and Financial Sector
Table 10. International Indicators (I)
Table 11. International Indicators (II)
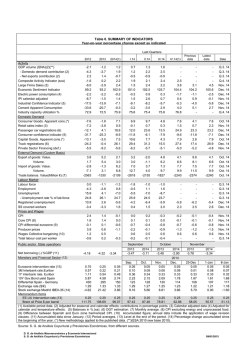
Table 12. Summary of Indicators
Chart 12. Summary of Indicators
(1)
Supplementary data and list of abbreviations can be obtained from Síntesis de Indicadores
Económicos.
Table 1. QUARTERLY NATIONAL ACCOUNTS. BASE 2010
Chain-linked volume; adjusted data (1)
January 30, 2015
Year-on-year growth rate in %
2013
2014(2)
2013 IV
2014 I
2014 II
2014 III
2014 IV
Final consumption expenditure
. Households
. Non-profit Institutions (3)
. General government
Gross fixed capital formation
. Tangible fixed assets
. Equipment and cultivated assets
. Construction
. Intelectual Property Products
Change in inventories (4)
Domestic demand (4)
. Good and service exports
. Good and service imports
Net exports (4)
-2.4
-2.3
-0.1
-2.9
-3.8
-4.2
5.6
-9.2
-1.3
0.0
-2.7
4.3
-0.5
1.4
1.7
2.1
0.5
0.7
2.3
2.1
12.4
-3.9
2.9
0.2
1.9
4.1
7.3
-0.7
-0.3
-0.1
0.6
-1.1
-0.5
-0.5
14.7
-8.3
-0.3
-0.1
-0.5
5.1
3.8
0.5
1.1
1.3
0.6
0.5
0.5
0.0
15.4
-8.1
2.9
0.3
1.2
6.3
8.9
-0.5
1.8
2.3
0.5
0.7
3.2
3.5
12.7
-2.0
1.9
0.1
2.2
1.5
4.8
-0.9
2.2
2.7
0.5
0.9
3.1
2.9
9.5
-1.2
3.9
0.2
2.5
4.6
8.2
-0.9
-
GROSS VALUE ADDED
Agriculture, forestry and fishing
Industry
Construction
Services
GDP m.p.(*)
15.6
-1.8
-8.1
-1.0
-1.2
8.6
0.9
-2.8
1.2
1.4
18.4
-0.5
-6.0
0.0
0.1
13.9
0.3
-6.1
0.8
0.7
3.8
1.4
-1.8
1.3
1.3
8.4
0.9
-0.4
1.6
1.6
2.0
DEMAND
(1) Seasonally and calendar adjusted data. (2) Available period data (3) Non-profit making institutions serving households.
(4) Contribution to GDP growth (percentage points). (ESA 2010) (*) Q.4.14-Advanced Estimate
Source: INE.
DOMESTIC DEMAND: COMPONENTS
(y-o-y % change)
GROSS DOMESTIC PRODUCT & COMPONENTS
6
16
3
0
0
-3
-16
Private Consumption Expenditure
GDP (y-o-y % change)
-6
GFCF Construction
Domestic demand (4)
GFCF Equipm.and cultivat.assets
Net exports (4)
-9
-32
2009
2010
2011
2012
2013
2014
2009
NET EXPORTS: COMPONENTS
(y-o-y % change)
2010
2011
2012
2013
2014
GVA NON AGRICULTURAL SECTORS
(y-o-y % change)
26
10
13
0
0
-10
-13
GVA Industry
Goods and services exports
GVA Construction
Goods and services imports
GVA Services
-20
-26
2009
2010
2011
2012
2013
2014
2009
2010
2011
2012
2013
2014
Table 1a. QUARTERLY NATIONAL ACCOUNTS. BASE 2010
Chain-linked volume; adjusted data (1)
January 30, 2015
Quarter-on-quarter growth rate in %
2013 III
2013 IV
2014 I
2014 II
2014 III
2014 IV
Final consumption expenditure
0.2
0.2
0.7
0.7
0.6
-
. Households
0.4
0.4
0.6
0.9
0.8
-
DEMAND
. Non-profit Institutions (2)
. General government
Gross fixed capital formation
. Tangible fixed assets
0.1
0.1
0.0
0.3
0.0
-
-0.2
-0.1
1.1
-0.1
0.1
-
1.2
0.2
0.1
1.7
1.0
-
1.6
0.1
-0.3
2.0
1.1
-
4.7
1.7
2.0
3.8
1.7
-
-0.3
-0.9
-1.7
0.8
0.6
-
-1.0
0.5
2.1
0.2
0.9
-
. Good and service exports
0.5
-0.2
0.0
1.3
3.5
-
. Good and service imports
1.4
0.2
0.5
2.6
4.7
-
-0.1
4.1
2.9
-3.0
4.4
-
0.6
-0.6
0.9
0.5
0.0
-
. Equipment and cultivated assets
. Construction
. Intelectual Property Products
GROSS VALUE ADDED
Agriculture, forestry and fishing
Industry
Construction
-1.3
-0.3
-0.8
0.5
0.1
-
Services
0.3
0.3
0.2
0.5
0.6
-
GDP M.P.(*)
0.1
0.3
0.3
0.5
0.5
0.7
(1) Seasonally and calendar adjusted data. (2) Non-profit making institutions serving households. (3) Contribution to GDP
growth (percentage points). (ESA 2010).(*) Q.4.14 Advanced Estimate
Source: INE.
DOMESTIC DEMAND: COMPONENTS
(q-o-q % change)
GROSS DOMESTIC PRODUCT AND COMPONENTS
8
4
GDP (q-o-q % change)
Net Exports (3)
2
Domestic Demand (3)
0
0
-8
Private Consumption Expenditure
-2
GFCF Construction
GFCF Equipment and cultivated assets
-16
-4
2009
2010
2011
2012
2013
2009
2014
NET EXPORTS: COMPONENTS
(q-o-q % change)
2010
2011
2012
2013
2014
GVA NON AGRICULTURAL SECTORS
(q-o-q % change)
5
14
7
0
0
-5
-7
GVA Industry
Goods and services exports
GVA Construction
Goods and services imports
GVA Services
-10
-14
2009
2010
2011
2012
2013
2014
2009
2010
2011
2012
2013
2014
Table1b. QUARTERLY NATIONAL ACCOUNTS:
WAGES. PRODUCTIVITY AND LABOUR COST (1)
January 30, 2015
year on year percentage change
2013 2014(2)
IV.Q.13
I.Q.14
Quarter on quarter percentage change
II.Q.14 III.Q.14
IV.Q.13
I.Q.14
II.Q.14 III.Q.14
TOTAL ECONOMY
Unit labour cost
-0.4
-0.5
2.0
-1.2
-0.1
-0.4
-0.1
-0.3
0.6
-0.5
Compensation per
employee
1.7
0.1
3.8
0.1
0.4
-0.1
0.2
-0.2
0.3
-0.5
Labour productivity
2.1
0.7
1.8
1.3
0.5
0.3
0.3
0.1
-0.2
0.0
GDP deflator
0.7
-0.4
0.5
-0.4
-0.5
-0.4
0.1
-0.3
-0.1
-0.1
-2.0
-0.9
-1.9
-3.2
-0.6
1.0
0.8
-1.6
1.9
-0.1
Compensation per
employee
1.5
1.5
2.1
1.5
2.1
1.1
0.6
0.0
1.4
-0.9
Labour productivity
3.6
2.5
4.0
4.8
2.7
0.1
-0.2
1.6
-0.5
-0.8
GVA deflator
0.2
-1.3
-1.8
-2.0
-1.2
-0.8
0.1
-2.1
0.5
0.6
MANUFACTURING
Unit labour cost
(1) Adjusted seasonal and calendar effects.
(2) Available period data.
Source: INE (CN-2010).
UNIT LABOUR COST AND THEIR COMPONENTS
TOTAL ECONOMY
y-o-y % change
9
MANUFACTURING
y-o-y % change
15
Compensation per employee
Labour productivity
6
Compensation per employee
Labour productivity
10
Unit labour cost
Unit labour cost
3
5
0
0
-3
-5
-6
-10
2009
2010
2011
2012
2013
2014
2009
2010
TOTAL ECONOMY
q-o-q % change
6
2012
2013
2014
MANUFACTURING
q-o-q % change
12
Compensation per employee
Labour productivity
4
2011
Compensation per employee
Labour productivity
8
Unit labour cost
Unit labour cost
2
4
0
0
-2
-4
-4
-8
2009
2010
2011
2012
2013
2014
2009
2010
2011
2012
2013
2014
Table 2. GENERAL AND INDUSTRY ACTIVITY INDICATORS
(Year-on-year percentage change except as indicated)
January 30, 2015
Previous
GENERAL
Composite Activity Indicator (2)
Social Security covered workers
Electric power consumption (3)
Non energy imports (vol.)
Households & business financing (4)
Economic Sentiment Indicator
Large Firms Sales (5)
Central Balance Sheet (Quarterly)
- Gross operating income
- ROI -Cost of debt (6)
INDUSTRY
Composite Industry Indicator (2)
IPI calendar adjusted
Social Security covered workers
Business Surveys (balances in pp)
Industry confidence indicator (sa)
Industry unfilled orders
Inventories
Industry capacity utilization %
2014
2015(1)
2014 II
2014 III
2014 IV
2015 I(1)
2.2
1.6
-0.2
9.4
-5.6
102.8
2.4
106.6
-
2.1
1.5
0.9
5.9
-5.7
102.4
2.4
2.4
2.0
0.3
10.9
-5.1
103.6
2.2
2.4
2.3
-1.7
7.0
-5.0
104.3
3.8
106.6
-
0.0
0.7
-
3.3
0.6
-3.9
0.4
-
3.5
1.4
0.1
-
4.1
2.6
0.0
3.4
0.7
0.6
-7.1
-16
9
75.8
-4.5
-12
10
78.1
-8.2
-17
10
74.1
0.8
2.0
53.2
-
2.2
2.9
53.4
Industry Turnover Index (7)
Industry new orders (7)
PMI Industry Index
Latest
data
data
Date
..
2.5
-1.1
8.9
-5.2
105.6
3.1
..
2.6
-2.5
5.0
-4.8
106.6
4.5
Dec. 14
"
Nov. 14
"
Jan. 15
Nov. 14
-
..
..
..
..
2.8
0.4
0.9
-
..
0.9
0.9
..
-0.1
1.1
Nov. 14
Dec. 14
-5.7
-13
7
75.3
-5.3
-12
9
76.9
-4.5
-12
10
78.1
-5.8
-14
8
..
-4.5
-12
10
..
Jan. 15
"
"
Q.1. 15
1.1
0.2
53.1
0.7
3.9
53.7
-
1.5
3.4
54.7
-0.1
4.4
53.8
Nov. 14
"
Dec. 14
Q.4. 14
Q.3. 14
"
Q.4. 14
(1) Available period data. (2) Adjusted for seasonal, calendar and outliers effects. (3) Adjusted for calendar and temperature
effects. (4) Deflated by CPI without energy and food. (5) Calendar adjusted deflacted and fixed sample. (6) Ordinary income on
net assets (before taxes) minus interest on borrowed funds. (7) At current prices and adjusted for calendar.
Sources: MESS, REE, BE, AEAT, INE, European Commission, SGACPE and NTC Research LTD-Reuters.
INDUSTRY PROD. INDEX (CALENDAR ADJUSTED)
ACTIVITY INDICATORS
8
110
10
0
0
85
-10
Y-o-y
Annualized q-o-q
-20
Economic Sentiment Indic. (right s.)
Composite Activity Indicator (y-o-y)
-8
60
2010
2011
2012
2013
2014
-30
2015
2009
ELEC. POWER CONSUM. AND LARGE FIRM SALES
10
2010
2011
2012
2013
2014
INDUSTRY CONF. IND. AND CAPACITY UTILIZATION
0
80
-20
72
0
-10
ICI
Large firms sales (y-o-y)
Cap.Utiliz.(right scale)
Electric power consumption (y-o-y)
-40
-20
2009
2010
2011
2012
2013
2014
64
2010
2011
2012
2013
2014
2015
Table 3. CONSTRUCTION AND SERVICES ACTIVITY INDICATORS
(Year-on-year percentage change except as indicated)
January 30, 2015
2015 I(1)
Previous
data
Latest
data
2014
2015(1)
2014 II
2014 III
2014 IV
Date
0.3
0.4
-
-0.3
-3.5
3.1
2.9
1.9
6.3
-
..
2.7
..
12.5
Dec. 14
-1.7
-0.3
-
-2.3
1.3
-0.5
27.6
1.6
-10.5
-
1.6
-4.0
2.6
-19.5
"
Nov. 14
"
CONSTRUCTION
Composite Construction Indicator (2)
Cement Apparent Consumption
Social Security covered workers
Floorage approvals: total
Q.4. 14
5.0
-
11.2
21.2
3.7
-
13.8
-7.8
43.9
-41.4
-25.8
61.8
-55.8
9.6
-35.0
22.4
-22.6
-25.8
60.2
-25.1
-9.8
-25.8
"
Jan. 15
-5.0
8.7
-
-7.3
5.8
21.9
34.3
7.6
17.3
-
9.4
17.7
5.6
16.8
-3.1
1.1
-
-2.9
6.4
-2.6
7.8
15.0
-
..
16.0
..
14.0
Nov. 14
"
Q.3. 14
- New
-15.6
-
-2.1
-14.7
-19.3
-
-17.9
-20.6
"
- Used
15.3
-
12.9
25.6
41.8
-
42.1
41.6
"
Social Security covered workers
3.3
2.2
-
3.1
2.2
3.3
2.6
3.4
2.8
-
..
2.8
..
3.0
Dec. 14
Air traffic passengers
4.6
-
5.9
5.2
4.3
-
3.2
4.5
"
Railway traffic goods. (Tm per km)
2.1
7.1
-
-5.6
7.3
8.5
7.6
11.5
5.9
-
14.2
2.9
8.5
5.6
Nov. 14
Dec. 14
2.9
6.7
10.5
5.3
6.7
2.0
7.3
3.1
7.7
10.5
-0.1
10.0
2.9
10.5
"
Jan. 15
9.9
2.6
16.4
-
9.1
3.1
8.8
2.7
14.0
3.5
16.4
-
20.7
4.3
16.4
2.8
"
Nov. 14
Floorage approvals: housing
Official bidding (at current prices)
Construction confidence indicator (3)
Mortgages. Number
" . Amount borrowed
Housing: Prices per sq meter
Dwelling sales
Nov. 14
SERVICES
Composite Services Indicator (2)
Foreign tourists
Hotel overnight stays
Retail trade confidence indicator (3)
Services confidence indicator (3)
Services Turnover Index (4)
Q.4. 14
(1) Available period data. (2) Adjusted for seasonal, calendar and outliers effects. (3) Balances in percentage points. (sa). (4) Adjusted
for calendar.
Sources: OFICEMEN, MESS, MFOM, AENA, RENFE, IET, INE, European Commission and SGACPE.
SERVICES: SOCIAL SECURITY COVERED WORKERS
AND TURNOVER INDEX (y-o-y % change)
10
HOUSING PRICES AND MORTGAGES:
AMOUNT BORROWED (y-o-y % change)
9
60
Housing prices
Mortgages: amount borrowed (right s.)
0
-10
2
20
-5
-20
Turnover Index
Social Security covered workers
-20
-12
2009
2010
2011
2012
2013
2014
-60
2009
2010
CONSTRUCTION INDICATORS
0
2011
2012
2013
2014
SERVICES INDICATORS
4
Confidence Indicator (balances)
5
40
Confidence Indicator (balances)
Composite Indicator (y-o-y % change)(right s.)
Comp. Ind. (y-o-y % change)(right s.)
-35
-70
2010
2011
2012
2013
2014
2015
-10
0
-24
-40
0
-5
2010
2011
2012
2013
2014
2015
Table 4. DOMESTIC DEMAND (PRIVATE CONSUMPTION AND EQUIPMENT INVESTMENT)
(Year-on-year percentage change except as indicated)
January 30, 2015
Previous
2015 I(1)
data
Latest
2014
2015(1)
2014 II
2014 III
2014 IV
data
Date
Composite Consumption Indicator (2)
Retail sales index deflated
Consumer goods. Apparent consum.(2)(*)
IPI consumer goods (adjusted)
Consumer goods imports (vol.)
Passenger car registrations
Real wages (3)
Consumer confidence indicator (4)
Large firms sales. Consumption (5)
EQUIPMENT INVESTMENT
3.9
1.1
7.0
2.0
12.7
18.8
1.0
-8.9
1.9
-1.5
-
4.5
0.7
9.7
2.9
11.1
23.6
1.4
-6.1
2.0
3.7
0.3
4.8
1.9
12.4
13.5
1.8
-7.9
2.2
4.3
3.1
6.8
0.8
4.9
24.9
-9.6
2.6
-1.5
-
..
2.1
7.8
1.9
5.0
23.3
..
-7.1
2.3
..
6.0
5.8
-0.3
4.7
23.2
..
-1.5
3.0
Composite Equipment Indicator (2)
Capital goods. Apparent consum.(2)(*)
IPI capital goods (adjusted)
Capital goods imports (vol.)
Truck registrations
Large firms sales. Capital (5)
BUSINESS SURVEYS
14.8
7.2
0.9
18.9
26.1
1.1
-
16.0
7.6
2.2
17.5
31.3
0.9
11.5
4.3
-2.3
19.1
15.5
3.0
16.4
6.2
-1.5
6.5
27.4
-0.7
-
..
7.3
-0.9
10.6
17.4
-0.8
..
5.0
-2.2
2.2
28.9
-0.6
Consumer goods. Capacity utilization (%)
Capital goods. Capacity utilization (%)
73.1
77.4
71.8
80.8
72.6
77.6
72.8
77.5
74.2
78.4
71.8
80.8
..
..
..
..
PRIVATE CONSUMPTION
Q.4. 14
Dec. 14
Nov. 14
"
"
Dec. 14
Q.3. 14
Jan. 15
Nov. 14
Q.4. 14
Nov. 14
"
"
Dec. 14
Nov. 14
Q.1. 15
"
(1) Available period data. (2) Adjusted for seasonal and calendar effects. (3) Adjusted for seasonal outliers and calendar effects.
And deflated by private consumption expenditure (4) Balances in percentage points (sa). (5) Calendar adjusted, deflacted and
fixed sample. (*) New methodology applied to the published data.
Sources: SGACPE, INE, AEAT, European Commission, DGT and MIET.
50
CONSUMER CONF. INDICATOR AND PASSENGER
CAR REG. (balances and y-o-y % change)
0
IPI (CALENDAR ADJUSTED)
y-o-y % change
16
0
0
-25
-16
Consumer goods
Passenger car registrations
Capital goods
Consumer Confidence I.(right s.)
-50
-50
2010
14
2011
2012
2013
2014
-32
2015
CONSUMER GOODS: COMPOSITE AND
APPARENT CONSUMPTION (y-o-y % change)
2009
7
20
2010
2011
2012
2013
2014
CAPITAL GOODS: COMPOSITE AND APPARENT
CONSUMPTION (y-o-y % change)
0
-8
0
-20
Composite Indicator
Composite Indicator (right s.)
Apparent Consumption
Apparent Consumption
-30
-7
2009
2010
2011
2012
2013
2014
-40
2009
2010
2011
2012
2013
2014
Table 4a. HOUSING INDICATORS
(Year-on-year percentage change except as indicated)
January 30, 2015
2014
2015(1)
2014 II
2014 III
2014 IV
2015 I(1)
Previous
data
8.8
5.0
52.5
-53
-42
11.2
-28.2
-65
21.2
217.5
-41
3.7
49.7
-45
-42
4.1
13.8
111.8
-44
2.2
-7.8
34.9
-42
Mar. 14
Nov. 14
"
Jan. 15
COINCIDENT INDICATORS
Housing investment
(QNA)(2010=100)(2)
Construction
GVA (QNA)(2010=100)(2)
Composite Housing Indicator (2)
CIPI(3). Building
Cement apparent consumption (2)
IPI Clay building materials
Construction employment. LFS
Construction unemployment. LFS
-4.1
-2.8
-0.1
23.4
0.2
-56.8
-3.5
-24.8
-
-3.4
-1.8
-0.1
36.9
-0.4
-63.8
-5.3
-27.3
-1.5
-0.4
2.7
15.3
2.6
-57.8
-0.5
-30.1
1.8
11.8
6.5
-51.9
4.0
-23.3
-
..
..
..
7.8
6.8
-55.6
..
..
..
..
..
15.3
7.9
-47.9
..
..
Q.3. 14
"
Q.4. 14
Nov. 14
Dec. 14
Nov. 14
Q.4. 14
"
HOUSING MARKET ACTIVITY
Housing. Built for sale (thousands)
Housing sales (thousands)
- New
- Used
Non-resident foreigners transactions
Housing investment deflator (QNA) (2)
Housing Price Index
- New
- Used
Rental CPI
25.9
293.4
112.2
181.2
4.8
-4.1
-0.2
0.5
-0.5
-0.7
-
6.7
79.2
31.4
47.8
12.1
-3.4
0.8
1.9
0.2
-0.7
5.4
79.1
27.6
51.6
-5.8
-3.6
0.3
0.8
0.1
-0.7
6.0
51.7
15.9
35.8
-0.7
-
3.4
26.5
8.1
18.3
..
..
..
..
..
-0.7
2.7
25.2
7.8
17.4
..
..
..
..
..
-0.7
Nov. 14
"
"
"
Q.3. 14
"
"
"
"
Dec. 14
FINANCIAL CONDITIONS
New housing mortgages
- Number
- Amount borrowed
Interest rate on house purchase (4)
Credit to households for housing
Delinquency household loans ratio (%)
Affordability based on wages (%) (5)
-0.2
1.8
3.16
6.22
35.7
-
-0.5
2.8
3.23
-3.6
6.12
36.2
27.7
34.6
3.07
-3.4
35.0
16.2
13.6
2.95
-3.7
-
-
18.0
14.9
3.02
-3.3
..
..
14.2
12.2
2.88
-3.7
..
..
Nov. 14
"
"
"
Q.2. 14
Q.3. 14
LEADING INDICATORS
Housing starts (thousands)
Floorage approvals: housing
Official bidding. Residential
Housing order books (balances in pp)
Latest
data
Date
1) Available period data. (2) Calendar and seasonal adjusted series. (3) Construction Industry Production Index. (4) To
households. Annual equivalent rate. (5) Without deductions.
Sources: MECC, INE, MFOM, OFICEMEN, MIET, EUROSTAT and BE.
HOUSING. BUILT FOR SALE AND NEW SALES
thousands
100
120
HOUSING STARTS AND ACCRUED
thousands
Housing starts
Housing: built for sale
Housing accrued
New housing sales
80
50
40
0
0
2009
2010
2011
2012
2013
2014
2009
2010
2011
2012
2013
2014
HOUSING INVESTMENT AND COMPOSITE INDICATOR
y-o-y % change
10
CEMENT CONSUMPTION AND CIPI BUILDING
y-o-y % change
60
Cement consumption
Housing investment (QNA)
CIPI Building
Composite Housing Indicator
30
-10
0
-30
-30
-60
2008
2009
2010
2011
2012
2013
2014
2008
ORDER BOOKS & CONSTRUCTION CONFIDENCE
balances in pp
0
2009
2010
2011
2012
2013
2014
HOUS.FLOORAGE APPROVALS & IPI CLAY BUILDING
y-o-y % change (smoothed)
30
Housing order books
Construction confidence indicator
5
-40
-20
-45
Housing floorage approvals
IPI Clay building materials
-80
-70
2009
2010
2011
2012
2013
2014
2015
2008
CREDIT FOR HOUSE PURCHASE & MORTGAGES
y-o-y % change
15
60
10
2009
2010
2011
2012
2013
2014
HOUSING PRICE & INTEREST RATE
y-o-y % change & percentage
6,5
Credit to households
Housing Prices per m2
Mortgages: amount borrowed (right s.)
Interest rate on house purchase (right s.)
0
0
5,0
-10
3,5
0
-15
-60
2008
2009
2010
2011
2012
2013
-20
UNEMPLOYMENT RATE & AFFORDABILITY
percentage
2,0
2008
2014
30
60
22
50
2009
2010
2011
2012
2013
2014
HOUSEHOLDS LOANS DELINQUENCY RATIO
percentage
8
4
14
40
Unemployment rate
Affordability based on wages (right s.)
6
30
2008
2009
2010
2011
2012
2013
2014
0
2008
2009
2010
2011
2012
2013
2014
Table 5. EXTERNAL DEMAND, BALANCE OF PAYMENTS AND NET EXTERNAL RESERVES
Total
2012(2) 2013(2)
Jan.-last month (1)
2013
2014
January 30, 2015
Previous
Latest
Date
FOREIGN TRADE (Custom basis)
Million euros:
- Exports
226115
235814
215927
220682
22347
19944
Nov. 14
- Imports
257946
252347
230052
243332
24587
21500
- Trade balance
-31831
-16533
-14125
-22650
-2240
-1555
“
“
5.1
4.3
5.4
2.2
4.1
3.2
“
3.0
4.5
5.4
3.2
6.6
4.5
“
-2.0
-2.2
-1.8
5.8
7.7
2.0
“
-6.3
2.2
2.6
8.4
9.9
4.3
“
-33.6
-48.1
-52.1
60.3
64.9
-11.6
“
Nov. 14
% change year on year:- Exports. Value
Volume
- Imports. Value
Volume
-Trade balance. Value
BALANCE OF PAYMENTS (Million euros)
Goods and services
16451
35731
34898
24690
2658
1771
-19436
-20649
-22615
-28337
-2347
-42
Current balance
-2985
15082
12282
-3647
311
1729
“
“
Capital balance
5245
6884
5210
4045
189
240
“
Current and capital balance
2259
21965
17491
398
500
1969
“
36367
-41644
-45573
111998
6679
26748
“
-137300
31953
13970
104426
8696
25337
“
173665
-73598
-59542
7564
-2018
1411
“
Net change in BE position with Eurosystem
-162366
123659
96088
21410
10184
9195
“
BE net position with the Eurosystem (3)
-332561
-208902
-263742
-206530
-204347
-206530
Primary and secondary incomes
Net change in assets, excluding BE
Net change in liabilities, excluding BE
NCA-NCL, excluding BE
Q.3. 14
(1) Accumulated figures. (2) Customs data are final. (3) End of period data.
Sources: DA, BE and SGACPE.
EXPORTS. VOLUME
y-o-y % change
IMPORTS. VOLUME
y-o-y % change
30
30
20
15
10
0
0
-15
-10
Smoothed
Smoothed
-30
Original
-20
Original
-30
-45
2009
2010
2011
2012
2013
2014
2009
BALANCE OF PAYMENTS
quarterly averages. Billion euros
2010
2011
2012
2013
2014
NET CHANGE IN BE POSITION WITH EUROSYSTEM
billion euros
4
40
2
20
0
0
-20
-2
-40
-4
Current & capital balance
Trade balance
-6
2010
2011
2012
2013
-60
-80
2014
2010
2011
2012
2013
2014
Table 6. LABOUR MARKET
January 30, 2015
Latest data
Date
Change over previous year, thousands
Thousands
Percentage change over previous year
Average
Average
Previous
Latest
Average
Average
Previous
Latest
2013
2014(1)
data
data
2013
2014(1)
data
data
LABOUR FORCE SURVEY
Q.4. 14
"
"
"
"
"
"
Labour force
Employment
- Non agricultural
- Wage earners
- Temporary workers
- Permanent workers
Unemployment
23027
17569
16840
14483
3511
10972
5458
-254
-494
-487
-504
-156
-348
240
-
26.1
25.6
26.7
55.5
-236
205
206
217
173
44
-441
-242
274
307
289
155
135
-516
-44
434
482
390
177
213
-478
% of labour force
"
"
"
"
Unemployment rate
- Male
- Female
- Young (16-24 years)
- Permanent contracts
- Temporary contracts
23.7
22.5
25.0
52.4
-1.0
1.2
1.3
1.5
5.3
0.4
-7.3
-1.0
1.6
1.9
2.0
4.6
1.3
-8.7
-0.2
2.5
2.9
2.8
5.3
2.0
-8.1
Points of change over previous year
23.7
22.8
24.7
51.8
Change over previous year,thousands
PUBLIC EMPLOYMENT SERVICES
Registered unemployed
Registered contracts
24.4
23.6
25.4
53.2
-1.1
-2.8
-2.9
-3.5
-4.6
-3.1
4.1
1.3
1.0
1.6
2.6
-1.6
-2.0
-1.2
-2.3
-2.0
-2.7
-1.2
-1.7
-2.0
-2.2
-1.8
-3.1
Percentage change over previous year
Dec. 14
"
"
"
4448
1384
100
1284
125
1024
49
974
-269
1934
215
1719
-297
144
24
120
-254
93
16
77
2.6
7.4
4.5
7.7
-5.6
13.1
19.0
12.6
-6.2
11.6
25.1
10.5
-5.4
7.2
19.2
6.4
Dec. 14
"
16775
13636
-548
-528
256
190
402
325
418
343
-3.3
-3.8
1.6
1.4
2.5
2.5
2.6
2.6
SOCIAL SECURITY SYSTEM
Covered workers (2)
- Payroll employment (2)
(1) Available data period.
(2) Monthly average
Sources: INE, MESS and SPEE.
EMPLOYMENT
% change over previous year
UNEMPLOYED
% change over previous year
3
90
Unemployment LFS
Employment LFS
Registered unemployment
Social security covered workers
0
60
-3
30
-6
0
-9
-30
2009
2010
2011
2012
2013
2014
2009
2010
EMPLOYEES
% change over previous year
2011
2012
2013
2014
UNEMPLOYMENT RATE
% of labour force
4
30
Total
All
Permanent workers
Men
0
25
-4
20
-8
Women
15
2009
2010
2011
2012
2013
2014
2009
2010
2011
2012
2013
2014
Table 7. PRICES AND WAGES
(Year-on-year percentage change)
January 30, 2015
DEC.
2012
DEC
2013
Previous
data
Latest
data
2012
2013
2014(1)
CONSUMER PRICES (CPI). Headline
Food
Non food
- Industry excluding energy
- Services
- Energy
Core (2)
2.4
2.8
2.3
0.8
1.5
8.9
1.6
1.4
3.2
0.9
0.6
1.4
0.0
1.4
-0.2
-0.1
-0.2
-0.4
0.1
-0.8
0.0
2.9
3.3
2.7
1.5
2.2
7.6
2.1
0.3
1.8
-0.2
-0.5
0.0
0.2
0.2
-0.4
0.2
-0.5
-0.3
0.2
-3.2
-0.1
-1.0
-0.2
-1.3
-0.2
0.3
-8.5
0.0
Dec. 14
"
"
"
"
"
"
HARMONIZED INFLATION DIFF.(3):
Total
Core
-0.1
-0.2
0.1
0.2
-0.6
-1.0
0.8
0.7
-0.5
-0.7
-0.8
-0.9
-0.9
-0.9
"
"
INDUSTRIAL PRODUCER PRICES:
Total
Consumer goods
3.8
2.5
0.6
2.2
-1.3
-0.5
3.3
3.5
0.6
0.0
-1.5
-0.1
-3.7
0.4
"
"
UNIT VALUE INDEX:
Exports
Imports
2.0
4.6
-0.2
-4.2
-0.9
-2.4
4.4
2.5
-2.4
-3.5
-2.3
-2.0
-1.3
-2.2
Nov. 14
"
1.2
-0.6
-0.6
-0.8
0.5
0.2
0.0
0.6
-0.3
-0.1
-0.8
1.0
-3.2
-3.6
-1.8
0.5
2.1
2.5
0.8
0.6
-0.1
0.0
-0.5
0.6
-0.4
-0.1
-1.5
Dec. 14
Q.III. 14
"
"
WAGES:
Collective bargaining (4)
Total labour cost per worker (5)
- Wage costs
- Non-wage costs
Date
(1) Available data period. (2) CPI excluding energy and non-processed food. (3) Difference between Spanish and Euro area
harmonized inflation, in percentage points. (4) Data include the application of wage revision clauses in annual average data
(except for the current year). (5) Data for December refer to 4th quarters.
Sources: INE, Eurostat, DA, SGACPE and MESS.
CONSUMER PRICES
y-on-y % change
6
PRODUCER PRICES
y-on-y % change
10
Headline inflation
Core inflation
4
5
2
0
0
-5
-2
2009
2
2010
2011
2012
2013
2014
HARMONIZED INFLATION DIFFERENTIALS
percentage points
All items
Consumer goods
-10
2009
2010
2011
2012
2013
2014
WAGE INCREASE
y-on-y % change
6
Headline
1
4
Core
2
0
0
Agreed wages index
-1
-2
-2
Total wage cost per worker
-4
2009
2010
2011
2012
2013
2014
2009
2010
2011
2012
2013
2014
Table 8. PUBLIC SECTOR: STATE OPERATIONS
(Accumulated figures in million euro)
January 30, 2015
IN CASH BASIS
December
December
2013
2012
1. REVENUE
Taxes
%
IN CASH BASIS
November November
2013
2014
117150
94436
%
NATIONAL ACCOUNTING
November November %
2013
2014
123344
75643
121118
97796
-1.8
29.3
107791
89885
8.7
5.1
150302
132370
Personal income tax
Corporate income tax
VAT
Excise duties
Other taxes
Other revenue (1)
26532
21435
16384
4285
7006
47701
37924
19964
25502
7554
6851
23322
42.9
-6.9
55.6
76.3
-2.2
-51.1
36019
15261
25354
7095
6156
17906
39255 9.0
14102 -7.6
28149 11.0
6313 -11.0
6618 7.5
22713 26.8
2. EXPENDITURE
Wages and salaries (2)
Goods and services
Interest payments
Current transfers (2)
Fixed investment
Capital transfers
152357
160796
5.5
192373
15639
3200
28407
101155
5930
6464
0.5
-9.3
9.0
5.9
-12.3
31.5
143647 -1.3
13756 -0.3
2465 -1.3
31234 11.6
85997 -6.8
3148 -24.1
7048 46.7
189931
15556
3528
26055
95539
6762
4917
145499
13803
2496
27984
92261
4149
4805
3. NET OVERALL BALANCE (1-2)
-29013
-39678
36.8
-37708
-26498 -29.7
-39629
-35561 -10.3
Pro-memoria
Total taxes (3)
Personal income tax
VAT
Excise duties
167745
70631
50463
18209
167773
69946
51939
19073
0.0
-1.0
2.9
4.7
153909
65264
49647
17582
160436
68027
53730
17959
17932
156812
133280
4.3
0.7
23532 31.2
1.3
4.2
4.2
8.2
2.1
(1) Includes fees, property income and current and capital transfers.
(2) Homogenized data in relation to the change in the treatment of pensions paid by the State.
(3) Includes the participation of regional and local governments.
Source: MHAP.
STATE OPERATIONS
Accumulated figures in the last 12 months (€ billion)
PERSONAL INCOME TAX
Accumulated figures in the last 12 months (€ billion)
225
80
Revenue
Expenditure
75
175
70
Net Overall Balance
125
65
75
60
2007 2008 2009 2010 2011 2012 2013 2014
2007 2008 2009 2010 2011 2012 2013
2014
CORPORATE INCOME TAX
Accumulated figures in the last 12 months (€ billion)
VALUE ADDED TAX
Accumulated figures in the last 12 months (€ billion)
50
60
40
50
30
40
20
10
30
2007 2008 2009 2010 2011 2012 2013
2014
2007 2008 2009 2010 2011
2012 2013
2014
Table 9. MONETARY AND FINANCIAL SECTOR
January 30, 2015
RESIDENTS´ FINANCING (1)
Total financing (loans and securities)
Non-financial corporations
Households
General government
INTEREST RATES (2)
ECB Intervention rate (3)
Euribor rates:
3 month
12 month
10 year Gov. Bond yield:
Spain
Germany
US
10 year spreads:
Spain-Germany
US-Germany
Banks rates:
Total Loans. Synthetic rate
Mortgage loans (households)
Deposits. Synthetic rate
STOCK EXCHANGE MADRID. IBEX-35 (4)
EXCHANGE RATES (2)
US $/€
Jp ¥/€
Nominal effective (4)
DEC
OCT
NOV
DEC
2013
2014
2013
2014
2014
2014
JAN-22
JAN-29
-1.4
-6.6
-5.1
8.4
-0.5
-4.8
-3.9
6.8
-1.4
-6.6
-5.1
8.4
-1.0
-5.5
-4.0
6.2
-0.5
-4.8
-3.9
6.8
-
-
-
0.25
0.05
0.25
0.05
0.05
0.05
0.05
0.05
0.22
0.54
0.21
0.48
0.27
0.54
0.08
0.34
0.08
0.33
0.08
0.33
0.06
0.28
0.05
0.27
4.58
1.63
2.33
2.74
1.24
2.53
4.16
1.85
2.90
2.15
0.87
2.29
2.09
0.79
2.32
1.79
0.65
2.20
1.40
0.45
1.89
1.46
0.36
1.76
295
71
150
129
231
104
128
142
130
152
114
155
95
144
110
140
4.06
3.19
1.08
21.42
3.94
3.16
0.63
3.66
3.84
3.16
0.90
21.42
3.81
3.02
0.47
5.66
3.61
2.88
0.43
8.61
3.66
2.25
2.22
1.328
129.7
5.26
1.329
140.4
-4.10
1.370
141.7
5.26
1.267
136.8
-4.13
1.247
145.0
-4.15
1.233
147.1
-4.10
1.162
136.7
-3.68
1.132
133.4
-5.04
(1) Year-on-year percentage change. (2) Period averages. (3) Data at the end of period. (4) Percentage change from the
beginning of the year.
Sources: BE, ECB, FT, Madrid stock exchange and MECC.
RESIDENTS' FINANCING
Y-o-Y % change
50
INTEREST RATES
Percentages
8
Total
10 year government bond yield
Non-financ.corporations
40
Households
6
12 month euribor
General government
30
20
4
10
2
0
-10
0
01 02 03 04 05 06 07 08 09 10 11 12 13 14
01 02 03 04 05 06 07 08 09 10 11 12 13 14
DIFFERENTIALS WITH GERMANY
10 year, basis points
EURO EXCHANGE RATE
Index 2001=100
180
5000
4000
3000
Spain
Portugal
Greece
Italy
Ireland
France
160
US $/€
Jp ¥/€
140
2000
120
1000
100
0
80
-1000
2009
2010
2011
2012
2013
2014
2015
01 02 03 04 05 06 07 08 09 10 11 12 13 14
Table 10. INTERNATIONAL INDICATORS (I)
January 30, 2015
GDP
% change
IPI
% change
Latest
2013
q-o-q
y-o-y
3 months
(1)
1
year
CPI
% annual change
Previous
Budget balance (2)
% GDP
Unemployment rate
% Labour force (4)
Previous
Latest
Latest
2014
2015
Germany
0.2
0.1 III
1.2
0.2
-0.6 Nov
0.2
-0.3 Jan
6.6
6.5 Jan
0.2
0.0
France
0.4
0.3 III
0.4
-0.5
-2.6 Nov
0.3
0.1 Dec
9.7
9.9 III
-4.4
-4.3
U.Kingdom
1.7
0.5 IV
2.7
0.4
1.1 Nov
1.0
0.5 Dec
2.7
2.6 Dec
-5.5
-4.4
Italy
-1.9
-0.1 III
-0.5
-1.0
-2.1 Nov
0.2
0.0 Dec
13.3
12.9 Dec
-3.0
-2.8
Spain (3)
-1.2
0.7 IV
2.0
0.2
0.0 Nov
-0.4
-1.0 Dec
23.7
23.7 IV
-5.5
-4.4
0.1
0.3 III
1.3
0.3
0.0 Nov
0.3
-0.1 Dec
10.0
9.9 Dec
-3.0
-2.7
-0.4
0.2 III
0.8
0.2
-0.3 Nov
-0.2
-0.6 Jan
11.4
11.3 Dec
-2.6
-2.3
US.
2.2
1.2 III
2.7
1.4
4.9 Dec
1.3
0.8 Dec
5.8
5.6 Dec
-5.1
-4.3
Japan
1.6
-0.5 III
-1.2
1.7
-1.1 Dec
2.4
2.4 Dec
3.5
3.4 Dec
-8.3
-7.3
OECD
1.4
0.6 III
1.7
0.2
2.2 Oct
1.8
1.5 Nov
7.2
7.2 Nov
-3.9
-3.4
EU
Euro area
(1) Average of last 3 months relative to the previous 3 months average.(2) European Commission, IMF and OECD.
(3) In Spain, IPI calendar adjusted and s.a. GDP Advanced Estimate. (4) In Germany and United Kingdom, registered
unemployment.
Sources: Eurostat, European Commission, IMF, OECD, The Economist and MECC.
GDP
y-o-y % change
INDUSTRIAL PRODUCTION
y-o-y % change. Smoothed series
8
20
10
4
0
0
-10
Spain
Spain
Germany
-4
Germany
-20
France
France
US
US
-8
-30
2009
2010
2011
2012
2013
2014
2009
2010
CPI
y-o-y % change
2011
2012
2013
2014
BUDGET BALANCE
% GDP
5
6
4
0
Spain
France
Germany
US
2
-5
0
Spain
-10
Germany
-2
France
US
-4
2010
2011
2012
2013
-15
2014
2015
2010
2011
2012
2013
2014
2015
Table 11. INTERNATIONAL INDICATORS (II)
Exports of goods (1)
% change
1
1
month
year
Germany
January 30, 2015
Imports of goods (1)
% change
1
1
month
year
Stock markets (3)
% change
1
30-12-14
week
Current account
% GDP (2)
2014
2015
€ bn
latest 12 m.
-2.1
2.3 Nov
1.6
2.2 Nov
212.3 III
7.4
7.2
2.9
9.5
0.6
4.4 Nov
-1.9
-2.4 Nov
-21.8 Nov
-1.7
-1.4
1.9
9.1
U.Kingdom
-0.4
-1.1 Nov
-3.2
-4.8 Nov
-120.2 III
-4.8
-4.6
0.2
4.0
Italy
-1.1
3.7 Nov
-0.1
1.8 Nov
27.7 Nov
1.5
1.8
0.6
8.3
Spain
-6.1
3.8 Nov
-9.6
2.0 Nov
-0.8 Nov
0.7
0.8
0.1
1.8
EU
1.0
3.2 Nov
-1.1
1.0 Nov
-
1.4
1.5
1.4
8.1
Euro area
0.2
4.2 Nov
0.0
1.2 Nov 241.6 Nov
3.0
3.1
1.6
7.9
-1.4
0.3 Nov
-2.6
1.9 Nov
-286.1 III
-2.2
-1.7
-2.3
-3.1
2.0
9.1 Dec
0.1
0.1 Dec
13.0 Nov
0.1
0.9
0.9
1.3
France
US.
Japan
(1) All data seasonally adjusted.
(2) Economic forecasts of European Commission, IMF and OECD. (3) Previous data.
Sources: Eurostat, European Commission, IMF, OECD, The Economist and MECC.
EXPORTS OF GOODS
y-o-y % change. Smoothed series
IMPORTS OF GOODS
y-o-y % change. Smoothed series
30
40
20
20
10
0
0
Spain
-10
Spain
Gerrmany
-20
Germany
-20
France
France
US
US
-30
-40
2009
2010
2011
2012
2013
2014
2009
CURRENT ACCOUNT
% GDP
2010
2011
2012
2013
2014
2013
2014
STOCK MARKETS
December 2000=100
12
175
8
150
Spain
Germany
US
4
Spain
France
Germany
US
125
0
100
-4
75
-8
50
2010
2011
2012
2013
2014
2015
2009
2010
2011
2012
January 30, 2015
Table 12. SUMMARY OF INDICATORS
Year-on-year percentage change except as indicated
Last Quarters
Activity
GDP volume (QNA)(2)(**)
- Domestic demand contribution (2)
- Net exports contribution (2)
Composite Activity Indicator (sca)
Large Firms Sales (3)
Economic Sentiment Indicator
Electric power consumption (4)
IPI calendar adjusted
Industrial Confidence Indicator (5)
Cement Apparent Consumption
Industry capacity utilization %
Domestic Demand
Consumer Goods. Apparent cons.(*)
Retail sales index (3)
Passenger car registrations (6)
Consumer confidence indicator (5)
Capital Goods. Apparent cons.(*)
Truck registrations (6)
Private Sector Financing (def.)
External Demand (Custom Basis)
Export of goods: Value.
Volume.
Import of goods: Value.
Volume.
Trade balance. Value (mill.€)(7)
Labour Market
Labour force
Employment
Unemployment
- Unemployment rate % of lab.force
Registered unemployment
SS covered workers
Prices and Wages
CPI
Core CPI (8)
CPI differential eurozone (9)
Producer prices
Wages Collective bargaining (10)
Total labour cost per worker
Net borrowing (-) %GDP (11)
Monetary and Financial Sector (12)
Latest
data
2014
2015(1)
II.14
III.14
IV.14
-1.2
-2.7
1.4
0.2
-2.9
92.9
-2.2
-1.5
-13.9
-20.7
72.5
1.4
1.9
-0.7
2.2
2.4
102.8
-0.2
1.4
-7.1
0.4
75.9
106.6
-4.5
76.8
1.3
2.2
-0.9
2.1
2.4
102.4
0.9
2.6
-8.2
-3.5
75.4
1.6
2.5
-0.9
2.4
2.2
103.6
0.3
0.7
-5.7
2.9
75.8
2.0
2.4
3.8
104.3
-1.7
0.4
-5.3
6.3
76.9
106.6
-4.5
76.8
3.1
105.6
-1.1
0.9
-5.8
2.7
-
4.5
106.6
-2.5
-0.1
-4.5
12.5
-
Q.4. 14
Q.3. 14
Q.3. 14
Q.4. 14
Nov. 14
Jan. 15
Dec. 14
Nov. 14
Jan. 15
Dec. 14
Q.1. 15
-1.8
-3.8
4.1
-25.3
-3.5
-0.4
-9.2
7.0
1.1
18.8
-8.9
7.2
26.1
-5.6
-1.5
-
9.7
0.7
23.6
-6.1
7.6
31.3
-5.7
4.8
0.3
13.5
-7.9
4.3
15.5
-5.1
6.8
3.1
24.9
-9.6
6.2
27.4
-5.0
-1.5
-
7.8
2.1
23.3
-7.1
7.3
17.4
-5.2
5.8
6.0
23.2
-1.5
5.0
28.9
-4.8
Nov. 14
Dec. 14
Dec. 14
Jan. 15
Nov. 14
Dec. 14
Nov. 14
5.2
5.4
-1.3
3.1
-1330
2.2
3.2
5.8
8.4
-2059
-
-2.0
-1.1
3.7
4.0
-1955
4.8
6.2
7.3
9.7
-2299
3.7
5.6
5.0
7.2
-1898
-
4.1
6.6
7.7
9.9
-2240
3.2
4.5
2.0
4.3
-1555
Nov. 14
Nov. 14
Nov. 14
Nov. 14
Nov. 14
-1.1
-2.8
4.1
26.1
2.6
-3.3
-1.0
1.2
-7.3
24.4
-5.6
1.6
-
-1.0
1.1
-7.0
24.5
-6.4
1.5
-1.0
1.6
-8.7
23.7
-5.9
2.0
-0.2
2.5
-8.1
23.7
-5.8
2.3
-
-6.2
2.5
-5.4
2.6
Q.4. 14
Q.4. 14
Q.4. 14
Q.4. 14
Dec. 14
Dec. 14
1.4
1.4
0.1
0.6
0.5
0.2
-0.2
0.0
-0.6
-1.3
-0.3
-
0.2
0.1
-0.4
-0.1
0.5
-0.1
-0.3
0.0
-0.8
-0.9
0.6
-0.4
-0.5
0.0
-0.8
-2.1
0.6
-
-
-0.4
-0.1
-0.8
-1.5
0.6
-
-1.0
0.0
-0.9
-3.7
0.6
-
Dec. 14
Dec. 14
Dec. 14
Dec. 14
Dec. 14
Q.3. 14
Public sector. State operations
September
-4.18
-4.32
-3.34
2013
-3.47
I.15(1)
Previous
data
2013
October
2014
2013
-3.11
-3.48
2014
Oct.
Nov.
0.05
0.05
0.08
0.08
0.34
0.33
2.15
2.09
128
130
1.27
1.25
5.66
8.61
Date
November
2014
-2.90
2013
-3.78
2014
-3.34
2015
22-Jan
0.05
0.06
0.28
1.40
95
1.16
2.25
Sep.
Dec.
15-Jan
29-Jan
Eurozone intervention rate (13)
0.75
0.25
0.05
0.05
0.05
0.05
0.05
3M Interbank rate.Euribor
0.57
0.22
0.21
0.10
0.08
0.07
0.05
1Y Interbank rate. Euribor
1.11
0.54
0.48
0.36
0.33
0.31
0.27
10Y Gov.Bond yield Spain
5.87
4.58
2.74
2.23
1.79
1.61
1.46
Differential Spain - Germany
430
295
150
123
114
114
110
Exchange rate ($/€)
1.29
1.33
1.33
1.29
1.23
1.17
1.13
Stock exchange Madrid IBEX-35 (14)
-4.62
21.42
3.66
9.16
3.66
-2.89
2.22
Memorandum Items
EE.UU Intervention rate.(13)
0.25
0.25
0.25
0.25
0.25
0.25
0.25
0.25
0.25
0.25
Brent oil Price $ per barrel
112.42
109.57
99.36
97.01
87.50
79.27
62.30
47.60
45.48
46.00
(1) Available period data. (2) Adjusted for seasonal and calendar effects; contributions in percentage points. (3) Calendar adjusted data (4) Adjusted for
calendar and temperature effects. (5) Balances in %.(sa). (6) DGT estimation. (7) Monthly average. (8) CPI excluding energy and unprocessed food.
(9) Difference between Spanish and Euro zone harmonized CPI. (10) Accumulated figures; annual data include the application of wage revision
clauses. (11) Accumulated data since January. (12) Period averages. (13) Level at the end of the period. (14) Percentage change accumulated since
the beginning of the year.(*) New methodology applied to the published data Indicator.(**) Q.4.14-Advanced Estimate (ESA 2010 new base 2010).
Source: S. G. de Análisis Coyuntural y Previsiones Económicas. from different sources.
D. G. de Análisis Macroeconómico y Economía Internacional
S. G. de Análisis Coyuntural y Previsiones Económicas
Graph 12. SUMMARY INDICATORS
6
GDP AND COMPONENTS (Adjusted Data)
y-o-y % change
DOMESTIC DEMAND: COMPONENTS (Adjusted Data)
y-o-y % change
17
0
0
-6
Domestic Demand (contrib.)
-17
Households Cons.Exp.
GDP
2009
10
GFCF Equip.and others
Net exports (contrib.)
-12
2010
2011
2012
2013
2014
INDUSTRY: PRODUCTION AND CONFIDENCE
y-o-y % change and balances
GFCF Construction
-34
2009
2010
2011
2012
2013
2014
ACTIVITY INDICATORS
y-o-y % change
10
110
0
90
0
-10
-20
70
-10
Large Firms Sales (left)
-30
Elect.Power Con (left)
ICl
-40
2010
30
Econ.Sent.I.(right)
IPI calendar adjusted
2011
2012
2013
50
-20
2014
2015
2010
2011
2012
2013
2014
2015
CONSUMER GOODS. APPARENT CONSUMPTION
y-o-y % change
IMPORTS AND EXPORTS. CUSTOMS
y-o-y % change (volume)
20
15
0
0
-20
Consumer goods (adjusted)
-15
Imports
Capital goods (adjusted)
Exports
-30
-40
2009
2010
2011
2012
2013
2014
2009
EMPLOYMENT (y-o-y % change)
4
4
2010
2011
2012
2013
2014
CONSUMER PRICES (y-o-y % change)
Employment LFS
Social Security covered workers
3
0
1
-4
-1
CPI
Core inflation
-2
-8
2009
2010
2011
2012
2013
D. G. de Análisis Macroeconómico y Economía Internacional
S. G. de Análisis Coyuntural y Previsiones Económicas
2014
2009
2010
2011
2012
2013
2014
© Copyright 2026
