
RBC Caribbean Economic Report January 2015
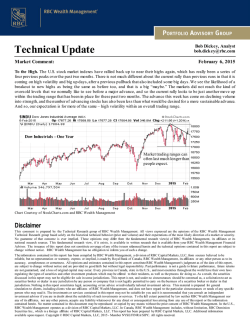
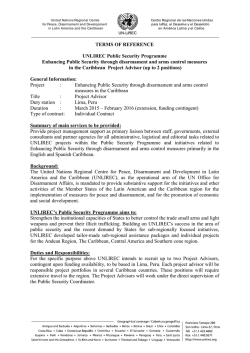
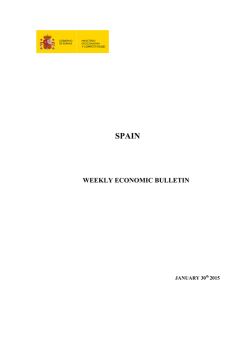
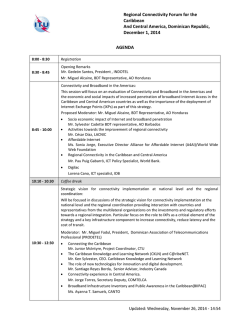
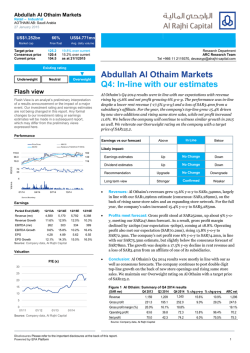
IMF Real GDP Growth Forecasts as at January 2015
GDP Growth %
Emerging market and developing economies
5.0
January 2015
5
Advanced economies
4.7
CARIBBEAN ECONOMIC REPORT
5.5
5.2
World
5.1
4.4
4.5
4.0
3.8
3.4
4
3.5
3.3
3.3
3
2.4
2.3
1.8
1.4
1.2
2012
2013
2014e
Source: IMF, RBC Financial (Caribbean) Limited
2015f
2016f
RBC’s Commodity Index at Lowest Since 2009
2.5
2
RBC’s January 2015 Commodity Price Monitor showed the commodity price
1.5
index falling for a sixth consecutive month, with the pace of decline acceler-
1
ating to –11.2% in December 2014 from –4.1% in November. The commodity
index saw its lowest level since September 2009, as the energy products subindex fell to a new post-recession low with a 20.1% m-o-m decline in December 2014, representing the sharpest monthly contraction in six years. The
energy index was down by a substantial 36.7%, and the ex-energy index by
4.8%, y-o-y in December 2014.
IMF trims 2015 and 2016 global growth forecasts again
The IMF’s January 2015 update to the October 2014 World Economic Outlook
revealed further reductions in global growth forecasts, based on slower
growth anticipated for most major countries and regions, apart from the
USA. Global growth in 2014 is now estimated at 3.3% - roughly the same rate
as the previous two years. Both the 2015 and 2016 global growth forecasts
were reduced by 0.3% each, to 3.5% and 3.7% respectively, as the boost from
lower energy costs and stronger US growth is outweighed by weaker prospects for oil exporters, the Euro area, China, Russia and Japan. Growth for
Latin American and the Caribbean (LAC) is estimated at 1.2% in 2014—down
significantly from 2.8% in 2013. LAC growth forecasts have been reduced by
0.9% and 0.5% respectively for 2015 and 2016, to 1.3% and 2.3% respectively.
The IMF is assuming an average oil price of USD56.73/bbl for 2015 and
USD63.88/bbl in 2016.
World Bank sees weaker growth and prospects than IMF
The World Bank (WB) estimates global growth at 2.6% in 2014, only slightly
stronger than the 2.5% expansion in 2013, and has forecasted 3.0% and 3.3%
growth in 2015 and 2016 respectively. According to the WB’s annual Global
Economic Prospects, the Euro Area and Japan accounted for more than half
of the downward revisions to global growth in 2014, and one-third of the
downward revisions to global growth in 2015. LAC growth decelerated significantly from 2.5% in 2013 to 0.8% in 2014—the slowest pace of growth in thirteen years, apart from 2009. The Caribbean* is estimated to have grown by
Marla Dukharan
4.6% in 2014, and is projected to decelerate to 4.1% and 4.% in 2015 and
Group Economist
RBC Caribbean
(868) 688-9845
[email protected]
2015 respectively. The Caribbean* is expected to “lead regional (LAC)
growth, averaging 4.1% over 2015–17, benefiting from stronger external demand and rising tourism receipts”. * denotes Belize, Dominica, The Dominican Republic, Haiti, Jamaica, St. Lucia, St. Vincent and the Grenadines.
Central Bank Net Foreign Assets : Aruba
USD millions
800
750
Aruba—Strong tourist arrival growth and lower inflation
According to the Central Bank’s (CBA) statistical digest, inflation dropped to
1.2% in November 2014 y-o-y, and net foreign assets declined to USD639 mil-
700
lion, which we estimate at 3.8 months of import cover. The Caribbean Tour650
ism Organization’s (CTO) data show that Aruba received 9.5% more stopover
arrivals from January to November 2014, y-o-y. Though there was a 3.8% y-o-
550
y decline in arrivals from Canada, growth from all other source markets out-
500
weighed, including 24.7% y-o-y growth in arrivals from “other” markets. CBA
Nov-14
Jul-14
Sep-14
May-14
Mar-14
Jan-14
Nov-13
Jul-13
Sep-13
May-13
Mar-13
Jan-13
Nov-12
Jul-12
Sep-12
May-12
Mar-12
Jan-12
600
Source: Central Bank of Aruba, RBC Financial (Caribbean) Limited
data show that Venezuela is the fastest growing source market for stopover
arrivals, up 34.8% y-o-y in Q3 2014. From January to September 2014, cruise
Non-performing Loans / Total Loans : The Bahamas
% Non-performing
17.5%
passenger arrivals declined 2.7% y-o-y. The CBA’s Business Perception Survey
17.0%
results reflect decreased optimism about current economic conditions.
16.5%
16.0%
15.5%
15.0%
The Bahamas — Unemployment up from 14.3% to 15.7%
The Department of Statistics reported that the overall unemployment rate
14.5%
increased in November 2014 to 15.7%, up from 14.3% in May. Fiscal revenues
13.5%
are set to improve as the VAT, which has been introduced as planned, is ex-
13.0%
pected to earn BSD400 million in FY2015/16. In addition, the regularization of
Nov-14
Sep-14
Oct-14
Jul-14
Aug-14
May-14
Jun-14
Apr-14
Mar-14
Jan-14
Feb-14
Dec-13
Nov-13
Sep-13
Oct-13
Aug-13
Jun-13
Jul-13
Apr-13
May-13
Feb-13
Mar-13
Jan-13
Dec-12
Oct-12
Nov-12
Sep-12
Aug-12
Jun-12
Jul-12
Apr-12
May-12
Jan-12
Feb-12
Mar-12
14.0%
web shops has earned an estimated BSD20 million thus far. The Central
Source: Central Bank of the Bahamas, RBC Financial (Caribbean) Limited
Bank’s Financial Stability Report revealed a sharp deterioration in onshore
International Reserves : Barbados
USD '000
740,000
690,000
banks’ profitability, based partly on higher bad debt provisioning, as nonperforming loans crossed BSD1 billion—over 15% of total private sector loans.
590,000
Barbados — International reserves end 2014 down 9%
540,000
According to the Central Bank’s (CBB) December 2014 report, international
490,000
reserves stood at roughly USD526 million or 14.5 weeks of import cover. This
440,000
represents a 9% y-o-y decline, following four consecutive months of y-o-y
Dec-14
Nov-14
Oct-14
Aug-14
Sep-14
Jul-14
Jun-14
Apr-14
May-14
Mar-14
Feb-14
Jan-14
Dec-13
Oct-13
Nov-13
Sep-13
Jul-13
Aug-13
Jun-13
Apr-13
May-13
Mar-13
Jan-13
Feb-13
640,000
growth in reserves. The CBB reported that long stay tourist arrivals are up
Source: Central Bank of Barbados, RBC Financial (Caribbean) Limited
1.2% y-o-y, with growth coming from UK, Europe, Brazil and "other" coun-
Gross Public Sector Debt / GDP : Barbados
% of GDP
107%
108%
110%
2014 however. The CBB estimates that overall economic activity “improved
98%
100%
by 0.3%" in 2014, based on expansion in investment in tourism related pro-
93%
88%
76%
90%
jects, construction activity, mining and quarrying, solar generation and
80%
chicken production. This follows a contraction of 0.3% in 2012 and zero
70%
growth in 2013. The CBB is projecting growth of 2% this year, despite an ex-
60%
tension of austerity measures by one year to April 2016 announced by the
64%
60%
62%
60%
50%
2005
2006
2007
2008
2009
2010
2011
2012
2013
2014e
the deficit target for FY2015/16 is currently 5% of GDP. Net public sector
Real GDP Growth : The Cayman Islands
% change y-o-y
4.3%
5.0%
3.0%
1.9%
1.2%
2008
2009
2010
2011
2012
2013
2014f
debt/GDP grew by about 6% of GDP during 2014, with increased financing
secured mainly from the NIS and the CBB, while private sector holdings contracted. Non-performing loans as a percentage of total loans are up from
1.4%
1.0%
2007
Government. The Government is now aiming for a fiscal deficit of 7.2% of
GDP, up from the initial target of around 6.5% of GDP, for FY2014/15, while
Source: Central Bank of Barbados, RBC Financial (Caribbean) Limited
1.2%
tries. CTO data still show a 0.6% y-o-y decline in stop-over arrivals to October
11.3% in Q3 2013 to 12.2% in Q3 2014.
-1.0%
-0.4%
-2.7%
-3.0%
-5.0%
-6.3%
Source: Cayman Islands Economics and Statistics Office, RBC Financial (Caribbean) Limited
2
-7.0%
Cayman Islands — Strong tourism growth continues
According to CTO data, stopover arrivals grew 12.6% y-o-y from January to
October 2014, while cruise passenger arrivals jumped by 20.2% y-o-y.
Cuba — Strong tourism growth and better prospects
Stopover Arrivals : Cuba
# of stopover tourists
3,000,000
CTO data show that for January to November 2014, stopover tourist arrivals
2,900,000
grew 4.9% y-o-y to 2.67 million, mainly from Canada and “other” markets.
2,800,000
Moody’s recently reported that the shift in US policy toward Cuba (Caa2 sta2,700,000
ble) is a rating positive, and they “expect the resulting positive impact on the
2,600,000
economy from the looser restrictions to more than offset the negative impact
2,500,000
from a likely decrease in Venezuelan economic assistance.” Specifically,
2,400,000
Moody’s estimates that the inflow of remittances will double over the next 22,300,000
3 years, from over USD3.5 billion or about 4.4% of GDP in 2013, with the
2008
2009
2010
2011
2012
2013
2014e
Source: Caribbean Tourism Organization, RBC Financial (Caribbean) Limited
quadrupling of the remittance ceiling to USD2,000. Travel, tourism, trade,
investment and financial intermediation are also set to increase over time.
Provisional
Net Official Reserves : Curacao and Sint Maarten
NAf Millions
2,000
1,900
Curacao and St. Maarten — Higher growth and reserves
1,800
2014, while St. Maarten saw growth of 7.3% y-o-y from January to September
2014. Cruise passenger arrivals to Curacao increased by 9.7% y-o-y from Janu-
Jan-15
Oct-14
Dec-14
Nov-14
Sep-14
Jul-14
Aug-14
Jun-14
Apr-14
May-14
Feb-14
Aug-13
Jun-13
May-13
Mar-13
Mar-14
1,300
Jan-14
that Curacao received 1.9% more stopovers y-o-y from January to November
Dec-13
1,400
Oct-13
Q3 2014, while St. Maarten saw softer inflation at 1.9% y-o-y. CTO data show
Nov-13
1,500
Sep-13
for the same period in 2013. Inflation in Curacao increased to 2.7% y-o-y in
Jul-13
1,600
Apr-13
o-y in Curacao and 1.2% y-o-y growth in St. Maarten—both higher than growth
Jan-13
1,700
Feb-13
The Central Bank’s quarterly bulletin for Q3 2014 revealed growth of 0.1% y-
Source: Central Bank of Curacao and Sint Maarten, RBC Financial (Caribbean) Limited
Inflation Rate : The Dominican Republic
% change y-o-y
6.0
ary to November 2014, while St. Maarten saw a 16.5% y-o-y jump from Janu-
5.5
ary to October 2014.
5.0
4.5
4.0
The Dominican Republic — 7% growth estimated in 2014
3.5
3.0
CTO data show that from January to November 2014, stopover arrivals grew
2.5
by 9.7% y-o-y, while cruise passenger arrivals grew 11.1% y-o-y from January
2.0
1.5
to September 2014. The Central Bank (BCRD) estimates growth at roughly 7%
inflation rate down to 1.58% y-o-y in December 2014. Although this inflation
rate is increasingly below the target range of 4.5% +/- 1%, the BCRD main-
Dec-14
Nov-14
Oct-14
Sep-14
Aug-14
Jul-14
Jun-14
May-14
Apr-14
Mar-14
Feb-14
Jan-14
Dec-13
Nov-13
Oct-13
Sep-13
Aug-13
Jul-13
Jun-13
May-13
Apr-13
Mar-13
Jan-13
1.0
Feb-13
in 2014, while the third consecutive month of m-o-m deflation brought the
Source: Central Bank of the Dominican Republic, RBC Financial (Caribbean) Limited
Real GDP Growth : The Dominican Republic
% change y-o-y
Estimate
7.8%
8%
tained its policy rate at 6.25% in its December 2014 monetary policy meeting.
8%
7.0%
The DOP depreciated by 3.5% against the USD during 2014, and reserves stand
7%
7%
at about 3.1 months of import cover according to the BCRD. The fiscal deficit
6%
is expected to come in at 2.4% of GDP this year. A recent Moody’s report at-
6%
5.3%
5%
tributed the rising growth to a 21% expansion in the mining sector, 11%
4.6%
4.5%
5%
growth in construction, stronger tourism sector performance, and higher gold
3.9%
4%
3.5%
output. Moody’s estimates that output growth will moderate and converge
4%
3%
with its potential of approximately 5% in 2015.
2008
2009
2010
2011
2012
Source: IMF, Central Bank of the Cominican Republic, RBC Financial (Caribbean) Limited
Jamaica — Stronger tourism performance, JMD weakens
JMD / USD
2013
2014
Foreign Exchange Rate : Jamaica
JMD 114
JMD 112
The Bank of Jamaica (BoJ) announced its inflation forecast in the range of 3-
JMD 110
5% y-o-y for September 2015, and that FY2014/15 inflation would be below
JMD 108
the 7-9% target. Deflation in November and December 2014 resulted in Q4
JMD 104
JMD 106
JMD 102
2014 deflation of 0.8% y-o-y, and 6.4% inflation for 2014 overall, down from
JMD 100
JMD 98
9.5% in 2013. The BoJ expects the JMD to depreciate at a slower rate in 2015,
JMD 96
JMD 94
having fallen from a peak of 15.46% y-o-y in October 2013, to 7.64% y-o-y in
Dec-14
Oct-14
Nov-14
Sep-14
Jul-14
Aug-14
Jun-14
Apr-14
May-14
Mar-14
Jan-14
Feb-14
Dec-13
Nov-13
Oct-13
Sep-13
Aug-13
Jul-13
Jun-13
May-13
Apr-13
Mar-13
Jan-13
JMD 92
Feb-13
December 2014. Import cover fell to about 18 weeks in December 2014.
Source: Bank of Jamaica, RBC Financial (Caribbean) Limited
3
International reserves: Suriname
USD Millions
1000
Suriname — International reserves end 2014 down 20%
950
The Central Bank’s online data show that inflation declined to 3.9% y-o-y in
900
December 2014, while reserves recovered slightly during that month to
850
USD621.8 million, which we estimate at roughly 3 months of import cover.
800
750
Trinidad and Tobago — Large USD injections underway
650
Central Bank (CBTT) data show that net official reserves grew by 13.3% y-o-y
600
in December 2014 to USD11.3 billion, estimated at roughly 12.5 months of
Dec-14
Oct-14
Nov-14
Sep-14
Jul-14
Aug-14
Jun-14
Apr-14
May-14
Mar-14
Jan-14
Feb-14
Dec-13
Oct-13
Nov-13
Sep-13
Jul-13
Aug-13
Jun-13
Apr-13
May-13
Mar-13
Jan-13
Feb-13
700
import cover. The CBTT injected USD1.715 million into the financial system
Source: Central Bank of Suriname, RBC Financial (Caribbean) Limited
in 2014—30% more than 2013, but 4% less than 2012. In announcing its largest
monthly injection ever at USD400 million in January 2015, the CBTT stated
Central Bank USD Injections per annum : Trinidad and Tobago
1,715
1,550
1,475
1,315
1,400
823
1,000
800
671
487
2015 foreign exchange management...aimed at preventing foreign exchange
shortfalls from arising as a result of escalating demand and reduced supply
1,200
600
386
310
296
“These larger and more frequent interventions reflect the nature of CBTT’s
1,800
1,600
1,020
1,393
2,000
1,785
1,899
USD '000
400
45
200
0
2000 2001 2002 2003 2004 2005 2006 2007 2008 2009 2010 2011 2012 2013 2014
due to lower energy export earnings.” Sub-optimal USD supply may have contributed to headline inflation at 9% and food price inflation around 18% y-o-y
in November 2014, as importers have reportedly resorted to paying USD bills
in EUR, GBP or CAD, buying USD at higher prices on the parallel market, and
stockpiling USD in anticipation of bills coming due—increasing import costs.
Source: Central Bank of Trinidad and Tobago, RBC Financial (Caribbean) Limited
Caribbean Economic Indicators
Popl'n
(000)
Nominal
GDP (USD
Bn)
Per capita Credit Rating &
GDP (USD)
(Outlook)
Aruba
106
2.6
24,426
The Bahamas
347
8.2
Barbados
274
Gross
Public
Import
Y-O-Y
Inflation
Unemp. debt/GDP
cover
(%)
(%)
(months)
(%)
4.8%
7.6%
67.1%
3.8
1.2%
23,417 BBB (Negative)
0.7%
15.7%
61.8%
1.8
1.0%
4.5
16,307
B (Negative)
-0.3%
13.2%
107.7%
3.3
1.7%
57
3.0
54,338
Aa3 (Stable)
2.2%
6.3%
21.0%
n/a
1.5%
11,300
77.1
6,848
Caa2 (Stable)
2.8%
3.5%
22.3%
n/a
0.7%
143
3.0
21,247
A- (Stable)
0.1%
13.0%
37.0%
4.2
2.7%
10,400
60.8
5,662
B+ (Stable)
7.0%
6.0%
48.0%
3.1
1.6%
ECCU
605
5.7
8,922
n/a
0.7%
20.0%
98.5%
8.0
0.8%
Guyana
756
2.7
3,596
Not rated
3.2%
11.0%
65.0%
3.5
-0.4%
2,751
15.3
5,526
B- (Positive)
1.8%
13.8%
146.2%
4.1
6.4%
43
0.8
19,333
Baa1 (Stable)
1.2%
15.0%
22.0%
4.2
1.9%
541
5.1
9,339
BB- (Stable)
4.1%
9.5%
31.0%
3.1
3.9%
1,328
23.8
17,935
A (Stable)
0.5%
3.2%
46.6%
12.5
9.0%
Cayman
Cuba
Curacao
Dom Rep
Jamaica
St. Maarten
Suriname
T&T
BBB+ (Stable)
Y-O-Y
GDP
change
(%)
Disclaimer: The material contained in this document is the property of RBC Financial (Caribbean) Limited ("RBC Caribbean") and may not be reproduced in any way,
in whole or in part, without express authorization of the copyright holder in writing. This document is intended as a general source of information only, and should not
be construed as offering specific tax, legal, financial, investment or other advice, and should not be acted or relied upon in that regard without seeking the advice of a
professional. It also does not constitute an offer to sell or a solicitation to buy securities. The statements and statistics contained herein have been prepared by RBC
Caribbean based on information and sources considered to be reliable. Every effort has been made to ensure that the material is correct at time of publication, but RBC
Caribbean makes no representation or warranty, express or implied, as to its accuracy or completeness. Interest rates, market conditions, tax rulings and other investment
factors are subject to rapid change. Individuals should consult with their personal tax advisor, accountant or legal or other professional before taking any action based
upon the information contained in this document.
4


© Copyright 2026