
Economic Trends - Alberta Treasury Board and Finance
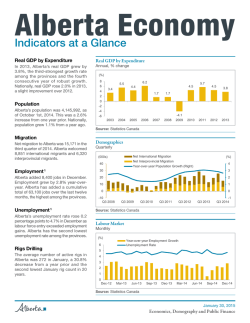
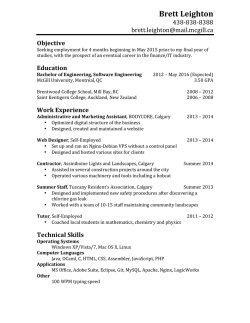
Economic Trends
Indicators soften heading into 2015
December’s positive employment
reading created some momentum in
Alberta’s labour market heading into
2015. There are signs, however, that
sharply lower oil prices are starting to
weigh on activity. December housing
starts were down, and the resale housing
market underwent a correction, as sales
and listings moved in opposite directions.
Rig activity dropped in January, while
manufacturing and export growth has
slowed. This month’s InFocus discusses
how the Alberta economy fared in 2014.
Household Sector
Solid employment growth
Alberta’s labour market finished the year
strong, adding 8,400 jobs in December
and increasing 2.8% year‑over‑year (y/y).
Overall, employment growth accelerated
in the fourth quarter, offsetting softness
in the third quarter. Despite adding jobs,
the unemployment rate increased by 0.3
percentage points to 4.7% in December
as more people entered the labour force.
January 2015 ‐ Economic Trends
Earnings growth in 2014 has also been
solid, up 4.0% over 11 months of the
year, although gains have tapered off
since August.
Housing market begins to slacken
Indicator
Latest Month
Value
Change
year‑over‑year
(y/y)
Employment (thousands)
December
2,072
+2.9%
Unemployment Rate
December
4.7%
-0.0 p.p.
CPI Inflation (unadjusted)
December
1.9%
-0.2 p.p.
Retail Sales
November
$6.6 B
+5.8%
Housing Starts (annualized)
December
35,200
-2.2%
January
273
-30.8%
Manufacturing Shipments
November
$6.5 B
+1.5%
Exports (unadjusted)
November
$9.1 B
+4.1%
Rigs Drilling (unadjusted)
Source: Statistics Canada, CAODC, CMHC. p.p.= percentage points.
Housing market loosens
The Alberta housing market eased
off at the end of 2014 after showing
impressive strength for most of the year.
Peak activity happened in the summer,
with housing starts drifting lower over
the last three months, falling to 35,200
(annualized) in December. The resale
market was consistently tight throughout
the year, with sales outpacing listings by
a fair margin. This changed in December
when the sales‑to‑new listings ratio
fell to 0.50, as the two largest cities of
Sales‐to‐new listings ratio for Alberta, Calgary & Edmonton
Chart 1: Housing market falls back into balance
Sales-to-new listings ratio for Alberta, Calgary and Edmonton
(ratio)
1.0
0.9
0.8
0.7
0.6
0.5
0.4
0.3
0.2
0.1
0.0
Seller's market
Balanced market
Buyer's market
Alberta
Calgary
Edmonton
Edmonton and Calgary saw a decrease
in sales and a large increase in listings
(Chart 1). The average resale price of
a home in Alberta came down slightly
from November, but was up 2.7% y/y
in December.
Inflation eases
PDF name: chrt_01.pdf
The
recent fall in oil prices caused
inflation to fall to 1.9% in December
below 2% for the first time since June.
This decrease was primarily the result
of lower gasoline prices, which were
down 16.3% y/y in December. Shelter
increased 3.5% y/y. Since August,
food has been increasingly adding to
inflation, with food prices up 4.0% y/y
in December. Meat, fruit and vegetable
prices were responsible.
Business Sector
Oil prices fall below $50 US/bbl
Global oil prices have fallen by more
than half to the lowest levels in almost
six years. Prices had been falling since
June, but accelerated downward
beginning in late November when OPEC
chose not to cut production. Lower
prices have started to impact oil and
gas activity in Alberta. The number of
rigs drilling in January was 30% lower
than the previous January.
Source: Canadian Real Estate Association
Source: Canadian Real Estate Association
January 30, 2015
Economics, Demography and Public Finance
Economic Trends - Indicators soften heading into 2015
Page 2/4
Prices hurt the value of business output
Alberta manufacturing shipments fell by 3.8% in November to $6.5 billion. Sales
were pulled down by petroleum and coal products, which have lost some value
as petroleum product prices have moved down with oil prices. Despite the drop in
petroleum and coal product sales. Overall manufacturing sales were up 1.5% from
November 2013, owing to food products, which were up 14% on elevated prices
for beef and pork. Through the first eleven months of 2014, manufacturing sales
remained up a strong 8.0%. Exports also slowed late in the year. Energy exports
dropped sharply in November, both because of lower prices and some temporary
production issues. Export growth remained up an exceptional 18.1% year‑to‑date.
Nonresidential building finishes strong
Real investment in nonresidential construction rose 5.3% in the fourth quarter to finish
the year up an impressive 5.0%. The value of permits built some momentum earlier in
January 2015 ‐ Economic Trends
the year, suggesting construction activity would remain strong; however, permits have
fallen off in recent months, with November’s reading dropping by 20% from October
(Chart 2). Large monthly fluctuations in building permits are common and some of
Building permits show signs of waning
Alberta non‐residential building permits
Chart 2: Building permits dip after a summer spike
Alberta non-residential building permits
($billion)
1.2
Building Permits
6-Moving Average
1.0
0.8
0.6
0.4
0.2
0.0
January 2015 ‐ Economic Trends
Nov-10
May-11
Nov-11
May-12
Nov-12
May-13
Nov-13
May-14
Nov-14
Sources: Statistics Canada
Chart 4: The US is swimming upstream
Chart 3: Exchange rate falls further on Bank of Canada interest rate cut
Source: Statistics Canada
Canada-US Exchange rate. Line marks timing of interest rate cut
(US cents/C$)
92
chrt_02.pdf
90
88
86
84
82
the decline may be a return to normal
from elevated levels during the summer.
The six‑month moving average of
building permit values remains elevated
compared with earlier in the year.
Outside Alberta
Bank of Canada shocks markets
The Bank of Canada has lowered its
target interest rate by 0.25 percentage
points to 0.75%. The Canadian dollar
had been falling for several months and
immediately lost 1.5 cents (Chart 3). It
PDF name: chrt_02.pdf
has since
declined further. The lower
interest rate is meant to help mitigate
some of the adverse effects of lower oil
prices on the Canadian economy. The
dramatic decline in oil prices will likely
lower household income and wealth,
suppress business investment, reduce
trade revenues and weaken inflation.
The lower Canadian dollar will benefit
Canada’s export sector and further
the Bank’s goal of maintaining a 2%
inflation rate.
IMF lowers forecast
The International Monetary Fund recently
expressed concern over numerous
economies, including Russia, Japan,
China and the Euro area and lowered
its forecast for global economic growth
in 2015 to 3.5%. The US was one of
few countries for which the outlook
PDF name: chrt_03.pdf
has improved.
The US recovery is well
entrenched, as labour markets have
improved significantly and activity has
picked up. The improved outlook, has
caused the US dollar to appreciate
against most major currencies.
2015
Euro Area monetary policy
In an effort to restore growth and prevent
deflation, the European Central Bank
will purchase €60 billion in bonds every
month until September 2016. Growth
in the Euro Area has been anemic, as
inflation has fallen steadily for three
years. The program is similar in size and
design to the one implemented by the
US Federal Reserve in September 2012.
That program ended last year.
80
78
Aug-14
Sep-14
Oct-14
Nov-14
Source: Wall Street Journal
Source: International Monetary Fund (IMF)
Dec-14
Jan-15
Contact
Kailer Mullet780.427.7391
January 30, 2015
Economics, Demography and Public Finance
inFocus
2014 Year in Review
The Alberta economy entered 2014
with terrific momentum. Real GDP
growth over the previous four years
had averaged an incredible 4.6%. This
strength persisted in 2014, with many
indicators gaining strength. Alberta’s
population continued to swell, as
migrants moved to Alberta in search
of opportunity. Towards the end of the
year, however, the economy lost some
momentum, as the impact of sharply
lower oil prices started to dampen
activity.
Business Sector
Activity strengthens
Business activity in Alberta expanded
robustly again in 2014. International
goods exports through November
were up an impressive 18.1% (Chart
1), mainly on energy products, but also
due to broad-based gains across several
products. Oil production through the
first 10 months of 2014 averaged 3.1
million barrels per day, up 10.7% over
the same period in 2013. Growth came
mostly from bitumen, which increased
22.6%. An exceptionally cold winter
on the East Coast caused natural gas
prices to spike early in the year. This
set off a flurry of activity in the natural
gas sector, with the number of metres
drilled for gas nearly doubling in 2014,
and annual production set to expand for
the first time in five years. Natural gas
activity was also supported by higher
prices for natural gas liquids. Exports
of farm products were up as last year’s
bumper crop made its way to market,
though the gain was limited by lower
grain prices.
Prices and differential decline
Over 2012 and 2013, Alberta heavy
oil prices were on average US$25/bbl
less than similar quality crudes in the
Gulf Coast (ex. Maya). In 2014, this
discount was cut in half, as expanded
rail capacity and additional pipelines
improved market access. The number
of train cars carrying crude oil was up
about a third in 2014. Unfortunately for oil producers, a narrower differential has
been offset by the collapse in oil prices. Higher-than-expected production in war-torn
Iraq and Libya added to a surge in supply from North America, where production
has increased 50% in just five years. This, combined with less demand because
of weak global growth, pushed oil prices down almost 45% between June and
December. Lower prices began to impact the Alberta economy at the end of 2014,
with a slowdown in manufacturing sales and export values (Chart 2).
Busy builders
January 2015 ‐ Economic Trends
PDF na
Real investment in non-residential buildings increased 5.0% in 2014, the highest
inFocus
increase since 2008. Growth was driven by commercial investment, which grew
Exports have been way up in 2014
Chart 1: Exports were way up in 2014
Alberta exports by year
Alberta international merchandise exports by year
($billion)
11
2011
2012
2013
2014
10
9
8
7
January 2015 ‐ Economic Trends
6
inFocus Jan Feb Mar Apr May
Jun
Jul
Aug
Sep
Oct
Nov
Dec
Source: Statistics Canada
Employment increases slows in the second half of 2014
Chart 2: After a strong start, growth started to wane in November
Month‐over‐month employment level change with first & second half average
Year-over-year change in Alberta manufacturing sales and international goods exports
Source: Exports
(%)
All Exports
40
chrt_Infocus_01.pdf
Energy Exports
Manufacturing Shipments
35
30
25
20
15
10
5
0
Source: Statistics Canada
Source: Statistics Canada
January 30, 2015
Economics, Demography and Public Finance
PDF na
inFocus - 2014 Year in Review
Page 4/4
by 6.8%. Edmonton saw the largest gains, where construction activity increased
8.3%, compared with a 4.4% increase in Calgary. The increase in activity did not
result in substantially higher construction costs, which increased less than the rate
of inflation.
growth in the housing sector, the year
ended on a sour note, with both sales
of existing homes and housing starts
falling substantially in December.
Household Sector
Outside Alberta
Strong labour market pulls in migrants
Though the rate of in-migration has moderated, Alberta’s labour market continued
to be a strong draw for both international and interprovincial migrants in 2014.
The province added 48,400 jobs for the year, almost half of the total for Canada.
The unemployment rate was 4.7%, 2.2 percentage points lower than the national
level. Earnings growth, up a strong 4.0% through the first eleven months of 2014,
outpaced the rest of Canada. Alberta employees earn over 25% more per week
than the average worker in Canada. This extra income helped to fuel consumer
spending and supported growth in retail sales of over 7.0% in 2014. Albertans hit
the road more; sales from gasoline stations were up 20% and new motor vehicle
sales up 5.0%, with one month of data still to be released.
US economy breaks out
2014 did not begin well for the US
economy. A brutal winter disrupted
the flow of goods and kept shoppers
at home, causing real GDP to decline
at an annual rate of 2.1% in the first
quarter. Come spring, the US economy
roared back to life, growing 4.6% in the
second quarter and 5.0% in the third,
the largest quarterly growth rate in more
than ten years. Over the course of 2014,
2.9 million jobs were added, the most
in 15 years, as the unemployment rate
dropped 1.1 percentage points to 5.4%.
The cost of living indoors
Consumer prices in Alberta increased by 2.6% in 2014. Inflation was driven by shelter
costs, which increased by 3.9%. Excluding shelter, inflation was near the historical
average of 2%. There were a number of factors in 2014 that added to shelter costs.
The cost of owning a home increased 3.8%, both because of higher house prices
and a 15% increase in the cost of home and mortgage insurance. Though Alberta
natural gas producers may have benefited from higher prices, households saw their
heating bill increase by almost 20% in 2014. Food was also more expensive, with
fruit, vegetable and especially meat prices increasing notably.
Continued strength in housing
Strong demand for housing in 2014 helped to boost residential investment and
house prices. Construction began on 40,600 new Alberta homes, an increase of
12.7% from 2013, though still well below peak activity in 2006. Calgary was the
center of much of the activity, with housing starts increasing by a third, compared
January 2015 ‐ Economic Trends
with
a 5% decline in Edmonton. Residential investment in Calgary was spurred by
higher
prices. The Teranet-National Bank house price index increasing 8.8% in 2014,
inFocus
the highest among major Canadian cities and the largest increase in Calgary since
2007. Inventories of unsold homes remain low, especially in Calgary. Despite the
The cost of owning and operating a home is increasing
Chart 3:
There are many factors pushing up shelter costs in Alberta
Contribution to year‐over‐year change in shelter costs
Contribution to year-over-year growth in the shelter component of the CPI
(Percentage
Points)
10
Rent
Home and Mortgage Insurance
Shelter
Homeowner Costs (ex. Insurance)
Utilities
5
0
-5
Jan-13
Apr-13
Jul-13
Source: Statistics Canada
Source: Statistics Canada
Oct-13
Jan-14
Apr-14
Jul-14
Oct-14
Much of the rest of the world did not fare
so well in 2014. The Euro Area economy
showed little improvement, with weak
growth, chronic unemployment and
deflation. A 3% sales tax hike caused
real GDP in Japan to contract sharply in
the second and third quarters. Russia’s
economy has been battered by sanctions
and plummeting oil prices. It received a
further blow when the Russian central
bank was forced to hike interest rates to
support the Ruble,which had lost half its
value since June. Despite Brazil falling
PDF name: chrt_Infocus_03.pdf
into recession, Brazil’s central bank was
forced to do the same because of high
inflation.
Modest growth in Canada
Economic growth in Canada was
neither exceptionally good nor bad,
with continued growth of a little over
2% and modest improvement in the
labour market. Consumers continued
to support growth, with retail sales on
pace for a little under 5% growth in
2014, which would be the highest since
2010. The biggest contribution came
from exports, which benefited from a
resurgent US economy and a lower
dollar. The loonie lost ten cents against
the US dollar over the course of 2014,
mostly due to US dollar strength, as the
Canadian dollar appreciated against
most of our major trading partners’
currencies. Inflation came in just under
the Bank of Canada’s target of 2%.
January 30, 2015
Economics, Demography and Public Finance


© Copyright 2026