Alberta Economy – Indicators at a Glance
Alberta Economy
Alberta Econo
PDF named: chrt_ 01_rgdp.pdf
Indicators at a Glance
(annual, year-over-year percent change)
Real GDP by Expenditure
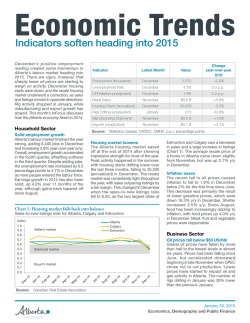
In 2013, Alberta’s real GDP grew by
3.8%, the third‑strongest growth rate
among the provinces and the fourth
consecutive year of robust growth.
Nationally, real GDP rose 2.0% in 2013,
a slight improvement over 2012.
Real GDP by Expenditure
Annual, % change
(%)
8
6.2
5.5
6
3.4
4
4.5
4.4
Population
Alberta’s population was 4,145,992, as
of October 1st, 2014. This was a 2.6%
increase from one year prior. Nationally,
population grew 1.1% from a year ago.
Migration
Net migration to Alberta was 15,171 in the
third quarter of 2014. Alberta welcomed
8,851 international migrants and 6,320
interprovincial migrants.
4.5
3.8
1.7
1.7
2
5.7
0
-2
Alberta Econo
PDF-4named: chrt_ 02_d.pdf
-6
2003
2004
2005
2006
2007
2008
-4.1
2009
2010
Demographics
Source:Statistics
Canada
(Quarterly,
population
is year-over-year percent change)
2011
2012
2013
chrt_
01_rgdp.pdf
Demographics
Quarterly
Net International Migration
(000s)
(%)
Net Interprovincial Migration
40
4
Year-over-year Population Growth (Right)
Employment 1
30
Alberta added 8,400 jobs in December.
Employment grew by 2.8% year-overyear. Alberta has added a cumulative
total of 63,100 jobs over the last twelve
months, the highest among the provinces.
20
2
10
1
0
0
Unemployment 1
Alberta’s unemployment rate rose 0.2
percentage points to 4.7% in December as
labour force entry exceeded employment
gains. Alberta has the second lowest
unemployment rate among the provinces.
Rigs Drilling
The average number of active rigs in
Alberta was 272 in January, a 30.8%
decrease from a year prior and the
second lowest January rig count in 20
years.
-10
Q3 2008
Q3 2009
Q3 2010
Q3 2011
Q3 2012
3
Q3 2013
-1
Q3 2014
PDF named: chrt_ 03_lm.pdf
Source:Statistics Canada
Alberta Econo
Labour
Market
chrt_
02_d.pdf
Labour
Market
(Monthly, employment is year-over-year percent change)
Monthly
(%)
Year-over-year Employment Growth
Unemployment Rate
6
5
4
3
2
1
0
Dec-12
Mar-13
Jun-13
Sep-13
Dec-13
Mar-14
Jun-14
Sep-14
Dec-14
Source:Statistics Canada
chrt_ 03_lm.pdf
January 30, 2015
Economics, Demography and Public Finance
\\ter-fin-fs-01\Publications\_Economics_publications\Alberta Indicators at a Glance\Sour
Alberta Econ
PDF named: chrt_ 04_iae.pdf
Alberta Economy - Indicators at a Glance Inflation Consumer Price Index (CPI) inflation
fell 0.1 percentage points to 1.9%
in December. Food and shelter cost
increases were tempered by falling
gasoline prices.
Average Weekly Earnings 1
Average Weekly Earnings (AWE) dropped
to $1,162 in November, a 0.3% decrease
from October, and up 2.8% from
November 2013. Nationally, average
weekly earnings increased 0.1% from
October to $941.
Retail Sales 1
Retail sales were $6.6 billion in November,
up 5.8% year-over-year. The main
contributor to the year-over-year increase
in sales was general merchandise stores,
such as department stores.
The number of Alberta housing starts
in December was 35, 231 (annualized),
2.2% less than in December 2013.
Housing starts rose 12.7% for all of 2014.
(%)
6
5
4
3
2
1
0
-1
Dec-12
Average Weekly Earnings
Apr-13
Aug-13
CPI Inflation
Dec-13
Apr-14
Aug-14
Dec-14
Alberta Econ
PDF
named: chrt_Canada
05_rs.pdf
Source:Statistics
Retail Sales
Retail04_iae.pdf
Sales
chrt_
(Monthly,
year-over-year growth)
Monthly, year‑over‑year % change
(%)
12
8
6
4
2
0
Nov-12
Feb-13
May-13
Aug-13
PDF named: chrt_06_ahm.pdf
New Housing Price Index The New Housing Price Index in Alberta
increased 3.6% y/y in November, with
Calgary house prices increasing 6.5%,
while Edmonton were up 0.8% y/y.
Building Permits 1
The total value of building permits issued
in Alberta plummeted by 23% to $1.3
billion in November, 10% below November
2013. Residential permits fell 4.1% y/y,
while non-residential permits declined by
a third.
Inflation and Earnings
Inflation CPI
and and
Earnings
(Monthly,
AWE is year-over-year percent change)
Monthly, CPI and AWE, year‑over‑year % change
10
Housing Starts
1
Page 2/4
Nov-13
Feb-14
May-14
Aug-14
Nov-14
Alberta Econo
Source:Statistics Canada
Alberta Housing Market
(Monthly,
Housinghousing
Marketprices are year-over-year percent change)
chrt_
05_rs.pdf
Monthly
(index, 2007=100)
102
(thousands, SAAR)
Housing Starts (Right)
60
New Housing Price Index (Left)
100
50
98
40
96
30
94
20
92
Seasonally adjusted
90
Contact
Dec-12
Nachum Gabler780.638.3238
Mar-13
Jun-13
Sep-13
Dec-13
Mar-14
Jun-14
Sep-14
10
Dec-14
Source:Statistics Canada
Canadian Dollar
WTI Oil ($US/bbl)
chrt_06_ahm.pdf
(US¢/$CAN)
NYMEX Natural Gas
($US/MMBtu)
Alberta Reference
Price ($C/GJ)
Latest (January 29, 2015)
79.09
44.53
2.73
3.47 (November)
Fiscal year‑to‑date
89.66
86.92
4.01
3.86
\\ter-fin-fs-01\Publications\_Economics_publications\Alberta Indicators at a Glance\Sour
Please see the Weekly Economic Review for01.23.15_Alberta
current analysis Indicators
on the Alberta
economy.
Charts:
4) Inflation &Avg Wkly Earnings
January 30, 2015
Economics, Demography and Public Finance
PDF named: chrt_07_rgdpgbi.pdf
Alberta
Economy Indicators at a Glance
PDF named:
chrt_08_CPI.pdf
Provincial Comparisons - Pg 3
Alberta Economy - Indicators at a Glance Real GDP Growth by Industry
(2013, year‐over‐year growth)
Real GDP by Expenditure (Market Prices)
CPI CPI Inflation
(2013, year‑over‑year growth)
(December 2014, year‑over‑year growth)
(%)
(%)
8
1.5
6
2.0
2.2
2.0
1.0
1
1.9
1.3
0.3
CAN NL
PE
Unemployment Rate
NS
-0.5
NB QC
ON
MB
SK
AB
BC
CAN NL
PE
NS
NB
QC
ON
MB
SK
AB
BC
(%)
11.8
12
4
chrt_08_CPI.pdf
11.1
8.4
7.0
1
5.4
6
3.7
4
4.7
5.5
PE
NS
Average Weekly Earnings
NB
0.8
0.7
0.7
0.6
0
-0.2
-0.5
-2 named:
Alberta
Economy
Indicators at a Glance
-1.6
PDF
chrt_12_hs.pdf
Provincial
Comparisons - Pg 3
-2.5
QC
ON
MB
SK
AB
BC
Average Weekly Earnings
-3
CAN NL
Housing Starts
PE
NS
NB
QC
ON
MB
SK
AB
BC
Housing Starts
(November 2014, year‑over‑year growth)
(December 2014, SAAR, year‑over‑year growth)
(%)
(%)
chrt_09_ur.pdf
6
5.5
5
1.4
-1
PDF 2named: chrt_11_awe.pdf
CAN NL
2.3
2
7.5
6.7
2.8
3
10.0
10
20
chrt_10_er.pdf
6.3
4.2
4
1
-1
(December 2014, year‑over‑year growth)
(%)
2
0
Employment
chrt_07_rgdpgbi.pdf
14
3
0.5
0.2
Employment
(December 2014)
0
0.9
Alberta
Economy Indicators at a Glance
-0.4
PDF named: chrt_10_er.pdf
Provincial Comparisons - Pg 3
Unemployment Rate
8
1.5
0.6
PDF0 named: chrt_09_ur.pdf
-1
1.9
1
3.8
4
1.7
1.1
5.0
5
2
1.9
2
7.2
7
3
Page 3/4
2.8
2.2
2.1
1.2
1.5
0
3.4
3.0
1.3
-2.2
-3.8
1.7
-3.5
-8.4
-11.0
-20
-21.8
-30.1
0
-40 at a Glance\Source documents\:
\\ter-fin-fs-01\Publications\_Economics_publications\Alberta
Indicator
\\ter-fin-fs-01\Publications\_Economics_publications\Alberta
Indicators
1/23/2015: 1:47 PM
CAN NL PE NS NB QC ON MB SK AB BC
CAN
ATLIndicators
QC
ON
MB8) CPI
SK
AB
BC
01.23.15_Alberta
Charts:
01.23.15_Alberta Indicators Charts: 7) Real GDP
January 30, 2015
Economics, Demography and Public Finance
chrt_12_hs.pdf
Alberta Economy - Indicators at a Glance Page 4/4
Alberta Economic Indicators
Population1
Population (thousands)
y/y % change
Net Interprovincial Migration
Net International Migration
2012
2013 2014YTD Aug-14
3,889
2.6
27,652
40,043
4,007
3.0
38,598
48,116
4,146
2.6
38,717
42,478
2,150
2,211
2,274
2.7
4.6
73.4
1,070.31
3.5
2.9
4.6
73.1
1,107.75
3.5
68,408
7.0
248
10.5
1.1
1.3
33.4
29.9
1.3
60,369
12.3
0.59
362
2.6
5,759
-18.1
95,873
2.8
68,677
3.6
6,795
20.6
250
-12.6
71,675
2.6
76,841
10.8
14,663
14.8
8,287
18.2
6,376
10.7
3.8
230
-12.9
Sep-14
Oct-14
Nov-14
Dec-14
2,300
8.4
2.8
4.7
72.8
Jan-15
4,146
2.6
6,320
8,851
Labour Market
Employment (thousands, SA)
m/m change (thousands)
y/y % change
Unemployment Rate (%, SA)
Participation Rate (%, SA)
Average Weekly Earnings ($, SA)
y/y % change
2.2
4.7
72.7
1,148.49
4.0
2,262
-15.3
0.6
5.2
72.4
1,158.26
4.5
2,284
22.3
1.6
4.6
72.5
1,152.65
3.7
2,291
6.8
2.3
4.4
72.5
1,165.89
3.8
2,292
0.8
2.1
4.4
72.4
1,161.93
2.8
73,109
6.9
263
6.2
1.4
1.4
36.0
7.8
2.8
66,081
9.5
0.64
380
5.0
4,689
-18.6
72,257
8.0
257
5.3
2.6
2.4
40.6
12.6
3.4
71,771
8.6
0.65
400
5.2
3,597
-18.3
6,615
8.0
25
6.7
2.6
2.7
44.1
50.7
3.2
6,376
9.5
0.66
403
4.1
289
-23.7
6,686
7.3
27
16.2
2.6
2.7
47.1
48.6
3.5
6,182
5.1
0.69
403
5.0
313
-16.5
6,671
6.7
24
6.8
3.0
2.4
41.2
9.2
3.6
6,382
10.0
0.67
405
6.1
339
-11.5
6,634
5.8
21
4.6
2.0
2.3
39.2
-10.5
3.6
6,281
8.4
0.65
408
5.6
292
-9.6
103,007
7.4
75,700
10.2
6,184
-9.0
235
-5.9
73,793
3.0
78,605
2.3
17,262
17.7
9,859
19.0
7,403
16.1
1.2
137
-40.4
111,018
18.1
83,315
20.9
6,025
6.4
252
7.4
73,020
8.0
77,434
7.5
16,511
3.8
9,863
9.2
6,648
-3.2
1.8
96
-22.0
9,672
14.0
7,184
13.3
583
55.5
254
6.5
6,651
4.3
7,152
8.5
1,721
27.7
1,032
33.0
689
20.5
10,713
26.0
8,150
28.8
487
16.5
278
10.9
6,708
9.0
7,182
9.3
1,510
-1.0
962
-3.7
547
4.2
1.4
5
-61.5
10,726
11.2
8,040
11.1
532
-13.1
265
11.1
6,749
7.3
7,174
7.2
1,629
8.0
1,020
6.4
609
10.8
9,058
4.1
6,541
1.7
515
-10.4
266
14.3
6,490
1.5
7,229
8.0
1,262
-10.0
841
-4.1
421
-19.9
14
-6.7
10
25.0
Household Sector
Retail Sales ($ million. SA)
y/y % change
New Vehicle Sales (units, thousands)
y/y % change
Consumer Price Index (y/y % change)
Excluding Food & Energy
Housing Starts (SAAR, 000's)
y/y % change
New Housing Price Index (y/y % change)
Resale Home Sales
y/y % change
Sales to New Listing Ratio
MLS Average Resale Prices ($ thousands)
y/y % change
Consumer Bankruptcies (level)
y/y % change
1.9
2.3
35.2
-2.2
4,939
-6.6
0.50
401
2.7
Business Sector
Goods Exports (customs based,$ million)
y/y % change
Energy Products ($ million)
y/y% change
Agricultural Products ($ million)
y/y % change
Rigs Drilling
y/y% change
Manufacturing Shipments ($ million)
y/y% change
Wholesale Trade ($ million)
y/y% change
Building Permits ($ million, SA)
y/y% change
Residential Permits ($ million, SA)
y/y % change
Non‑Residential Permits ($ million, SA)
y/y % change
Non‑Res. Building Cons. Price Index2 (y/y % change)
Business Bankruptcies
y/y % change
1
YTD
2
Quarterly; annual numbers are presented on a census year basis
(July 1– June 30)
Quarterly, average of Calgary and Edmonton
YTD (year‑to‑date). “SA” denotes seasonally adjusted. “SAAR”
denotes seasonally adjusted at annual rate
11
57.1
253
-2.1
272
-30.8
Sources: All data are from Statistics Canada except Housing Starts
(Canada Mortgage and Housing Corporation), MLS Average
Resale Prices (Canada Real Estate Association), Rigs Drilling
(Canadian Association of Oilwell Drilling Contractors) and
Bankruptcies (office of the superintendent of Bankruptcy
All historical data are subject to revision
January 30, 2015
Economics, Demography and Public Finance
© Copyright 2026
