
Etoposide-induced cell cycle delay and arrest
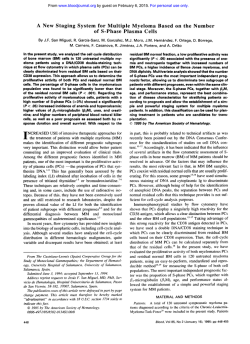
(D
(1994), 70, 914-921
921
J. Cwtcer
Br. J. Cancer (1994), 70, 914
Br.
C
MacmiUan Press Ltd., 1994
Macmillan
Press
Ltd.,
Etoposide-induced cell cycle delay and arrest-dependent modulation of
DNA topoisomerase H in small-cell lung cancer cells
P.J. Smith, S. Soues, T. Gottlieb, S.J. Falk, J.V. Watson, R.J. Osborne & N.M. Bleehen
MRC Clinical Oncology and Radiotherapeutics Unit, MRC Centre, Cambridge CB2 2QH, UK.
As an approach to the rational design of combination chemotherapy involving the anti-cancer
DNA topoisomerase II poison etoposide (VP-16), we have studied the dynamic changes occurring in small-cell
lung cancer (SCLC) cell populations during protracted VP-16 exposure. Cytometric methods were used to
analyse changes in target enzyme availability and cell cycle progression in a SCLC cell line, mutant for the
tumour-suppressor gene p53 and defective in the ability to arrest at the GI/S phase boundary. At concentrations up to 0.25 gmM VP-16, cells became arrested in G2 by 24 h exposure, whereas at concentrations 0.25-2 iLM
G. arrest was preceded by a dose-dependent early S-phase delay, confirmed by bromodeoxyuridine incorporation. Recovery potential was determined by stathmokinetic analysis and was studied further in aphidicolinsynchronised cultures released from GI/S and subsequently exposed to VP-16 in early S-phase. Cells not
experiencing a VP-16-induced S-phase delay entered G, delay dependent upon the continued presence of
VP-16. These cells could progress to mitosis during a 6-24 h period after drug removal. Cells experiencing an
early S-phase delay remained in long-term G2 arrest with greatly reducing ability to enter mitosis up to 24 h
after removal of VP-16. Irreversible G2 arrest was delimited by the induction of significant levels of DNA
cleavage or fragmentation, not associated with overt apoptosis, in the majority of cells. Western blotting of
whole-cell preparations showed increases in topoisomerase II levels (up to 4-fold) attributable to cell cycle
redistribution, while nuclei from cells recovering from S-phase delay showed enhanced immunoreactivity with
an anti-topoisomerase Ila antibody. The results imply that traverse of G,/S and early S-phase in the presence
of a specific topoisomerase II poison gives rise to progressive low-level trapping of topoisomerase IIE,
enhanced topoisomerase
availability and the subsequent irreversible arrest in G2 of cells showing limited
DNA fragmentation. We suggest that protracted, low-dose chemotherapeutic regimens incorporating VP-16
are preferentially active towards cells attempting G,/S transition and have the potential for increasing the
subsequent action of other topoisomerase II-targeted agents through target enzyme modulation. Combination
modalities which prevent such dynamic changes occurring would act to reduce the effectiveness of the VP-16
Smimary
component.
VP-16 (VP-16-213, etoposide), a semisynthetic derivative of
the naturally occumrng antimitotic agent podophyllotoxin,
has become established as one of the most active agents in
the treatment of small-cell lung cancer (SCLC). Preclinical
studies have provided evidence of schedule dependency
(Dombernowsky & Nissen, 1973; Wolfe et al., 1987) and the
critical importance of a prolonged schedule has been
confirmed in man by Slevin et al. (1989a,b). It has been
suggested that continuous low concentrations of VP- 16 are
required for optimal activity of the drug when administered
as a single agent (Clark et al., 1989), and very prolonged
schedules of oral VP-16 have been evaluated and found to be
effective (Hainsworth et al., 1989; Clark et al., 1990, 1991;
Einhorn et al., 1990; Johnson et al., 1990). Since druginduced, persistent cytostasis is an important clinical goal for
the control of rapidly proliferating tumours, we have studied
the dose dependency and kinetics of processes leading to
irreversible cell cycle arrest of SCLC cells to VP-16 following
protracted exposure in vitro.
VP-16 appears to initiate its cytotoxic action by acting as a
specific poison for the cell cycle-regulated protein DNA
topoisomerase II (Heck et al., 1988; Liu, 1989). DNA
topoisomerase II is a nuclear enzyme that effects unknotting,
decatenation or relaxation of supercoiled DNA molecules by
a process of introducing transient double-strand breaks
through which the strands of an intact helix can pass (Wang,
1985). Topoisomerase poisoning results in the trapping of
enzyme molecules on DNA as cleavable complexes and the
subsequent generation of potentially lethal lesions (Glisson &
Ross, 1987; Liu, 1989). The majority of laboratory studies
carried out with VP-16 have involved the use of acute
exposures of cultured cells to high doses of the drug.
Although this investigational approach may aid the study of
the immediate DNA-damaging effects of the agent and its
Correspondence: P.J. Smith.
Received 23 March 1994: and in revised form 4 July 1994.
relationship with topoisomerase II trapping, it does not
reflect the pharmacodynamics of the clinical situation in
which tumour cells typically undergo protracted exposure to
VP-16 (Miller et al., 1990). The intrinsic sensitivity of actively
proliferating tumour cells to topoisomerase II poisons
appears to depend in part on the availability of the target
enzyme (Liu, 1989; Smith & Makinson, 1989). The major
type II enzyme, topoisomerase Ila, is cell cycle regulated, and
as such its availability increases as cells progress towards
mitosis (Heck et al., 1988). Thus, protracted VP-16 exposure
would be expected to modulate the availability of the target
enzyme as a result of changes in cell cycle progression. The
study is pertinent to the use of low levels of VP-16 in the
control of tumour growth since changes in the expression of
topoisomerase II may play a central role in the inhibition of
cell cycle transit (Lock & Ross, 1990), the development of
drug resistance associated with low levels of target enzyme
and in defining chemosensitivity to other agents used in
combination regimens.
The responses of tumour cells to topoisomerase poisoning
are not dependent upon topoisomerase gene expression
alone. There appears to be a requirement for the p53 protooncogene-encoded protein both in the efficient activation of
apoptosis and in cell cycle arrest following exposure to
DNA-damaging anti-cancer agents or acute irradiation (Livingstone et al., 1992; Clarke et al., 1993; Lowe et al., 1993).
The p53 protein appears to act as an element in the operation of a G1/S checkpoint (Kastan et al., 1992; Lane, 1992),
whereby the induction of DNA damage causes the half-life of
the protein to increase, preventing S-phase entry and blocking the replication of damaged DNA. However, somatic
mutation of the p53 locus is a frequent occurrence in human
tumours (HolUstein et al., 1991), with small-cell lung cancer
showing one of the highest rates of p53 mutation (Takahashi
et al., 1989, 1991; Levine et al., 1991). Cancers with p53
mutations tend to respond to chemotherapy more weakly
than those showing wild-type alleles (Callahan, 1992).
Here we have explored the cell cycle arrest responses of a
EFFECTS OF ETOPOSIDE IN SCLC
SCLC cell line, with a defined p53 mutation, to continuous
exposure to VP-16. The objective was to determine the effects
of drug exposure on target enzyme availability as cells evade
the GI/S checkpoint, in addition to investigating the dose
dependency and kinetics of processes leading to irreversible
arrest.
Materials ad methods
Cell culture, synchronisaton and VP-16 treatments
The SCLC cell line NCI-H69/P (designated H69; originally
obtained from a patient with recurrent SCLC treated with
doxorubicin) was maintained in suspension culture in RPMI
medium supplemented with 10% fetal calf serum, I mM
glutamine and antibiotics and incubated at 37C in an atmosphere of 5% carbon dioxide in air. Ancilary experiments
confirmed that the H69 cell line used in these studies carried
a mutation in exon 5 (G to T at amino acid 171,P. Rabbitts,
personal communication). VP-16 (Vepesid; Bristol Myers
Pharmaceuticals, Syracuse, NY, USA) was provided as
34 mM stock solutions. Cells in exponential growth phase
were diluted (2 x I 0 cell ml-') in fresh growth medium and
VP-16 added to cultures following a 24 h growth period.
Cultures were resuspended by aspiration using a Pasteur
pipette and cell concentrations determined using a Coulter
counter. Partial synchrony in early S-phase was achieved by
incubating cells with aphidicolhn (APC; Sigma) at I Lg ml1for 24 h. Cells were released from early S-phase block by
washing cultures in prewarmed fresh medium followed by
incubation in fresh medium. When releasing blocked cells
into VP-16-containing medium, APC-treated cells were
washed with medium supplemented with VP-16.
Cell viability
Cells were plated in a 96-well microtitre plate (100 gl per
well) in the presence of varying concentrations of VP-16 and
incubated for 1-5 days at 37C. Viable cell number was
assessed in triplicate by a non-separation, chemiluminometric
assay (Cytolite Assay; Packard Instrument Company, Meriden, CT, USA) based upon the ability of cells with intact
membranes to bind a probe which is activated to produce
luminescence. Probe activation occurs in response to the
intracellular generation of reactive oxygen species through
electron-transferring reactions occurring in viable cells.
Briefly, 125 l of reduced coenzyme plus carrier (amplifier
solution) was added to each well and luminescence was
generated by the addition of 25 l1 of a chemiluminogenic
probe (activator solution) and measured in a TopCount
Microplate Luminescence Counter (Packard Instruments). A
calibration was carried out using a serial dilution of cells
from a sister culture to ensure linearity between viable cell
number and luminescence measured in counts s-'.
Cell cycle analysis and detection of mitotic subpopulations
Cells were stained with ethidium bromide (50igml'1) plus
0.125% Triton X-100 and ribonuclease (0.5pgml-') for
10 min prior to analysis. DNA fluorescence distributions
were analysed by a computer using a cell cycle phase-fitting
program, which assumes normal distributions for GI and
G2/M phase populations (Watson et al., 1987). A probability
function was calculated for the S-phase distribution based
upon the means and standard deviations of the GI and G2/M
phases. For stathmokinetic experiments, VP-16-treated and
control cultures were exposed to colmid (60 ng ml') in
order to induce mitotic arrest and low-scatter mitotic populations were analysed as described previously (Epstein et al.,
1988).
DNA strand breakage in single cells with respect to cell cycle
position
The technique depends upon accurate measurements of the
fluorescence intensities (corresponding to cellular DNA con-
915
tent) and volumes (corresponding to the extent of DNA
damage-induced unwinding of nuclear DNA) of nuclei denatured in agarose gels (Smith & Sykes, 1992). An MRC-600
scanning confocal microscope (BioRad, Hemel Hempstead,
UK), operating at its minimal confocal aperture, was used to
optically section the spherical nucleoid bodies. Volumes were
determined from mean diameter measurements of the digitised images accumulated under Kalman filtration to reduce
the signal-to-noise ratio. This process was aided by colourcoding pixel intensity ranges above a selected threshold for
the scanned image. DNA content was estimated by correcting the integrated fluorescence intensity of the nucleoid section showing the greatest diameter by the factor 2.22 x
radius. This procedure was carried out on randomly selected
nulceoids for each treatment condition.
DNA synthesis detected by bromodeoxyuridine (BrdUrd)
incorporation
Samples of VP-I6-treated (24h exposure) cells (1-10 x
106 cells) were pulsed with 20 LM BrdUrd (Sigma) for I h
under normal growth conditions. Cells were washed twice in
phosphate-buffered saline (PBS) before fixing in cold 70%
ethanol for 30 min on ice. Fixed cells were treated with 4 N
hydrochloric acid for 30 min at room temperature, washed in
sodium borate (0.1 M, pH 8.5), resuspended in 20 #1 of 0.5 %
Tween-20/PBS containing anti-BrdUrd antibody (Beckton
Dickinson) and held for 30 min at room temperature.
Antibody-treated samples were pelleted and resuspended in
0.5% Tween-20/PBS containing FITC-conjugated goat antimouse IgG (Tago, Burlingame, CA, USA; 8 pl H + L chains)
and held for 30 min at room temperature. Finally, cells were
pelleted and resuspended in PBS containing propidium iodide
(at a final concentration Sjgml-') to stain nuclear DNA.
Subsequent analysis and the use of fluorescence controls has
been described previously (Karn et al., 1989).
SDS polyacrylamide gel electrophoresis and Western blotting
Briefly, whole-cell lysates were prepared by direct lysis of
cells in hot (65'C) sample buffer (1.0 ml of 0.5 M Tris-Cl,
pH 6.8, 0.8 ml of glycerol, 1.6 ml of 10% SDS, 0.4 ml of
2-mercaptoethanol, 0.2 ml of 0.05% bromophenol blue in
8 ml final volume) at a concentration of I x I0 ocells 100 #1l'.
Lysates were boiled for 10 min, forced through a 21-gauge
needle four times to shear the DNA, and spun at
13,000r.p.m. in an Eppendorf centrifuge. The supernatant
was retained and 10#il loaded directly onto acrylamide gels
(7.5% acrylamide with a stacking gel of 4% acrylamide).
Gels were run at a constant 200 V in electrophoresis buffer
(25 mM Tris base, 0.2M glycine, 0.1% SDS) and either
stained with Coomassie blue to check for loading or soaked
for 30 min in transfer buffer [25 mM Tris base, 192 mM
glycine, 20% (v/w) methanol prior to transfer to nitrocellulose membranes (Schliecher & Schuell) using a Bio-Rad
mini transblot electrophoretic cell apparatus for 1 h at a
constant 100 V. Nitrocellulose blots were probed for 30 min
with rabbit polyclonal antibody raised against a C-terminal
peptide of topoisomerase II (Cambridge Research Biochemicals; 1:100 dilution in TBS). Blots were washed for
3 x 5 min with TTBS (0.1% Tween, 100 mM Tris, 0.9%
sodium chloride, pH 7.5) and incubated for 30 min with a
1:200 dilution of biotinylated mouse anti-rabbit antiserum
(Vector Laboratories). The biotinylated second antibody was
detected using a Vectastain ABC immunoperoxidase kit (Vector Laboratories), with diaminobenzidine and nickel chloride
as substrates.
Single-cell analysis of nuclear DNA topoisomerase HI content
Samples of VP-I6-treated (24 h continuous exposure) cells
were taken (approximately 1 x 10' cells) and washed with
nucleus buffer and permeabilised using the technique described previously (Minford et al., 1986). Briefly cells were
resuspended in nucleus buffer supplemented with 0.35%
916
PJ. SMITH et al.
Triton X-100 and 0.1 mm phenyl methyl sulphonyl fluoride
(PMSF), and agitated for 20 min at 4C. Permeabilised cells
were fixed in 50% methanol (v/v) and agitated for 30 min at
4C. Fixed cells were washed once in PBS and resuspended in
20 1I of anti-topoisomerase antibody (see above; 1:4 dilution)
and held for I h at room temperature. Antibody-treated samples were washed once in PBS and resuspended in 20 tl of
FITC-conjugated sheep anti-rabbit IgG (1:100 dilution;
Sigma Chemicals, whole molecule) and held at room
temperature for 30 min. Finally, samples were pelleted and
resuspended in PBS containing ribonuclease and propidium
iodide (5 g ml-') to stain nuclear DNA. Samples were
analysed by flow cytometry. Controls samples were processed
as above but without the first anti-topoisomerase H antibody
treatment. The analysis of samples by flow cytometry has
been described previously (Smith & Makinson, 1989) providing dual-fluorescence analysis of cell populations gated for
the elimination of debris and cell clumps. The right-angle
fluorescence (RF) parameters monitor DNA content (630 nm
RF) and second antibody binding (530 nm RF).
samples with the parallel control included in each treatment
group (Table I).
The data show that, although VP-16 alone results in the
accumulation of cells in G2 as a function of dose, there is no
evidence of trapping of cells in mitosis. The percentage of
cells that have attempted mitosis, in the presence of colcemid,
decreases as a function of dose and is approximately 1% at
2 >IM VP-16. There is no evidence of significant trapping of
percentage of cells in the combined GI and S-phase compartment r[.e. 100-(G2 + M)] for the low dose range (0.06250.25 gM VP-16), whereas a high dose (2 1.M) of VP-16 induces
a significnt delay in the delivery of cells to G2 and a
complete block to G2 exit (condition a in Table I). Parallel
lonn7
0
C
U
0
4
80
C
0
U
0
60
Resoks
0W
CD
Growth inhibition and cell cycle perturbations
Figure I shows the effects of VP-16 on H69 culture growth/
viability studied over a 5 day period of continuous drug
exposure. Doses of 0.25-0.5 iLM produced cessation of culture growth within the first 48 h of exposure with no evidence
of loss of metabolic function up to 8 FLM. However after 5
days' exposure there was a dline in viability at high doses
commensurate with the loss of membrane integrity as determined by vital dye staining methods (data not shown).
The results for repetitive cell cycle analyses are shown in
Figure 2a and b, in which a value of unity for relative
frequency indicates no overall change, with respect to the
control, in the percentage of cells within a given cell cycle
phase. At both time points, the proportion of cells in GI
decreased as a function of VP-16 dose up to I iLM. At 24 h,
G, emptying at low doses (0.0625-0.25 FM VP-16) was
accompanied by delay of cells in G2. At higher doses
(0.5-2 FM VP-16), there was reduced G2 accumulation owing
to the dose-dependent collection of cells in S-phase. By 48 h
the cohort of cells initially delayed in S-phase by the higher
doses of VP-16 appeared to have progressed through to G2,
with this S-phase emptying effct being most apparent for the
0.5 ylM VP-16 dose. Again at 48 h there was a reduced G2
accumulation at VP-16 doses >0.5 iLM owing to the dosedependent trapping of cells in S-phase.
In the subsequent studies the effects of low (0.25 jLM) and
high (2 gM) dose levels of VP-16 were compared. At the low
dose level, maximum G2 arrest is observed at 24 h without
significant S-phase delay. On the other hand, 2 1M VP-16
allows maximal G, emptying but induces significant S-phase
delay during the first 24 h exposure.
.0 40
Ba
A
I
L
r
0
Stathmokinetic analysis of cell cycle delay and recovery
Using the mitotic spindle inhibitor colcemid, it was possible
to investigate further the cell cycle perturbations caused by
VP-16 without the complications of cell division and resupply
of G,. Analysis of bivariate plots of right-angle scatter and
DNA content of cells permitted the identification of a low
light scatter population (LSP) in G2 representing cells entering mitosis (Epstein et al., 1988). The colemid exposure of
H69 cells was staggered to follow the number of cells attempting mitosis (i.e. escaping the G2 delay induced by VP16) in the presence of VP-16 or after release into VP-16-free
medium (Table I). The discrimination between G2 and M
populations is not absolute (Epstein et al., 1988), and the
average rate of cell cycle traverse may vary in multicellular
aggregates during the course of a 48 h incubation experiment
involving a centrifugation and resuspension/medium change
at 24 h. Thus it is important to compare VP-16-treated
I
I
J
L
1C)
20
0
0
0
*~
~
~
~
2
A
6
4
8
VP-16 concentration (pM)
Fgwe I VP-16 dose-dependent changes in H69 viable cell
number, relative to untreated controls, for different exposure
periods. Symbols: 0, 24 h; A, 48 h; 0, 5 days. Data are mean
values (± s.d.) for three experiments.
4
>.
o
COB
0 -.
0
ar
0-
a
3
2
1
U
0
af
.
.
.
... .........
.
0.1
1
.
10
VP-16 dose (pm x 24 h)
U
0
0-
cr
8
_
-
0 0
0-
cc
VP-16 dose (pM x 48 h)
Fugwe 2 Dose dependency of the H69 cell cycle perturbations
induced by continuous VP-16 treatment for 24 h (a) or 48 h (b).
Control samples gave mean values (± s.e. for 13 determinations)
of 40.5 ± 1.9, 38.4 ± 1.7 and 21.1 ± 0.8% cells in G,, S phase and
G2/M respectively. Data are mean values (± se) for 5
experiments. Symbols: 0. G,; A. S-phase; 0. G,.
EFFECTS OF ETOPOSIDE IN SCLC
917
Table I Stathmokinetic analyses of VP-16-induced cell cycle delay and
recovery
Total cells in cell cycle compartment for different
treatment and recovery periods (%)
0-48 hb
0-24 hk
0-24 hl
Exposure:
24-48 hc
Oh
Oh
VP-16
Recovery:
Cokcmid
(juM)
Compartment: G, M G2 M G, M
1.3
6.6 29.7
1.3 21.1
O
25.3
1.6 34.6
5.4 28.7
1.2
33.3
0.062
1.1
1.5 56.0 6.1 30.1
38.6
0.125
58.6
1.0 79.4 3.3 36.4
1.2
0.25
1.0 85.3 0.5
42.7 0.4 76.0
2.0
+
0
41.4 46.0 44.5 26.3 41.0 33.3
+
53.3 33.5 52.7 28.6 41.7 34.5
0.062
+
62.7 23.2 57.6 21.9 43.4 35.2
0.125
+
9.8 56.3 30.1
0.25
68.1 15.3 76.1
+
1.4 89.7
51.0
1.0 86.7 2.9
2.0
Data derived from a single representative experiment. 124 h continuous exposure
to VP-16 (colcemid added at t = Oh). b48 h continuous VP-16 exposure; cells
resuspended in their own media at 24 h (cobemid added at t = 24 h). C48 h
continuous VP-16 exposure; cells resuspended in fresh media at 24 h (colcemid
added at t=24h).
Table n Flow cytometric analysis of proportions of cells actively engaged in DNA synthesis
following 24 h exposure to VP-16
Cells in region (per cent of total) at end of 24 h VP-16 treatment
S (active)
S (inactive)
G2
GI
0
30.8 6.9
41.5 7.2
3.9 1.6
23.9 2.0
+
0
32.9 ± 0.9
10.2 ± 2.0
19.2 ± 3.6
37.3 ± 4.7
+
48.1 ±3.3
7.9 2.8
22.4 4.8
0.125
21.6 4.2
+
15.7 1.3
54.0 3.4
10.7 0.9
19.6± 3.9
0.25
+
11.0 4.2
19.7 1.9
52.7 2.5
16.0 3.1
0.5
+
11.1 1.2
2.0
10.9± 1.6
58.9 2.3
18.6 3.3
Mean data (± range) derived from two determinations.
VP-16
(JAM)
BrdUrd
pulse
-
studies (data not shown), which included a wild-type p53expressing human cell line (Smith et al., 1994), confirm that
the H69 cell line also shows a defect in arrest at GI/S
following acute X-irradiation (S. Soues & PJ. Smith manuscript in preparation). Collectively, the results are consistent
with the evasion of the G1/S checkpoint by VP-16-treated
H69 cells.
During the incubation period of 24-48 h for a continuous
(48 h; condition b in Table I) exposure to doses of <0.25 gAM
VP-16 there is evidence of cells attempting mitosis, whereas
at the 2 FLM concentration the majority of cells become trapped in G2. Thus, it appears that at low doses, over the first
48 h, cells are progressing through the cell cycle relatively
normally except that there is an increasing probability, with
time, of a given cell being trapped in G2. In contrast, at the
higher concentration, over the first 24 h period, a large proportion of cells are slowed down or blocked in S-phase with
a very high probability that any cell delivered to G2 will
remain trapped in that cell cycle compartment.
Cells released from a 24 h exposure to low doses of VP-16
(condition c in Table I) re-enter cycle during the subsequent
24 h incubation in fresh medium. This is in contrast to
high-dose VP-16-treated cells, which when released at 24h
continue to accumulate in G2 over the following 24 h period
and remain blocked in G2 with very few cells attempting
mitosis.
S-phase delay analysed by BrdUrd incorporation
Flow cytometric measurements of BrdUrd incorporation
were used to analyse S-phase delay in order to determine the
proportion of cells synthesising DNA in treated and untreated cultures. Gates were set around two regions on contour plots of DNA content and BrdUrd incorporation.
Region 1 contained cells that did not incorporate BrdUrd,
and this region was analysed by the standard cell cycle
phase-fitting programme and the calculated GI, 'inactive' S
and G2 percentages converted into percentages of total cells
within regions. Region 2 was designated 'active S-phase', as
this contained cells that incorporated BrdUrd above background levels. Typical results, shown in Table II, indicate
that with increasing VP-16 dose after 24 h there is an increase
in the percentage of cells engaged in DNA synthesis. The
reduced G2 arrest observed upon VP-16 treatment may arise
from a direct effect of the thymidine analogue on cell cycle
traverse. The contour plots show that the extent of BrdUrd
incorporation relative to position in S-phase is similar for
control and VP-16-treated cells (data not shown). Parallel
studies using thymidine incorporation also show that such
DNA synthesis detected in VP-16-treated cells is resistant to
the inhibitory effects of acute 1 h high-dose exposures to
VP-16 despite continued sensitivity to the DNA-protein
cross-link-ing action of such high doses of drug (data not
shown). The results consolidate the stathmokinetic results in
that at the 2 gM VP-16 dose level initially delayed cells
continue to traverse S-phase after a 24 h drug exposure in an
apparently normal manner. Importantly, the percentage of
cells in 'inactive' S-phase did not increase above the numbers
gated in control cultures in response to VP-16 treatment,
suggesting that no cells are actively blocked at 24 h in Sphase for any of the doses studied.
Cell cycle delay and recovery in synchronised cultures
Figure 3a and b shows the effects of VP-16 on the traverse of
S-phase as monitored by G2 accumulation. Asynchronous
cultures were compared with those released from partial
synchrony in early S-phase achieved by aphidicolin treatment. Control cells, released from G,/S synchrony, traverse
S-phase during the first 6 h of release, pass as a cohort
through G2 and re-enter GI by 24 h. Following release into
0.25 or 2 pAM VP-16 (Figure 3b), cells are delayed in S-phase
and accumulate in G2. After a 24 or 30 h VP-16 exposure
only cells exposed to the low dose (0.25 gM) can exit G2 and
918
P.J. SMITH et al.
o3n _
I
'U
7
a
15
S-
10
G1
1
E
II
0
5
U
0"l<0
.
.
.
4
.
8
.
.
12
Cld
CD
c
I
E
02
0 1
a
0
x
0-
0
E
:0
0
0 0
0
z
2
CD
I*
0
CD
C~4
c0
C')
Figue 3 Effects of VP-16 on S-phase traverse, monitored by G,
accumulation, for asynchronous H69 cells (a) and cells released
from synchrony G, S (b). Mean data derived from three independent experiments (s.e. <10%). Cultures were treated for 6, 24 or
30h with VP-16 at OsM ( =E), 0.25Mm ( ) or 2 .tM (_).
Following 24 or 30 h treatments cells were released for the
indicated recovery (R) period.
re-enter
GI. Synchronisation increases the number of cells
experiencing early S-phase during VP-16 exposure and
reduces the number of cells capable of recovery from G2
arrest compared with asynchronous cultures. Asynchronous
cultures contain fewer cells in early S-phase and show a
greater recovery from 0.25glM VP-16 compared with synchronised cultures. Cells exposed to 2 AM VP-16, under either
culture condition remain trapped in G2, indicating the essentially irreversible nature of the arrest for the lowest concentration capable of inducing an overall S-phase delay.
DNA damage as a function of cell cycle position
We have used an adaptation of the 'comet' assay (Singh et
al., 1988; Smith & Sykes, 1992) to detect DNA breakage
resulting from cleavage of trapped topoisomerase complexes
or secondary fragmentation events as monitored by the
nucleoid volume measurements. Figure 4 a-c shows the
essentially linear relationship between nucleoid volume and
DNA content for control cultures and the increase in the
proportion of cells with high DNA contents in VP-16-treated
cultures. The results reveal heterogeneity in the responses of
cells to VP-16, with only a few cells (<15%) showing low
levels of damage at 0.25 iM VP-16, whereas the majority of
cells (>80%) show substantial damage at 2glM VP-16. The
GI fraction in cultures exposed to 2 gM VP-16 was too
infrequent for detailed analysis. However, some cells with
DNA contents approximating to S-phase showed no
significnt levels of DNA damage and may represent a subpopulation not undergoing either S-phase delay or elevation
of damage levels.
DNA content
(total fluorescence intensity, arbitrary units)
Figue 4 Induction of DNA damage in individual H69 cells by
24 h exposure to VP-16 as a function of total cellular DNA
content determined by nucleoid volume (halo assay). a, Control
cells, line fitted by linear regression (y = 0.934 + 0.388x,
R2=0.718; reproduced in b and c). b and c, 0.25 gM or 29LM
VP-16 x 24 h respectively.
VP-16-induced changes in topoisomerase II availability
Whole population studies Immunoblots of whole-cell preparations of H69 cultures exposed to VP-16 for 24 h showed
a major immunoreactive band with a mean molecular weight
(± s.d. for ten determinations) of 171.3 ± 2.9 kDa corresponding to that expected for the p170 form of human DNA
topoisomerase IIa. An increase in the intensity of the p170
band above control was observed for all VP-16-treated samples, and densitometry (Figure 5) was used to quantify the
changes with respect to control samples. The p170 band
intensity increased with drug dose and exposure period,
reaching a maximum of 3.7-fold at doses of l-2 M VP-16
with a reduction in band intensity evident at 8 LM VP-16.
Single-cell analysis and cell cycle distribution To relate the
cell cycle perturbations to the changes in topoisomerase lIIK
we have utilised a flow cytometric technique (Smith &
Makinson, 1989), which provides a simultaneous analysis of
DNA content and nuclear DNA topoisomerase II. Initial
studies established the cell cycle distribution of topoisomerase
II. Bivariate plots of DNA versus topoisomerase II content
revealed the expected distribution of the p170 form of DNA
topoisomerase II throughout the cell cycle: low levels in GI,
919
EFFECTS OF ETOPOSIDE IN SCLC
-
4_
r-.
a)
DIL)
0._
ED
-
axCZ
-
r =n
co
DL- --
w-
_Z E *4D
C _)
ec0
4-
CD
a-
cc
I
._
E
VP-16 dose (pM)
Figure 5 Densitometric analysis of the p170 topoisomerase II
band for Western blots for H69 whole-cell preparations. Cultures
were exposed to VP-16 for 24 h (0) or 48 h (0). Data are mean
values (± s.d.) derived for four independent blots.
0
f
W
0
O
W
,
Cell cycle
fraction
in
6 Histograms of VP- I 6-induced changes
II. relative to control levels, in cells within gated
cell cycle compartments measured 24 h after continuous exposure
to 2 kM VP-16 for 24h. Data are means (± s.e.) of the corrected
Figure
topoisomerase
levels increasing through S-phase, high levels in G2 with a
subset in G2 showing the highest levels before recycling into
G,. Setting the anti-topoisomerase II antibody staining of GI
cells at unity, signal was increased 1.7 ± 0.18-fold and
3.47 ± 0.61-fold for S-phase and GJM cells respectively
(± s.d.; three experiments). Extensive redistribution of cells
in the cell cycle by exposure to colcemid (see above) for 24 h
gave corresponding values of 1.85 ± 0.28 and 3.47 ± 0.19 for
S-phase and GJM cells respectively, showing that the
analysis for immunoreactivity is independent of the proportions of cells within the gated regions. The control data (not
shown) demonstrate the progressive increase in nuclear
enzyme content through the cell cycle and support the interpretation that the changes seen above by Western blotting
represent, at least in part, cell cycle redistribution. DNA
content analysis for drug-treated cells (2 gM VP-16 for 24 h)
clearly showed the expected VP-16-induced accumulation of
cells in G, and S phase. DNA distributions were divided into
six compartments of increasing DNA content representing:
GI, early S, early to mid S, mid to late S, late S and G2/M
fractions respectively (Figure 6). Median 530 nm fluorescence
intensities were calculated for each gated compartment, corrected for background fluorescence and expressed as a value
relative to control samples (Figure 6). No increase above
control values was observed for cells exposed to 0.255kM
VP-16 (data not shown). At 2 gM VP-16 there is an unscheduled increase in nuclear topoisomerase II content in
S-phase and in GJ/M.
median values derived from four independent experiments.
Median 530 nm RF values were background corrected and expressed as a ratio of the value obtained from unperturbed control
cells such that a value of zero indicates no change in topoisomerase Il-associated immunofluorescence compared with the
control. S phase has been divided into four equal compartments
of increasing DNA content.
GI/S but progressive accumulation at the GJM boundary
(S. Soues & P.J. Smith, unpublished data). The results
obtained with protracted VP-16 exposure also reveal an
inability to arrest at GI/S. In viewing the relevance of the
concentration dependency of VP-16 effects, it is important to
relate the drug doses used in this model study with those
found in clinical practice. In a study by Slevin et al. (1989ab),
pharmacokinetic measurements on previously untreated
patients with SCLC demonstrated that a 5 day oral regimen
could maintain plasma VP-16 levels above 1.75kM. Thus the
present study describes cellular effects at clinically relevant
doses of VP-16. The relationship between S-phase delay and
subsequent cellular recovery from G2 arrest was studied in
synchronised cells exposed to VP-16 upon release from the
GI/S transition point. Cells not experiencing a VP-16-induced
S-phase delay entered a long-term G2 arrest dependent upon
the continued presence of VP-16. Removal of VP-16 resulted
in the progression of the majority of these cells through
mitosis during the 6-24h period after drug removal. Cells
experiencing a significant VP-16-induced S-phase delay
remained in long-term G, arrest with no evidence of progresat
Dicussion
sion from G2.
This study has demonstrated the strict dose dependency of
the cell cycle perturbations underlying the cytostatic action of
VP-16 on a human SCLC cell line. The disruption of the
traverse of S-phase, in particular a delay in early S-phase
progression appears to be a key component in the irreversible
cytostatic action of VP-16. Continuous exposure to low doses
of VP-16 ( .0.25 luM) results in significant enrichment of cells
within cell cycle compartments which normally express high
levels of topoisomerase II. VP-16 induced a cell cycle block
in G2 with a significant delay of cells in S-phase being
apparent at high VP-16 concentrations. Similar observations
have been reported for other human cells including transformed fibroblasts (Smith et al., 1986), lymphoblasts (Kalwinsky et al., 1983) and breast tumour cells (Epstein et al.,
1988).
Dysfunction of the p53 proto-oncogene would be expected
to contribute to a loss of the ability of cells to arrest at GI/S
in response to DNA damage. X-irradiation of the p53
mutant cell line H69 resulted in no detectable arrest of cells
Continuous exposure to an irreversibly cytostatic concentration of VP-16 also results in an increased immunoreactivity of nuclei to an anti-topoisomerase II antibody. We
suggest that two effects can account for this observation.
First, the principal effect is an unscheduled increase in
topoisomerase II levels. This increase arises from the delay of
cells in S-phase during a period in which there is a scheduled
increase in topoisomerase IIa. Accordingly, there may be no
cellular feedback to link cell cycle progression to topoisomerase levels once a cell is committed to active DNA synthesis. Such a model should be examined with DNA
synthesis-inhibiting agents that are not discrete
topoisomerase poisons and for the modulation of other cell
cycle-regulated proteins. Second, a minor component of the
increase may represent enhanced stabilisation of cleavable
complexes. In support of this latter possibility is the observation that the sensitive nucleoid expansion method, performed
under conditions which cleave DNA at trapped complexes,
reveals significant levels of DNA fragmentation in delayed
cells. However, the levels of cleavage detected are commen-
920
P.J. SMITH et al.
surate with only low levels of complex trapping detectable by
the conventional K+SDS precipitation method (P.J. Smith &
S.J. Falk. unpublished data).
It does not appear that the fragmentation revealed by
nucleoid scanning represents typical apoptosis given the
results of the viability measurements and our observation
that acridine orange-stained preparations showed that <1%
of cells displayed typical apoptotic nuclei. Furthermore, extractions of low molecular weight DNA fractions from VP16-treated cell populations showed no detectable levels of
nucleosome laddering as assessed by conventional agarose gel
electrophoresis (P.J. Smith, unpublished data). The lack of
early induction of apoptosis is not surprising since it has
been reported that SCLC cell lines may differ in their ability
to express VP-16-induced apoptosis (Okamoto-Kubo et al.,
1994) and the potential requirement of functional p53 for
efficient induction (Clarke et al., 1993; Lowe et al., 1993).
Additional studies are required to determine whether the
damage visualised by nucleoid scanning represents target
enzyme trapping or a secondary process of preapoptotic,
perhaps DNA domain-limited, fragmentation.
We suggest that the minimal cytotoxic dose threshold for
low-dose, protracted VP-16 exposures is defined by the dose
intensity required to impose an early S-phase delay rather
than effect G2 arrest per se. In the in vivo situation, the
maintenance of a low but bioactive drug concentration would
allow the continued recruitment of tumour cells into S-phase
delay as they opt to enter the cell cycle since it is unlikely
that the G,, S checkpoint is functional in SCLC and GI
emptying is not affected even by high drug doses. It is
evident that SCLC cells can overcome the initial restriction
to early S-phase traverse even in the continued presence of
VP-16 and cells eventually enter a G, delayed state with
enhanced availability of topoisomerase II.
Clinical studies have supported the concept that prolonged
low-dose VP-16 treatment offers the combined benefits of
efficacy and low toxicity. On the other hand, it is clear that
such treatment will not break new ground in terms of increasing response duration or survival either when used alone
(Slevim et al., 1989a,b) or as part of a conventionally
designed regimen (Murphy et al., 1992). However, prolonged
schedules of VP-16 treatment may be a foundation for novel
combination regimens which capitalise on the consequences
of continuous topoisomerase II poisoning such as cell cycle
synchronisation or modulation of topoisomerase II levels.
This hypothesis was evaluated by exposing H69 cells to
VP-16 for 24 h prior to treating washed cultures with selected
agents and assaying growth potential using the conventional
MTT assay (data not shown). The results indicated that
VP-16 pretreatment results in a greater than 2-fold enhancement of growth inhibition potential for cisplatin, Amsacrine
(mAMSA) and VP-16, while the other agents (camptothecin,
mitoxantrone and doxorubicin) gave values of less than 1.3fold enhancement.
The absence of an effect on sensitivity to the topoisomerase I poison camptothecin is consistent with the non-cell
cycle-regulated nature of the target enzyme (Heck et al.,
1988). VP-16 pretreatment did not interfere with the cytotoxic potential of the topoisomerase poisons doxorubicin and
mitoxantrone, suggesting that the initial capacity to induce
topoisomerase II cross-linking not being an important factor
in the cytotoxic action of anthracyclines and related drugs
(Fox & Smith, 1990; Smith et al., 1990). The >2-fold
enhancement of cytotoxicity observed for the topoisomerase
II poisons mAMSA and VP-16 is itself consistent with the
effects of topoisomerase II modulation. The observations of
enhanced cisplatin sensitivity is interesting given the capacity
of this agent to induce DNA-DNA and DNA-protein
cross-linking in what may be topologically compromised
DNA molecules in VP-16-pretreated cells.
The implications for cancer chemotherapy are that
dynamic changes in cell cycle distribution and target enzyme
presentation in tumour cells exposed for protracted periods
to low doses of VP-16 may offer novel opportunities for the
introduction of other agents in combined regimens. The
single-cell analytical approach described here offers a method
of monitoring the effects of chronic VP-16 exposure in vivo
within defined tumour target populations.
References
CALLAHAN. R. (1992). p53 mutations, another breast cancer prognostic factor. J. Natl Cancer Inst.. 84, 826-827.
CLARK. P.1. JOEL. S.P. & SLEVIN. M.L. (1989). A pharmacokinetic
hypothesis for the clinical efficacy of etoposide in small cell lung
cancer. Proc. Am. Soc. Clin. 02col.. 8, 66.
CLARK. P.I.. COTTIER. B.. JOEL. S.P.. THOMPSON. P.I. & SLEVIN.
M.L. (1990). Prolonged administration of single-agent oral
etoposide in patients with untreated small cell lung cancer. Proc.
Am. Soc. Clin. Oncol.. 9, 226.
CLARK. P.I.. COTTIER. B.. JOEL. S.P. & SLEVIN. M.L. (1991). Two
prolonged schedules of single-agent oral etoposide of differing
duration and dose in patients with untreated small cell lung
cancer. Proc. Am. Soc. Clin. Oncol.. 10, 268.
CLARKE. A.R.. PURDIE. C.A.. HARRISON. DJ.. MORRIS. R.G.. BIRD.
C.C.. HOOPER. M.L. & WYLLIE. A.H. (1993). Thymocyte apoptosis induced by p53-dependent and independent pathways.
Nature, 362, 849-852.
DOMBERNOWSKY. P. & NISSEN. N.I. (1973). Schedule dependency of
the antileukaemic activity of the podophyllotoxin-derivative VP16-213 (NSC-141540) in L1210 leukaemia. Acta Pathol. Microbiol. Scand., 81, 715-724.
EINHORN. L.H.. PENNINGTON, K. & MCCLEAN. J. (1990). Phase II
trial of daily oral VP-16 in refractory small cell lung cancer: a
Hoosier Oncology Group study. Semin. Oncol.. 17 (Suppl. 2).
32-35.
EPSTEIN. R.J.. WATSON. J.V. & SMITH. PJ. (1988). Subpopulation
analysis of drug-induced cell-cycle delay in human tumour cells
using 90' light scatter. Cxlometr, 9, 349-358.
FOX. M.E. & SMITH. PJ. (1990). Long-term inhibition of DNA
synthesis and the persistence of trapped topoisomerase II complexes in determining the toxicity of the antitumour DNA intercalators mAMSA and mitoxantrone. Cancer Res., 50,
5813-5818.
GLISSON. B.S. & ROSS. W.E. (1987). DNA topoisomerase II: a primer
on the enzyme and its unusual role as a multidrug target in
cancer chemotherapy. Pharmacol. Ther.. 32, 89-106.
HAINSWORTH. J.D.. JOHNSON. D.H.. FRAZIER. SR. & GRECO, F.A.
(1989). Chronic daily administration of oral etoposide - a phase I
trial. J. Clin. Oncol., 7, 3%-401.
HECK. MM., HITTELMAN, W.N. & EARNSHAW. W.C. (1988). Differential expression of DNA topoisomerases I and II during the
eukaryotic cell cycle. Proc. Natl Acad. Sci. UISA. 85,
1086-1090.
HOLLSTEIN, M., SIDRANSKY, D., VOGELSTEIN, B. & HARRIS, C.C.
(1991). p53 mutations in human cancers. Science, 253, 49-53.
JOHNSON, D.H., GRECO, FA.. STRUPP. J., HANDE, K.R. & HAINSWORTH. J.D. (1990). Prolonged administration of oral etoposide
in patients with relapsed or refractory small cell lung cancer a
phase II trial. J. Clin. Oncol., 8, 1613-1617.
KALWINSKY, D.K., LOOK, AT., DUCORE, J. & FRIDLAND. A.
(1983). Effects of Epipodophyllotoxin VP-16-213 on cell cycle
traverse DNA synthesis and DNA strand size in cultures of
human leukemic lymphoblasts. Cancer Res., 43, 1592-1597.
KARN, J, WATSON, J.V., LOWE, A.D.. GREEN, SM. & VEDECKIS. W.
(1989). Regulation of cell cycle duration by c-inc levels.
Oncogene, 4, 773-787.
KASTAN, M.B., ZHAN, Q., EL-DEIRY. W.S., CARRIER, F., JACKS. T..
WALSH, W.V., PLUNKETT, B.S., VOGELSTEIN, B. & FORNACE. Jr.
AJ. (1992). A mammaln cell cycle checkpoint pathway utilizing
p53 and GADD45 is defective in ataxia-telangiectasia. Cell, 71,
587-597.
LANE. D.P. (1992). p53, guardian of the genome. Nature. 358,
15-16.
LEVINE. AJ.. MOMAND. J. & FINLAY. C.A. (1991). The p53 tumour
suppressor gene. Nature, 351, 453-456.
LIU. L.F. (1989). DNA topoisomerase poisons as antitumour drugs.
Annu. Rev. Biochem., 58, 351 -375.
LIVINGSTONE, L.R., WHITE, A., SPREOUSE, J., LIVANOS, E., JACKS.
T. & TLSTY. T.D. (1992). Altered cell cycle arrest and gene
amplification potential accompany loss of wild-type p53. Cell. 70,
923-935.
EFFECTS OF ETOPOSIDE IN SCLC
LOCK. R.B. & ROSS. W.E. (1990). Possible role for p34cdc2 kinase in
etoposide-induced cell death of Chinese hamster ovary cells.
Cancer Res., 50, 3767-3771.
LOWE, S-W., RULEY, H.E., JACKS, T. & HOUSMAN. D.E. (1993).
p53-dependent apoptosis modulates the cytotoxicity of anticancer
agents. Cell, 74, 957-%7.
MILLER. AA., STEWART, C.F. & TOLLEY, E.A. (1990). Clinical pharmacodynamics of continuous-infusion etoposide. Cancer
Chemother. Pharmcol., 25, 361-366.
MINFORD, J., POMMIER, Y., FILIPSKI, J., KOHN, KW., KERRIGAN,
D., MATTERN, M., MICHAELS, S., SCHWARTZ, R. & ZWELLING,
L.A. (1986). Isolation of intercalator-dependent protein-linked
DNA strand cleavage activity from cell nuclei and identification
as topoisomerase II. Biochemistry, 25, 9-16.
MURPHY. P.B., HAINSWORTH, J.D., GRECO, F-A., HANDE, K.R..
DEVORE, R.F. & JOHNSON, D.H. (1992). A phase II trial of
cisplatin and prolonged administration of oral etoposide in extensive stage small cell lung cancer. Cancer, 69, 370-375.
OKAMOTO-KUBO, S., NISHIO, K., HEIKE, Y., YOSHIDA, M.,
OHMORI, T. & SAUIO, NAGAHIRO, S. (1994). Apoptosis induced
by etoposide in small-cell lung cancer cell lines. Cancer
Chemother. Pharmnaol., 33, 385-390.
SINGH, N.P., MCCOY, M.T., TICE, R.R. & SCHNEIDER, E.L. (1988). A
simple technique for quantitation of low levels of DNA damage
in individual cells. Exp. Cell Res., 175, 184-191.
SLEVIN, M.L., CLARK, P.I., JOEL, S.P., MALIK, S., OSBORNE, RJ.,
GREGORY, W.M., LOWE, D.G., REZNEM R-H. & WRIGLEY,
P.F.M. (1989a). A randomised trial to evaluate the effect of
schedule on the activity of etoposide in small cell lung cancer. J.
Clin. Oncol., 7, 1333-1340.
SLEVIN, M.L., CLARK, P.I., JOEL, S.P., MALIK, S., OSBORNE, RJ.,
GREGORY, W.M., LOWE, D.G., REZNEK, RH. & WRIGLEY,
P.F.M. (1989b). A randomised trial to examine the effect of more
extended schedulng of etoposide administion in small cell lung
cancer. Proc. Am. Soc. Clin. Oncol., 8, 236.
921
SMITH, PJ. & MAKINSON. T.A. (1989). Cellular consequences of
overproduction of DNA topoisomerase II in an ataxia-telangiectasia cell line. Cancer Res., 49, 1118-1124.
SMITH, PJ. & SYKES, H. (1992). Simultaneous measurement of cell
cycle phase position and ionizing radiation-induced DNA strand
breakage in single humen tumour cells using laser scanning confocal imaging. Int. J. Radiat. Biol., 61, 553-560.
SMITH, PJ., ANDERSON, C.O. & WATSON. J.V. (1986). Predominant
role for DNA damage in etoposide-induced cytotoxicity and cell
cycle pertubation in human SV40-transformed fibroblasts.
Cancer Res., 46, 5641-5645.
SMITH, PJ., MORGAN, SA., FOX, M.E. & WATSON, J.V. (1990).
Mitoxantrone-DNA binding and the induction of topoisomerase
II associated DNA damage in multidrug-resistant small cell lung
cancer cells. Biochem. Pharmacol., 40, 2069-2078.
SMITH, PJ.. SOUES, S., FALK, SJ. & HILL, B.T. (1994). GI!S checkpoint evasion and resistance to a topoisomerase II poison (doxorubicin) in human breast tumor cell lines. Proc. Am. Assoc.
Cancer Res., 35, A147.
TAKAHASHI. T.. NAU. M.M.. CHIBA. I.. BIRRER, MJ.. ROSENBERG.
R.K., VINOCOUR. M., LEVFIT, M.. PASS, H., GAZDAR, AF. &
MINNA. J.D. (1989). p53: a frequent target for genetic abnormalities in lung cancer. Science, 246, 491-494.
TAKAHASHI, T.. SUZUKI, H., HIDA. T.. SEKIDO, Y.. ARIYOSHI, Y. &
UEDA. R. (1991). The p53 gene is very frequently mutated in
small-cell lung cancer with a distinct nucleotide substitution pattern. Oncogene, 6, 1775-1778.
WANG, JC. (1985). DNA topoisomerases. Annu. Rev. Biochem., 54,
665-697.
WATSON. JW.. CHAMBERS, S.H. & SMITH, PJ. (1987). A pragmatic
approach to analysis of DNA histograms with a definable GI
peak. Cv-tometry, 8, 1-8.
WOLFE. SN., GROSH. W.W., PRATER. K. & HANDE, KR. (1987). In
vitro pharmacodynamic evaluation of VP-16-213: implications for
chemotherapy. Cancer Chemother. Pharmacol., 19, 246-249.


© Copyright 2026