
A New Staging System for Multiple Myeloma Based on the
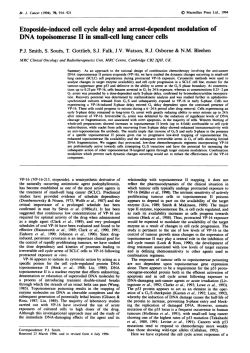
From www.bloodjournal.org by guest on February 6, 2015. For personal use only. A New Staging System for Multiple Myeloma Based on the Number of S-Phase Plasma Cells By J.F. San Miguel, R. Garcia-Sanz, M. Gonzalez, M.J. Moro, J.M. Hernandez, F. Ortega, D. Borrego, M. Carnero, F. Casanova, R. Jimenez, J.A. Portero, and A. Orflo In the present study, we analyzed the cell cycle distribution of bone marrow (BM) cells in 120 untreated multiple myeloma patientsusing a DNA/CD38 double-stainingtechnique at flow cytometryin which plasma cells (PCs) can be clearly discriminated from residual BM cells based on their CD38 expression. This approach allows us t o determine the proliferative activity of both PCs and residual normal BM cells. The percentage of S-phase cells in the myelomatous population was found t o be significantly lower than that of the residual normal BM cells ( P < .001). Regarding the proliferative activity of myelomatous cells, patients with a high number of S-phase PCs (>3%) showed a significantly (P< .05) increased incidence of anemia and hypercalcemia; higher values of P,-microglobulin (&M), urea, and creatinine; and higher numbers of peripheral blood natural killer cells, as well as a poor prognosis as assessed both by response duration and overall survival. With respect t o the residual BM normalfraction, a low proliferative activity was significantly ( P < .05) associated with the presence of anemia and neutropenia together with increased numbers of BM PCs, a higher incidence of Ben- Jones myelomas, and DNA diploidy. Multivariate analysis showed that the number of S-phase PCs was the most importantindependent prognostic factor, allowing us t o discriminate two subgroups of patients withdifferent prognoses, even within the same clinical stage. Moreover, the S-phase PCs, together with &M, age, and performance status, represent the best combination of disease characteristics for stratifying patients according t o prognosis and allow theestablishment of a simpleandpowerfulstaging system formultiple myeloma patients. In addition, this classification can be used for planning treatment in patients who are candidates for transplantation. 0 1995 by The American Societyof Hematology. I NCREASED USE of intensive therapeutic approaches for in part, this is probably related to technical artifacts as was recently been pointed out by the DNA Consensus Conferthe treatment of patients with multiple myeloma (MM) ence for the standardization of studies oncell DNA conmakes the identification of different prognostic subgroups tent.""' Accordingly, it has been indicated that the influence very important. This distinction would allow better patient of several artifacts in the flow cytometric assessment of Scounseling and an improved evaluation of clinical trials. phase cells in bone marrow (BM) of MM patients should be Among the different prognostic factors identifiedin MM resolved in advance. Of the factors that may influence the patients, one of the most important is the proliferative activresults, the most relevant fact is that, in MM BM samples, ity of plasma cells (PCs) -the proportion of PCs that synPCs coexist with residual normal cells that are usually prolifthesize This has generally been assessed by the erating. For this reason, some have used simultalabeling index (LI) obtained after incubation of cells in the presence of tritiated thymidine"' or brom~deoxiuridine."~ neous staining of DNA and cytoplasmic Ig to discriminate PCs. However, although being of help for the identification These techniques are relatively complex and time-consumof aneuploid DNA peaks, the separation between PCs and ing and, in some cases, include the use of radioactive isonormal residual cells that this technique provides is not suftopes. Because of this, they have not been extensively used ficient for cell-cycle analysis purposes. and are still restricted to research laboratories, despite the Immunophenotypical studies by flow cytometry have proven clinical value of the L1 for both the identification shown that PCs display a singularly high reactivity for the of patient subgroups with different and for the CD38 antigen, which allows a clear distinction between PCs differential diagnosis between MM and monoclonal and the other BM cell population^.""^ Taking advantage of gammopathies of undetermined ~ignificance.~.' this strong reactivity for the CD38 antigen detected in PCs, In recent years, flow cytometry has provided new insights we have used a double DNAKD38 staining technique in into the biology of neoplastic cells, including cell-cycle analwhich PCs can be clearly discriminated from residual BM ysis. Although several studies have analyzed the cell-cycle cells based on their CD38 expression. Thus, the cell-cycle distribution in different hematologic malignancies, quite distribution ofMM PCs can be calculated separately from variable and discrepant results have been obtained; at least that of the residual cells.I8 In thepresent study, we have evaluated the proliferative activity of both myelomatous PCS and residual normal BM cells in 120 untreatedmyeloma From The Castelano-Leone5 (Spain) Cooperative Group for the Study of Monoclonal Gammopathies; the Department of Hematolpatients, using an easy-to-perform, standardized and reproogy, University Hospital of Salamanca, University of Salamanca, ducible method'x," for measuring the S-phase of both cell Salamanca, Spain. populations. The most important independent prognostic facSubmitted June 3, 1994: accepted September 13, 1994. tor was the proportion of S-phase PCs, which together with Address reprint requests to Jesus F. San Miguel, MD, PhD, SerB,-microglobulin@,M), age, and performance status alvicio de Hematologia, Hospital Universitario de Salamanca, Paseo lowed the establishment of a simple and powerful staging de San Vicente, 58-182, 37007, Salamanca, Spain. system for MM patients. The publication costs of this article were defrayed in part by page charge payment. This article must therefore be hereby marked "advertisement" in accordance with 18 U.S.C. section 1734 solely to indicate this fact. 0 1995 by The American Society of Hematology. 0006-4971/95/8502-0134$3.00/0 440 MATERIAL AND METHODS Patients. A total of 120 untreated symptomatic myeloma patients diagnosed according to the criteria of the Chronic-LeukemiaMyeloma-Task-ForceZowere included in the present study. Patients Blood, Vol 85, No 2 (January 15), 1995: pp 448-455 From www.bloodjournal.org by guest on February 6, 2015. For personal use only. PROGNOSIS IN MULTIPLE MYELOMA were treated according to the protocol of the Spanish cooperative group PETHEMA” which includes either melphalan and prednisone (43% of cases) or alternating cycles of VCMPNBAP (57% of cases). No significant differences were observed regarding the treatment used.’’ The median survival for the whole series was 37 months. In each patient, the most relevant clinical and laboratory disease characteristics documented at diagnosis were evaluated for their prognostic significance. These included clinical features (age, sex, performance status according to the Eastern Cooperative Oncology Group (ECOG) scale, bone pain, loss of weight, the presence of hepato-splenomegaly and the existence of plasmacytomas), hematologic parameters (hemoglobin, white blood cell [WBC] and platelet counts, and erythrocyte sedimentation rate [ESR]), serum biochemical data (creatinine, urea, calcium, lactic dehydrogenase [LDH], and PZMlevels), electrophoretic characteristics (total proteins, albumin, type of monoclonal (M) component and the presence of urine Ig light chains), percentage of BM plasma cells (PCs), and the presence or absence of bone lesions. In addition, patients were grouped into clinical stages according to Dune and Salmon’s’’ criteria. The median age of the cohort studied was 69 years (range, 38 to 91). with 62 males and 58 females. According to their clinical stages, patients were distributed as follows: LA, 6%; IIA, 24%; IIB, 2%; IIIA, 52%; IIIB, 16%. A serum creatinine 2 2 mg/dL was present in 18% of patients. Serum calcium was greater than 11 mg/dL in 25% of patients. A monoclonal serum component was found in 86% of patients: IgC, 55%; IgA, 30%; IgD, 1%. The remaining 13% had Bence Jones myeloma. In1% of the patients, no monoclonal serum protein or monoclonal urine protein was identified. The serum monoclonal light chain was K in 63% and X in 37%. Urine immunoelectrophoresis was performed in all patients. In 45% of the cases, a urine monoclonal light chain was detected. Criteria fur respunse. An objective response (OR) was defined as ( l ) a reduction of 50% or more of the M component, (2) improvement in performance status by at least two grades, and (3) a decrease of greater than 50% in the measured cross-sectional area of plasmacytomas. Furthermore, the size and number of lytic bone lesions should not have increased, and correction of hypercalcemia (< 11.O mgldL), anemia (>9 mg/dL),and hypoalbuminemia (>3.5g/dL) should also have occurred. Those patients who fulfilled all the above criteria, but who had less than 50% reduction of M component were considered to have had a partial response (PR). When the criteria for an OR or PR were not fulfilled, the case was considered a treatment failure.” Patients who died before completion of the proposed treatment were considered early deaths. Within the group of patients with objective response, those who had no detectable M component and less than 5% of BM PCs were considered complete responses. Finally, relapse was defined as an increase of greater than 50% from the lowest level of serum M component achieved with the initial therapy, an increase in size or number of lytic bone lesions, and the development of extraosseus plasmacytomas, anemia, and/or hypercalcemia. Overall survival (OS) was considered from the moment of diagnosis to the moment of death, and response duration (D), from the moment at which response was obtained until the relapse. ~ z levels. M Serum PzM levels were measured by a radioimmunoassay method (Immunotech SA, Marseille, France). The upper limit in 20 sex- and age-matched healthy individuals was 1.6 pg/ mL. In the present series of MM patients, the mean value was 5.8 2 5.1 pglmL (median value, 4.1 pg/mL). DNAploidy studies. To analyze the presence or absence of DNA aneuploidy, the technique of Vindelov et al’’ was used, Measurements were performed on a FACScan flow cytometer (Becton Dickinson, San JosC, CA) for at least 10,OOO eventdsample, using the 449 CellFit software program (Becton Dickinson). In the present series, 56% of patients had DNA hyperdiploidy, and 2% were hypodiploid. Cell cycle analysis. For cell-cycle analysis a double-staining procedure using CD38 and propidium iodide (PI) was used. Briefly, between 100 and 200 p L of diluted whole BM containing 0.5 to 1 X lo6 WBCL was placed in the bottom of the tube. Cells were then incubated for 15 minutes at room temperature with 10 pL of the GR7A4 (CD38) monoclonal antibody (MoAb), washed once (5 minutes, 1,900 rpm) in phosphate-buffered saline (PBS) and incubated for another 15 minutes in the dark (room temperature) with an antimouse Igs MoAb (F[ab’]’ fragments) (Dakopatts, Copenhagen, Denmark). Afterwards, 2 mL of ammonium chloride was added and cells incubated in the dark for another 10 minutes (room temperature). Cells were then washed once in 1 mL of sodium citrate buffer and resuspended in 200 pL of sodium citrate buffer. Afterwards, 1.5 mL of solution B, containing RNAse was added and cells incubated for another 10 minutes period in the dark atroom temperature. Finally, 1.5 mL of solution C, containing PI, was added and another incubation for at least 10 minutes in the dark (room temperature) was performed. Measurements were performed within 30 minutes after the technique was finished ona FACScan flow cytometer using the CellFit software, and counting at least 10,ooO cellslsample. The percentage ofboth CD38 strong-positive cells andthe remaining cell populations were calculated after excluding cell doublets on a FL2-AreaFL2-Width dot plot using the PAINT-A-GATE-PLUS software (Becton Dickinson). The proportion of cells in the different cell-cycle phases was calculated using the RFIT mathematical model included in the CellFit software after excluding cell doublets and gating on boththe CD38 strong-positive and remaining cells, as previously reported.” To identify the cell cycle of PCs, we selected the gate for CD38 strongly positive cells, where there are only PCs, using the same software. As internal controls and in order to confirm the type of cells included in these gates, we have performed sorting experiments simultaneously on both CD38 strong-positive cells and the remaining cells in four patients using a FACStar flow cytometer. The sorting was based on the cell DNA content and reactivity for CD38. Ninety-seven percent ? 2%of the cells on theCD38”’ sorted fraction were plasma cells, as assessed by both morphologic and immunologic criteria (cIgk+ or cIgl’ cells); by contrast, the percentage of plasma cells in the other cell sorted fraction was lower than 1% in all four cases analyzed (0.6% 2 0.4%).” Moreover, in aneuploid cases, only the strongly CD38-positive cells showed an abnormal DNA content. An additional theoretical problem with this technique could be the existence of MM cases lacking a strong CD38 positivity; however, in our series, only two cases displayed a weak CD38 expression. In some cases with few PCs, the mathematical model could not analyze the cell cycle. In most of these cases, this problem could be overcome by acquiring a larger number of cells or through an additional acquisition using a live gate for the CD38 strong-positive cells. Nevertheless, 2% of cases could not be analyzed because their histograms did not adjust to the mathematical model. Overall, the percentage of cases successfully analyzed was 91.7% (120/131). Statistical methods. To estimate the significances ofthe differences between means, Student’s t-test wasused (SPSS, Chicago, IL). The chi-square test (SPSS) was used for dichotomic variables. The different clinical and biologic characteristics were considered individually for their relationship with the probability of achieving a favorable response to treatment by univariate tests (Student’s ttest, chi-square, correlations and nonparametric tests, SPSS). Subsequently, a multivariate analysis-stepwise regression-(regression, SPSS)’4 was performed to examine the simultaneous effect of the different variables on the probability of achieving a favorable response. The same characteristics were again considered for analysis with From www.bloodjournal.org by guest on February 6, 2015. For personal use only. SAN MIGUEL ET AL Fig 1. Image of DNA measurement in a diploid MM. On the left, the histogram is obtained with the Vindelov et alZJtechnique, showing one GOIG1-phase peak. On the right, image obtained with the DNAICD38 double-stainingtechnique. The plasma cells are strongly positive for CD38 allowing its discrimination from the rest of the normal BM cells for cell-cycle analysis. respect to their individual and simultaneous effects on response duration (RD) andoverallsurvival (0S)"univariate and multivariate analysis, BMDP 1L and 2L, respectively.'' RD and OS curves were plotted according to the method of Kaplan and Meier, and compared using the Mantel-Cox, Peto-Prentice, andBreslow tests. Variables considered for possible inclusion in theregressionanalysiswere those displayinga significant associationwith survival in the univariateanalysis ( P < .OS) or for which priorstudies had suggested was a possibleprognosticvalue.Thestepwiseregressionmethod discontinued when the P value for entering an additional factor was above .OS. The model was tested both by including the variables in a continuous fashion (continuous model)and by grouping them into categories (dichotomous model). RESULTS Cell-cycledistribution. According to theintensity of CD38 expression, myelomatous plasma cells (CD38 strong positive) were clearly discriminated fromnormalresidual BM cells, which allowed us to analyze separately the cellcycle distribution of both cell fractions (Fig 1). In the whole series of 120 newly diagnosed untreated MM patients, it was observedthat thepercentage of S-phasecells in the myelomatous fraction was significantly lower than that of the residual normal BM cell population (3.6% 2 3.1% and 8.0% 2 6.3%, P < ,001). The number of cells in the G2/ M-phase was similar in both fractions, while the proportion of GO/Gl-phase cells was higher within the myelomatous PC population (Table 1). Proliferative activity of BM plasma cells. Myeloma patients were also divided into two groups using the median value of the present series (3% of S-phase PCs) as the cutoff point according to the proliferative activity of the BM PCs. The clinical, hematologic and biochemical characteristics of both groups of patients are shown in Table 2. Patients with more than 3% of S-phase PCs showed a significantly higher incidence of anemia ( P = .04) and hypercalcemia ( P = .008); increasedvaluesof P2M ( P = .001), urea ( P = .001), and creatinine ( P = .0001) together with higher numbers of PB natural killer cells (0.01), and a poor prognosis (Table 2, Fig 2) as assessed both by the response to chemotherapy ( P = .02) and survival ( P < .0001) (Table 2). The median survival of these patients was only 19 months comthan pared with 56 months for the patients displaying less 3% S-phase PCs. In addition, our results also show that this cut-off value of S-phase BM PCs allows the discrimination of two significantly different prognostic groups of patients even within individual clinical stages (Fig 2, B and C). S-phase was able to identify high-risk patients that would have not been recognized according to other criteria. Thus, within the group of patients with high S-phase PCs (>3%) 46% were under 69 yearsof age, 26% were in clinical stage I or 11, 42% had few bone lesions (grade 0 or l ) , 27% had levelsofhemoglobin (Hb) > 10.5 g/dL, 50% hadnormal albumin serum levels (>3.5 g/dL), 62% hadnormalrenal function (creatinine < 2.0), 54% did not display hypercalcemia (calcium < 10.5 mg/mL) and 48% hadlowlevels of P2M ( < 6 pg/mL). Prolijercltive activity qf residual BM cells. When the patientsweregroupedaccording to the number of residual normal BM cells in the S-phase (Table 3), it was observed that cases displaying a low proliferative activity (<4.5% Sphase cells) showed a significantly higher incidence of severe anemia ( P = .03) and neutropenia ( P = .03) together with increased numbers of BM PCs ( P = ,003). In addition, both Bence Jones ( P = ,0002) and diploid ( P = .009) MMs were more frequent among this group of patients. Interestingly, in six patients,circulating PCswere observed morphologically and five ofthese were in the group of patients displayinglownumbers of S-phase cells ( P = .01). From the prognostic point of view, patients in which the normal residual BM cells displayed a low proliferative rate had a slightly shorter survival (median survivalof 22 v 36 months), although the differences didnot reach statistical significance. Prognostic,factorsandclinicalsystem. Regarding response to chemotherapy,univariate analysis showed that the individual disease characteristics associated with a favorable response (objective and partial remission) were low proliferative activity (<3%) of BM plasma cells ( P = .02), age less than 69 years ( P = .02), ECOG less than 3 ( P = .002), &M less than 6 pg/mL ( P = .002), Hb greater than 10.5 g/dL ( P = .009),creatinine greater than 2 mg/mL ( P = .0l), low serum urealevels ( P = .03), calcium less than 1 1 mg/mL ( P = .02), and earlyclinical stages (stage I and 11) ( P = .03). However, the only independent prognostic factors predicting the response to chemotherapy were found to beP2M serum levels and the performance status ( P < .05). Regarding response duration, the only two variables significantly Table 1. Cell-Cycle Distribution of Myelomatous Plasma Cells and Normal Residual BM Cells Myelomatous Cells GO/Gl-phase S-phase GP/M-phase W O ) Normal Cells PValue 94.2 i 4.3 (94.8) 3.6 -t 3.1 (3.0) 2.1 i 2.1 (1.3) 90.4 2 4.6 (90.3) 8.0 i 6.3 (7.5) 2.1 2 2.2 (1.6) <.001 <.001 ,299 Results expressed as mean f SD; median values are included in brackets. From www.bloodjournal.org by guest on February 6, 2015. For personal use only. PROGNOSIS IN MULTIPLE MYELOMA 451 Table 2. Clinical Characteristics of MM Patients Accordina t o YO of S-Phase BM Plasma Cells Characteristic Age (>69 yrs) Sex (male) ECOG 2 3 Presence of plasmacytomas Advanced clinical stage (stage 111) 7 IgG M component IgA M component 30% Bence Jones M component K MC 71% h MC 29% Anemia < l 0 5 g/dL) Granulocytes (cells/mm3) Lymphocytes (cells/mm3) ESR (mmlhr) Lactic dehydrogenase (maximum, 320 IU/mL) Alkaline phosphatase (U/mL) Total serum proteins (g/dL) Albumin <3.5 g/dL Presence of light chain in urine Urea 250 mg/mL Creatinine 22.0 mg/mL Calcium 211.0 mg/mL P2M2 6 pg/mL % PC in BM Presence of PC in PB PB CD56'/CD3- cells (/mm3) Response to treatment Responders (OR PR) (14% Failures and early deaths + Low Proliferative Activity (<3% S-phase PC) High Proliferative Activity (>3%S-phase PC) 43% 43% 20% 8% 65% 56% 38% 14% 62% 38% 58% 4,000 t 2,300 1,900 t 840 110 t 62 229 t 90 163 t 76 9.5 t 2.7 35% 39% 31% 2% ,008 16% 22% 48 rt 24 4% 300 +. 200 55% 57% 32% 11% 5% 53% CR) 81% 19% 15% 76% 3,500 t 2,000 2,150 t 1,200 109 t 33 266 t 109 181 t 167 9.2 c 2.0 50% 47% 60% 36% 39% 55% 47 ? 28 5% 775 t 590 56% 44% PValue NS NS NS NS NS NS NS NS NS NS .04 NS NS NS ,058 NS NS . l1 NS ,001 <.00001 .001 NS NS .011 .02 .02 Results expressed as mean t SD and percentages. Abbreviations: NS, not significant ( P > .05); PC, plasma cells;CR. complete response; OR, objective response;PR, partial response; MC, monoclonal component. associated with a shorter response duration of independent value were the presence of more than 3% of S-phase PCs (P = .002) (Fig 3) and the presence of plasmacytomas at diagnosis (P = .03). Regarding the population with high S phase, only 44% of patients achieved an OR, and 12% had a minor response. In the remaining patients, there was no response. Interestingly, 21% of patients with OR relapsed within the following 4 months. The question of whether the proliferative activity of BM PCs has independent prognostic influence on survival, because of its correlation with other prognostic parameters, was investigated using the Cox regression analysis. Multivariate analysis (Table 4) showed that the percentage of S-phase PCs was the best single parameter for predicting survival in MM patients; this parameter, together with the P2M serum levels, performance status and age were the best combination of disease characteristics for predicting survival in MM. In 10 of 60 patients (17%) with high S-phase PCs (>3%), this was the only adverse prognostic feature because all the other independent prognostic factors @,M, age, and performance status) were favorable. When only patients less than 65 years old were included in the multivariate analysis, the only disease parameters to emerge as significant prediction were the percentage of S-phase cells (P< .001) and P2M serum levels ( P = .05). According to the hazard rate predicted by the regression model (Fig 4) patients were divided into three risk groups using cut-off points of 6 and 8.5; a high-risk group including 21% of the patients, an intermediate-risk group including 53%, and a low-risk group including 26% were found. The median survivals of these three groups were 9 and 36 months and not yet reached, respectively ( P < .0001). Interestingly, none of the 31 patients included in the low-risk group have died so far. All of these patients had symptomatic MM, 54% of them were in clinical stage I11 and extensive bone lesions (grade 2 or 3) were present in 46% of these cases. Their median age was 64. Anemia (<10.5 g/dL) was observed in SO%, albumin less than 3.5 g/dL in 24% and serum P,M level between 4 and 6 mg/dL were present in 24%. To simplify the classification of MM patients into risk groups, an alternative model was developed according to the scoring indices shown in Table 5. The survival curves of patients with low risk (score 0), intermediate risk (score 1, 2 or 3) and high risk (score 4 or 5 ) were similar to the ones described above, and the differences between them were also highly significant (P < .0001) (Fig 5). DISCUSSION Accurate prognostic evaluation is mandatory for the selection of optimal therapeutic strategies in hematologic malignancies, especially when a decision on treatments with increased concomitant morbidity and mortality, such as From www.bloodjournal.org by guest on February 6, 2015. For personal use only. 452 SAN MIGUEL ET AL Table 3. Clinical Characteristics of MM Characteristic Age (yrs) Sex (male) ECOG 2 3 Advanced clinical stage (stage 111) Anemia (Hb d . 5 g/dL) Lactic dehydrogenase (maximum, 320 IU/mL) Total serum proteins (g/dL) Albumin <3.5 g/dL Urea 2 5 0 mg/mt Creatinine 22.0 mg/mL Calcium 211.0 mg/dL P2M 26 d m L % PC in BM Presence of PC in PB Diploid MM Response to treatment Responders (OR PR) Failures and early deaths Patients According to % of Normal Residual S-Phase BM Cells Low Proliferative Activity (S-phase < 4.5%) High Proliferative Activity (S-phase a 4.5%) 69 2 9 42% 28% 68 i 11 .009 53% 240260 i 120 9.2 C 2.9 29% 50% 17% 25% 34% 59% 2 27% 16% (5/34) 59% + NS NS NS .l2 .03 NS NS NS NS NS NS NS ,003 .01 54% 30% 67% 25% i 93 2 2.1 24% 43% I 8% 29% 32% 42% ? 24% 81% 9.6 P Value 1% 11/86) 33% 62% 38% 60% 40% NS NS Results expressed as mean SD and percentages. Abbreviation: NS, not significant ( P > .05). transplantation, must be made. Moreover, a good staging system would allow the identification of patients at risk of early death who may benefit from new experimental treatments. The plasma cell labeling index (PCLI), assessed as the number of plasma cells that incorporate thymidine analogues, has been shown to represent an important prognostic factor in MM, potentially useful for predicting progression of the tumor clone.2,3,6,8.9 However, its determination is rela- p <O.Oool 4L""" l _""56 months l 1 tively complex, time consuming, and difficult to standardize. Because of this, at present, these techniques aimed at assessing cell proliferation are restricted to relatively specialized clinical research laboratories.26In addition, in most MM patients, the PCLI is quite low; in fact, only 10% of cases display a PCLI above the cut-off value of 2%' such that only a minority of patients are identified as high risk because most patients lie within a tight interval of variation. In recent years, different flow-cytometry techniques have been developed to assess the proliferative rate of tumor cells based on their DNA content per cell measured either as a single parameter or combined with the quantification of the incorporation of the BdrU and IdUr thymidine-analogues, specifically identified with M O A ~ S . Although ~ ' ~ ~ ~ cell-cycle analysis using flow cytometry has now been performed in this application for more than 15 years, few clinical studies have been reported in MM patients." This is probably because the measurement of cell proliferation in total BM is 1 -l oh 10 20 30 40 80 70 Months fmn dii@?osfs 50 c -""" 26 momha - rWIm.Eh*d M 9O "I """_ il phaSe f C 23% -S S p h w PC 4% -" 7 " """"" - J I .E "S" a " ClylJorJ 10 80' 17monh. "hu -5ghu23U IL 20 00 I 111( n = W U) 0 1 I I 61months I 13 months 1 0 02 20 0 9 9 0 0 44 L". p = 0.001 00 5 50 0 6 6 00 77 0 Months from nvni88ion Fig 2. Survival curves according to the percentage of S-phase plasma cells in the whole series (A), early and intermediate clinical stages (B), and advanced clinical stages (C). Fig 3. Response duration curves according to the percentage of S-phase plasma cells in the whole series. From www.bloodjournal.org by guest on February 6, 2015. For personal use only. 453 PROGNOSIS IN MULTIPLEMYELOMA Table 4. Cox Model Relating Pretreatment Characteristicsto Overall Survival in the Whole Series Coefficient Step SE Factor 0.5774 PC in S-phase 2 3% 0.3996 P2M 2 6 pglmL 12 ECOG 2 3 yrs Age 2 69 0.4153 1 2 3 4 0.41 2.2185 0.8117 1.1756 0.9067 P Log Likelihood <.001 ,002 ,012 .022 -111.912 -107.071 -103.951 -101.313 Regression model: Ln[L(t)/l(lo)l= (2.2,s-phase PC) + (0.8.P2M)+ (1.2.ECOG) + (0.9.age). In thisequation, variables are considered as dichotomous, with a value of 1 (if their value was under the cut-off point) or2 (if their value was above the cut-off point). not an appropriate way of assessing plasma cell proliferation since normal residual cells are also proliferating in the BM of myeloma patients. The CD38/propidium iodide doublestaining technique used in the present study" allows the simultaneous evaluation of the myelomatous population specifically identified as being strongly CD38 positive and the residual normalBM cell populations. Our data showthat myelomatous PCs proliferate relatively slowly as compared with residual BM cells. So far, very little attention has been paid to the residual normal BM cell populations in MM and, to the best of our knowledge, this is the first study in which their proliferative activity has been correlated with the most relevant clinical disease characteristics. Our results show that both Hb levels and the number of PB granulocytes in MM patients are related to the proliferative activity of residual BM cells as an index of their regenerative activity. Regarding the proliferative activity of myelomatous PCs we observed that the number of S-phase PCs correlated with several prognostic factors, such as the level of Hb, calcium, creatinine, and P2M. Moreover, using an S-phase cut-off value of 3%, it was possible to discriminate two subgroups of patients with significant different prognoses, even within individual clinical stages. In a similar way to what has been reported for the PCL16-*and other chronic lymphoprolifera- tive disorders,29multivariate analysis showed that the number of S-phase PCs was the most important independent prognostic factor and that, together with P2M, age, and the performance status, it represented the best combination of disease characteristics for stratifying patients according to prognosis, thus providing a useful basis for risk-directed therapy. Accordingly, it should be emphasized that together with a group of patients at risk of early death (22% of our cases), the model described here identified another similar group of patients, all of which are alive and are characterized by a low percentage of S-phase PCs, low serum 0,M levels, and age less than 69 years. According to classic criteria, such as the clinical stage (54% of them were in stage 111) or anemia (50% had Hb < 10.5 g/dL), these patients would not have been recognized as low-risk cases and, therefore, might have been subjected to unnecessary, perhaps lifethreatening, aggressive treatments. A similar observation has been recently reported by Greipp et aI9 using a stratification model based on PCLI and P2M levels; in this study, eight of nine patients under the age of 65 with low PCLI and P2M were alive after more than 5.5 years of follow up. The percentage of S-phase PCs apparently does not play a crucial role in predicting response to treatment because it was not selected in the multivariate analysis for response. Other studies based on the PCLI have reported similar results2; this maybe because response to treatment seems mainly to depend on tumor cell mass' and the presence of mechanisms of drug resi~tance.~'.~' By contrast, we observed that response duration was related to the proliferative activity of the PCs because the number of S-phase cells was the most important prognostic factor for predicting relapse. This Table 5. Simplified Prognostic Classification of MM Variable L """" ~ I 20. 1 I IOd io -P Lm ria: latsnnsdiaterisk High risk io so io Global p < o.ooo1 io b 0 7 o io Monthsm~ls n Dad 9 Alive 31 Median survival 31 63 23 20 40 26 36 moatha 9moolhs 6 28) montha Fig 4. Survival curvesaccording to the prognostic model using the regression equation: ER = (2.2 S-phase PCs) + (0.8 -&M) + (1.2 ECOG) + (0.9 Age). S-phase plasma cells <3% 23% P2 M serum levels <6 pg/mL 2 6 pg/mL Performance status ECOG 1 3 ECOG 2 3 Age <69 yrs 269 yrs Score 0 2 0 1 0 1 0 1 The sum of scores gives three stages: stage I, score 0; stage II: score lto 3; stage 111, score 4 to 5. From www.bloodjournal.org by guest on February 6, 2015. For personal use only. 454 SAN MIGUEL ET AL Median not reached 20 I'C L"-l l I *,(SW 0 g21 -*(@Q High&(StlSem, 0 n 23 44 21 5 SOm& 36 months 9 months Fig 5. Survival curves according to the simplified classification of MM patients. Values acording to the score model shown in Table 5: S-phase PCs 23% (2). ~ 3 (0); % &M 2 6 pg/mL (l),<6 pg/mL (0); ECOG 2 3 (l),<3 (0);age 269 yrs (l),C69 yrs (0).The sum of these values gives the score risk. observation suggests that the proliferative activity of the residual cells resistant to chemotherapy is a major factor for disease progression.* In summary, our results show that the assessment of the number of S-phase PCs at flow cytometry, combining CD38 and PI staining, is the most significant independent predictor of survival in MM. Moreover, the classification system proposed here includes the three basic features that define the prognosis in most tumor models: (1) the malignant cells growth (assessed by plasma cells' S-phase), (2) the tumor load (assessed by &M), and (3) the patients' ability to tolerate the malignancy and the treatment (age and performance status). Finally, this classification could also be used for planning treatment in patients who are younger than 65 years old, have a good performance status, and who are candidates for transplantation. REFERENCES 1. Drewinko B, Alexanian R Growth kinetics plasma cell my- eloma. J Natl Cancer Inst 57:333, 1977 2 . Durie BGM, Salmon SE, Moon TE: Pretreatment tumor mass, cell kinetics, and prognostic in multiple myeloma. Blood 55:364, 1980 3. Greipp PR, Kyle RA: Clinical, morphological, and cell kinetic differences among multiple myeloma, monoclonal gammopathy of undetermined significance, and smoldering myeloma. Blood 62: 166, 1983 4. Dune BGM, Young LA, Salmon SE: Human myeloma in vitro colony growth: Interrelationship between drug sensivity, cell kinetics, and patient survival duration. Blood 61:929, 1983 5 . Boccadoro M, Gavarotti P, Fossati G, Pileri A, Marmont F, Neretto G, Gallamino A, Volta C, Tribalto M, Testa MG: Low plasma cell 3(H) thymidine incorporation in MGUS, smoldering myeloma and remission phase myeloma: A reliable indicator of patients not requiring therapy. Br J Haematol 58:689, 1984 6. Boccadoro M, Massaia M, Dianziani U, Pileri A: Multiple myeloma: Biological and clinical significance of bonemarrow plasma cell labeling index. Haematologica (Pavia) 72:171, 1987 7. Greipp PR,Katzmann LA, O'Fallon WM.Kyle RA: Value of beta-2-microglobulin levels and plasma cell labeling indices as prognostic factors in patients withnewly diagnosed multiple myeloma. Blood 72:219, 1988 8. Durie BGM, Bataille R: Therapeutic implications for myeloma staging. Eur J Haematol 51 :l 1 1, 1989 (suppl) 9. Greipp PR, Lust JA, O'Fallon M, Katzmann JA, Witzig TE, Kyle RA: Plasma cell labeling index and p2-microglobulin predict survival independent of tymidine kinase and C-reactive protein in multiple myeloma. Blood 81:3382, 1993 10. HedleyDW, Shankey TV, Wheeless LL: DNA Cytometry Consensus Conference. Cytometry 14:471,1993 I I . Shankey TV, Ravinovitch PS, Bagwell B, Bauer KD, Duque RE, Hedley DW, Mayall BH, Wheeless LL: Guidelines for implementation of clinical DNA cytometry. Cytometry 14:472, 1993 12. Duque RE, Andreeff M, Braylan RC, Diamond LW, Peiper SC: Consensus review of the clinical utility of DNA flow cytometry in neoplastic hematopathology. Cytometry 14:492, 1993 13. Smith L, Barlogie B, Alexanian R: Biclonal and hypodiploid multiple myeloma: Am J Med 80:841, 1986 14. Shimazaki C, Gotoh H, Oku N, Ashihara E, lnaba T, MuraM, Fujita N: Noveltype of kami S, Ura Y, ItohK,Nakagawa clonally involved cytoplasmic immunoglobulin-negative cells in multiple myeloma: Flow cytometric study. Acta Haematol 88:56, I992 15. Terstappen LWMM, Johansen W, Segers-Nolten IMJ, Loken MR: Identification and characterization of normal human plasma cells in normal human bone marrowby high resolution flow cytometry. Blood 76:1739, 1990 16. Harada H, Kawano MM, Huang N, Harada Y, Iwato K, Tanabe 0, Tanaka H, Sakai A, Asaoku H, Kuramoto A: Phenotypic difference of normal plasma cell from mature myeloma cells. Blood 81:2658, 1993 17. San Miguel JF, Garcia-Sanz R, Gonzzilez M, Moro MJ, Hernandez JM, Ortega F, Sanz MA, Borrego D, Carnero M, Casanova F, Jimenez R, Porter0 JA, OrfZo A: Estudios inmunofenotipicos y de contenido de ADN en Mieloma Multiple: lmplicaciones clinicas. Sangre 38:87, 1993 (suppl) 18. Orfgo A, Garcia-Sanz R, Lopez-Berges MC, Vidriales MB, Gonzalez M, San Miguel JF: A newmethod for the analysis of plasma cell DNA content in multiple myeloma samples using a CD38/propidium iodide double staining technique. Cytometry (in press) 19. Costa A, DelBin0 G, HammouA, Porschen R,VanHove L, Valangendonck F, Knape WA, Bach BA: A multicenter study of reproducibilty of FCM cell cycle estimates. Cytometry 5:633B, 1991 (suppl, abstr) 20. Chronic Leukemia-Myeloma Task Force, National Cancer Institute: Proposed guidelines for protocol studies: 11: Plasma ceil myeloma. Cancer Chemother Rep 4:145, 1973 2 I . Blade J, San Miguel JF, Aka16 A, Maldonado J, Sanz MA, Garcia-Conde J, Moro MJ, Alonso C, Besalduch J, Zubizarreta A, Besses C, Gonzilez Brito G , HemAndez-Martin J, Femindez-Calvo J, Rubio D, Ortega F, Jimbnez R, Colominas P, Faura MV, Font L, Tortosa J, Doming0 A, Fontanillas M, Rozman C, Estap6 C: Alternating combination VCMPNBAP chemotherapy versus melphalad prednisone inthe treatment of multiple myeloma: A randomized multicentric study of 487 patients. J Clin Oncol 1 I: 1165, 1993 22. Durie BGM, Salmon SE:A clinical staging system for multiple myeloma. Correlation of measured myeloma cell mass with presenting clinical features, response to treatment and survival. Cancer 36:842, 1975 From www.bloodjournal.org by guest on February 6, 2015. For personal use only. PROGNOSIS IN MULTIPLE MYELOMA 23. Vindelov LL, Christehnsen IBJ, Jensen G, Nissen NI: Limits of detection of nuclear DNA anbnormalities by flow cytometric DNa analysis: Results obtained by a set of methods for sample storage, staining and internal standardization. Cytometry 3:332, 1983 24. Cox D R Regression models and life tables: J R Stat SOC(B) 34:187, 1972 25. Dixon WJ: (Biomedical-Data Package) Statistical software. University of California, Berkeley, CA, 1983 26. Boccadoro M, Gallone G , Frieri R, Pileri A, Bataille R, Klein B: Plasma cell labeling index, µglobulin and C-reactive protein: What is the best combination for myeloma prognosis? Blood 82:3507, 1993 27. Wilson GD, McNally NJ: Measurement of cell proliferation using bromodeoxiuridine, in Hall PA, Levison DA, Wright NA (eds): Assessment of Cell Proliferation in Clinical Practice. London,UK, Springer-Verlag, 1992, p 113 A, Gonzfilez M, Ciudad J, L6pez-Berges MC, L6pez 28. M O 455 A, Vidriales B, Macedo A, San Miguel JF: Cell cycle andDNA aneuploidy: Biological bases and terminology, in Sanpedro A, O f i o A (eds): DNA Cytometric Analysis. Oviedo, Spain, Universidad de Oviedo, 1993, p13 29. W a o A, Ciudad J, Gonzilez M, San Miguel JF, Garcia AR, Mpez-Berges MC, Ramos F, Del Caiiizo MC, Rios A, Sanz M, L6pez-Borrasca A: Prognostic value of S-phase white blood cell count in B-cell chronic lymphocitic leukemia. Leukemia 6:47, 1992 30. Dalton WS, Durie BGM, Alberts DS, Gerlach JH, Cress AE: Characterization of a new drug-resisteant human myeloma cell line that expresses P-glycoprotein. Cancer Res 46:5125, 1986 31. Dalton WS, Grogan TM, Rybski JA, Scheper JR, Richter L, Kailey J, Broxterman HJ, Pinedo HM, Salmon SE: Immunohistochemical detection and quantitation of p-glycoprotein in multiple drug resistence human myeloma cells: Association with level of drug resistence and drug accumulation. Blood 73:747, 1989 From www.bloodjournal.org by guest on February 6, 2015. For personal use only. 1995 85: 448-455 A new staging system for multiple myeloma based on the number of S- phase plasma cells JF San Miguel, R Garcia-Sanz, M Gonzalez, MJ Moro, JM Hernandez, F Ortega, D Borrego, M Carnero, F Casanova and R Jimenez Updated information and services can be found at: http://www.bloodjournal.org/content/85/2/448.full.html Articles on similar topics can be found in the following Blood collections Information about reproducing this article in parts or in its entirety may be found online at: http://www.bloodjournal.org/site/misc/rights.xhtml#repub_requests Information about ordering reprints may be found online at: http://www.bloodjournal.org/site/misc/rights.xhtml#reprints Information about subscriptions and ASH membership may be found online at: http://www.bloodjournal.org/site/subscriptions/index.xhtml Blood (print ISSN 0006-4971, online ISSN 1528-0020), is published weekly by the American Society of Hematology, 2021 L St, NW, Suite 900, Washington DC 20036. Copyright 2011 by The American Society of Hematology; all rights reserved.


© Copyright 2026