
PETROLOGIC DIVERSITY OF ROCKS ON MERCURY. K. E. Vander
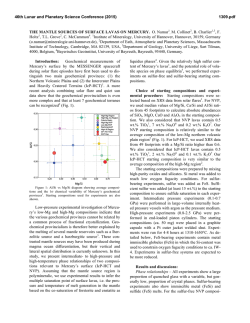
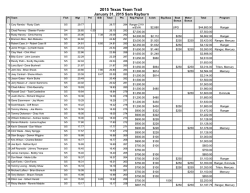
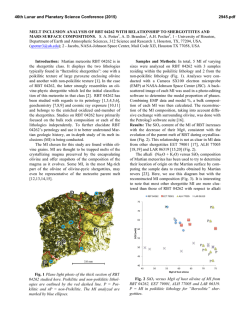
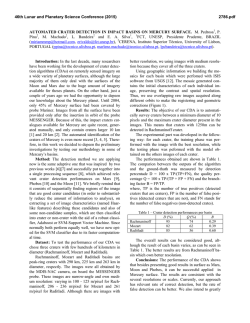
46th Lunar and Planetary Science Conference (2015)
1364.pdf
PETROLOGIC DIVERSITY OF ROCKS ON MERCURY. K. E. Vander Kaaden1, F. M. McCubbin1, L. R.
Nittler2, S. Z. Weider2. 1Institute of Meteoritics, 1 University of New Mexico, MSC03-2050, Albuquerque, NM
87131. 2Department of Terrestrial Magnetism, Carnegie Institution of Washington, Washington, DC 20015,
([email protected]).
Introduction: The X-Ray Spectrometer (XRS) and
Gamma-Ray Spectrometer (GRS) on board the
MErcury Surface, Space ENvironment, GEochemistry,
and Ranging (MESSENGER) spacecraft are providing
the first detailed chemical analyses of Mercury’s
surface [1–7]. Thus far, several geochemical terranes
have been identified on the planet’s surface [8]. To
investigate the petrologic diversity of rocks on the
innermost planet we focus our study on nine regions
with characteristic major element compositions [8]:
(i) the high-Mg region (HMR), (ii) a sub-region of the
HMR with the planet’s highest Ca and S contents
(HMR-CaS), (iii) the smooth plains within the Caloris
basin (CB), (iv) a subset of the northern volcanic
plains (NP) with relatively high Mg content (NPHMg), (v) a subset of the NP with relatively low Mg
content (NP-LMg), (vi) the Rachmaninoff basin (RB),
(vii) the high-Al region southwest of the NP (HAl),
(viii) the planet’s largest pyroclastic deposit, located
northeast of the Rachmaninoff basin (PD), and (ix) the
intermediate terrane (IT), made up of intercrater plains
and highly-cratered terrain. To determine the
composition of each region from the XRS-derived
elemental ratios, the absolute abundance of Si is
required. GRS measurements constrain Si, but with
large uncertainty; regional variations on the order of
10–15%, relative, are permitted by the data [3]. In
some previous MESSENGER studies [e.g., 1, 6, 8], an
Si abundance of 25 wt%, which was calculated by first
calculating O by stoichiometry and then renormalizing
to 100%, has therefore been used. With this calculated
Si abundance, however, the range of analytical totals
for the different regions is large (83.85–110.10 wt%).
Given the now well-established [e.g., 2–6, 8]
geochemically heterogeneous nature of Mercury, it is
likely that Mercury’s Si abundance is similarly
variable across the surface. It is therefore our goal to
determine an average composition for each of these
regions and to provide petrologic classifications for the
rocks that likely constitute Mercury’s surface. These
data will provide insight into the petrologic diversity of
rocks on the planet, as well as the range in Si (or SiO2)
abundances across the surface.
Methods: We have used recent XRS [1, 8] and
GRS [2, 3] analyses to determine average
compositions for nine geochemical regions (see
Table 1). Importantly, the abundances of Ti, Mn, and
Cr have not been reported for most of these units;
therefore we calculated two average compositions for
each geochemical unit. For the first composition only
reported values of Ti, Mn, and Cr were used (when
available). For the second set of average compositions
(Table 1), we used the XRS detection limits for Ti,
Mn, and Cr [1] as the upper limit concentrations of
these elements in each region. To determine the
composition of each distinct geochemical region, we
first assigned the valence of each element (i.e., Si4+,
Ti4+, Al3+, Cr3+, Fe2+, Mn2+, Mg2+, Ca2+, Na+, K+, S2-).
We then calculated a corresponding abundance of O2so that the resulting composition for each region was
charge balanced. If no major constituent elements have
been excluded, the resulting sum of oxides/sulfides
should be ~100 wt%. We therefore normalized the
composition of each region to 100 wt%, while
maintaining the measured element/Si ratios. The
resulting compositions are presented in Table 1.
Results: Before each region’s composition was
normalized to 100 wt% (i.e., by using 25 wt% Si, for
compositions that both contained and were free of Ti,
Cr, and Mn), the analysis totals exhibited ranges of
104.38–107.01 wt% (HMR), 107.48–110.10 wt%
(HMR-CaS),
90.95–92.33 wt%
(CB),
93.50–
96.13 wt% (NP-HMg), 83.85–86.48 wt% (NP-LMg),
100.97–103.60 wt% (RB), 101.06–103.69 wt% (HAl),
101.37–104.00 wt% (PD), and 101.23–103.86 wt%
(IT). After our normalization, there is a range of
~6.4 wt% Si, which corresponds to a range of
~13.7 wt% SiO2 across the nine regions. This range
(standard deviation of 8% relative) is consistent with
the GRS measurements [3]. Using the SiO2 and total
alkali contents of each composition, the petrologic
classification of each composition is shown on a TAS
diagram in Figure 1. This diagram, however, is not
directly applicable to our compositions, i.e., with high
MgO contents >8 wt%. To place further constraints on
the classification of the distinct geochemical regions,
we have therefore used the high-Mg classification
diagram, which we have superimposed on the TAS
diagram in Figure 1. Both NP regions, as well as the
CB, can be classified as boninites since their SiO2 and
MgO contents are >52 wt% and 8 wt%, respectively.
This classification system was constructed for
terrestrial systems, and the total alkali content only
extends to 4 wt% (Na2O + K2O). Thus, we use the term
‘alkali-rich boninite’ for compositions with ≥4 wt%
total alkalis (e.g., NP-HMg, NP-LMg, CB). Both of the
HMR regions can be classified as komatiitic since their
SiO2 contents are <52 wt% and their MgO contents are
>18 wt%, although they may not be komatiites sensu
stricto, if future targeted analyses are in agreement
with the current latitude binning of [2] which suggests
these regions may have >1 wt% Na2O. The remaining
46th Lunar and Planetary Science Conference (2015)
1364.pdf
Table 1. Average compositions (wt%) for nine distinct geochemical units on Mercury. Unless otherwise indicated, analyses are
from XRS measurements [4, 8]. *K values from “all 2012” data in [3], except where targeted analyses were available. Na values
for a0–60°N, baverage of 15–30°N and 30–45°N, c75–90°N, daverage of 45–60°N and 60–75°N, and e30–45°N [2].
HMR
HMR-CaS
CB
NP-HMg
NP-LMg
RB
HAl
PD
IT
49.97
48.57
57.93
55.64
61.87
51.62
51.58
51.42
51.49
SiO2
25.04
26.17
12.86
17.23
11.41
24.95
18.90
21.13
20.84
MgO
6.32
7.58
5.87
5.10
5.56
4.88
6.26
7.23
5.62
CaO
9.65
8.82
15.50
12.32
10.73
11.69
15.37
11.35
13.69
Al2O3
0.16
0.16
0.09
0.22
0.22
0.16
0.16
0.16
0.11
*K2O
3.46a
3.36a
4.03b
6.03c
4.52d
3.60b
4.00e
3.99e
3.47a
Na2O
1.84
1.61
0.97
0.00
1.71
0.00
0.00
1.92
1.55
FeO
1.17
1.14
0.45
1.30
1.45
1.21
1.21
1.20
1.20
TiO2
0.68
0.66
0.79
0.76
0.85
0.71
0.70
0.70
0.70
Cr2O3
0.60
0.59
0.70
0.67
0.75
0.62
0.62
0.62
0.62
MnO
2.21
2.71
1.58
1.46
1.90
1.13
2.40
0.55
1.37
S
1.10
1.35
0.79
0.73
0.95
0.57
1.20
0.28
0.68
-O=S
100.00
100.00
100.00
100.00
100.00
100.00
100.00
100.00
100.00
Total
23.36
22.70
27.08
26.01
28.92
24.13
24.11
24.04
24.07
Wt% Si
Total assuming
107.01
110.10
92.33
96.13
86.48
103.60
103.69
104.00
103.86
25 wt% Si
regions (e.g., RB, HAl, PD, and IT) span these two
distinct compositions and can be classified as either
boniniitic or komatiitic, depending on the amount of
SiO2 and MgO present.
Figure 1. Total alkali versus silica diagram for nine distinct
geochemical units on Mercury. Shaded region >52 wt% SiO2
represents boninites. Unshaded region <52 wt% SiO2
represents komatiitic compositions.
Both the constituent NP lava flows and the PD
likely represent melt compositions, so we have
provided additional information regarding the
geochemical properties of these melts in Table 2.
Table 2. Silicate melt parameters for three distinct volcanic
units. M: Metaluminous. NBO/T: Nonbridging oxygen per
tetrahedrally coordinated cation.
NP-HMg
NP-LMg
PD
Alumina
M
M
M
Saturation
100
92.2
95.15
Mg #
Alkalinity
0.82
0.72
0.59
Index
0.85–0.88
0.61–0.64
1.18–1.20
NBO/T
Discussion: Our results indicate that Mercury has a
diverse set of rocks on its surface. From our
investigation, we infer a wide range of SiO2 content,
alkali content, and major element compositions across
Mercury’s surface. Our petrologic classification of the
nine geochemical regions indicates that Mercury’s
surface is chemically evolved relative to those of the
Moon and Mars, and is similar (with respect to SiO2
content) to Earth [9]. In fact, Mercury may represent
the only other example of a planet in our Solar System
with vast amounts of andesitic crust exposed at the
surface. The formation of Earth’s evolved crust is
normally associated with plate tectonics and the
presence of water. These two factors, however, were
likely not involved with the formation of Mercury’s
crust. The study of Mercury’s crustal composition may
therefore provide important new insights into crustal
evolution mechanisms. Our results also have important
implications for the interpretation of MESSENGER
XRS and GRS data. In the past, elemental abundances
have been calculated from the ratio to Si, by using a
fixed, calculated Si value of 25 wt%. The wide range
in Si content that we find, however, implies that this
practice could be problematic.
References: [1] Nittler L. R. et al., (2011) Science,
333, 1847-1850. [2] Peplowski P. N. et al., (2014) Icarus,
228, 86-95. [3] Peplowski P. N. et al. (2012) JGR:
Planets, 117, E00L04. [4] Nittler L. R. et al. (2014) LPS
XLV, #1391 [5] Weider S. Z. et al. (2014) Icarus 235,
170-186. [6] Weider S. Z. et al. (2012) JGR: Planets, 117,
E00L05. [7] Evans L. G. et al. (2012) JGR: Planets, 117,
E00L07. [8] Weider S. Z. et al. (2015) EPSL, in review.
[9] Taylor S. R. and McLennan S.M. (2009) Planetary
Crusts: Their Composition, Origin, and Evolution,
Cambridge, pp. 378.
© Copyright 2026