
Spatial evapotranspiration, rainfall and land use data in water
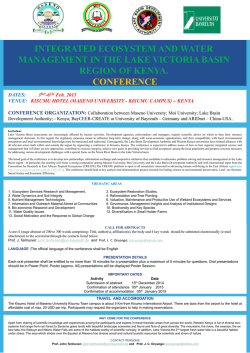
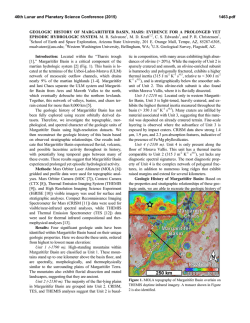
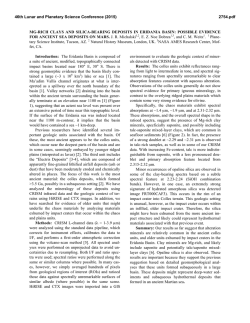
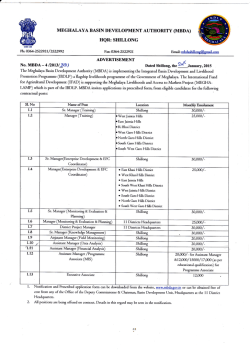
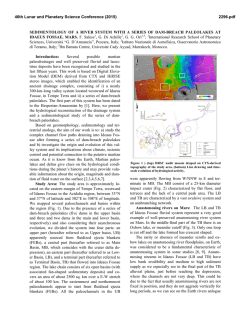
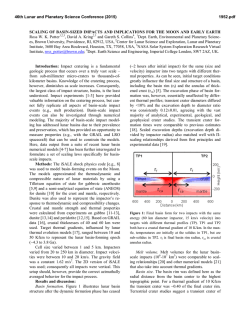
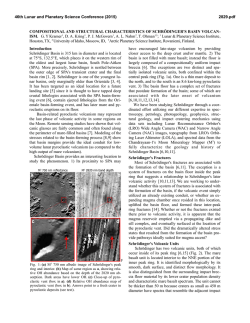
Hydrol. Earth Syst. Sci., 19, 533–550, 2015
www.hydrol-earth-syst-sci.net/19/533/2015/
doi:10.5194/hess-19-533-2015
© Author(s) 2015. CC Attribution 3.0 License.
Spatial evapotranspiration, rainfall and land use data
in water accounting – Part 2: Reliability of water
acounting results for policy decisions in the Awash Basin
P. Karimi1 , W. G. M. Bastiaanssen1,2,3 , A. Sood2 , J. Hoogeveen4 , L. Peiser4 , E. Bastidas-Obando5 , and R. J. Dost5
1 UNESCO-IHE
Institute for Water Education, Delft, the Netherlands
Water Management Institute, Battaramulla, Sri Lanka
3 Faculty of Civil Engineering and Geosciences, Water Management Department, Delft University of Technology,
Delft, the Netherlands
4 Land and Water Division, FAO, Rome, Italy
5 eLEAF Competence Centre, Wageningen, the Netherlands
2 International
Correspondence to: P. Karimi ([email protected])
Received: 20 November 2013 – Published in Hydrol. Earth Syst. Sci. Discuss.: 22 January 2014
Revised: 5 December 2014 – Accepted: 7 January 2015 – Published: 28 January 2015
Abstract. Water Accounting Plus (WA+) is a framework
that summarizes complex hydrological processes and water
management issues in river basins. The framework is designed to use satellite-based measurements of land and water
variables and processes as input data. A general concern associated with the use of satellite measurements is their accuracy. This study focuses on the impact of the error in remote
sensing measurements on water accounting and information
provided to policy makers. The Awash Basin in the central
Rift Valley in Ethiopia is used as a case study to explore the
reliability of WA+ outputs, in the light of input data errors.
The Monte Carlo technique was used for stochastic simulation of WA+ outputs over a period of 3 yr. The results show
that the stochastic mean of the majority of WA+ parameters
and performance indicators are within 5 % deviation from
the original WA+ values based on one single calculation.
Stochastic computation is proposed as a standard procedure
for WA+ water accounting because it provides the uncertainty bandwidth for every WA+ output, which is essential
information for sound decision-making processes. The majority of WA+ parameters and performance indicators have
a coefficient of variation (CV) of less than 20 %, which implies that they are reliable and provide consistent information on the functioning of the basin. The results of the Awash
Basin also indicate that the utilized flow and basin closure
fraction (the degree to which available water in a basin is
utilized) have a high margin of error and thus a low reliability. As such, the usefulness of them in formulating important
policy decisions for the Awash Basin is limited. Other river
basins will usually have a more accurate assessment of the
discharge in the river mouth.
1
Introduction
Water Accounting Plus (WA+) is a novel analytical framework that summarizes complex hydrological processes and
water management issues in vast river basins by means
of four simple sheets (Bastiaanssen, 2009; Karimi et al.,
2013a), although the accounting system is expanded continuously. WA+ has the ability to accommodate satellite
measurements to quantify land use and hydrological variables. WA+ is a successor of the water accounting (WA)
system initiated by the International Water Management Institute (IWMI) that was introduced by Molden (1997) and
Molden and Sakthivadivel (1999) for describing the depletion of water resources in river basins. Whereas the IWMI
WA is based on piezometers, water levels, discharge measurement, rain gauges and reference evapotranspiration to assess water stocks, water usage, and depletion in river basins,
WA+ is also designed to allow for the use of remote sensing
data. Remote sensing information can replace hydrometeo-
Published by Copernicus Publications on behalf of the European Geosciences Union.
534
P. Karimi et al.: Spatial evapotranspiration, rainfall and land use data in water accounting – Part 2
rological data sets measured in situ, especially when administrations are reluctant to share data, and also where the data
quality from field observatories is questionable.
WA+ facilitates the understanding of the water resource
situation and the use of water by riparian administrations.
The number of river basins under water stress is rapidly
growing (Vörösmarty et al., 2010; Wolf et al., 2003), and
there is a growing need for transparent and independent
water-related data (CA, 2007; FAO, 2003; UN-Water, 2013).
WA+ meets this need by quantifying the resources and their
depletion by all the agroecological land use units in the river
basin. WA+ provides policy makers with data for water (re-)
allocation, withdrawal permits, flows to sustain ecosystems,
and for soil and water conservation, among others.
The art of using remote sensing to derive hydrological
variables is well established (e.g., Neale et al., 2012; Stewart et al., 1996). A recent literature review by Karimi and
Bastiaanssen (2015) showed that the average errors in land
use mapping, and annual or seasonal precipitation and evapotranspiration estimates on the basis of multispectral remote sensing data were 14.5, 18.5, and 5.4 %, respectively.
These figures are based on a comprehensive literature review in which for each variable several numbers of post2000 peer-reviewed publications were consulted for reported
differences of satellite-based estimates from conventional
ground measurements. Results of the study show that errors
in satellite-based estimates are within an acceptable range
and comparable to errors reported in conventional groundbased observations. They are thus suitable for application in
WA+ for any river basin, including ungauged basins. Bastiaanssen and Chandrapala (2003), Bastiaanssen et al. (2014),
Karimi et al. (2012, 2013b), Drooger et al. (2010), Shilpakar
et al. (2012) and Dost et al. (2012) used remote sensing data
for the water accounts of ungauged river basins in Sri Lanka,
and for the Nile, Okavango, East Rapti, Indus, and Awash
Basins, respectively. While this is great for basin planning,
arbiters may raise concerns on the reliability of the accounts
if they have not been verified on the ground, especially if
the water accounts are not favorable for the water manager
that is responsible for the operational distribution of water
resources. While field devices are considered reliable measurement instruments, the radiometer onboard a satellite is
often interpreted as futuristic, and not having accurate measurement capabilities. This is not correct, as many in situ devices also measure variables indirectly. In situ soil moisture
sensors for instance measure the soil dielectric properties,
and not soil moisture; measured river and canal discharge
are sometimes based on the sound of water flow, rather than
being direct measurements; leaf area index is based on intercepted solar radiation, and not a direct measurement of total
leaf area.
By demonstrating the accuracy of satellite measurements
they will become more acceptable for use in water accounting. Water-resources-related court cases in the USA and
Spain have already used remote sensing data in dealing
Hydrol. Earth Syst. Sci., 19, 533–550, 2015
with conflicts between competing water users (e.g., Allen
et al., 2007). This created a precedent for more frequent usage of satellite measurements to alleviate international water
conflicts. However, certain critical scientists only trust their
own devices and measurements obtained in a particular location, preferably operated by themselves and not by their
colleagues. It is already known for quite some time that the
quantification of water stocks, fluxes and flows in river basins
will not necessarily be better if conventional point measurements are used. Pelgrum and Bastiaanssen (1996) demonstrated for instance that the regional scale actual evapotranspiration (ET) for an area of 10 000 km2 cannot be predicted
accurately even if 15 advanced flux towers are installed.
Hence, in situ measurements are not the ultimate solution for
determining water flows at river basin scale, although they
are needed to verify local model predictions. The core issue
is to determine the reliability of WA+ accounts if remote
sensing input data is used.
This paper investigates the impact of the errors in remote
sensing measurements on water accounting and the information provided to policy makers. The water accounting exercise in this study has been done at an annual scale because the
monthly storage chances were not know with sufficient accuracy. Future studies will focus on monthly water accounts
though. The degree of inaccuracies in remote sensing data
is based on the comprehensive review of Karimi and Bastiaanssen (2015). The objective of the current paper is to study
the impact of these errors on the water resources of two WA+
reporting sheets.
2
2.1
Background information
Awash Basin
The Awash River is located in the central Rift Valley in
Ethiopia. The river emerges from the central highlands
150 km west of Addis Ababa and flows via the central Rift
Valley to Lake Abbe on the border with Djibouti (Edossa
et al., 2010). The mean annual rainfall is 530 mm and
varies from about 1600 mm yr−1 at Ankober, in the highlands
northeast of Addis Ababa to 160 mm yr−1 at Asayita on the
northern border of the basin. The drainage area of the Awash
River basin is 116 449 km2 (Fig. 1). Lake Abbe is located in
the downstream end of the basin and has an average size of
340 km2 open water, surrounded by 110 km2 of salt flats. The
lake surface area and water depth fluctuates with rainfall and
runoff. The water level can drop as much as 5 m. The maximum depth of the lake is 36 m.
The Awash Basin is located in the tectonically active East
African Rift System and it has a complex geology. The complexity of geology of the basin has a direct impact on its
hydrogeological characteristics and geohydrological flows.
Groundwater flow is of key importance in the Awash Basin
both as a major source of water supply for people and bewww.hydrol-earth-syst-sci.net/19/533/2015/
P. Karimi et al.: Spatial evapotranspiration, rainfall and land use data in water accounting – Part 2
535
Figure 1. Location of the Awash River basin in the central Rift Valley of Ethiopia.
cause of its impact on hydrographs, especially during the
dry period. The highland’s fractured volcanic cover is favorable for groundwater recharge processes (Ayenew et al.,
2008). Thus, groundwater recharge from the highlands is
substantial. Groundwater gradually percolates into the lower
aquifers through large marginal faults before it reaches the
rift floor (Ayenew, 2001). In the upper and middle parts
of the valley, the groundwater levels range between 30 and
70 m. The levels drop to lower than 200 m in some areas
in the southern corner of the Awash Valley. In the upper
basin, upstream of the Koka dam, the Awash River is hydraulically linked to the aquifers. However, this link weakens downstream of the dam. The major and deeper aquifers
in this region are fractured basalt and ignimbrites. The axial
faults together with the thickness and the extent of Quaternary deposits control groundwater occurrence below the pediment slopes. In the southern Afar plains the thick alluvio–
colluvial deposits and the underlying Mesozoic limestones,
dolomites and sandstones form highly productive aquifers.
These aquifers are recharged by seasonal floods in wadis
and wide river beds that are often highly permeable Quaternary deposits (Ayenew et al., 2008; Meskale, 1982). These
aquifers are recharged by the streams that originate from the
eastern highlands and seasonal floods that occur in summer.
The Awash Basin has an irrigation potential of 205 400 ha
(FAO, 2003). Agriculture, providing livelihood for 85 % of
the population, contributes to 45 % of Ethiopia’s GDP. Acwww.hydrol-earth-syst-sci.net/19/533/2015/
cording to the FAO’s AQUASTAT country fact sheet for
Ethiopia, the country has an estimated 2.7 × 10⁶ ha of irrigable land, yet only about 289 000 ha (11 %) are presently irrigated and only provides approximately 3 % of the country’s
food crop requirements. Most of the irrigation developed to
date in Ethiopia is located in the Awash Basin.
The basin has been selected by the FAO as a case study
for testing its approach in coping with water scarcity (FAO,
2012). Awash is experiencing water shortage for irrigated
agriculture and for the wetlands and natural lakes along the
riparian corridor of the river. The salt flows at the downstream end of the system are also suffering from water shortage, and there is a threat of salt storms when these flows dry
up. It is therefore necessary to understand the hydrological
processes and ecosystem services better, and summarize the
management options. WA+ is an ideal framework for such
a situation and has been applied to 3 consecutive years with
rainfall varying from an average (510 mm yr−1 ) in 2009, a
high (862 mm yr−1 ) in 2010, and a low (364 mm yr−1 ) in
2011. Table 1 shows long-term average rainfall and potential ET (PET) in the Awash Basin.
2.2
Remote sensing input data used
Annual actual ET for the Awash Basin was computed
by means of the two-layer ETLook surface energy balance model, using input data from MODIS (ModerateHydrol. Earth Syst. Sci., 19, 533–550, 2015
536
P. Karimi et al.: Spatial evapotranspiration, rainfall and land use data in water accounting – Part 2
Figure 2. Spatial distribution of the annual ET of the Awash Basin for 2009 computed with the ETLook model (after Dost et al., 2013).
Table 1. Long-term average (1961–1990) rainfall and PET in the
Awash Basin.
Month
Rainfall
(mm month−1 )
Jan
Feb
Mar
Apr
May
Jun
Jul
Aug
Sep
Oct
Nov
Dec
5.2
15.1
38.4
56.3
40.5
30.2
117.6
142.1
65.3
13.7
4
1.5
PET
(mm day−1 )
4.8
5.2
5.6
5.4
5.4
5.8
5.5
5.3
5.2
4.7
4.4
4.4
resolution Imaging Spectroradiometer; albedo, vegetation index), AMSR-E (Advanced Microwave Scanning Radiometer
for EOS; top soil moisture) and Meteosat Second Generation (cloud cover). ETLook is based on a two-layer Penman–
Monteith equation that describes soil evaporation and plant
transpiration as separated physical processes (Bastiaanssen
et al., 2012). Evaporation from wet leaves (i.e., interception)
and open water is also computed. An interval of 8 days was
Hydrol. Earth Syst. Sci., 19, 533–550, 2015
applied based on recurrent MODIS measurements, and the
accumulated ET value for 2009 is presented in Fig. 2.
Daily rainfall maps were acquired from the US Agency for
International Development (USAID) Famine Early Warning
Systems Network (FEWS NET). FEWS NET is an information system designed to identify problems in the food supply system that can potentially lead to famine or other foodinsecure conditions in the Horn of Africa, amongst other regions. FEWS NET provides daily rainfall with a spatial resolution of 8 km × 8 km. The FEWS RFE (rainfall estimate)
2.0 algorithm is implemented by NOAA’s Climate Prediction Center and uses an interpolation method to combine
Meteosat and global telecommunication system (GTS) data.
More background information on the FEWS rainfall algorithm can be found in Herman et al. (1997). Figure 3 shows
the spatial distribution of annual rainfall in 2009.
A new land use map customized for application of
water accounting in the Awash Basin was generated by
Dost et al. (2013). The basis for the new land use map
is the existing GlobCover map (Bicheron et al., 2008).
The new additions are related to the separation of rainfed and irrigated agriculture, and the temporal changes
in the size of the open water body. The institute of
Physical Geography of the Goethe University of Frankfurt developed the MIRCA (Monthly Irrigated and Rainfed
Crop Areas) data set, containing monthly maps of growing areas and crop calendars of 26 irrigated and rainfed
www.hydrol-earth-syst-sci.net/19/533/2015/
P. Karimi et al.: Spatial evapotranspiration, rainfall and land use data in water accounting – Part 2
537
Figure 3. Spatial distribution of annual rainfall of the Awash Basin for the average rainfall year 2009 taken from FEWS Net (after Dost et
al., 2013).
crops (documented at http://www.geo.uni-frankfurt.de/jpg/
ag/dl/forschun/MIRCA/index.html). MIRCA contains data
for 1999–2002 and has a spatial resolution of 5 arcmin
(±10 km). The cropped area is based on the period with maximum rainfed crop acreage. Areas equipped for irrigation are
extracted from the irrigated area map of the FAO and the university of Kassel (Döll and Siebert, 2000). Since these data
sets are to some extent outdated, a time series of the normalized difference vegetation index (NDVI) during 2009 was
used to verify the crop phenology. Fallow land was identified and reclassified. Figure 4 shows the resulting locations
of irrigated and rainfed cropland in the Awash Basin. The
area of irrigated croplands is 216 900 ha and the area of rainfed croplands is 2 258 500 ha. The irrigated acreage is close
to the irrigation potential of 205 400 ha, which suggests that
most potential land for irrigation is exploited already. While
the alluvial soils and flat topography are suitable for irrigation, the unreliability of water resources due to the overall
water scarcity is the constraint for further land reclamation.
2.3
Water Accounting (WA+)
The latest version of the WA+ framework provides four
sheets including (i) a resource base sheet, (ii) an evapotranspiration sheet, (iii) a productivity sheet, and (iv) a withdrawal sheet (Karimi et al., 2013a). The resource base sheet
deals with water volumes and provides information on wawww.hydrol-earth-syst-sci.net/19/533/2015/
ter availability, water depletion and outflow processes. The
evapotranspiration sheet distinguishes beneficial water depletion from non-beneficial depletion by partitioning total evapotranspiration (ET) into evaporation (E), transpiration (T ), and interception (I ). The productivity sheet links
water depletion with benefits gained through biomass production. It extends to carbon sequestration, crop production
and water productivity. The withdrawal sheet presents information on water withdrawals, depletions, and returns.
Each sheet has a set of indicators that are used to summarize the overall water resources situation. WA+ explicitly recognizes the influence of land use on the water cycle. To provide the link between land use and water use,
land use classes with common management characteristics
were defined. These are conserved land use (CLU), utilized
land use (ULU), modified land use (MLU), and managed
water use (MWU). CLU comprises environmentally sensitive land uses and natural ecosystems which are set aside
for environmental protection. ULU represents a low to moderate resource utilization, such as savannah, woodland and
mixed pastures which provide ecosystem services. MLU represents areas where the original vegetation was replaced for
increased utilization of land resources or treatment of the
soil. Rainfed crop land, plantations and biofuel crops are examples of replacement cover. The soil treatment can for instance be plowing, mulching and tilling. MWU represents
landscapes that receive withdrawals by means of man-made
Hydrol. Earth Syst. Sci., 19, 533–550, 2015
538
P. Karimi et al.: Spatial evapotranspiration, rainfall and land use data in water accounting – Part 2
Figure 4. Updated spatial distribution of land use in the Awash Basin (after Dost et al., 2013).
Figure 5. Resources base sheet for WA+ (after Karimi et al., 2013a).
infrastructure (diversion dams, canals, ditches, pumping stations, gates, weirs, pipes, etc.). This is also known as blue
water usage (Falkenmark and Rockström, 2006).
The resource base sheet’s main components are gross inflow, storage change, net inflow, landscape ET, exploitable
Hydrol. Earth Syst. Sci., 19, 533–550, 2015
water, available water, utilized flow, utilizable outflow, incremental ET, reserved outflow, non-utilizable outflow, and surface and groundwater outflows (see Fig. 5). Gross inflow is
the total amount of water that flows into the domain, including precipitation and any inflow of surface or ground water
www.hydrol-earth-syst-sci.net/19/533/2015/
P. Karimi et al.: Spatial evapotranspiration, rainfall and land use data in water accounting – Part 2
539
Table 2. Key performance indicators of the resource base sheet.
Indicator
Definition
What does it indicate?
Exploitable water fraction
Exploitable water
Net inflow
The part of the net inflow that is not depleted
by landscape ET, and thus exploitable
Storage change fraction
Sfw
Exploitable water
The dependency of exploitable water on fresh
water storage change
Available water fraction
Available water
Exploitable water
The portion of exploitable water that is actually
available for withdrawals
Basin closure fraction
Utilized water
Available water
The extent to which available water is depleted
in a basin
Reserved outflow fraction
Reserved outflow
Outflow
The degree of meeting the flows set aside for
interbasin transfer, navigation and
environmental purposes
from adjacent basins. Net inflow is the gross inflow after correction for annual storage change ( S) and represents water
available for landscape ET, and exploitable water. Landscape
ET is the water that evaporates directly from the soil surface and water intercepted by the vegetation cover, as well
as water taken up by plant roots and transpired into the atmosphere. Exploitable water represents water in reservoirs,
rivers, lakes and groundwater that can be partitioned further
into utilized, utilizable, non-utilizable and reserved outflows.
Available water, the part of water that can be allocated to various water use sectors, would be a good definition for the often used term “renewable water resources”. Reserved outflow
is the water that has to be reserved to meet the committed
outflow, navigational flows, and environmental flow. Available water is the exploitable water minus reserved outflows
and non-utilizable outflow. The latter is the part of water that
cannot be utilized due to the lack of required infrastructure;
e.g., a flash flood in utilized flow is the part of available water
that is depleted by uses and hence is no longer available for
downstream usage. Utilized flow is the difference between
the withdrawals and the return flow from these withdrawals.
Utilizable outflow is the available water for resources development and defined as the difference between available and
utilized flow (see Fig. 5).
The resource base sheet indicators include the exploitable
water fraction, storage change fraction, available water fraction, basin closure fraction, and the reserved outflows fraction. Exploitable water fraction is the part of the net inflow that is not depleted by landscape ET processes. Storage change fraction defines the degree of dependency of exploitable water on fresh storage change ( Sfw ). Available
water fraction relates available water to exploitable water.
It describes the portion of exploitable water that is actually
available for withdrawals within a basin because certain water resources have to be committed to sustain minimal environmental flows, navigation or should be allocated to users
www.hydrol-earth-syst-sci.net/19/533/2015/
outside the basin. Basin closure fraction describes to what extent available water is already depleted in a basin or domain.
Reserved outflows fraction relates the reserved outflows to
outflow via streams and aquifers. It indicates whether the
committed outflows are being met. A summary is provided
in Table 2.
The WA+ evapotranspiration sheet (Fig. 6) relates ET to
the generated benefits. ET processes are classed as managed,
manageable, and non-manageable, which indicate the level
of human influence on water consumption. The sheet provides a breakdown of ET into its components: interception
evaporation, and transpiration. Knowing the proportion that
each of these components contributes to total ET of each land
use class makes it possible to determine the proportion of ET
that has beneficial use, called beneficial ET, and the portion
that does not have a beneficial use, called non-beneficial ET.
Beneficial ET comprises beneficial T and beneficial evaporation E. T is generally considered as beneficial. However,
it can be considered non-beneficial in some cases such as for
weed infestations in cropland or in degraded landscapes, or
when it originates from non-desirable plants. E is usually
considered as non-beneficial. However, the E in some cases
such as evaporation from natural water surfaces is considered beneficial as these water bodies serve their purpose for
fishing, aquatic birds, buffering floods, water sports, leisure,
etc. In short, beneficial ET would be transpiration by usable
vegetation cover (crops for example), and also evaporation
from natural water surfaces and from cooling towers. Nonbeneficial ET would be transpiration and evaporation from
unwanted vegetation such as weeds and invasive species and
evaporation from wet surfaces such as bare soil, buildings,
and roads.
The evapotranspiration sheet indicators, summarized in
Table 3, include a transpiration fraction, beneficial ET fraction, managed fraction, agricultural ET fraction, and irrigated
ET fraction. The transpiration fraction is the proportion of ET
Hydrol. Earth Syst. Sci., 19, 533–550, 2015
540
P. Karimi et al.: Spatial evapotranspiration, rainfall and land use data in water accounting – Part 2
Table 3. Key performance indicators of the evapotranspiration sheet.
Indicator
Definition
What does it indicate?
Transpiration fraction
T
ET
The part of ET that is transpired by plants and it
reflects a biophysical process.
Beneficial ET fraction
E beneficial+T beneficial
ET
Relates beneficial E and T to the total ET in a
basin.
Managed ET fraction
ET managed
ET
The ET processes in a basin that is manipulated
by land use change, cultivation practices and
water withdrawals.
Agricultural ET fraction
Agricultural ET
ET
Irrigated agricultural ET
Agricultural ET
The part of ET that is from agricultural activities.
Irrigated ET fraction
Irrigated ET fraction describes the portion of
agricultural ET that is related to irrigated
agriculture
Figure 6. Schematic representation of the evapotranspiration sheet.
that is transpired by plants and relates to net carbon assimilation of vegetation. The beneficial ET fraction relates beneficial E and T to the total ET in a basin. Managed ET fraction
indicates the ET processes in a basin that are manipulated
by land use change, soil treatment, cultivation practices and
water withdrawals. This includes ET from managed water
use, e.g., irrigated areas and urban parks, and ET from modified land use, e.g., rainfed areas. Agricultural ET fraction
is the part of ET attributable to the agricultural production
from rainfed and irrigated crops. Lastly, irrigated ET fraction describes the portion of agricultural ET that is related to
irrigated agriculture.
Hydrol. Earth Syst. Sci., 19, 533–550, 2015
2.4
Methodology to express the reliability of the WA+
framework
The Monte Carlo (MC) technique was used to validate the
WA+ outputs. The MC technique involves selecting numbers randomly from a predefined probabilistic distribution
and applying them in stochastic simulation. MC computes
the variability of the WA+ output parameters by defining
the variability of the input parameters. The variability in this
case expresses the accuracy and thus confidence that can be
attached to the outputs, because the variability of the input
parameter space expresses error in the remotely sensed hydrological variables. The space of input parameters in this
www.hydrol-earth-syst-sci.net/19/533/2015/
P. Karimi et al.: Spatial evapotranspiration, rainfall and land use data in water accounting – Part 2
541
Table 4. Statistics of the probability density function of variation for each remote sensing input parameter into WA+.
Remote
sensing
parameter
Shape
α
Shape
Skewness
γ
(–)
Scale
ω
Variance
(%)
ET
Rainfall
Land use
25
6.4
1.66
1.000
0.988
0.856
1.18
0.90
0.35
2.444
3.218
2.258
2.17
3.92
2.72
Standard
deviation
error
(%)
Location
ζ
Mean
(%)
4.7
15.4
7.4
3.5
16.0
13.1
5.4
18.5
14.6
Table 5. Annual total precipitation and ET in the Awash Basin averaged over the 3 yr: 2009, 2010 and 2011. Rainfall and ET data are based
on remote sensing. The actual evapotranspiration is partitioned into evaporation, transpiration and interception following ETLook principles.
Year
Rainfall
(mm)
ET
(mm)
Interception
(mm)
Evaporation
(mm)
Transpiration
(mm)
Biomass
(kg ha−1 )
production
2009
2010
2011
515
865
366
480
554
486
18
26
18
310
308
293
152
220
175
5744
8570
6455
Average
582
507
21
304
182
6923
MC study is defined by a skewed normal distribution as explained by Karimi and Bastiaanssen (2015). The statistical
input data are specified in Table 4. A program was developed to generate random numbers from a positively skewed
normal distribution based on mean, variance and skewness.
This code handled only skewness smaller or equal to 1.0 and
hence this number has been modified accordingly. The skewness γ is defined as the third standardized moment (γ3 ):
√
4 − π (δ 2/π )3
γ3 =
,
(1)
2 3/2
2
1 − 2δπ
where δ and α are shape parameters:
α
δ= √
.
1 + α2
(2)
The variance is described by means of the scale ω and δ as
variance = ω2 1 −
2δ 2
.
π
(3)
The means value of the population can be computed from the
location ζ :
mean = ε + ωδ
2
.
π
(4)
The results of this exercise is a set of 1000 WA+ resource base sheets and evapotranspiration sheets, each of
them based on a unique combination of ET, rainfall and land
use. Care has been taken that the total basin area is conserved
and that the mass balance of water flows applies. While in
www.hydrol-earth-syst-sci.net/19/533/2015/
simulations the distribution of different land use classes was
flexible and a function of randomly chosen error, a constant
correction factor was applied to all land use classes to match
the total basin area of 116 449 km2 and hence keep the total
physical area constant. The 1000 WA indicators were then
analyzed to determine their accuracy and thus reliability.
3
3.1
Awash Basin results
Baseline hydrology and water accounting
Rainfall and ET are the two most important hydrological
variables for WA+. The average rainfall from FEWS NET
for the 3 yr investigated is 582 m yr−1 (see Table 5). The
average ET computed with ETLook is 507 mm yr−1 , which
compares well with the average rainfall. Note that ETLook
is based on an energy balance and is computed independent
from rainfall. The magnitude of the annual ET for the different years is apparently dampened, which could be ascribed to
compensating effects of atmospheric demand and soil moisture availability: dry years have a high potential ET but the
ET reduction due to soil moisture stress is high as well, yielding an ET value similar to lower potential ET but lower reductions due to soil moisture stress. This behavior is also observed for ET from other surface energy balance models in
the Nile Basin (e.g., Yilmaz et al., 2014). Dry years also partially compensate the lack of infiltrated water by consuming
moisture from the unsaturated zone that is carried over from
a previous wetter year.
Another interesting observation is that soil and water evaporation (304 mm) exceed transpiration (182 mm). The relaHydrol. Earth Syst. Sci., 19, 533–550, 2015
542
P. Karimi et al.: Spatial evapotranspiration, rainfall and land use data in water accounting – Part 2
tively low values of transpiration and interception are due to
the reduced fractional vegetation cover in the Awash Basin,
especially during the dry season. A large portion of the basin
has barren land and the vegetation is senescent during elongated dry periods. The ETLook results show that transpiration from the vegetation (rainfed crops and hillslope forests)
in the western and southern parts of the basin and the irrigated croplands are the major contributing factors to evapotranspiration in the river basin during the dry winters. During
the rainy season, transpiration is higher due to the increased
photosynthesis and biomass production of natural vegetation.
In the eastern plains, evaporation values rise as the soil is saturated with water during the wet summer period, while the
transpiration remains low due to the low vegetation cover.
Many national and international sources report a mean
annual surface runoff of 4.6–4.9 km3 yr−1 for the Awash
Basin (e.g., Behailu, 2004; Edossa et al., 2010). This annual runoff data is based on measured discharge rates. This
surface water flow is withdrawn by irrigation systems, wetlands, inundation areas and lakes. The long-term average annual flow at the Awash station in the middle of the basin is
1.7 km3 yr−1 , revealing that a substantial part is withdrawn in
the upstream part of the basin (approximately 3 km3 yr−1 ).
The non-utilized water from Awash River flows into the
saline depressions of Afar at the downstream end of the
basin, where it is exposed to evaporation. In 2009, the average rainfall year of this study, total evaporation from all
natural lakes amounted to 622 × 106 m3 yr−1 , while the rainfall over these lakes was only 278 Mm3 yr−1 . This difference
of 344 × 106 m3 yr−1 must be the inflow to the lakes from
the Awash River, which matches the flow measured near the
Awash station. This finding shows that all Awash Basin surface water resources are consumed and that no surface water
outflow takes place. Awash is an example of a basin in which
the available water is depleted (Molden, 1997).
Hence, all river flow that is not recharging the aquifer
evaporates inside the basin either as a result of withdrawals
or due to evaporation from the sink at the downstream
end of the system. The evaporation from terminal lakes is
included in the total ET value of 507 mm yr−1 (see Table 5). Hence, the rainfall surplus of 75 mm (582–507 mm)
or 8.7 km3 yr−1 is not related to surface runoff and has to
go somewhere else. The only possible outlet is underground
basin discharge. Taddese et al. (2003) refer to a study of
UNDP (1973) that estimates the total groundwater recharge
in Awash to be 3.8 km3 yr−1 , while EVDSA (1989) estimated 4.1 km3 yr−1 . Ayenew et al. (2008) reported a basinwide average recharge of 30 mm, which is equivalent to
3.5 km3 yr−1 . These estimates are mutually close, and the
average number is 3.8 km3 yr−1 . Groundwater flows towards
the downstream end of the basin at Lake Abbe, where the
elevation is only 240 m. Ayenew et al. (2008) describe a regional groundwater flow in the direction of the Afar Depression. While detailed groundwater studies were not available,
a regional flow of 3.8 km3 yr−1 is likely. This assumes that
Hydrol. Earth Syst. Sci., 19, 533–550, 2015
Table 6. Annual water balance of the Awash Basin for the selected
hydrological years. The basin area is 116 449 km2 .
Year
Rainfall
(km3 )
2009
2010
2011
Average
ET
(km3 )
Basin
outflow
(km3 )
Storage
change
(km3 )
59.8
100.5
42.4
56.4
65.1
57.2
3.8
5.7
2.5
−0.4
+29.7
−17.3
67.6
59.6
3.9
4.1
all groundwater recharge will flow across the basin boundaries into deep depressions in the Horn of Africa. Since deep
regional groundwater flow is usually rather stationary, variability of rainfall will have a limited impact on this interbasin
transfer process. As such, in the absence of data and information on groundwater flows in the basin, it is assumed – without any scientific underpinning computations – that the basin
outflow should not fluctuate more than 50 %. This assumption is used to define lower and upper boundaries for changes
in annual groundwater outflow, allowing for a range of between 2.5 and 5.7 km3 yr−1 . This is a basis for computing
the storage changes for the 3 different rainfall years analyzed
(see Table 6), which must have significantly more dynamics than a deep quasi-stationary groundwater flow. Since the
storage change is calculated as a residual term for P minus
ET minus the underground recharge, it is important to note
that it collects the errors of all three parameters including the
error that assumed underground recharge might have. Thus,
to have better and more accurate estimates of these flows, further research is needed to understand groundwater flows and
outflows from the Awash Basin. A large uncertainty will be
associated with groundwater outflow in the stochastic analysis described in the next section.
There is an unexplained difference between the
8.7 km3 yr−1 basin rainfall surplus and a groundwater
recharge of 3.8 km3 yr−1 that requires more detailed discussion. It is possible that some groundwater seeps to
deeper levels via faults and tectonic plates. Another possible
explanation is the change in storage. The storage changes
among years must be significant and this is confirmed by
reported changes in water levels of lakes and reservoirs.
These storage changes occur in lakes and reservoirs, as
well as in the deep aquifers of the Awash Basin. The
average area of water bodies is 754 km2 and wetlands cover
1078 km2 . If we assume that one-third of the 2010 storage
(29.7 km3 yr−1 ) takes place in the aquifer and unsaturated
zone (i.e., 9.9 km3 yr−1 ), then two-thirds of the storage
change had to be stored as surface water (19.8 km3 yr−1 ),
which over 1832 km2 (754 + 1078 km2 ) signifies a rise in
surface water level of 10.8 m. Reported changes in water
levels are of 5 m, meaning that the area of open water bodies
and wetlands expands with a factor of 2 during a wet year
www.hydrol-earth-syst-sci.net/19/533/2015/
P. Karimi et al.: Spatial evapotranspiration, rainfall and land use data in water accounting – Part 2
543
Table 7. Rainfall and ET by land use class for 2009, 2010 and 2011. CLU is conserved land use, ULU is utilized land use, MLU is modified
land use, and MWU is managed water use.
Land use class
Bare areas
Closed to open grassland
Closed/open vegetation regularly flooded
Rainfed croplands
Closed to open shrubland
Mosaic forest–shrubland/grassland
Irrigated cropland
Bare areas
Closed to open grassland
Closed to open shrubland
Mosaic forest–shrubland/grassland
Open broadleaved deciduous forest
Mosaic grassland/forest–shrubland
Closed/open vegetation regularly flooded
Closed to open broadleaved evergreen
or semideciduous forest
Water bodies
Rainfed croplands
Water bodies
Irrigated cropland
Artificial areas
Area
ET (mm)
km2
2009
2010
2011
2009
2010
2011
CLU
CLU
CLU
CLU
CLU
CLU
CLU
ULU
ULU
ULU
ULU
ULU
ULU
ULU
ULU
1270
1639
17
39
173
778
24
30579
16132
12936
24414
1376
327
1078
102
352
362
356
520
343
631
674
387
413
557
608
678
690
426
637
757
779
745
727
698
818
718
728
740
935
930
1017
1026
784
960
222
217
238
340
225
418
425
255
266
399
420
505
528
309
524
340
336
392
364
326
370
795
340
347
489
507
705
841
931
969
433
425
447
407
342
418
864
382
388
551
618
771
883
1142
945
340
335
372
376
308
382
810
343
345
484
525
686
797
963
889
ULU
MLU
MWU
MWU
MWU
746
22546
8
2145
120
373
638
667
550
703
681
1034
691
854
1130
340
504
415
428
587
833
687
499
826
533
878
796
533
924
520
953
697
414
867
493
for hosting a storage of 19.8 km3 yr−1 . Expansion and level
changes do happen and, together with some unknown deep
seepage of groundwater, explain the total water balance.
A basic component of water accounting is the distribution
of the rainfall and ET across all land use classes. Table 7
shows that the classes open broadleaved deciduous forests,
mosaic forest shrubland/grassland and rainfed cropland receive more rainfall than the other land use classes, which
indeed is the source of the existence of these types of vegetation. The highest ET is found in the land use class of ‘regularly flooded closed and open vegetation. These are the wetlands in the riparian corridor of Awash River system. ET is
highest in the wet year when a larger contiguous layer of
water is ponded in these wetlands. The average ET for this
particular land use class in 2010 is 1142 mm, and the rainfall
is 784 mm. Hence, this inundation water must come from upstream drainage areas. The evaporation from water bodies is
lower than for wetlands because the saline sinks of the Afar
depression are also included in this data set, and these brines
evaporate significantly less than wetlands.
The WA+ framework was applied for the average rainfall year, 2009, using Table 7 as input and the basin outflows
as specified in Table 6. The flow to sink has been assigned
a zero value because all surface flow is assumed to be depleted by evaporation and it thus included already in the ULU
class. Reserved flow, which is the required flow to maintain
a specific constant river flow, was fixed in accordance with
www.hydrol-earth-syst-sci.net/19/533/2015/
Precipitation (mm)
the general guidelines for environmental flow requirements
(Smakhtin and Eriyagama, 2008). Environmental flows were
estimated to be 622 × 106 m3 yr−1 , being the river flow required to meet the evaporation from natural lakes. The calculation is based on the assumption that this volume water is
necessary to maintain the lakes and consequent conservation
of aquatic ecosystems. The basin has no surface outflow and,
since evaporation from the lakes is already accounted for, the
outflow from the basin is through underground flows. Theses
flows recharge the aquifers and leave the basin through underground interbasin transfers as outlined in the previous section. This outflow could be utilized by installing deep pumping stations that withdraw from this water before it flows
away. We thus assume this portion of water to be utilizable,
although in reality the abstraction should be an economic
discussion. The resulting resource base sheet is presented in
Fig. 7.
The results show that the ULU class is with 37.7 km3 yr−1
depleting the majority of the net inflow of 60.2 km3 yr−1 .
This contributes to ecosystem services and grazing. The benefits and value of these depletion processes are moderate to
low, especially considering that the majority is bare soil evaporation. The largest value is related to the biodiversity of
flora and fauna. The MLU class depletes 15.5 km3 yr−1 , and
this contributes to a better food security in the basin. MLU
consists of rainfed crops such as wheat and teff that occupy
an area of 2 254 600 ha. Depletion from surface water with-
Hydrol. Earth Syst. Sci., 19, 533–550, 2015
544
P. Karimi et al.: Spatial evapotranspiration, rainfall and land use data in water accounting – Part 2
+for the Awash Basin during
2009. All units are km3 (adjusted after Dost et al., 2013).
Figure 7. Resource base sheet of WA
drawals to irrigated land, industry and domestic water use
is with 1 km3 yr−1 minimal. While the depletion of this water provides many benefits in terms of energy, the economy
and domestic services, the amount of water being depleted
is very low compared to the significant amount of water depleted by utilized land use. Land use planning is thus crucial
for improving the benefits from water depletion in the Awash
Basin. The introduction of agroforestry systems and shortduration low-water consuming crops could generate more
benefits (e.g., Baudron et al., 2014). A volume of 3.2 km3 is
utilizable flow. This is groundwater that is not utilized. Options for groundwater abstraction and expansion of irrigated
areas could be appraised.
3.2
Probability distribution of WA+ for 2009
The goal of this paper is to investigate the difference between the reference data of Table 7 and the results if the
remote sensing input data is made variable according to the
errors identified by Karimi and Bastiaanssen (2015). For this
purpose the average rainfall year 2009 has been analyzed.
The frequency distribution of the input parameters, randomly
generated through the Monte Carlo technique based on their
levels of uncertainty, is demonstrated in Fig. 8.
While precipitation and ET follow a similar unimodal normal distribution, the area of each land use class follows a bimodal distribution. This different result for land use is related
Hydrol. Earth Syst. Sci., 19, 533–550, 2015
to two factors: firstly, the error is an absolute error and, secondly, the skewness of error probability distribution is low.
The error probability distribution function (PDF) of both precipitation and ET are highly skewed to the right (see Table 4).
The implication is that the majority of cases have an error that
is less than the mean value. As such, randomly generated inputs tend to be more concentrated. For example, the mean
absolute error for ET is 5.4 % with a high positive skewness
of 1.18. This implies that the majority of randomly generated
error levels are less than 5.4 %, with a higher proportion between 0 and 4 % which is the median. Therefore, the generated input data are concentrated around one peak maximum
between −4 and +4 %, which creates a unimodal distribution. For land use area, the low skewness of the error probability distribution function would imply that the randomly
generated inputs are concentrated around the absolute mean
of 14.5 %, which generates two peaks of −14.5 and +14.5 %.
Because the error is absolute, the observed distribution in the
randomly generated input follows a mirrored shaped of the
error PDF for each parameter (see Karimi and Bastiaanssen,
2015).
In addition to variability of remote sensing input data, outflow and reserved flow have also been made variable. Outflow was allowed to vary between 2.5 and 5.7 km3 yr−1 (see
Table 6). The reserved flow variability was taken as equal to
the observed variability of lake evaporation. The water balance of the Awash Basin was closed by mass conservation
www.hydrol-earth-syst-sci.net/19/533/2015/
P. Karimi et al.: Spatial evapotranspiration, rainfall and land use data in water accounting – Part 2
on the storage change. An example of the variability of two
output parameters is demonstrated in Fig. 9.
The results are 1000 versions of the WA+ sheets. Table 8
shows the mean value of all 1000 different versions, referred
to as the stochastic mean. The differences between the original results – using the reference values – and the stochastic
mean are often within a few percent, except for a few interesting cases where the differences are 10.6 % (storage change),
6.3 % (utilizable flow), 7.6 % (beneficial ET fraction), 9.4 %
(basin closure fraction) and 10.6% (reserved flow fraction).
These differences are mainly a result of the larger variability
that each of these parameters have. A few numerical outliers
in the population of the output data distribution of a given
parameter can yield a different mean value of the 1000 water accounts. The large uncertainty of (groundwater) outflow
and its translation into utilizable flow (outflow is utilizable
plus reserved flow) is the root cause of these differences and
is in agreement with the general difficulty of estimating the
groundwater flow of hydrological systems. Since the storage
change is the residual of the water balance, it will automatically also get a large variability. The resource base performance indicators follow the same trend as the absolute values. Hence, the absence of reliable outflow data has, in this
specific case study, impacts on the uncertainty of utilizable
flow and storage change and thus also on the basin closure
fraction.
The stochastically generated data sets of error ranges can
be described by an interval around the mean value. This gives
an indication of the error probability and accuracy of each of
the parameters in a standardized way; it will allow comparing the variability of different parameters. The band widths
surrounding the mean value at 95 % confidence intervals for
the main input and output parameters of WA+ resource base
and evapotranspiration sheets are presented in Table 8.
The interim conclusion is that MC simulations provide a
slightly different result to standard modeling which, for certain parameters, can exceed 5 %. Since the consideration of
larger variability of certain terms is realistic, it is recommended to run the WA+ sheets always in the MC mode.
3.3
Temporal variability and error probabilities for
multiple years
To understand the temporal variability of the error band
width in WA+, the MC analysis was extended to multiple
years. The covered period was 2009–2011. As explained earlier, the period includes an average rainfall year, 2009, a wet
year, 2010, and a dry year, 2011. For every year the MC
model was run 1000 times and a stochastic mean for each
WA+ parameter was calculated. To normalize the variability
of the error component, their CVs (coefficients of variation)
were calculated for all the parameters. Table 9 summarizes
the results of this exercise.
The CV is an indication of the variability of the population
of output values of one particular parameter. In this case, a
www.hydrol-earth-syst-sci.net/19/533/2015/
545
larger variability can be attributed to a larger uncertainty of
the MC results. A CV of 10 % or less is generally considered
indicative of a very good accuracy because the variability is
within an acceptable value range of a particular variable. CV
values in the range of 10–20 % are deemed acceptable and
are close to the accuracy that is generally achieved through
field measurements. Estimates with CVs of more than 20 %
require caution and those with CVs of 40 % are unreliable.
However, in all the cases the mean value must also be considered because a low mean value with a high CV may represent a smaller variation range compared to a high mean with
a low CV.
Figure 10 illustrates the temporal variability of CVs for all
the WA+ parameters and performance indicators in the study
period. A low average CV value implies that the frequency
distribution of a single WA parameter for a given year has a
relatively minor variability, meaning that the results are stable and accurate. The CV for multiple years of the CV of
the stochastic distribution of a single parameter is indicated
by the height of the bar. The latter reflects how vulnerable
a decision is on the time frame considered for the water accounting. A certain WA+ parameter can be more accurate in
a low rainfall year than during a high rainfall year. The results
indicate that CVs for available water, exploitable water, utilized flow, and the outflow, vary from year to year, which is
a mere consequence of the combination of the temporal variable rainfall and temporal constant ET values. Consequently,
the performance indicators that are related to these parameters have varying CVs. These include exploitable water fraction, basin closure fraction, and the reserved flow fraction. In
general, more temporal variability implies lower accuracy.
An important observation is that the majority of the performance indicators show low sensitivity to the input data. Four
out of eight indicators, i.e., available water fraction, T fraction, managed fraction, and beneficial fraction, have CV’s
of less than, or close, to 10 % in all 3 yr. Another two indicators, exploitable water fraction and irrigated ET fraction,
have average CVs of close to 20 % which fall in the acceptable range. All the parameters and indicators that have CVs
of less than 20 % are deemed to be reliable and can be used
in policy formulation processes. However, some of the indicators such as basin closure fraction have a high average CV
and a high temporal variability. The same applies to utilized
flow, utilizable flows, and the reserved flow fraction. This
shows that these parameter and indicators should be treated
with caution and should not be used to formulate policy decisions. Most inaccurate indicators are related to the outflows
and their low reliability is directly linked to the lack of accurate information on groundwater outflows. The uncertainty of
groundwater flows is a general problem in ungauged basins
(Hrachowitz et al., 2013) and should not interpreted as being
typical for the Awash Basin. Hence, extra allocation of water
and exploitation of utilizable flows are highly unreliable, and
should not be done without some cross-examination and execution of advanced groundwater studies. First priority should
Hydrol. Earth Syst. Sci., 19, 533–550, 2015
546
P. Karimi et al.: Spatial evapotranspiration, rainfall and land use data in water accounting – Part 2
Figure 8. Example of the frequency distribution of the randomly simulated input parameters ET, rainfall and land use into the Monte Carlo
simulations for 2009 (for land use estimated area of two classes, i.e., irrigated crops and closed to open shrublands, are demonstrated).
Figure 9. Variability of two selected output parameters for 2009, i.e., incremental ET and landscape ET, following from the Monte Carlo
simulation of 1000 runs.
be given to understanding spatial and temporal variability
of the less-known flows in any basin. In other basins, however, outflow could be measured or modeled with a much
more comfortable accuracy, which will make it feasible to
make decisions on re-allocation of available water resources.
Hence, the uncertain outflow is specific for the Awash Basin.
4
Summary and conclusions
WA+ is a novel analytical framework that summarizes complex hydrological processes and water management issues in
river basins. The framework uses state of the art satellitebased measurements of land and water consumption to quantify hydrological variables and water accounts. This makes
WA+ to a large extent independent from conventional hyHydrol. Earth Syst. Sci., 19, 533–550, 2015
drological measurements. Such independence is necessary to
apply WA+ on any river basin, including poorly gauged and
ungauged basins. However, the use of satellite-based measurements for water accounting may raise concerns about the
reliability of the accounts if they have not been verified on
the ground. To address this concern, this paper examined the
impact of the errors in satellite-based input data to WA+ on
the confidence that policy makers can have in the outputs and
information provided.
The focus of the study was on the WA+ resource base
sheet and evapotranspiration sheet. ET, precipitation, and
land use are the three main satellite-based spatial data sets
used for these two sheets. The Awash Basin in the central Rift
Valley in Ethiopia was used to demonstrate the influence that
errors in the input data could have on the confidence in the
outputs. The analysis covered a period of 3 yr which included
www.hydrol-earth-syst-sci.net/19/533/2015/
P. Karimi et al.: Spatial evapotranspiration, rainfall and land use data in water accounting – Part 2
547
Table 8. Difference between standard and stochastic modeling of the WA+ outputs for 2009 (RB – resource base).
Parameter
Reference
computation
(km3 )
Stochastic
mean
(km3 )
Confidence
interval
(0.95)
(km3 )
Difference
between
standard and
stochastic mean
±28.55
±26.98
±7.76
±7.74
±2.77
±2.80
±0.59
±0.24
±3.10
±3.14
0.3 %
10.6 %
0.3 %
0.0 %
4.4 %
4.9 %
0.0 %
0.5 %
5.4 %
6.3 %
±7.98
±5.14
±3.42
±5.03
±0.37
±3.50
±5.20
0.0 %
0.0 %
0.0 %
0.0 %
0.0 %
7.6 %
3.7 %
±0.05
±0.09
±0.26
±0.16
4.1 %
0.6 %
9.4 %
10.6 %
±0.03
±0.07
±0.03
±0.05
0.1 %
0.2 %
7.7 %
5.4 %
Resource base sheet
Precipitation
Storage change
Net inflow
Landscape ET
Exploitable water
Available water
Utilized flow
Reserved flows
Outflow
Utilizable flow
59.80
−0.40
60.20
55.37
4.83
4.21
0.98
0.62
3.84
3.22
59.96
−0.45
60.41
55.36
5.05
4.42
0.98
0.62
4.07
3.44
Evapotranspiration sheet
Total ET
ET managed
T total
E total
I total
Beneficial depletion
Non-benef. depletion
56.36
17.34
18.00
36.31
2.05
20.08
36.28
56.35
17.33
18.00
36.30
2.05
18.66
37.69
RB sheet indicators∗
Exploitable water fraction
Available water fraction
Basin closure fraction
Reserved flow fraction
0.08
0.87
0.23
0.16
0.08
0.87
0.26
0.18
Evapotranspiration sheet indicators∗
T fraction
Managed fraction
Beneficial fraction
Irrigated ET fraction
0.32
0.31
0.36
0.10
0.32
0.31
0.33
0.11
∗ Indicators are dimensionless.
an average rainfall year (510 mm yr−1 ) 2009, a wet year
(862 mm yr−1 ) 2010, and a dry year (364 mm yr−1 ) 2011.
Spatial ET data for the Awash Basin was computed by means
of the ETLook model. Daily rainfall maps were acquired
from the FEWS NET, and a land use map, customized by
Dost et al. (2013) was also used for the application of water
accounting in the Awash Basin. The errors in these satellitebased land and water use measurements are based on a comprehensive review by Karimi and Bastiaanssen (2015). The
Monte Carlo technique that is based on selecting numbers
randomly from a predefined probabilistic distribution was
used for stochastic simulation of WA+ outputs. The simulation was repeated 1000 times for all 3 yr.
The results of this exercise show that the stochastic mean
of the majority of WA+ parameters and performance indiwww.hydrol-earth-syst-sci.net/19/533/2015/
cators (13 out of 25) are within a 1 % deviation from the
original value. Out of 25, 19 are within a 5 % deviation. The
maximum deviation of 10 % was observed for the storage
change and reserved flow fraction. This shows that stochastic simulation can be used as part of a standard procedure to
produce water accounts with WA+. There are two main advantages related to the MC technique. Firstly, it allows for
the incorporation and acknowledgement of input data errors
in producing water accounts. Secondly, it provides the possibility to estimate and report on the error bandwidth that
surrounds every WA+ output. The latter is of essential value
to informed decision making, as it enables users to better understand the error margin that is associated with the generated information. The goal is to separate reliable information
from that with low reliability. In such a way, outputs with a
Hydrol. Earth Syst. Sci., 19, 533–550, 2015
548
P. Karimi et al.: Spatial evapotranspiration, rainfall and land use data in water accounting – Part 2
Table 9. Temporal variability of WA+ across a longer period with low and high rainfall years.
Parameter
2009
Mean
2010
CV
Mean
2011
CV
Mean
CV
23 %
77 %
6.7 %
7.2 %
12 %
52 %
14 %
19 %
17 %
20 %
42.84
−17.25
60.09
56.20
3.89
1.26
3.17
0.71
2.62
1.91
24 %
61 %
6.8 %
7.2 %
15 %
23 %
18 %
20 %
22 %
30 %
65.30
20.01
25.95
36.25
3.11
26.64
38.66
7.3 %
15 %
9%
7%
8.8 %
8.9 %
6.9 %
57.46
17.65
20.76
34.61
2.10
21.49
35.97
7%
15 %
9.3 %
6.8 %
9%
9.2 %
6.8 %
0.09
0.89
0.14
0.13
0.40
0.31
0.41
0.10
13 %
3%
73 %
39 %
3%
12 %
3%
21 %
0.06
0.81
0.40
0.28
0.36
0.31
0.37
0.11
15 %
5%
20 %
22 %
4%
12 %
4%
20 %
Resource base sheet
Precipitation
Storage change
Net inflow
Landscape ET
Exploitable water
Utilized flow
Available water
Reserved flows
Outflow
Utilizable flow
59.96
−0.45
60.41
55.36
5.05
0.98
4.42
0.62
4.07
3.44
24 %
–
6.8 %
7.4 %
27 %
30 %
5.3 %
18 %
38 %
45 %
101.51
30.81
70.70
64.60
6.10
0.71
5.44
0.66
5.40
4.74
Evapotranspiration sheet
Total ET
ET managed
T total
E total
I total
Beneficial depletion
Non-benef. depletion
56.35
17.33
18.00
36.30
2.05
18.66
37.69
7.5 %
15 %
10 %
7.3 %
9.6 %
9.8 %
7.3 %
Indicators
Exploitable water fraction
Available water fraction
Basin closure fraction
Reserved flow fraction
T fraction
Managed fraction
Beneficial fraction
Irriated ET fraction
0.08
0.87
0.26
0.18
0.32
0.31
0.33
0.11
27 %
5%
51 %
45 %
5%
12 %
5%
21 %
high error margin and low reliability will be identified and
it is recommended that they should not be used to formulate policy decisions. This reliability can be normalized and
quantified by calculating coefficients of variation for all the
WA+ parameters.
Results of the multiyear analysis for the Awash Basin, after incorporating input data error, showed that the majority
of WA+ parameters and performance indicators have CVs
of less than 20 % which implies that they are reliable. The
results also indicate that parameters and indicators such as
utilized flow, utilizable flow, and basin closure fraction have
a high margin of error and thus have low reliability. This
implies, for instance, that despite the fact that accounting
results show that the utilizable flow is on average about
3.4 km3 yr−1 , this estimate has low reliability. The same applies for the figures related to basin closure fraction and utilized flow. In other words, although the accounting outputs,
i.e., utilized flow, utilizable flow, and basin closure fraction,
suggest that more water can be utilized in the basin, the high
Hydrol. Earth Syst. Sci., 19, 533–550, 2015
margin of error associated with these outputs means they are
not reliable enough to be used for formulating policy decisions. As such, more research with more accurate input data
is required to verify and endorse such possibilities which,
in this case, are related to uncertain groundwater flows in
deeper geological layers. This finding applies to the Awash
Basin and cannot be generalized because for many basins,
the discharge at the river mouth is not properly measured or
modeled.
Every measurement, regardless of the method used, has
some level of uncertainty. In many instances, hydrologists
and engineers know the uncertainty associated with in situ
measurements such as runoff, canal water levels, etc., yet
these estimates are used in studies and in policy decision
making. It is a fact that compared to ground measurements,
our knowledge on the accuracy of remote-sensing-based estimates of hydrological parameters is less complete. The review conducted by Karimi and Bastiaanssen (2015) provides
essential information in this regard for annual and seasonal
www.hydrol-earth-syst-sci.net/19/533/2015/
P. Karimi et al.: Spatial evapotranspiration, rainfall and land use data in water accounting – Part 2
549
Figure 10. The level of inaccuracy expressed as a coefficient of variation for a dry, a wet and an average rainfall year. The height of the bars
expresses temporal variability. The background colors indicate where a certain parameter should be considered in the water management
decision process.
estimates. At this timescale, remote-sensing-based model
performance outweighs monthly, weekly, and daily scale estimates that are known to have larger uncertainties. The important point is to acknowledge these uncertainties while processing information and inform the users accordingly. Nevertheless, remote-sensing-based information can be very valuable in data-scarce areas of the world and can contribute to
bridging spatial scales in hydrology (Stewart et al., 1996).
Acknowledgements. Funds for this research were provided by the
CGIAR Research Programme on Water Land and Ecosystem.
Edited by: B. van den Hurk
References
Allen, R. G., Tasumi, M., Morse, A., Trezza, R., Wright, J. L.,
Bastiaanssen, W., Kramber, W., Lorite, I., and Robison, C. W.:
Satellite-Based Energy Balance for Mapping Evapotranspiration
with Internalized Calibration (METRIC) – Applications, J. Irrig.
Drain. Eng., 133, 395–406, 2007.
Ayenew, T.: Numerical groundwater flow modelling of the Central
Main Ethiopian Rift lakes basin, SINET Ethiop. J. Sci., 24, 167–
184, 2001.
Ayenew, T., Kebede, S., and Alemyahu, T.: Environmental isotopes
and hydrochemical study applied to surface water and groundwater interaction in the Awash, Hydrol. Process., 22, 1548–1563,
doi:10.1002/hyp.6716, 2008.
www.hydrol-earth-syst-sci.net/19/533/2015/
Bastiaanssen, W. G. M.: Water accountants: de nieuwe generatie
waterbeheercontroleurs, intreerede, in: Inaugural Address, Delft
University of Technology, Delft, the Netherlands, p. 16, 2009.
Bastiaanssen, W. G. M. and Chandrapala, L.: Water balance variability across Sri Lanka for assessing agricultural and environmental water use, Agr. Water Manage., 58, 171–192, 2003.
Bastiaanssen, W. G. M., Cheema, M. J. M., Immerzeel, W. W., Miltenburg, I., and Pelgrum, H.: The surface energy balance and
actual evapotranspiration of the transboundary Indus Basin estimated from satellite measurements and the ETLook model,
Water Resour. Res., 48, W11512, doi:10.1029/2011WR010482,
2012.
Bastiaanssen, W. G. M., Karimi, P., Rebelo, L.-M., Duan, Z., Senay,
G., Muttuwatte, L., and Smakhtin, V.: Earth observation-based
assessment of the water production and water consumption of
Nile Basin Agro-Ecosystems, Remote Sensing, 6, 10306–10334,
2014.
Baudron, F., Jaleta, M., Okitoi, O., and Tegegn, A.: Conservation
agriculture in African mixed crop-livestock systems: Expanding
the niche, Agr. Ecosyst. Environ., 187, 171–182, 2014.
Behailu, S.: Stream flow simulation for the Upper Awash Basin,
MSc Thesis, Addia Ababa University, Addis Ababa, 2004.
Bicheron, P., Defourny, P., Brockmann, C., Schouten, L., Vancutsem, C., Huc, M., Bontemps, S., Leroy, M., Achard, F., Herold,
M. F., Ranera, F., and Arino, O.: GLOBCOVER Products Report Description and Products Description and Validation Report,
MEDIAS, Toulouse, France, 2008.
CA: Water for Food, Water for Life: A Comprehensive Assessment
of Water Management in Agriculture, Earthscan, London and International Water Management Institute, Colombo, 2007.
Hydrol. Earth Syst. Sci., 19, 533–550, 2015
550
P. Karimi et al.: Spatial evapotranspiration, rainfall and land use data in water accounting – Part 2
Döll, P. and Siebert, S.: A digital global map of irrigated areas, ICID
J., 49, 55–66, 2000.
Dost, R., Obando, E. B., Bastiaanssen, W., and Hoogeveen, J.:
Background report: Water accounting+ in the Awash River
Basin, eLEAF Report, Wageningen, the Netherlands, 56 pp.,
2013.
Drooger, P., Simons, G. W. H. G., Bastiaanssen, W. G. M., and
Hoogeveen, J.: Water accounting Okavango; Coping with water
scarcity – developing national water audits Africa, WaterWatch,
Wageninegen, the Netherlands, 58 pp., 2010.
Edossa, D. C., Babel, M. S., and Das Gupta, A.: Drought Analysis
in the Awash River Basin, Ethiopia, Water Resour. Manage., 24,
1441–1460, doi:10.1007/s11269-009-9508-0, 2010.
EVDSA – Ethiopian Valleys Development Studies Authority: Master plan for the development of Surface water resources in the
Awash Basin, Addis Ababa, Ethiopia, 1989.
Falkenmark, M. and Rockström, J.: The new Blue and Green water paradigm: Breaking new ground for water resources planning
and management, J. Water Resour. Pl. Manage., 132, 129–132,
2006.
FAO: Review of world water resources by country, Water Report
No. 23, Rome, Italy, 2003.
FAO: Coping with water scarcity; an action framework for agriculture and food security, Water Reports No. 38, FAO, Rome, Italy,
78 pp., 2012.
Herman, A., Kumar, V. B., Arkin, P. A., and Kousky, J. V.: Objectively determined 10-day African rainfall estimates created for
famine early warning systems, Int. J. Remote Sens., 18, 2147–
2159, doi:10.1080/014311697217800, 1997.
Hrachowitz, M., Savenije, H. H., Bloschl, G., McDonnell, J. J.,
Sivapalan, M., Pomeroy, J., Arheimer, B., Blume, T., Clark, M.
P., Ehret, U., Fenicia, F., Freer, J. E., Gelfan, A., Gupta, H.
V., Hughes, D. A., Hut, R., Montanari, A., Pande, S., Tetzlaff,
D., Troch, P. A., Uhlenbrook, S., Wagener, T., Winsemius, H.,
Woods, R. A., Zehe, E., and Cudennec, C.: A decade of Predictions in Ungauged Basins (PUB) – a review, Hydrolog. Sci. J.,
58, 1198–1255, 2013.
Karimi, P., Molden, D., Bastiaanssen, W. G. M., and Cai, X.: Water
accounting to assess use and productivity of water: evolution of
a concept and new frontiers, in Water accounting: International
approaches to policy and decision-making, edited by: Godfrey,
J. M. and Chalmers, K., Edward Elgar Publishing, Cheltenham,
UK, 76–88, 2012.
Karimi, P., Bastiaanssen, W. G. M., and Molden, D.: Water Accounting Plus (WA+) – a water accounting procedure for
complex river basins based on satellite measurements, Hydrol. Earth Syst. Sci., 17, 2459–2472, doi:10.5194/hess-17-24592013, 2013a.
Karimi, P., Bastiaanssen, W. G. M., Molden, D., and Cheema, M. J.
M.: Basin-wide water accounting based on remote sensing data:
an application for the Indus Basin, Hydrol. Earth Syst. Sci., 17,
2473–2486, doi:10.5194/hess-17-2473-2013, 2013b.
Hydrol. Earth Syst. Sci., 19, 533–550, 2015
Karimi, P. and Bastiaanssen, W. G. M.: Spatial evapotranspiration,
rainfall and land use data in water accounting – Part 1: Review
of the accuracy of the remote sensing data, Hydrol. Earth Syst.
Sci., 19, 507–532, doi:10.5194/hess-19-507-2015, 2015.
Meskale, M.: Hydrogeology of South Afar and adjacent areas,
MSc Thesis, International Inst. for Aerial Survey and Earth Sciences, Enschede, the Netherlands, 1982.
Molden, D.: Accounting for water use and productivity, SWIM paper 1, International Water Management Institute, Colombo, Sri
Lanka, 1997.
Molden, D. and Sakthivadivel, R.: Water Accounting to Assess Use
and Productivity of Water, Int. J. Water Resour. Dev., 15, 55–71,
doi:10.1080/07900629948934, 1999.
Neale, C. M. U., Geli, H. M. E., Kustas, W. P., Alfieri, J. G., Gowda,
P. H., Evett, S. R., Prueger, J. H., Hipps, L. E., Dulaney, W. P.,
Chávez, J. L., French, A. N., and Howell, T. a.: Soil water content estimation using a remote sensing based hybrid evapotranspiration modeling approach, Adv. Water Resour., 50, 152–161,
doi:10.1016/j.advwatres.2012.10.008, 2012.
Pelgrum, H. and Bastiaanssen, W. G. M.: An Intercomparison
of Techniques to Determine the Area-Averaged Latent Heat
Flux from Individual in Situ Observations: A remote Sensing Approach Using the European Field Experiment in a
Desertification-Threatened Area Data, Water Resour. Res., 32,
2775–2786, doi:10.1029/96WR01396, 1996.
Shilpakar, R. L., Bastiaanssen, W. G. M., and Molden, D. J.: A remote sensing-based approach for water accounting in the East
Rapti River Basin, Nepal, Himal. J. Sci., 7, 15–30, 2012.
Smakhtin, V. U. and Eriyagama, N.: Developing a software package
for global desktop assessment of environmental flows, Environ.
Model. Softw., 23, 1396–1406, 2008.
Stewart, J. B., Engman, E. T., Feddes, R. A., and Kerr, Y.: Scaling
up in hydrology using remote sensing, Wiley, New York, 270 pp.,
1996.
Taddese, G., Sonder, K., and Peden, D.: The water of the Awash
River basin a future challenge to Ethiopia, Addis Ababa,
Ethiopia, 2003.
UNDP: Geology, geochemistry and hydrology of hot springs of the
East African Rift system within Ethiopia, New York, 1973.
UN-Water: UN-Water country briefs project, Geneva, 2013.
Vörösmarty, C. J., McIntyre, P. B., Gessner, M. O., Dudgeon, D.,
Prusevich, A., Green, P., Glidden, S., Bunn, S. E., Sullivan, C.
A., Liermann, C. R., and Davies, P. M.: Global threats to human water security and river biodiversity, Nature, 467, 555–561,
doi:10.1038/nature09440, 2010.
Wolf, A. T., Yoffe, S. B., and Giordano, M.: International waters?:
identifying basins at risk, Water Policy, 5, 29–60, 2003.
Yilmaz, M. T., Anderson, M. C., Zaitchik, B., Hain, C. R., Crow,
W. T., Ozdogan, M., Chun, J. A., and Evans, J.:Comparison
of prognostic and diagnostic surface flux modeling approaches
over the Nile River basin, Water Resour. Res., 50, 386–408,
doi:10.1002/2013WR014194, 2014.
www.hydrol-earth-syst-sci.net/19/533/2015/
© Copyright 2026