
Post-Programme Surveillance Report. Ireland, Autumn 2014 (3 MB)
ISSN 1725-3209 (online)
ISSN 1725-3195 (print)
EUROPEAN
ECONOMY
Occasional Papers 210 | January 2015
Post-Programme Surveillance Report
Ireland, Autumn 2014
Economic and
Financial Affairs
Occasional Papers are written by the staff of the Directorate-General for Economic and Financial
Affairs, or by experts working in association with them. The Papers are intended to increase
awareness of the technical work being done by staff and cover a wide spectrum of subjects. Views
expressed in unofficial documents do not necessarily reflect the official views of the European
Commission.
Comments and enquiries should be addressed to:
European Commission
Directorate-General for Economic and Financial Affairs
Unit Communication
B-1049 Brussels
Belgium
E-mail: [email protected]
LEGAL NOTICE
Neither the European Commission nor any person acting on its behalf may be held responsible for
the use which may be made of the information contained in this publication, or for any errors
which, despite careful preparation and checking, may appear.
This paper exists in English only and can be downloaded from
http://ec.europa.eu/economy_finance/publications/.
More information on the European Union is available on http://europa.eu.
KC-AH-15-210-EN-N (online)
ISBN 978-92-79-44807-2 (online)
doi:10.2765/11548 (online)
KC-AH-15-210-EN-C (print)
ISBN 978-92-79-44808-9 (print)
doi:10.2765/465703 (print)
© European Union, 2015
Reproduction is authorised provided the source is acknowledged.
European Commission
Directorate-General for Economic and Financial Affairs
Post-Programme Surveillance Report
Ireland, Autumn 2014
EUROPEAN ECONOMY
Occasional Papers 210
ACKNOWLEDGEMENTS
The report was prepared in the Directorate General for Economic and Financial Affairs under the
direction of Servaas Deroose, Deputy Director-General, István Pál Székely, Director, and Laura Bardone,
Advisor in transition, and Martin Larch, Head of Unit for Ireland at the Directorate-General Economic
and Financial Affairs.
The main contributors were Stephanie Medina Cas, Quentin Dupriez, Mirzha de Manuel Aramendia,
Irena Peresa, and Stefano Santacroce. Specific contributions by Piotr Bogumił are gratefully
acknowledged. Statistical assistance was provided by Jacek Szelożyński. Comments gratefully received
from Victor Savin and Rada Tomova (Directorate-General Financial Stability), Miguel Kruse Trigo and
Pino Maurits (both Directorate-General Competition).
The report was prepared in liaison with the European Central Bank.
Comments on the report would be gratefully received and should be sent, by mail or e-mail to:
Martin Larch
European Commission
Head of Unit responsible for Ireland, Lithuania and Poland
CHAR 14/174
B-1049 Brussels
E-mail: [email protected]
The report reflects information available as of December 31, 2014.
ii
Executive Summary
7
1.
Introduction
10
2.
Recent economic developments and outlook
11
3.
Policy issues
25
3.1.
Public finances
25
3.2.
Financial sector
29
3.2.1. Improving financial stability
29
3.2.2. Reducing non-performing loans
31
3.2.3. Financing the economy
33
Structural reforms
34
3.3.1. Improving the labour market and addressing skills mismatches
34
3.3.2. Raising value-for-money in healthcare
35
3.3.3. Reforming the water sector
36
3.3.4. Reducing legal services costs
38
Financing issues and capacity to repay
42
3.3.
4.
A1. State of play with Macroeconomic Imbalance Procedure (MIP) relevant
recommendations
44
A2. Debt sustainability analysis
47
A3. Supplementary tables
51
LIST OF TABLES
2.1.
Main elements of the Commission 2014 Autumn Forecast
15
2.2.
Financial sector indicators
16
2.3.
Mortgage Arrears Resolution Targets (MART) overview
20
3.1.
Holdings of deferred tax assets (DTAs) and government preference shares
31
3.2.
International comparison of water charges (euros per annum)
37
4.1.
Government Financing Plans
43
A2.1. Public debt projections under baseline and alternative scenarios and sensitivity tests
49
A3.1. Fiscal accounts
51
A3.2. General government debt projections (based on 2014 Autumn forecast)
52
3
LIST OF GRAPHS
2.1.
Imports and Exports
11
2.2.
Recent economic developments
14
2.3.
Recent financial developments
17
2.4.
Banks' liquidity and solvency positions
18
3.1.
General government deficit projections
25
3.2.
EDP targets and fiscal consolidation effort
26
3.3.
Expenditure Ceiling Reconciliation for 2015
28
A2.1. Annual change in gross debt ratio, baseline scenario
47
A2.2. Public debt sustainability under different scenarios
48
A2.3. Public debt projection under interest rate shocks
49
A2.4. Public debt projection under growth and inflation shocks
50
LIST OF BOXES
2.1.
4
The statistical impact of the transition to ESA 2010 and other revisions
21
2.2.
The outcome of the ECB/EBA comprehensive assessment (CA)
23
3.1.
An exercise projecting non-performing loan (NPL) dynamics
39
3.2.
Water sector reforms in perspective
41
ABBREVIATIONS
AIB: Allied Irish Bank
AIF: Alternative Investment Fund
AQR: asset quality review
BEPS: base erosion and profit shifting
BOI: Bank of Ireland
BTL: buy-to-let
CBI: Central Bank of Ireland
CER: Commission for Energy Regulation
CET1: core equity tier 1
CRD: Capital Requirements Directive
CRE: commercial real estate
CRR: Capital Requirements Regulation
DTA: deferred tax asset
EBA: European Banking Authority
EC: European Commission
ECB: European Central Bank
EFSF: European Financial Stability Facility
EFSM: European Financial Stabilisation Mechanism
ESM: European Stability Mechanism
ETBs: education and training boards
FET: further education and training
GP: general practitioner
HSE: Health Service Executive
IDR: in-depth review
IFAC: Irish Fiscal Advisory Council
INN: international non-proprietary name
IPHA: Irish Pharmaceutical Healthcare Association
ISI: Insolvency Service of Ireland
ISIF: Ireland Strategic Investment Fund
LTV: loan-to-value
MART: mortgage arrears restructuring targets
MDPs: multidisciplinary practices
MIP: Macroeconomic Imbalance Procedure
NFCs: non-financial corporations
NPLs: Non-performing loans
NPRF: National Pensions Reserve Fund
NTMA: National Treasury Management Agency
PDH: principal dwelling houses
PPM: post-programme monitoring
PPS: post-programme surveillance
PTSB: Permanent TSB
SBCI: Strategic Banking Corporation of Ireland
SCP: Stability and Convergence Programme
SGP: Stability and Growth Pact
SME: small and medium sized enterprise
v
SSM: Single Supervisory Mechanism
yoy: year-on-year
vi
EXECUTIVE SUMMARY
This second post-programme surveillance (PPS) report provides an assessment of Ireland's
economic, fiscal and financial situation following the completion of the EU-IMF financial assistance
programme. Financial market conditions have improved further, especially for the sovereign as bond
yields have reached historic lows. The fiscal situation has also continued to improve thanks to the
consolidation measures of budget 2014 and with a stronger than previously expected economic recovery.
The recovery in the banking sector is still on-going with two out of three domestic banks back to
profitability. Unemployment remains on a downward path. As global conditions are uncertain, and public
and private debt levels are still very high, it is important to take advantage of the current favourable
financial and economic conditions to complete the adjustment process towards balanced and sustainable
economic growth. Thus, the authorities need to continue the policy path undertaken in the past several
years, in particular through sustained budget consolidation, ambitious structural reforms and financial
sector repair.
The economic recovery is solid though there is some uncertainty concerning its underlying strength.
In 2014, annual GDP growth could exceed the Commission 2014 autumn forecast of 4.6%. However, this
headline figure may overestimate the underlying buoyancy of the economy, as net exports have been
boosted by contracted export production abroad, which has only an indirect impact on the domestic
economy and may be a temporary factor. Domestic demand is expected to contribute 2.3 percentage
points to real GDP growth in 2014 in spite of a slowdown in the third quarter. In the housing market,
rising demand and the low level of new construction supply have pushed up prices rapidly, especially in
Dublin, though private sector credit remains low. As for 2015, investment and private consumption are
expected to recover from low levels and drive growth while the expansionary package in budget 2015
could add up to 0.3 percentage point to GDP growth. Average real GDP growth in 2015 is estimated at
around 3.5%. The main uncertainties around the growth outlook relate to the evolution of exports and
personal consumption, and possible slowdown in the rest of the euro area.
Despite measurable overspending in 2014, the general government deficit is expected to stay within
the ceiling recommended under the Excessive Deficit Procedure (EDP). The 2015 Draft Budgetary
Plan (DBP) targeted a deficit of 3.7% of GDP in 2014. During the second PPS mission the authorities
communicated there would be additional spending of around 0.3% of GDP in 2014, mainly in health care.
Unlike in previous years these spending pressures will not be offset by savings elsewhere. In addition,
following the deferral of water charges to 2015, a capital transfer to Irish Water of about 0.15% of GDP
was front-loaded to 2014. Overall, the 2014 general government deficit is likely to be above 4.0% of GDP
– but still within the 2014 EDP ceiling of 5.1% of GDP. For 2015, while announcing some tax cuts and
increases in expenditure, the government affirmed its commitment to bring the general government deficit
below the 3%-of-GDP reference value. However, based on the Commission 2014 autumn forecast, the
margin is narrow and there are medium-term risks from spending pressures linked to demographic
changes, public service pay and pensions. More ambitious deficit targets would have helped putting the
still very high debt-to-GDP ratio firmly on a downward path.
Financial restructuring continues in the domestic banks. Following the Single Supervisory
Mechanism's (SSM) comprehensive assessment (CA), the remaining restructuring and disposal of the
state's holdings in the three main banks is expected to advance. As anticipated, of the three domestic
banks, only Permanent TSB (PTSB) did not meet the capital requirement under the CA's adverse stress
scenario. The bank has submitted a capital plan to the SSM identifying measures to address the EUR 855
million capital shortfall. The plan was reviewed by the SSM Board and received initial approval in
December. PTSB has mandated an external consultant to assist it in raising capital and has had extensive
contacts with private investors. The bank's management is confident that any remaining gap not addressed
mostly via deleveraging and improved pre-provision profits in 2014 will be filled by private capital. The
authorities also indicated that a first sale of part of Allied Irish Bank (AIB) to the private sector could take
place from late 2015.
7
The restructuring of mortgage and commercial loan arrears continues to progress gradually. In the
third quarter 2014, the mortgage arrears restructuring targets (MART) set by the Central Bank of Ireland
(CBI) were met. However, about half of all solutions continue to rely on legal action using the threat of
repossession. Actual repossessions remain low but are increasing at an accelerated pace, in spite of the
lengthy foreclosure process. As for commercial loans, restructurings continue to advance even though this
remains a drawn-out and lengthy process that needs careful supervision. A pick up in the domestic
property market has aided portfolio sales of commercial loans by the domestic banks.
Amidst strong house price increases, macro prudential measures to regulate mortgage lending aim
at containing risks early on. The CBI announced plans to introduce loan-to-value and loan-to-income
limits in early 2015 in order to lower the risk of future bank credit and housing booms. The plan was
subject to a public consultation and follows a rapid rise in house prices, particularly in Dublin. There are
also discussions to introduce a mortgage insurance scheme to mitigate the possible impact of the proposed
macro prudential measures on first-time buyers. Any potential insurance scheme will need to be assessed
carefully to not undermine the objectives of the measures.
With small and medium sized enterprise (SME) credit demand remaining weak and interest rates
on SME loans comparatively high, state initiatives to boost lending in this sector need to be
carefully assessed. The recently established state development corporation for SMEs, the Strategic
Banking Corporation of Ireland (SBCI), is expected to begin providing loans via existing credit
institutions towards the end of 2014. It will have about EUR 800 million (0.45% of GDP) in funds and
some of the lending will involve state guarantees subject to "de minimis" rules under EU state-aid law.
The new government lending initiatives are being introduced as, based on available statistics, interests
rates on SME loans remain higher than in other EU countries.
Structural reforms are making uneven progress. Reforms to further education and training are
advancing apace, even though it will take time before the new institutional setup and training programmes
are entirely effective in addressing skills mismatches. The implementation of the JobPath programme
should provide welcome additional activation support to the long-term unemployed starting in the second
half of 2015. Key strands of reforms in healthcare are progressing with the gradual establishment of
universal free access to care, the implementation of the eHealth strategy, reforms to the hospital funding
model and pricing mechanisms for medicinal products. Nonetheless, further advances will be necessary to
reap additional efficiency gains and better control health expenditure, which regularly exceeds planned
ceilings, without compromising healthcare delivery. Enactment of the Legal Services Regulation Bill will
not take place in 2014 as planned and the establishment of multidisciplinary practices faces increased
uncertainty. The water sector reforms were modified in November 2014 with major changes in the
proposed structure and level of charges.
Based on the analysis in this report, repayment risks for European Financial Stability Mechanism
(EFSM) and European Financial Stability Facility (EFSF) loans remain low. Market access
conditions for the Irish sovereign have considerably improved due to benign market conditions, policy
actions at national and European levels and recovering confidence in the Irish economy as reflected in a
recent credit rating upgrade. In addition, cash buffers of the sovereign remain at comfortable levels.
Following decisions in June 2013, the average maturity of EFSM and EFSF loans to Ireland was extended
by 7 years. The first principal repayments of the EFSF loans are due in 2029, and in case of the EFSM
loans principal repayments are not expected before 2027, if the 2015 maturity of this loan is extended as
expected. Annual interest payments on EFSM and EFSF loans amount to a combined 0.6% of GDP.
The results of specific monitoring under the Macroeconomic Imbalances Procedure (MIP) suggest
that Ireland has made some progress in addressing the relevant Council recommendations. The
2014 in-depth review (IDR) for Ireland carried out under the MIP after the completion of the EU-IMF
financial assistance programme concluded that the remaining macroeconomic imbalances require decisive
policy action and specific monitoring. As a result, the Council, pursuant to a recommendation from the
8
Commission, issued country-specific recommendations (CSRs) to Ireland in July 2014. The specific
monitoring of the implementation of the MIP-related recommendations relies on PPS and was launched
with the second PPS mission. Overall, there has been some progress with CSRs in the areas of fiscal
consolidation, labour market, SMEs and mortgage arrears restructuring: the 2015 budget is in compliance
with the provisions of the Stability and Growth Pact (SGP); the introduction of training and activation
programmes is progressing as planned; financing conditions for SMEs should somewhat improve
following recent initiatives; and the restructuring of loans in arrears continues to meet targets. However,
additional reforms are needed to ensure full implementation of the relevant CSRs.
9
1.
INTRODUCTION
Staff from the European Commission (EC), in liaison with the European Central Bank (ECB),
undertook the second PPS review mission for Ireland from 17-21 November 2014. The mission was
coordinated with the IMF's post-programme monitoring (PPM) mission. The European Stability
Mechanism (ESM) participated in the meetings on aspects related to its own Early Warning System. The
newly-established Single Supervisory Mechanism (SSM) was also represented in the relevant meetings
on Irish banks, with staff from both the ECB and the national competent authority, the Central Bank of
Ireland (CBI). PPS aims at a broad monitoring of economic, fiscal and financial conditions with a view to
assessing the repayment capacity of a country having received financial assistance (1). While there is no
policy conditionality under PPS, the Council can issue recommendations for corrective actions if
necessary and where appropriate. PPS is biannual in terms of reporting and missions. The first PPS
mission took place at the end of April and beginning of May.
Specific monitoring of the adjustment of Macroeconomic Imbalances was also launched with the
second PPS mission. The 2014 in-depth review (IDR) carried out under the macroeconomic imbalances
procedure (MIP) for Ireland concluded that remaining imbalances require decisive policy action and the
specific monitoring of the implementation of MIP-related country specific recommendations (CSRs)(2). A
detailed overview of the progress made with these recommendations is provided in Annex 1.
(1) PPS is foreseen by Article 14 of the two-pack Regulation (EU) N°472/2013. It started after the expiry of the EU/IMF financial
assistance programme and lasts at least until 75% of the financial assistance has been repaid.
(2) See communication from the Commission to the European Parliament, the Council and the Eurogroup: "Results of in-depth
reviews under Regulation (EU) No 1176/2011 on the prevention and correction of macroeconomic imbalances"
http://ec.europa.eu/economy_finance/economic_governance/documents/2014-03-05_in-depth_reviews_communication_en.pdf
10
2.
RECENT ECONOMIC DEVELOPMENTS AND OUTLOOK
Recent economic data reveal a strong pick-up in growth though there is uncertainty over its
underlying strength. Quarterly national accounts data for the first three quarters of 2014 indicate that the
Irish economy reached a turning point in the latter part of 2013. The recovery appears to be driven mostly
by net exports and, although to a lesser extent, by gross fixed capital formation. Conversely, personal
consumption has not yet caught up with high frequency indicators. In the first three quarters of 2014, real
GDP was up 4.9% year-on-year (yoy), with net exports contributing 3.4 percentage points to this growth
figure. Some of this strength in exports may be of a temporary nature, however, as it appears to be linked
to a surge in contracted production abroad (3) and does not have the same impact in employment and tax
revenues as local production. In this regard, there has been a break in the relationship between customsbased and national accounts-based trade data (Graph 2.1). This relationship could possibly revert to
normal and reduce the contribution from net exports in the future, or generate further complications in the
interpretation of Irish national accounts. This conjecture is corroborated by data for the third quarter,
when real GDP remained essentially constant on the previous three months.
Graph 2.1:
18
Imports and Exports
EUR bn
28
Imports of goods, customs
vs. national accounts
17
EUR bn
Exports of goods, customs
vs. national accounts
26
16
15
24
14
13
22
12
20
11
10
18
National accounts
9
National accounts
Customs
Customs
8
16
Q3-14
Q1-14
Q3-13
Q1-13
Q3-12
Q1-12
Q3-11
Q1-11
Q3-10
Q1-10
Q3-09
Q1-09
Q3-08
Q1-08
Q3-07
Q1-07
Q3-14
Q1-14
Q3-13
Q1-13
Q3-12
Q1-12
Q3-11
Q1-11
Q3-10
Q1-10
Q3-09
Q1-09
Q3-08
Q1-08
Q3-07
Q1-07
Source: CSO
Domestic demand has firmed up while property prices continue to rise. Aside from net exports, the
recovery is also underpinned by gross fixed capital formation, which grew 10.9% yoy in the first three
quarters of 2014. Personal consumption grew 1% yoy in the first half of 2014 but appears to have stalled
in the third quarter. However, personal consumption may be more buoyant in reality than captured by the
preliminary estimates for Q3, given rising employment and tax revenues (4), and positive high frequency
indicators. Retails sales have been on a rising trend since mid-2013, the purchasing managers' index has
been above 55 since March 2014 and industrial production has increased in annual terms at double-digit
rates every month in 2014 except for June. Consumer confidence has improved sharply to a historic peak
in October. In the housing market, pent-up demand and the low level of new construction have pushed up
prices. Residential property prices rose by 16.3% yoy in October 2014, with price inflation higher in
Dublin than in the rest of Ireland. Still, the number of transactions is small and the national property price
index remains 38.2% below its 2007 peak. Supply constraints, if they were to persist, could exert
(3) Contracted production occurs when a resident entity in Ireland contracts production of goods abroad. The sale of the good is
recorded as an export from Ireland (and inputs used during the production process are also recorded as imports to Ireland)
irrespective of them not entering Irish soil.
(4) VAT receipts were EUR 10,822 million in the year to December, that is, 3% or EUR 312 million ahead of profile. Excise duties
and income tax receipts were also ahead of profile by 5.7% and 08% respectively.
11
European Commission
Ireland - Post-Programme Surveillance
persistent significant upward pressures on residential prices. However, construction is picking up, with
commencement notices and house completions beginning to rise from low levels.
Real GDP growth is projected at 4.6% or more in 2014 before returning to more moderate, albeit
still robust, rates in 2015 and 2016. The business cycle has, for the moment, decoupled from that of the
euro area, with Ireland benefiting from its strong trade links with the more dynamic UK and US markets
and with its own domestic rebound in place. Net exports and the recovery in domestic demand are likely
to push real annual GDP growth above 4.6 % in 2014, in excess of the Commission 2014 autumn
forecast, given a carry-over of 4.7% after three quarters. Growth in 2015 and 2016 is projected at around
3.6% as investment and private consumption rise from low levels. Tax cuts and additional expenditures
could add up to 0.3 percentage point to GDP growth in 2015. Conversely, the main uncertainties relate to
the evolution of goods exports, which could be affected by changes in foreign contracting by resident
multinationals and a slowdown in the euro area. It also remains to be seen whether personal consumption
levels catch up with the expectations derived from employment figures and high frequency indicators.
The employment outlook continues to improve while inflation remains moderate. The standardised
unemployment rate has steadily fallen to 10.7% in November 2014 from a peak of 15.1% in February
2012. Employment grew by 1.7% yoy to the third quarter of 2014, with nearly 95% of the jobs created
being full-time positions. This trend is expected to persist, albeit at a more moderate pace, given cohort
effects. SMEs and construction will provide renewed job opportunities for people with less sophisticated
skills. Hence, the average unemployment rate is expected to fall further to around 9.5% in 2015 and
remain above 8 % in 2016, thereby putting a lid on wage inflation despite increasing wage demands (5).
Inflation is expected to accelerate moderately, deviating little from euro-area levels. In this context,
Ireland should preserve the sizeable competitiveness gains of the last few years (6). Export growth is
projected to continue, albeit probably at a slower pace, while imports rise with domestic demand. Overall,
the current account surplus is expected to rise to about 5.5% in 2014 and then stabilise at those levels.
Public finance cash returns to end-November confirm the positive trend on revenue receipts, while
spending is running above target, requiring a supplementary budget. Income taxes through
November were up 8.9% yoy, consistent with the strong labour market and buoyant income tax returns
from the self-employed. Corporation tax receipts continued to show a good performance and rose 6.1%
yoy to end-November, while VAT receipts increased by 5.6% yoy over the same period. On the
expenditure side, current expenditures were 0.7% above target through November, mainly driven by
overspending in health care. Unlike in previous years, the overspending is not offset by savings in other
departments. To fund the overspending the government submitted to parliament a supplementary budget
in early December. Apart from additional resources for health care, other extra spending was allocated to
agriculture (EUR 177 million or 0.1% of GDP), transport (EUR 162 million), education (EUR 103
million), justice (EUR 85 million) and environment (EUR 34.7 million). Further funding is also provided
for storm damage repairs arising from last winter’s weather events. Estimated savings across various
departments are small and will amount to less than EUR 50 million. On top of overspending, the deferral
of water charges to the first quarter of 2015 and the front-loading of capital injections in Irish Water will
also impact the 2014 budget balance by around 0.15% of GDP. Finally, at the cut-off date of this report
the Irish government is considering the settlement of a pension arrangement following a ruling of the
European Court of Justice (the liability is about EUR 100 million).
As a result of overspending and other measures, the general government deficit in 2014 is likely to
be higher than previously expected, but still within the ceiling laid down in the EDP
(5) The labour cost index in Ireland decreased by 0.3% yoy in the second quarter of 2014, compared to an increase of 1.2% yoy in
the euro area. Yet, recent developments indicate upward pressure on labour costs. These developments include the change to
2009 emergency legislation in order to eliminate the ability of public employers to unilaterally reduce the salaries of public
sector employees, and various announcements made by trade unions on wage aspirations in the context of economic recovery.
6
( ) "Member State's Competitiveness Report 2014" http://ec.europa.eu/enterprise/policies/industrial-competitiveness/monitoringmember-states/index_en.htm.
12
2. Recent economic developments and outlook
recommendation. Based on information made available during and after the PPS mission, the general
government deficit in 2014 is expected to turn out at around 4% of GDP, down from 5.7% of GDP in
2013. The improvement on 2013 reflects the effect of the stronger-than-expected economic recovery,
some windfall revenues beyond higher than expected GDP growth, some expenditure restraint over the
previous year, including lower interest expenditure on the back of favourable market conditions, and the
transition to the ESA 2010 statistical methodology. The new accounting rules are estimated to improve
the 2014 budget balance by around 0.5% of GDP (Box 2.1) compared to ESA 95. While the likely outturn
of around 4% of GDP is above the target laid out by the government in its 2015 Draft Budgetary Plan
(DBP) on 15 October, it would still be well within the ceiling of 5.1% of GDP recommended by the
Council under the EDP.
Ireland's fiscal position is expected to further improve in 2015 albeit margins with respect to the
EDP ceiling are narrowing. Taking into account the tax cuts and expenditure increases of around 0.5%
of GDP in budget 2015, compared to the stability programme in 2014, the Commission expects the
general government deficit in 2015 to edge below the 3% of GDP reference value of the Treaty by a fairly
narrow margin. The improvement compared to 2014 will result from the projected robust rate of
economic growth coupled with a broadly stable level of total government expenditure. Under a no-policychange assumption, the deficit is forecast at 3.0 % of GDP in 2016 underscoring the need for further
adjustments to secure a sustainable correction of the excessive deficit. Risks around the deficit projections
for 2015 and 2016 mainly relate to the sustainability of recent macroeconomic developments, persisting
expenditure pressures in health care and the possible reclassification of publicly-owned utilities such as
Irish Water within the general government sector.
Gross general government debt is projected to fall to 106.0 % of GDP in 2016, down from 123.3 %
in 2013. This projected marked improvement largely reflects the accounting treatment of the Irish
Banking Resolution Corporation (IBRC) (7), along with the pick-up in economic growth (for more details
on debt sustainability, see Annex 2). With the transition from ESA 95 to ESA 2010, IBRC (which was
created to effectively wind down the former Anglo Irish Bank and the Irish Nationwide Building Society)
became part of general government and retroactively raised the level of general government debt in
percent of GDP. However, the liquidation of IBRC (with IBRC liabilities being repaid through the sale of
the assets and through the use of cash and other financial assets) initiated in early 2013 will reverse this
effect.
(7) The Irish Bank Resolution Corporation (IBRC) was created in July 2011 to merge the former Anglo Irish Bank and the Irish
Nationwide Building Society. It is owned by the Irish government. On 29 June 2011, the European Commission approved a
joint restructuring plan for Anglo Irish Bank (Anglo) and Irish Nationwide Building Society (INBS), which required the merger
of the banks, the sale of their deposit books, and the orderly work-out of the merged loan book over a period not to exceed 10
years. The merged wind-down entity changed its name to Irish Bank Resolution Corporation Limited (IBRC) in October 2011.
13
European Commission
Ireland - Post-Programme Surveillance
Graph 2.2:
10
8
Recent economic developments
The economy has reached a turning point ...
50
y-o-y %
change
... with industrial production now growing strongly.
y-o-y %
change
40
6
4
30
2
0
20
-2
10
-4
-6
0
-8
-10
Q3-14
Q2-14
Q1-14
Q4-13
Q3-13
Q2-13
Q1-13
Q4-12
Q3-12
Q2-12
Q1-12
Q4-11
Q3-11
Q2-11
Q1-11
Q4-10
Q3-10
-20
Aug-14
Oct-14
Sep-14
Nov-14
Jun-14
Apr-14
Feb-14
Dec-13
Oct-13
Aug-13
Jun-13
Apr-13
Feb-13
Dec-12
Oct-12
Aug-12
Jun-12
Retail sales are on a firm upward trend ...
Apr-12
Government consumption
Inventories
GDP
Feb-12
Private consumption
GFCF
Net exports
-10
... as consumer confidence is strengthening sharply.
105
120
index
103
110
101
99
100
97
90
95
93
80
91
89
Retail sales
85
60
Jul-14
May-14
Mar-14
Jan-14
Nov-13
Sep-13
Jul-13
May-13
Mar-13
Jan-13
Nov-12
Sep-12
Jul-12
Real estate asset price deflation is over.
May-12
Mar-12
Nov-14
Sep-14
Jul-14
May-14
Mar-14
Jan-14
Nov-13
Sep-13
Jul-13
May-13
Mar-13
Jan-13
Nov-12
Sep-12
Jul-12
May-12
Mar-12
30
70
Retail sales excl. motor trades
87
Unemployment keeps falling but remains elevated.
20
y-o-y %
20
%
15
10
10
0
Unemployment rate (as % of labour
force)
Annual employment growth
5
-10
Dublin
-20
National
-30
-5
Q3-14
Q2-14
Q1-14
Q4-13
Q3-13
Q2-13
Q1-13
Q4-12
Q3-12
Q2-12
Q1-12
Q4-11
Q3-11
Q2-11
Q1-11
Q4-10
Q3-10
Oct-14
Jun-14
Feb-14
Oct-13
Jun-13
Feb-13
Oct-12
Jun-12
Feb-12
Oct-11
Jun-11
Feb-11
(1) GFCF=gross fixed capital formation.
Source: CSO, Eurostat and European Commission
14
0
ex-Dublin
2. Recent economic developments and outlook
Table 2.1:
Main elements of the Commission 2014 Autumn Forecast
Annual percentage change
95-10
2011
2012
2013
2014
2015
2016
GDP
Private consumption
Public consumption
Gross fixed capital formation
of which: equipment
Exports (goods and services)
Imports (goods and services)
GNI (GDP deflator)
Contribution to GDP growth:
5.1
2.8
-0.3
0.2
4.6
3.6
3.7
4.6
-1.1
-1.4
-0.4
1.4
2.0
2.0
4.0
-2.2
-1.3
0.0
1.5
-0.5
1.8
4.7
-2.2
5.2
-2.8
9.3
12.3
9.5
4.8
2.1
-2.5
1.8
11.5
13.0
8.5
9.2
5.5
4.7
1.1
8.0
5.3
5.6
8.3
-0.6
6.9
0.6
7.3
5.6
6.1
4.4
-0.6
1.2
3.2
5.1
3.5
3.5
4.0
-1.3
-0.1
-0.6
2.3
2.8
2.8
0.0
0.7
-0.3
0.4
0.0
0.0
0.0
1.7
5.7
-0.8
0.6
2.3
0.8
0.8
Employment
2.7
-1.8
-0.6
2.4
2.0
2.2
2.2
Unemployment rate (a)
7.2
14.7
14.7
13.1
11.1
9.6
8.5
Compensation of employees / head
4.4
1.2
0.8
2.0
-1.3
0.8
2.1
Unit labour costs whole economy
1.9
-3.2
0.5
4.2
-3.8
-0.6
0.7
Real unit labour cost
-0.7
-4.1
-0.8
3.2
-4.3
-1.5
-0.7
Saving rate of households (b)
11.2
10.2
9.4
8.4
8.2
8.3
GDP deflator
2.7
0.9
1.3
1.0
0.5
0.9
1.4
Harmonised index of consumer prices
2.4
1.2
1.9
0.5
0.4
0.9
1.4
Terms of trade goods
0.0
-6.2
-0.7
0.5
-1.4
-0.1
-0.5
Trade balance (goods) (c)
21.2
25.3
24.5
20.7
21.0
19.8
18.6
Current-account balance (c)
-1.3
0.1
0.9
3.8
5.5
5.5
5.3
Net lending (+) or borrowing (-) vis-a-vis rest of world (c)
-0.8
0.2
0.9
3.8
6.3
6.0
5.7
General government balance (c)
-2.4
-12.6
-8.0
-5.7
-3.7
-2.9
-3.0
Cyclically-adjusted budget balance (c)
-2.7
-12.0
-7.1
-4.4 -3.5
-3.2
-3.3
Structural budget balance (c)
-8.0
-7.1
-4.8 -3.8
-3.3
-3.3
General government gross debt (c)
45.9
111.1
121.7
123.3
110.5
109.4
106.0
(a) As percent of labour force, Eurostat definition. (b) Gross saving divided by gross disposable income. (c) As a percentage
of GDP.
Source: European Commission
As confirmed by the outcome of the ECB's CA, the Irish domestic banks' performance has
continued to improve. In line with expectations, all the Irish banks passed the CA's asset quality review
(AQR) and stress test under the baseline scenario. Only PTSB revealed a EUR 855 million capital
shortfall in the adverse scenario of the stress test (Box 2.2). This was not surprising given PTSB's still
weak profitability. The adjustments identified in the AQR for the Irish banks were very modest, as the
banks had already undergone an assessment of their balance sheets towards the end of the EU-IMF
financial assistance programme. In the first half of 2014, Allied Irish Bank (AIB) and Bank of Ireland
(BOI) turned profitable, with post-provision profits of EUR 437 million and EUR 399 million
respectively (8). Over the same period, PTSB reduced its losses before exceptionals (one-off items) to
EUR 172 million (9). The banks' balance sheets continued to contract due to redemptions of National
Asset Management Agency (NAMA) bonds and redemptions outpacing new lending due to weak credit
demand. The domestic banks have continued to decrease their reliance on central bank funding which
declined by 7.4% from a year ago to 3.9% in September 2014(10), near the euro-area average (11).
Deposits and capital as sources of funding rose to about 55%-74% of total liabilities for the three
domestic banks in the third quarter of 2014 (12).
(8) The numbers refer to profit before tax. Profit for the period including income tax charge/credit from continuing operations and
profit after taxation from discontinued operations is EUR 411 million for AIB and EUR 344 million for BOI.
(9) This compares to a EUR 449 million loss in the same period in 2013.
10
( ) This uses CBI data. The number refers to central bank funding to total assets, for the three domestic banks.
(11) The IMF's financial soundness indicators reveal the euro-area average for this ratio was 4.5% in March 2014.
(12) In 2011, customer deposits and capital amounted to about 42%-57% of the funding mix.
15
European Commission
Ireland - Post-Programme Surveillance
Table 2.2:
Financial sector indicators
2008
2009
2010
2011
2012
2013 2014*
(All year-end data, unless otherwise specified.)
Total assets (in % of GDP)
Share of assets of five largest banks (in % of total assets)
Non-performing loans ratio (in % of total loans)
Regulatory capital to risk-weighted assets (in %)
Return on equity ratio (in %)
Private credit growth (% yoy change)
Lending for house purchase (% yoy change)**
Loan to deposit ratio (in %)
Central bank liquidity (in % of total liab.)***
960.6
1006.9
965.9
807.8
713.7
619.9
55.3
58.8
56.8
53.2
56.9
47.8
601.3
n/a
1.9
9.8
12.5
16.1
24.6
25.3
n/a
12.1
12.8
14.5
18.9
19.2
20.4
n/a
1.3
-35.8
-41.0
-10.8
-7.8
-6.8
n/a
1.4
-5.6
-12.3
-4.7
-2.6
-6.8
-6.9
-6.9
-4.1
-2.5
-0.9
6.6
-1.7
-1.3
179.0
162.0
141.7
133.4
128.7
113.3
110.8
7.9
9.0
18.3
18.4
16.6
6.9
6.1
*Latest data available is from May 2014, except for central bank liquidity (March 2014).
**Data for end-2012 reflects the expiration of a mortgage interest relief for first time buyers.
***ECB derived data, and refers to the share of central bank funding in credit institutions liabilities (total liabilities exclude
capital and reserves as well as remaining liabilities).
Source: European Commission, ECB, IMF
16
2. Recent economic developments and outlook
Graph 2.3:
Recent financial developments
Spreads over 10-year and 2-year German bonds
reflect improved funding conditions for Ireland...
2500
... as yields on Irish domestic banks' covered bonds
also continue to fall.
3.5
bps
IE 2Y
2000
IE 10Y
%
%
3.5
3.0
3.0
2.5
2.5
2.0
2.0
1.5
1.5
1.0
1.0
ES 10Y
1500
PT 10Y
1000
500
BOI 3.125% Nov 2015
0.5
0.5
AIB 3.125% Dec 2015
0.0
0
Sep-14
Jul-14
May-14
Mar-14
Jan-14
Nov-13
Sep-13
Jul-13
... though net lending to households and especially
to firms and SMEs remains weak.
y-o-y %
2
3.5
0
3.0
-2
2.5
-4
2.0
-6
1.5
-8
1.0
-10
0.5
HH loans
HH deposits
0.0
HHs
Mortgage loans
NFCs
-12
NFC loans
NFC deposits
Oct-14
May-14
Dec-13
Jul-13
Feb-13
7
% of all
products
requested
Mar-12
Sep-12
30
6.5
Sep-12
Apr-12
Nov-11
Jun-11
Jan-11
Aug-10
Mar-10
Oct-09
Sep-14
May-14
Jan-14
Sep-13
May-13
Jan-13
Sep-12
May-12
Jan-12
Sep-11
May-11
Jan-11
Sep-10
May-10
Jan-10
Sep-09
...while most SME loans and overdrafts requested relate
to the renewal/restructuring of existing financing.
40
% interest rates
SMEs
-14
Irish interest rates on SME/commercial loans are volatile and
high compared to other euro-area countries ...
7.5
May-13
% interest rates
(new business)
Mar-13
4.0
4
Jan-13
Nov-12
Dec-14
Oct-14
Aug-14
Jun-14
Apr-14
Feb-14
Dec-13
Oct-13
Aug-13
Jun-13
Apr-13
Feb-13
Dec-12
Oct-12
Aug-12
Jun-12
Apr-12
Feb-12
Dec-11
Banks' increased profitability is reflected in the rise
of net interest margins with falling deposit rates...
0.0
Mar-13
Sep-13
6
Mar-14
20
5.5
Sep-14
5
10
4.5
4
3.5
Renewal/Restruc
Existing Draft
Sep-14
May-14
Jan-14
Sep-13
May-13
Jan-13
Sep-12
May-12
Jan-12
Sep-11
May-11
Jan-11
Sep-10
May-10
Jan-10
Sep-09
May-09
Jan-09
Renewal/Restruc
Existing Loan
IE
Other
IT
New Overdraft
FR
New Loan
ES
Leasing or
Hire Purchase
DE
2.5
Invoice
discounting
0
3
17
European Commission
Ireland - Post-Programme Surveillance
(1) HH = households, NFC = non-financial corporations
(2) Lending to the private sector graph: data for households include mortgage loans
(3) Lending to SMEs graph: the proxy for SME lending are loans up to 1 million, initial over 1 year fixation
Source: Bloomberg, BI, ECB, iBoxx, and Red C credit demand survey
The banks are expected to manage upcoming funding redemptions. The domestic banks have a large
proportion of debt maturing in the first quarter of 2015 (Graph 2.4), including of PTSB's own-use bank
bonds (OUBB). They should, however, be able to navigate the maturity cliff amid continued aggregate
contraction in balance sheet volumes also reflecting accelerated NAMA bond redemptions taking
advantage of solid deposit volumes (despite further reductions in deposit rates) and easing market
conditions. The domestic banks could also take advantage of the ECB's new targeted long-term
refinancing operations (TLTRO), which would help extend the average duration of their liabilities and
lower average funding costs. However, this will be very limited for PTSB as a primarily mortgage-based
bank since the TLTRO allotments are allowed only for non-mortgage lending.
Graph 2.4:
12
Banks' liquidity and solvency positions
High 2015 maturities are expected to be met
by banks.
EUR bn
EUR bn
Banks' CT1 capital positions reflect BSA results
and preparation for the CA.
20
18
20%
CT1 ratio
18%
10
Debt maturities (lhs)
16
Total maturities (rhs)
14
16%
8
12
6
10
8
4
6
4
2
2
0
0
Q1
2014
Q2
2014
Q3
2014
Q4
2014
Q1
2015
Q2
2015
Q3
2015
Q4
2015
14%
12%
10%
8%
AIB
6%
BOI
4%
PTSB
2%
0%
Dec-10
total
Dec-11
Dec-12
Dec-13
(1) CT1 = Core tier 1; BSA = CBI Balance sheet assessment; CA = ECB Comprehensive assessment
Source: CBI
Banks and the sovereign have benefitted from favourable market conditions. BOI successfully
tapped the markets and raised EUR 750 million of Tier 2 Capital in June 2014. In December, the yield on
the benchmark 10-year Irish government bonds hit new lows of 1.08% and the spread over German bunds
fell to a low of 57 basis points. In October, the National Treasury Management Agency (NTMA) issued
EUR 1 billion of 10-year bonds at a yield of 1.63% with a bid-cover ratio of 2.5. In early November the
NTMA issued a EUR 3.75 billion 15-year bond the first such new issuance since 2009. The yield of
2.49%, was a record low for 15-year issuance by Ireland. Total bids amounted to EUR 8.4 billion. In
November, EUR 0.5 billion of treasury bills were sold at an annualised yield of 0.04%. In early
December, Standard & Poor's upgraded Ireland’s long-term sovereign credit rating to A (from A-) with a
stable outlook and upgraded Ireland’s short-term rating to A1 (from A2). The rating agency also affirmed
its ratings of the Irish banks and upgraded BOI’s outlook to positive (from negative).
In spite of the marked improvement of economic and financial conditions, net lending to the private
sector is still decreasing. Lending to Irish non-financial corporations (NFCs) declined by 8.1% yoy in
October 2014. Credit to SMEs continued to decline by 6.6% over the year to end-September. This could
partly be due to the fact that interest rates on loans in Ireland are still high in comparison to other euroarea countries (Graph 2.3). Lending to households for both house purchases and consumption remained
18
2. Recent economic developments and outlook
depressed as it fell by 3.3% yoy in the third quarter. Demand for credit remained subdued, as private
sector deleveraging continued. According to the CBI, private sector non-consolidated debt fell by 3.9
percentage points in the first quarter of 2014, to 298.3% of GDP, though it still remained at very elevated
levels, especially when compared to the euro-area average of about 168%(13).
The high share of non-performing loans (NPLs) declined but is unlikely to fall rapidly. NPLs in the
three main domestic banks fell to 24.9% of total loans in the third quarter of 2014, from a high of 27.1%
at the end of 2013 (14). The decrease in NPLs reflects the improved macroeconomic environment, in
particular better GDP growth, lower unemployment and the improved net wealth of households and firms
- variables that are generally considered to be the main drivers of NPLs. Box 3.1 shows the results of a
simple econometric exercise aimed at assessing NPL dynamics in the coming two years. It indicates that
progress is likely to continue but also to be slow.
Mortgage arrears continue to fall steadily. CBI data for the third quarter of 2014(15) show that the
number of accounts in arrears for over 90 days decreased by 4.5% quarter-on-quarter (qoq) while their
value decreased by 3.8% qoq. However, mortgage arrears stood at 19% of total mortgage loan balances in
the third quarter of 2014, down from a peak of 19.9% in the third quarter of 2013. The persistent increase
in the formation of longest-term arrears (of over 720 days) continued, increasing to 9.6% of total loan
balances in the third quarter (from 9.2% at end-June). The buy-to-let (BTL) sub-category of arrears
remains more problematic with 30.8% of total balances in arrears in the third quarter, higher than
principal dwelling houses (PDH) arrears that stood at 15.7% for the same period. However after recent
increases, BTLs arrears decreased by 0.4% qoq in the third quarter.
The main mortgage lenders continue to meet the Mortgage Arrears Resolution Targets (MART)
with continued reliance on legal action. In September 2014, all banks had met and exceeded the targets
of proposing sustainable solutions to 80% of mortgage holders in arrears of more than 90 days and
concluding 40% of them (Table 2.3). More than the required 75% of concluded solutions were meeting
the new arrangement terms. Half of all proposed solutions involved restructures, while the other half
targets repossession. The number of restructured accounts increased in the third quarter of 2014 by 7.8%
qoq for PDH, and 4.8% qoq for BTL. The number of repossessions in the third quarter grew by almost
7.5% qoq to 2027 properties, but remains relatively low, with a greater proportion of BTL accounts in
arrears ending in repossession than PDH ones.
(13) Source: ECB. Note also that the presence of multi-national corporations in Ireland elevates private sector debt data on an
unconsolidated basis as these companies finance their activities through intra-group loans.
(14) The continued contraction of banks' balance sheets impedes, in part, a faster decline in the NPL ratio as total loans also have
declined.
(15) http://www.centralbank.ie/polstats/stats/mortgagearrears/Documents/2014q3_ie_mortgage_arrears_statistics.pdf,
published quarterly.
19
European Commission
Ireland - Post-Programme Surveillance
Table 2.3:
Mortgage Arrears Resolution Targets (MART) overview
Status
Q1 2014
Q2 2014
Q3 2014
Q4 2014
Source: CBI
20
Total
Target
proposed
77%
70%
concluded
34%
25%
meeting terms
91%
75%
proposed
87%
75%
concluded
45%
35%
meeting terms
91%
75%
proposed
94%
80%
concluded
55%
40%
meeting terms
91%
75%
proposed
85%
concluded
45%
meeting terms
75%
2. Recent economic developments and outlook
(Continued on the next page)
21
European Commission
Ireland - Post-Programme Surveillance
Box (continued)
22
2. Recent economic developments and outlook
23
European Commission
Ireland - Post-Programme Surveillance
Box (continued)
24
3.
POLICY ISSUES
Graph 3.1:
3.7%
General government deficit projections
Graph 3.1a: Official 2014 and 2015 government
deficit targets
1
Graph 3.1b: General government budget balance:
outcome and targets in the 2015 Draft Budgetary
Plan
0.3
2.7%
% of GDP
0
% of GDP
-1
-0.9
-2
-1.9
-3
-2.7
-4
-3.7
-5
-6
-5.7
2013
2014
2015
2016
2017
2018
Source: 2015 Draft Budgetary Plan
3.1.
PUBLIC FINANCES
Despite some expansionary measures included in budget 2015, the Commission expects Ireland to
correct the excessive deficit by the recommended deadline of 2015 albeit by a narrow margin. On
the back of an improving macro outlook in 2014 and lower interest expenditure, the Irish authorities
considered that no additional consolidation measures were needed to ensure a timely correction of the
excessive deficit by 2015(16). Thus, budget 2015 includes expansionary measures worth around 0.5% of
GDP consisting of tax cuts and expenditure increases. At the end of November, in its Opinion on the 2015
Draft Budgetary Plan of Ireland, the Commission concluded that Ireland is expected to comply with the
provisions of the Stability and Growth Pact (SGP)(17). While this conclusion did not take into account the
additional budgetary slippage in 2014 revealed during the second PPS mission it should remain valid.
Overall, to the extent that economic growth remains robust and expenditure levels are implemented as per
budget 2015, Ireland should be in a position to bring the budget deficit below the 3.0% of GDP reference
value of the Treaty. At the same time, the Commission underlined that Ireland should take advantage of
the better-than-expected economic recovery to accelerate debt reduction, specifically by aiming for more
ambitious deficit targets in 2015 and 2016. While Ireland is committed to stay within the headline ceiling
laid down in the EDP recommendation, with the 2015 budget it started to deviate from the planned profile
of structural adjustment on back of stronger than expected economic growth.
The government needs to continue the path of fiscal adjustment. In 2015 and 2016 the margins with
respect to the EDP headline ceilings are projected to be narrow while expenditure pressures are likely to
persist. The Commission 2014 autumn forecast projects the general government deficit at 2.9% of GDP in
2015, just below the EDP reference target. Under the usual no-policy-change assumption the deficit is
expected at 3.0% of GDP in 2016. Against this background, minor deviation from projected economic
growth or expenditure and revenue plans may require corrective measures to ensure compliance with EU
fiscal rules. In its latest report of November 2014, the Irish Fiscal Advisory Council (IFAC) indicated that
(16) In the April 2014 Stability Programme, Ireland still estimated that around EUR 2 billion of consolidation measures would be
needed to achieve a budget deficit below 3% of GDP in 2015.
(17) European Commission (2014). Commission Opinion on the Draft Budgetary Plan of Ireland C(2014) 8803 final of 28
November 2014.
25
European Commission
Ireland - Post-Programme Surveillance
Graph 3.2:
EDP targets and fiscal consolidation effort
Graph 3.2a: deficit nominal target 2011-2015
4.0
12
bottom-up
3.5
General Government Deficit
10
Graph 3.2b: assessing fiscal effort 2011-2015
Structural budget defcit (rhs) 7
3.0
6
2.5
% of GDP
% of GDP
8
8
top-down (∆SB)
EDP Recommendation
6
5
2.0
4
1.5
3
4
1.0
2
2
0.5
1
0
0.0
0
2011
2012
2013
2014
2015
9
2011
2012
2013
2014
2015
(1) The "top-down" and the "bottom-up" metrics refer to two complementary methods for the assessment of effective fiscal
consolidation/action. The "top down" approach looks at the estimated change in the structural budget balance. The
"bottom-up" approach consists in estimating, measure-by-measure, the budgetary impact of discretionary interventions on
the revenue side and the expenditure side of the budget. The application of the two methods under the Stability and
Growth Pact in the Code of Conduct on the "Specifications on the implementation of the Stability and Growth Pact and
Guidelines on the format and content of Stability and Convergence Programmes"
(http://ec.europa.eu/economy_finance/economic_governance/sgp/pdf/coc/code_of_conduct_en.pdf).
Source: 2014 Commission Autumn Forecast
a negative GDP shock of only 0.5 percentage points would, in the absence of offsetting policy measures,
result in the 3%-of-GDP deficit target being missed. Risks are also related to the likely recurrence of
expenditure overruns linked to the underlying pressures highlighted in the government's latest
Comprehensive Expenditure Review (CER, see next paragraph) and a possible reclassification of Irish
Water into the general government sector. The inclusion of Irish Water in the general government is
estimated to increase the budget deficit by around EUR 550 million, or 0.3% of GDP in 2015. It remains
to be seen how recent government announcements of further tax cuts and/or expenditure increases in
budget 2016 will be squared with the provisions of the Stability and Growth Pact.
The Comprehensive Expenditure Review (CER) 2015-2017 carried out by the government
confirmed expenditure pressures linked to demographics, climate change, public service pay and
pensions. The CER was carried out by the Department of Public Expenditure and Reform between April
and October 2014. On the back of higher projections of government revenues there was a EUR 1.8 billion
(0.9% of GDP) upward revision to the current voted expenditure ceiling to EUR 50.1 billion for 2015
(Graph 3.3). The objective was to maintain existing services (including from demographic pressures) and
to support new initiatives. Plans to obtain an extra EUR 0.8 billion (0.4% of GDP) in savings across all
departments were abandoned. The expected lower spending on unemployment benefits (0.2% of GDP)
has been used to finance extra spending in the social protection sector including recurrent demographic
expenditure pressures.. The single ministerial ceilings for 2015 have been raised across several
departments, with particular hikes in health,, environment (primarily for capital expenditure increases for
social housing) and education. The health authorities have indicated their confidence to stay within the
new budget allocations, even though challenges remain, in particular beyond 2015. Staying within the
ceiling will require strict budgetary implementation. Moreover, efficiency savings from longer and more
26
3. Policy issues
flexible working hours linked to the implementation of the Haddington Road Agreement fell short of
plans in terms of expected agency costs reductions(18).
The latest revision of a number of expenditure ceilings underlines concerns over their binding
nature. In 2013 the Irish government introduced a medium-term expenditure framework including threeyear ministerial expenditure ceilings. This new instrument, if used effectively, provides a potential
safeguard against pro-cyclical fiscal policy and it is crucial for fiscal sustainability. However, recent
experiences, as well as latest budgetary plans, raise important questions. In particular, the essentially flat
nominal spending profiles after 2015 assume a no-policy-change scenario despite increasing age-related
demands for public services and other expenditure pressures highlighted in the CER 2015-2017. The flat
nominal profiles under a no-policy change scenario do not seem to take into account the projected
positive inflation rate, with a cumulative price increase of about 2.3 percentage points over 2015-16.
Moreover, the continuous upward revisions of ceilings and the absence of clear contingency plans, raise
doubts on the framework's strength vis-à-vis the future compliance with the EU expenditure benchmarks.
In that respect, it is worth recalling the 2014 Country Specific Recommendation which asks Ireland to
"ensure the binding nature of the government expenditure ceiling including by limiting the statutory scope
for discretionary changes". As indicated in the previous report, the credibility of the medium-term
expenditure plans should be strengthened by limiting changes to the expenditure ceilings to predefined
exceptional circumstances specified in the internal Circular 15/13(19).
The Irish fiscal framework has benefitted from the expertise and independence of the Irish Fiscal
Advisory Council (IFAC). Pursuant to Regulation (EU) 472/2013 (part of the "Two-Pack"), the task of
assessing and endorsing the macroeconomic forecast underpinning the annual budget plans and the
Stability Programmes was assigned to the IFAC in the Fiscal Responsibility Acts of 2012 and 2013(20).
The IFAC was also given the mandate to independently provide an assessment of, and to comment
publicly on, whether the government is meeting its own stated budgetary targets and objectives (in
particular through assessments of annual budgets and the stability programmes)(21). The IFAC endorsed
the macroeconomic forecasts underpinning the 2015 Draft Budgetary Plan (the letter of endorsement was
published on 6 October). At the same time, the IFAC assessed the government's actions and plans. In its
Pre-Budget 2015 Statement (22 September), despite the positive economic outlook, the IFAC advised the
government to implement the final instalment of the fiscal consolidation plan (EUR 2 billion)(22),
pointing out that a premature easing of structural fiscal adjustment would increase the risk of additional
consolidation being necessary in the future. This type of assessment underscores the independence of the
institution..
Efforts to address tax avoidance by abolishing and phasing out the double Irish scheme are
welcome. The Irish government's decision to gradually phase out the so-called double Irish can go some
way towards addressing concerns highlighted under the OECD's base erosion and profit shifting (BEPS)
initiative and it is likely to contribute to broadening the tax base (23). The decision to treat all companies
registered in Ireland as resident for tax purposes, regardless of the ownership structure, has the potential
to close a loophole. However, the elimination of the double Irish applies only to new companies, while
existing companies will be granted a transition period until end-2020. It will therefore take time before
(18) For health, high medical and nursery agency expenditures, mainly costs of agency staffing across both the Health Service
Executive (HSE) and the HSE-funded services, have in fact been indicated as the source of many of the overruns in 2014.
(19) The Circular 15/13 on the medium-term expenditure framework sets out steps that need to be followed to ensure compliance
with the expenditure ceilings.
(20) The IFAC is a statutory body established by the Fiscal Responsibility Act (FRA) of 2012, whose independence is formally
guaranteed by law. It consists of five members amongst which sits a chairperson, assisted by a secretariat of economists.
(21) In particular, Section 8(2) of the FRA 2012 requires the IFAC to monitor and assess compliance by the government with the
budget balance rule and the correction mechanism.
(22) And then to follow the less demanding requirements of the Stability Growth Pact in later years
(23) The double Irish refers to a tax avoidance scheme used by multinationals to lower corporate tax liability by channeling
payments between related entities in order to shift income from a higher-tax country to a lower-tax country. The scheme relies
upon mismatches between countries' tax residence rules.
27
European Commission
Ireland - Post-Programme Surveillance
Graph 3.3:
51.0
Expenditure Ceiling Reconciliation for 2015
Graph 3.3a: adjustments to gross current
expenditure ceiling for 2015
4000
3900
50.5
3800
€50.1 bn
Budget
2015
€ billion
49.5
49.0
48.5
47.5
€48.3 bn
Exp.Report 2014
47.0
3700
3600
€ million
50.0
48.0
Graph 3.3b: adjustments to gross capital
expenditure ceiling for 2015
3500
€3549 mn
Budget
2015
3400
3300
3200
3100
€3252 mn
Exp.Report 2014
3000
2900
Source: Comprehensive Expenditure Report 2015-2017
the full fiscal impact of the recent decision can be assessed. The authorities do not foresee any significant
impact on revenues. The authorities confirmed that specific rules for fiscal residence included in
international bilateral treaties (i.e. the double taxation treaties) between Ireland and third countries, will
normally supersede national law as is the norm in the case of all countries in respect of double tax
treaties. Hence, the actual impact of the phasing out of the double Irish will depend on the interplay
between national law and international tax treaties.
The authorities intend to put in place a special tax regime under the knowledge development box
though it will have to be carefully reviewed in the light of the multilateral efforts under the BEPS
(24). This initiative is part of government's Road Map for Ireland Tax Competitiveness to maintain the
country as an attractive place for FDI (25). The authorities have indicated the introduction of a public
consultation by the end of the year on the knowledge development box that targets intellectual propertyintensive investments. Legislation is expected to be drafted in 2015 and will be introduced in the next
financial bill. While the authorities have confirmed that measures will be fully compatible with EU and
international rules and in line with the ongoing OECD discussions, developments have to be carefully
reviewed. Findings from a recent Commission's project on R&D Tax Incentives indicate that the impact
of these measures is highly sensitive to their design and implementation (26). The study raises doubts on
the need for patent boxes introducing a preferential rate for income from innovations that are already
protected by intellectual property rights (IPR’s)(27) and emphasise the possibility of incurring substantial
tax losses(28). Moreover, the impact on innovation of patent boxes is difficult to evaluate empirically as
tax planning and tax competition induce measurement error in innovation indicators. Overall, patent
(24) The knowledge development box is an income-based tax regime for intangible assets.
(25) For
more
information
see
http://budget.gov.ie/Budgets/2015/Documents/Competing_Changing_World_Tax_Road_Map_final.pdf.
(26) CPB Netherlands Bureau for Economic Policy Analysis (2014). A Study on R&D Tax Incentives, Project from the European
Commission, TAXUD/2013/DE/315, (waiting for publication).
(27) By subsidizing inventions that do not need a subsidy, patent boxes could induce inventions that are difficult to patent and hence
that are relatively less attractive.
(28) Griffith et al. (2014), in Ownership of intellectual property and corporate taxation,(Journal of Public Economics, vol. 112, pp.
12-23) have performed simulations of how the introduction of patent boxes in Benelux countries and United Kingdom would
change the registered origin of patents. After the introduction of patent boxes in Benelux countries, all three countries would
experience a substantial increase in the share of new patents. However, regardless of the increase in the number of new patents
registered domestically, all countries experience a decline in revenue. Although the countries that introduce Patent Boxes attract
more new patents, the increased share is not sufficient to outweigh the effect of the lower tax rate.
28
3. Policy issues
boxes, in line with an OECD report(29), seem more likely to relocate corporate income than to stimulate
innovation.
3.2.
FINANCIAL SECTOR
3.2.1. Improving financial stability
The CA's stress test revealed a capital shortfall for PTSB under the adverse scenario of the stress
test, underlining the need for the bank to press ahead with its capital and restructuring plans. PTSB
submitted its capital plan to the SSM which has been endorsed by the Supervisory Board. The outcome
will feed into the Supervisory Review and Evaluation Process decisions, which is subject to non-objection
from the Governing Council. PTSB has nine months from the date of publication of the CA results; to
implement the capital plan. To fill the capital gap, PTSB has publically stated that recapitalisation should
be based on private sources (30). Moreover, PTSB also holds EUR 400 million of contingent capital or
'cocos', which as PTSB stated, might be converted into equity. This however, could give rise to state-aid
issues and will be subject to approval by the European Commission as part of the ongoing review of its
updated restructuring plan. PTSB expects a further EUR 300 million to be covered by non-core asset sales
and improved pre-provision performance, which have been realised during 2014. This means that just
over 80% of the identified shortfall would already be covered, and the bank's management is confident
that the remaining estimated gap of around EUR 155 million can be filled by capital from private
investors, with Deutsche Bank and Davy advising on the transaction(31).
PTSB is 99.2% state owned and is taking advantage of the existing strong demand for Irish assets.
The bank is improving its lending margins and prospects for write-backs on its EUR 4.1 billion of bad
debt provisions at June 2014 (coverage ratio of 48%) as the Irish economy continues to recover(32).
Nonetheless, the bank will have to pay back some of its EUR 2.3 billion of state aid over the coming
years and PTSB’s structural balance sheet issues with a large amount of low-yielding tracker mortgages
will represent a challenge for the bank's management. Overall, it is expected PTSB would tap the private
capital markets in the first half of 2015. In December 2014, media reported that the bank was planning on
raising between EUR 400 and 500 million in a share sale.
Progress with the sale of the remaining government stakes in the Irish domestic banks will signal a
return to a more normal banking environment. The authorities' policy is not to hold their investments
in these banks long-term, but to exit subject to market conditions in a way that generates value for the
taxpayer. Three panels of financial advisers have recently been established to facilitate the procurement of
timely advice in this regard and firms included on the panels may be utilised to assist in the future sale of
the remaining government stakes in AIB, BOI and PTSB (33). Amongst other things, the authorities will
focus on:
• AIB's eventual privatisation, the largest potential domestic bank sale. The bank is 99.8% governmentowned and the state's holdings were valued at EUR 13.3 billion as of December 2014, compared to a
total government capital injection worth EUR 21 billion which the state intends to recoup in full over
time. Recently, the minister for finance suggested that a first disposal could take place in the next year
or two pending government approval. This would come after the bank releases its financial year 2014
(29) OECD (2013), Supporting Investment in Knowledge Capital, Growth and Innovation, OECD, Paris.
(30) The capital plan is not public.
(31) The participation of private investors in the recapitalization of PTSB is relevant for the possible fiscal impact of any potential
conversion of the cocos held by the government into equity: if private investors do not participate on equal terms (not
necessarily with equal amounts), the conversion would be deficit-increasing.
(32) PTSB still conservatively assumes 55% peak-to-trough house price decline in its mortgage provision models versus an actual
decline of about 41%.
(33) For more details see http://www.finance.gov.ie/sites/default/files/Advisory%20Panels%20on%20Financial%20Matters.pdf
29
European Commission
Ireland - Post-Programme Surveillance
results next March, which are expected to confirm its return to full-year profits for the first time since
the crisis. Moreover, in October 2014 the High Court approved AIB's application for a share capital
reduction by EUR 5 billion. The approval helps progress towards privatisation as the bank could pay a
cash dividend to shareholders (including the government) and enables a partial repayment and
conversion of all or part of the EUR 3.5 billion government preference shares. There has been
speculation the government may initially sell 25-30% of its shares in AIB, which could raise an
estimated EUR 3.4 billion (1.9% of GDP) based on a share price equal to 1.2 times its net asset value
(34).
• The government will sell its remaining 14% stake in BOI, though the timing remains unclear. The
equity stake was valued at EUR 1.5 billion (0.8% of GDP) as of March 2014. The authorities have
indicated that they are in no hurry to exit the position. BOI's solid profitability facilitates a possible
redemption of the government's remaining EUR 1.3 billion preference shares by July 2016, before the
resumption of dividend payments to shareholders.
With the start of the SSM in November 2014, banking supervision is moving to a new level with
calls for caution on provision write-backs. Despite recovering property prices, the number of market
transactions still remains low and weakens confidence in valuations. At the same time, the recognition of
appropriate levels of provisions is imperative to stabilising and resolving the high level of NPLs. As
arrears resolution is likely to take many years, it is appropriate for the supervisory authorities to call for a
conservative approach to provision write-backs. With the inception of SSM, routine supervision of
significant institutions (PTSB, AIB, BOI and Ulster Bank) will be conducted by Joint Supervisory Teams,
comprising staff from both the ECB and the central bank. There will be more on-site inspections for
lengthy periods of time, to undertake in-depth investigation of risks (such as capital and credit risk),
controls and governance. Supervision will be based more on detailed data, quantitative analysis,
guidelines and will be more centralised. For less significant institutions, supervision will be conducted by
the CBI, but subject to SSM oversight.
Medium-term challenges persist for the capital positions of the domestic banks due to the gradual
implementation of the Capital Requirements Directive (CRD) IV and Capital Requirements
Regulation (CRR). This is due to banks' low profitability and the fact that BOI and particularly AIB have
large holdings of deferred tax assets (DTAs) and government preference shares which will gradually be
deduced from own funds (Table 3.1). In Ireland, this involves a phasing out of the counting of DTAs
towards CET1 capital by 10% annually from 2015 until end 2023 for AIB and BOI (PTSB also
recognised EUR 414 million of DTAs in 2013). According to CRR, preference shares subscribed by the
government will no longer count as regulatory capital own funds, after 1 January 2018. Improvements in
profitability will be key for allowing banks to use their DTAs and preserve profits to rebuild their capital
ratios. Alternatively, the transformation of existing preference shares into CET 1 instruments would also
result in capital ratios above the fully phased-in Basel III/CRR capital requirements in AIB and BOI.
(34) According to Merrion Stockbrokers, the market will be ready to pay a price above book value for AIB’s initial reprivatisation
(as occurred with the Spanish government’s sale of Bankia shares earlier in 2014).
30
3. Policy issues
Table 3.1:
Holdings of deferred tax assets (DTAs) and government preference shares
(As of end-2013, EUR bn)
AIB
BOI
DTAs
3.9
1.5
Preference shares
3.5
1.3
Total
7.4
2.8
Source: CBI.
Macro-prudential measures for mortgage lending are welcome to prevent the building up of
housing bubbles, but should not be undermined by plans for a mortgage insurance scheme. In its
consultation paper (35) the CBI proposed a proportionate limit on the amount of new lending for PDH
purchases above an 80% loan-to-value (LTV) ratio to 15% of the value of the flow of new housing loans
and a cap of 20% for new loans of above 3.5 times the borrower's income. For BTLs, the proposed limits
are more stringent, limiting the value of loans issued above 70% LTV to 10% of the total value of new
lending. The measures aim to increase the resilience of banks and households to potential future creditfuelled housing bubbles and are expected to be introduced in early 2015. Still, the government has asked
for them to be phased in gradually and they are subject to a public consultation. The measures proposed
aim to address the fact that the number of loans issued at high LTVs has been increasing recently, with
the amount of loans issued at over 80% LTV rising to 50% of new loans issued in 2013. In the near term,
they are expected to impact particularly first-time-buyers and curtail lending volumes, thus dampening
banks' profitability. Over the long term, the market is expected to adjust and credit risk in the mortgage
market should decline. However, the effectiveness of these regulations on mortgage lending could be
affected by plans for the introduction of a mortgage insurance scheme. Such a scheme, which is still at an
early stage of discussion, would provide a state or private guarantee on a portion of a new home loan to
first-time buyers, allowing them to have a lower deposit and thus possibly by-pass the central bank's
macro prudential measures. However, it remains unclear who would pay for the insurance scheme, i.e. the
lender, the borrower or the state. Moreover, unless the insurer is a non-Irish entity any mortgage
insurance would not address concerns over systemic domestic risk.
The creation of a central credit registry will be a useful element in enhancing regulatory measures
to limit borrowing and help improve banks' credit origination decisions. The introduction of the
credit registry should provide lenders with a thorough evaluation of a borrower's ability to pay as it would
provide a database on the amount of credit held by individuals and SMEs. Once data on borrowers' total
indebtedness becomes available, macro-prudential measures involving debt-to-income and debt-serviceto-income ratios could be introduced, offering a more binding constraint than currently proposed LTI
limits. The Credit Reporting Act 2013 was enacted in December 2013, and a procurement process for the
registry operator has been launched with work on the register well underway. The current timeline
envisions the register being operational in the latter part of 2016.
3.2.2. Reducing non-performing loans
There has been progress with implementing sustainable restructuring solutions for mortgage
arrears though sustained efforts are needed. There are still some discrepancies between the banks
(35) See
CBI
consultation
paper
CP87,
http://www.centralbank.ie/regulation/poldocs/consultationpapers/Documents/CP87%20Macroprudential%20policy%20for%20residential%20mortgage%20lending/Macroprudential%20policy%20for%20residential%20mortgage%20lending.pdf
31
European Commission
Ireland - Post-Programme Surveillance
when it comes to the classification of restructured loans. In agreement with the SSM, continued
monitoring, possibly via an extension of restructuring targets into 2015 and beyond, would be warranted
(especially when it comes to re-default rates). An audit was completed for the banks' fourth quarter 2013
MART outcome and another audit is underway in two banks' 2014 second quarter outcomes. The audits
show that there has been a reliance on standard forbearance techniques which involve rescheduling
principal or interest payments rather than lowering them both. Examples of this include temporary
switches to interest-only mortgages, extending the term of the mortgage and arrears capitalisation. In
addition, the latter type of restructuring has displayed a high propensity to re-defaulting (36). An extension
of targets and careful monitoring to 2015 would be warranted given the diversity of the solutions
proposed and the amount of time it takes to durably restructure loans. Reliance on legal proceedings in
concluded solutions remains significant as banks utilise it as a way of engaging customers in arrears. As a
result, there have been indications the court system is experiencing some backlogs, as shown by the more
frequent adjournments and prolonged processes. Finally, due to the rising rental prices there is more use
of rent receivership solutions for BTL arrears.
There is a need for continuous action to address the high levels of NPLs in other sectors, especially
SME and commercial real estate (CRE). Commercial loans still make up the majority of distressed
loans. A thorough workout of this portfolio will only be achievable in the long-term as the restructuring
process is slow and NPLs are expected to decline slowly (Box 3.1). Progress is being made by the banks
in meeting their non-public SME restructuring targets with the aim of having almost all of the loans
restructured by the end of 2014. Encouragingly, lenders have noted a recovery of cash-flows in certain
SME sectors. The distressed commercial portion of the banks' loan books is decreasing, albeit slowly, via
a combination of asset sales, restructures and write offs. A recent CBI study highlighted that a significant
amount of SME loan balances had CRE related exposures and these loans had double the default rate than
those without CRE exposures (37). The restructuring or disposal of these loans should be prioritised.
Legislation to facilitate cheaper SME examinership by the Circuit Court became operational in July, and
it eliminates the elevated costs associated with the High Court procedure. However, as of late November
only five SMEs have sought the appointment of an Examiner through the Circuit Court.
Plans for an accelerated NAMA wind down are positive for banks' balance sheets and the
sovereign. NAMA has redeemed EUR 9.1 billion of senior bonds in 2014, bringing its cumulative
redemptions to EUR 16.6 billion or 55% of total senior bonds. The agency is committed to paying down a
minimum of 80% of its senior debt by the end of 2016, two years earlier than planned as it has been
taking advantage of a surge in demand for Irish real estate assets. NAMA has also redeemed all of the
EUR 12.9 billion in senior bonds issued in early 2013 as part of the IBRC liquidation. The accelerated
disposal strategy aims at redeeming all of NAMA senior bonds by end-2018. This has positive fiscal
implications as these securities benefit from a government guarantee and it enhances earnings potential
for the banks, which is constrained by large holdings (especially for AIB) of the low-yielding bonds.
NAMA estimates it could generate a profit of EUR 500 million (0.3% of GDP) to the government when it
finishes its operations. In addition, NAMA's strong financial position raises the possibility of it paying the
discretionary cash coupons on the EUR 1.6 billion of subordinated bonds held by the domestic banks,
thus boosting the valuation of the bonds on banks' balance sheets.
Insolvency procedures remain little used, though the Insolvency Service of Ireland (ISI) has
implemented recent measures to encourage their use. The last ISI report for the third quarter of 2014
points to an increase in the number of debt solution arrangements and bankruptcies but they remain low at
131 and 137 respectively for the quarter. In order to boost usage, the ISI has suspended all application
fees (38) for debt solutions until the end of 2015. It has also launched a comprehensive information
(36) At end-June 2014, 33.2% of restructured PDH mortgages using arrears capitalisation had re-defaulted, while 61.5% of BTL
ones had also re-defaulted.
(37) This was based on end-2013 data which showed 32.3% of SME loan balances had CRE exposures with a 54.5% default rate.
See McCann and McIndoes-Calder (2014) at http://www.centralbank.ie/publications/Documents/14RT14.pdf.
(38) Previously, these fees ranged from EUR 100 to EUR 500, depending on the type of procedure.
32
3. Policy issues
campaign named "Back on Track"(39) featuring a media campaign, public awareness events involving
intermediaries such as citizen information boards and a web-site with guidelines for the types of
arrangements offered (40). There are indications of increased visibility of the scheme with more interest
from the public, though the success of these initiatives will only be seen in the coming months.
3.2.3. Financing the economy
Demand for credit by SMEs remains low despite existing and new SME financing initiatives. Two
of three National Pensions Reserve Fund (NPRF) SME funds are lending with the SME Equity Fund
seeing a large pipeline of projects. However one NPRF fund, the Turnaround Fund is being closed at end2014, given the difficulty in sourcing eligible turnaround investment cases amid a continued economic
recovery. In May 2014 a SMEs Online Tool (41) was launched by the government to help increase
awareness about SME state support. A communications campaign is being undertaken to showcase the
online guide. The awareness of this online tool was at 23% amongst SMEs by September 2014 but still
relatively low. As shown by the latest September 2014 Red C SME Credit survey (42), there has been very
limited progress in the visibility and usage of non-bank schemes, as well as use of the Credit Review
Office for appeals to credit refusals. The survey also shows a decrease in demand for credit with only
31% of SMEs requesting bank financing in September 2014, down from 36% a year earlier. In spite of
improved trading conditions, credit is still sought mostly for restructuring and consolidation purposes
rather than for new growth investments. Most respondents in the survey (81%) indicated that they did not
apply for credit because they did not need it while only 1% said that credit was too expensive. The very
limited reference to the cost of lending is somewhat at odds with cross-country interest rate statistics
showing that rates charged by Irish banks are significantly higher than in other countries. As the reasons
for this gap are not entirely clear (less competition in the post-crisis banking sector, cross-subsidisation of
loss making tracker mortgages, higher level of NPLs) additional research seems warranted.
The SBCI – the Strategic Banking Corporation of Ireland - aims to increase the supply of bank
credit to SMEs and introduce more competition. The SBCI is one of the initiatives undertaken to
address this issue via increasing the number of banks and non-banks offering SME loans. It is a state
development bank with no commercial license. It was launched in October 2014 and some lending was
due to start by the end of 2014. It will source funds from German development bank KfW, the Ireland
Strategic Investment Fund (ISIF) and the EIB and lend them to SMEs via other institutions or on-lenders,
including retail banks and non-banks. It will have EUR 800 million (0.45% of GDP) in funds, of which
EUR 550 million would be guaranteed by the government. The SBCI will have a lower cost of funding
and this cost benefit will have to be passed on to SMEs. The SBCI will also provide longer-term loans to
SMEs and new products with longer duration and flexible repayment periods. While welcoming the
SBCI, SMEs claim banks still need to improve their expertise when evaluating loans, while sourcing
equity is challenging also. With numerous public schemes already available to increase SME credit, the
authorities need to carefully monitor any contingent liabilities arising from the SBCI.
ISIF's double mandate is to invest and to support domestic economic activity and employment
while also generating a commercial return. ISIF replaces the National Pensions Reserve Fund (NPRF)
and is managed by the National Treasury Management Agency (NTMA) that provides asset and liability
management services to the Government. The supporting legislation was enacted in July 2014. It will
invest in 'high-impact' sectors such as exports, manufacturing and enabling infrastructure, along with
SMEs. ISIF will manage assets worth EUR 7 billion (about 4% of GDP). The effective running of the
ISIF requires a new skillset for direct investing for the NTMA's staff and an almost completely new team
(39) http://backontrack.ie/
(40) In addition to bankruptcy, the three debt solutions offered are the Debt Relief Notice, the Debt Settlement Arrangement and the
Personal Insolvency Arrangement.
(41) https://www.localenterprise.ie/smeonlinetool/businessdetails.aspx
(42) http://www.finance.gov.ie/sites/default/files/Dept%20of%20Finance%20SME%20Credit%20Demand%20Survey%20
Report%20-%20Apr-Sep%202014.pdf
33
European Commission
Ireland - Post-Programme Surveillance
of 35 investment professionals have recently been hired. The new agency is undertaking a programme of
active engagement and outreach with investors, corporate advisors, industry bodies, and government and
international agencies. So far investments have been limited, though it currently has about 80 projects
under consideration worth about EUR 3.5 billion. ISIF estimates it will take at least five years to invest all
the money as it balances the need to undertake prudent investing with obtaining a commercial return.
The updated Alternative Investment Fund (AIF) rulebook (43) aims to spur non-bank lending. The
AIF rulebook was amended by the CBI to allow loan origination by qualifying investor investment funds
from October 2014 (44). The initiative allows funds to lend to businesses that are too small to tap the bond
markets themselves but which still require substantial funding in the range of EUR 20 – 125 million.
Apart from the need to comply with additional stress testing requirements, qualifying AIFs can only be
closed-ended funds with a leverage limit of 200% (i.e. gross assets of no more than 200% of net asset
value). In order to minimize regulatory arbitrage, they are subject to liquidity, diversification and
disclosure requirements. They must have a single focus on lending or participations in lending with a
developed system of loan valuation and monitoring. Should banks want to sell their loans or include AIFs
in their loan originations, they have to retain at least 5% of "skin in the game" or economic interest. The
demand for the scheme has yet to be seen as no applications were made by end-November 2014. There is
also evidence that a big part of potential investments using this channel would be focused on European
non-Irish borrowers. Given the current diversity of the regulatory environment across different countries,
the relatively strict Irish regulatory framework could be seen as a deterrent for some funds.
3.3.
STRUCTURAL REFORMS
3.3.1. Improving the labour market and addressing skills mismatches
Labour market reforms are paying off. Efforts over the past few years have focused on three main
fronts: (1) establishing adequate activation mechanisms; (2) addressing skills mismatches; and (3)
fostering job creation. Although reforms remain work-in-progress in some areas, this triad has achieved
significant results already, with a net increase in employment of 84,200 people (4.6%) between the trough
of the third quarter of 2012 and the third quarter of 2014. Critically, over 90% of the increase is full-time
employment and this coincides with a marked downward trend in unemployment rates, including longterm and youth unemployment. Employment growth has also benefited all regions to some extent.
Although it is not possible yet to attribute these positive developments to specific measures, the
authorities intend to carry out more systematic evaluations as part of the Pathways to Work strategy,
which is a welcome initiative.
Reforms to activation policy are being finalised. All 60 Intreo offices providing one-stop shop
employment services will soon be operational, with 11 new offices targeted to open by end-2014 and the
last five in early 2015. The number of case officers dealing with jobseekers has now reached a steadystate of around 550, implying a ratio of around 1:450. This remains very high by international standards,
but the authorities expect to lower the ratio to around 1:200 once the JobPath initiative is fully phased in
during the second half of 2015.
Contracted employment services will bring additional support to the long-term unemployed in
2015. The process that led to the decision to contract out and tender the provision of some employment
services to private providers took a considerable amount of time, but two preferred bidders have been
selected and contracts are expected to be finalised in early 2015. The contractors will provide services
(43) http://www.centralbank.ie/regulation/industry-
sectors/funds/aifmd/Documents/AIF%20Rulebook%20FINAL%20SEPT%2014.pdf.
(44) The starting date for CBI accepting applications for authorisation of loan origination AIFs was 1 October 2014.
34
3. Policy issues
from around 100 offices and employ around 1,000 staff. It is expected that around 440,000 people, all of
whom long-term unemployed, will be referred to JobPath providers over a four-year period.
JobPath is designed as a temporary solution to a temporary problem. The programme is time-bound
(four years of referrals with a two-year workout period) as it is expected that the additional activation
capacity will no longer be needed once cyclical unemployment is addressed. Contracts have been
carefully crafted under a "payment by result" model and specify precise services standards. It will be
important to ensure that these standards are met so that jobseekers referred to contractors are granted the
same level of service and opportunities available to those who will remain within the realm of Intreo
offices. The authorities estimate that the total expected cost of around EUR 340 million (0.2% of GDP)
could be more than compensated by savings on gross welfare expenditure of about EUR 500 million.
Reforms to further education and training (FET) have started in earnest. The process lags the reform
to activation policies, but is now fully engaged. SOLAS, the institution in charge of piloting the FET
sector, is firmly established, as are the 16 education and training boards (ETBs) now in charge of the
delivery of programmes. The relationship between SOLAS and ETBs is governed by annual FET services
plans that define funding levels and delivery targets within each ETB. There is a significant degree of
rigidity in the courses offered (45) and general learning (literacy and numeracy) still mobilises a lot of
resources, but the authorities are making conscious efforts to track the skills needs of the economy and
better align course provisions with the needs of employers and jobseekers. As part of these efforts, IT
systems are being improved in order to track various metrics on inputs, outputs and outcomes of FET
programmes. Critically, Intreo offices and ETBs have also put in place protocols to govern their
interactions. These include targets on the number of jobseekers referred to training programmes.
Other reforms are proceeding to improve the functioning of the labour market. In addition to these
main strands of reforms, Pathways to Work 2015 plans a number of other steps to increase recruitments
from the Live Register, better target specific activation programmes at the long-term unemployed and
address remaining disincentives to the take-up of employment. The Housing Assistance Payment should
gradually replace the Rent Supplement for people with a long-term need for social housing. Rent
Supplement had been considered a significant disincentive to take up work, but its phasing-down will be
gradual after the new scheme has been tested in a pilot phase in a limited number of local authorities.
Other social payments may be reviewed after the findings of the advisory group on tax and social welfare.
3.3.2. Raising value-for-money in healthcare
Efforts are focused on gradually reforming the healthcare sector and achieving efficiency gains but
spending pressures remain significant. The introduction of universal health insurance remains a policy
objective, but has been pushed back without a clear new timeframe. Healthcare reforms are therefore
focused on intermediate steps to achieve efficiency gains in the sector and improve health outcomes. Key
priorities include the gradual establishment of universal free access to general practitioner (GP) and
primary care, the implementation of the eHealth strategy, and reforming the hospital funding model and
pricing mechanisms for medicinal products. Demand-driven pressures and difficulties to fully deliver
expected saving measures and efficiency gains (medical card probity exercise, full charging of private
patients in public hospitals, Haddington Road Agreement and agency costs), however, drove healthcare
spending EUR 580 million (0.3% of GDP) above budget in the year to November (Section 2), with
additional overruns expected in December.
Free access to primary care is being widened progressively. The Health (GP Service) Act 2014,
enacted in July, provides for free access to GP medical and surgical service for all children below 6 years
(45) Rigidity is strong regarding programmes offered by the former vocational education centres. A significantly higher degree of
flexibility is available regarding programmes formerly provided by FAS training centres as many of these were contracted out
to private providers.
35
European Commission
Ireland - Post-Programme Surveillance
of age. This is aimed to be a first step towards the introduction of universal free GP care, with persons
over 70 years of age also to be covered as part of the Health Service Executive (HSE) National Service
Plan 2015 for a combined cost of EUR 37 million.
The foundations of the eHealth strategy are being laid. The legislation to establish health identifiers
for patients and providers (46) was enacted in July 2014. It will be commenced in whole or in parts upon
Ministerial order at a later stage as the operational work to establish e-health systems progresses. eHealth
Ireland has been established as part of the HSE and its recently appointed Chief Information Officer will
be tasked to coordinate the roll-over of the system starting in 2015. Some further progress has also been
achieved with the implementation of the money-follows-the-patient funding model and other financial
management reforms.
The use of generics is increasing. The Ministerial order requiring prescription by international nonproprietary name (INN) unless brand name is deemed medically necessary (47) was published in early
November 2014 but will not be fully effective until the second quarter of 2015. This should further
promote the use of generics and generate savings in the future, but generics penetration already increased
steadily in recent quarters as INN prescriptions have become more common in advance of the legal
requirement. Generics represented close to 70% of the off-patent public-driven market in volume terms in
September 2014. In addition, the authorities keep expanding the list of interchangeable medicines and the
associated internal reference pricing mechanism, which caps reimbursements at the level of the least-cost
alternative. The authorities estimate that these measures will generate at least EUR 50 million in savings
in 2014. In terms of patented medicinal products, the authorities have initiated the mid-term review of the
agreement with the Irish Pharmaceutical Healthcare Association (IPHA). While the outcome of the
review is not known, the authorities have asked for a widening of the selection of countries in the
reference basket, alignment on the lowest price and semi-annual price realignments.
3.3.3. Reforming the water sector
The last step in a long reform process, the introduction of water charges has encountered
opposition. Although it had been prepared and extensively communicated for a long time without
generating resistance, the planned phasing-in of domestic water charges on 1 October 2014 led to popular
protests. However, more than 800,000 households had sent back their Irish Water application packs by
the end of October 2014, and close to 80% confirm their status as future customers. In response to the
growing opposition to charges, the government announced a range of measures on 19 November 2014.
The new package introduces major changes in the structure and level of charges compared with what had
been determined by the Commission for Energy Regulation after the outcome of the consultation process
held during the summer (Box 3.2).
(46) Health Identifiers Act 2014.
(47) In addition to medical necessity, the ministerial order requires that the reason for prescribing a brand name be explicitly stated
on the prescription.
36
3. Policy issues
Table 3.2:
International comparison of water charges (euros per annum)
Ireland, including "water conservation grant"
2 adults, 2 children, 129
m3
160.0
Ireland, excluding "water conservation grant"
260.0
160.0
Berlin
644.4
547.1
1 adult, 2 children, 108 m3
60.0
Brussels
393.6
300.5
Helsinki
493.0
382.0
Lisbon
183.7
161.1
Madrid
285.0
227.7
Paris
344.7
293.3
Rome
165.4
137.6
Scotland
811.0
753.3
United Kingdom - South West
921.3
782.7
United Kingdom - Southern
626.1
534.2
United Kingdom - Thames
446.9
392.1
Source: Websites of reported companies
Water sector reforms are expected to continue, but important elements have been modified. The
authorities remain committed to Irish Water operating the sector as a 100% state-owned national utility
under the regulatory oversight of the CER. They also indicated that the installation of meters would
proceed as planned. The latest decisions, however, raise certain issues:
• Infrastructure investment: Irish Water will remain dependent on Exchequer funding for a while and
the prospects for the company becoming self-funded seem distant, with domestic charges frozen until
at least the end of 2018. The November decisions do not affect Irish Water's capital spending
programme to end 2016 as earlier approved by the CER. However, the extent to which Irish Water
will be in a position to fund and borrow on the markets for this much-needed capital investment
remains to be determined and may have been diminished by making self-funding prospects more
distant.
• Conservation objectives: the capping of domestic water charges at low levels implies that the
incentives to conserve water will be weaker than under the original plan for the majority of
households, even those with a meter. The cap could effectively sever the link between consumption
and charges, particularly for households with higher water consumption. Water prices will also be
among the lowest in the EU, particularly if the net level of charge (i.e. discounting for the “water
conservation grant”) is considered. Meters will still be valuable to identify leaks at the end-user level,
but are less likely to generate significant behavioural changes. Metered households could possibly
reduce their bills below the capped levels by using water parsimoniously, but the financial incentive to
do so will be limited and consumption would need to fall below 70 m3 or 43 m3 for households facing
caps or EUR 260 and EUR 160, respectively, without taking the free allowance into account.
• Independence of the Commission for Energy Regulation (CER): the Water Services (No. 2) Act
2013 granted authority to the CER to approve or seek modification to the water charges plan
submitted by Irish Water. It also granted authority to the minister to give directions of a general policy
nature to the CER. The act consecrated Irish Water as a fully state-owned public utility operating a
monopolistic sector under the supervision of an independent regulator, itself subject to broad policy
guidelines from the political level. As is the case for other infrastructure sectors, the CER was to
regulate key variables such as operating costs, efficiency gains, investment plans, regulated asset base
or return on equity. By overriding the water charges plan that had been approved by the CER
following an extensive preparatory process, the government may have extended the interpretation of
37
European Commission
Ireland - Post-Programme Surveillance
"directions of a general policy nature", even though key CER decisions on issues like efficiency gains,
investment plans and regulated asset base remained untouched. As a result, the independence from
political influence of the CER in its future regulatory functions could be at risk, not only in the water
sector but also in other areas that fall under its mandate.
• Fiscal implications: Fiscal risk arises from the uncertainty surrounding Eurostat's ruling on whether
Irish Water complies with the market test under ESA 2010 rules. If it were to fail the test, the
inclusion of Irish Water in the general government accounts would increase the budget deficit by
around 0.3% of GDP. If Irish Water remains outside the general government, the revised water
charges plan and the introduction of the water conservation grant will have a deficit-increasing impact
of about EUR 85 million (0.04% of GDP) in 2015. The government also decided to front-load capital
injections into Irish Water from 2015 to 2014 which, together with the effect of the one quarter delay
in the introduction of charges, should have a deficit-increasing impact of EUR 277 million (0.15% of
GDP) in 2014.
There will be no certainty about the fiscal treatment of Irish Water until April 2015. The
government appears fully confident that Irish Water will pass the market test, but this will be determined
ultimately by Eurostat and most likely by April 2015. The revised water package has nevertheless
increased the uncertainty surrounding Eurostat's decision, mainly on account of: (1) the somewhat lower
revenue collected from domestic charges (around EUR 21 million per annum); (2) the treatment of the
water conservation grant, which in essence amounts to an Exchequer transfer to Irish Water via
households; and (3) the freezing of household charges until at least 2019. In addition, Irish Water will
face rising capital costs as it implements its infrastructure programme as approved by the CER, which
will have to be taken into account in the revenue to cost ratios.
3.3.4. Reducing legal services costs
Final enactment of the Legal Services Regulation Bill will have to wait. Lobbying pressures have
occasioned further delays in the legislative process. The authorities have accepted to reopen the issue of
multidisciplinary practices (MDPs) and have finalised the amendments to be considered at the resumption
of Dáil Report Stage in early 2015.. The amendments will require the future Legal Services Regulatory
Authority to conduct research and consultations on the issue of MDPs (48) before issuing a
recommendation to the Minister who would then determine whether the section of the legislation on
MDPs should be commenced or not. Although the authorities indicate that their intention remains to
allow MDPs, uncertainty on this matter has increased significantly as the recommendation from the
authority may well go in the opposite direction. In contrast, legal partnerships appear to be safeguarded.
The authorities confirmed their intention to have the Bill enacted in early 2015 and ensure that the Legal
Services Regulatory Authority is in operation by the middle of the year.
(48) The process should be split between a six-month research phase and six-month consultation period.
38
3. Policy issues
(Continued on the next page)
39
European Commission
Ireland - Post-Programme Surveillance
Box (continued)
40
3. Policy issues
41
4.
FINANCING ISSUES AND CAPACITY TO REPAY
The National Treasury Management Agency (NTMA) is fully pre-funded for 2015, excluding the
planned early repayment of further IMF loans. With the ten-year bond auction in October, the NTMA
completed its original EUR 8 billion bond funding target for the year. Earlier in 2014, the authorities
announced their intention to substitute IMF loans with market funding to benefit from lower market
interest rates. The NTMA raised a further EUR 3.75 billion through the issuance of a new 15-year bond in
November 2014. In order to facilitate early repayment to the IMF, Ireland requested creditor countries,
the EFSF and the ESM to waive the mandatory proportional early repayment clause in their loan
agreements. Following the granting of these waivers, the Irish authorities repaid approximately EUR 9
billion in December 2014, equivalent to all original IMF principal repayment obligations due up to July
2018.The authorities estimate that the EUR 9 billion early repayment will result in interest savings of
approximately EUR 750 million over the lifetime of the original IMF loans. Additional reimbursements
of EUR 9 billion are planned. Total interest savings are estimated to be in excess of EUR 1.5 billion,
including hedging costs (49). The IMF loans will be substituted by longer duration bonds to improve the
maturity profile of the public debt. As regards cash balances, the buffer at end 2014 was EUR 11.1
billion, sufficient to meet funding needs (excluding the planned early repayment of further IMF loans)
into early 2016. The agency expects a buffer of approximately EUR 11.0 billion at end 2015 (see Table
4.1 below). Overall, the IMF repayment is facilitated by low market borrowing rates and sovereign credit
rating upgrades in 2014.
Overall, repayment risks for the EFSM and EFSF loans remain low over the medium term. From
2015, the maturity profile is expected to improve further due to the refinancing of IMF loans. In addition,
debt sustainability has considerably improved since the first PPS review (Annex 2). The low repayment
risk assumes that the authorities continue to implement agreed policy plans and access to credit markets is
maintained. Following the decisions by the Council and the EFSF board of governors in June 2013, the
average maturity of EFSM and EFSF loans to Ireland was extended by 7 years (50). The first principal
repayments are due in 2029 for the EFSF loan and 2027 for the EFSM loan (51). Annual interest payments
on EFSM and EFSF loans combined amount to 0.6% of GDP.
(49) The actual interest savings will depend on the timing of the repayments and the interest rate on the bonds issued to refinance the
IMF loans as well as total amount repaid.
(50) Council Implementing Decision of 14 June 2013 amending Implementing Decision 2011/77/EU on granting Union financial
assistance to Ireland. Amendment Agreement of 26 June 2013 between the European Financial Stability Facility, Ireland and
the Central Bank of Ireland.
(51) The agreed maturity extension is already effective for EFSF loans whereas, for EFSM loans, the potential maturity extension
will be determined at a later stage as the loans approach their original maturity dates. The NTMA is expecting not to refinance
any of the EFSM loans before 2027. Therefore, no repayments of principal on EFSM loans are scheduled in Ireland's
provisional financing plan for 2015.
42
4. Financing issues and capacity to repay
Table 4.1:
Government Financing Plans
EUR billion
2014 provisional
2015 estimate
Funding requirement
Exchequer borrowing requirement (EBR) 1/
Medium/long-term debt redemption 2/
Other 3/
Total requirement
8.2
15.9
0.0
24.1
6.5
9.2
1.0
16.7
Funding sources
Government bonds 4/
EU-IMF loan disbursement 5/
Net short-term paper funding 6/
Other including net State savings (retail)
Use of cash and other short-term investment balances
Total sources
12.1
0.8
1.5
2.3
7.4
24.1
13.5
0.0
3.0
0.1
0.1
16.7
Financial buffer 7/
11.1
11.0
2014 figures are provisional and subject to revision; 2015 figures are estimates. Rounding may affect totals.
Notes:
1/ 2015 EBR estimate as per Department of Finance, Budget 2015 (October 2014).
2/ Includes government bond maturities, bond buy-backs/cancellations/switches and early IMF loan repayments. Further
early IMF loan repayments are also included in 2015.
3/ Includes contingencies.
4/ The NTMA announced in December 2014 that it plans to issue EUR 12 - 15 billion of long-term government bonds in
2015. EUR 13.5 billion, the mid-point of the range, is reflected in the table as indicative for 2015.
5/ The final EU/IMF programme loan disbursement from the EFSM was in March 2014.
6/ Net short-term paper funding; includes treasury bills.
7/ End-year cash and other short-term investment balances.
Source: National Treasury Management Agency (NTMA)
43
ANNEX 1
State of play with Macroeconomic Imbalance Procedure (MIP) relevant recommendations
44
CSR recommendation
Progress
CSR 1. Fully implement the 2014 budget and
ensure the correction of the excessive deficit in a
sustainable
manner
by
2015
through
underpinning the budgetary strategy with
additional structural measures while achieving
the structural adjustment effort specified in the
Council recommendation under the Excessive
Deficit Procedure. After the correction of the
excessive deficit, pursue a structural adjustment
towards the medium-term objective of at least 0,5
% of GDP each year, and more in good economic
conditions or if needed to ensure that the debt
rule is met in order to put the high general
government debt ratio on a sustained downward
path. Enhance the credibility of the fiscal
adjustment strategy, effectively implement multiannual budgetary planning and define broad
budgetary measures underlying the medium-term
fiscal targets. Ensure the binding nature of the
government expenditure ceiling including by
limiting the statutory scope for discretionary
changes. To support fiscal consolidation,
consideration should be given to raising revenues
through broadening the tax base. Enhance the
growth and environmental friendliness of the tax
system.
The 2014 general government deficit is expected to be around 4% of GDP, as compared to 3.7% of
GDP in the 2015 Draft Budgetary Plan (DBP), well within the EDP ceiling of 5.1% of GDP. Fasterthan-expected growth boosted revenue, while expenditures are above target especially in the health
care sector.
The Commission 2014 autumn forecast sees the 2015 deficit at 2.9% of GDP narrowly below the 3%
of GDP reference value of the Treaty. It includes tax cuts and expenditure increases of around 0.5% of
GDP. On the basis of currently available information, the Commission expects a timely the correction
of the excessive deficit. To make the correction sustainable, further measures are needed in 2016.
Concerning the other fiscal recommendations, the 2015 DBP complemented the 2015 budget with a
multi-annual budgetary planning which is expected to set Ireland on a path of a continued reduction in
the structural deficit. The estimated structural adjustment for 2016-2018 exceeds the minimum
correction path required by the preventive arm of the Stability and Growth Pact. By contrast, no
changes have been made regarding the need to ensure the binding nature of the government
expenditure ceiling including by limiting the statutory scope for discretionary changes. The decision to
put an end to the "double Irish" tax scheme, starting in 2015 for new companies and following a
transition period until end-2020 for established corporations, is likely to contribute to broadening the
tax base. No other measures have been taken in this area, and limited progress has been made to
enhance the growth and environmental friendliness of the system, except for a few measures such as
extending the accelerated capital allowances scheme for energy efficient equipment for another three
years.
Overall, there has been some progress with this CSR.
CSR 3. Pursue further improvements in active
labour market policies, with a particular focus on
the long-term unemployed, the low-skilled and,
in line with the objectives of a youth guarantee,
The establishment of the JobPath initiative was slow to begin with but is now proceeding according to
plan. Contracts will be signed with the two preferred bidders by the end of 2014. The first referrals of
long-term unemployed to JobPath providers are now expected for Q2 2015, with providers opening
around 100 offices across the country. When fully implemented, JobPath will enable a large number of
1. State of play with Macroeconomic Imbalance Procedure (MIP) relevant recommendations
young people. Advance the ongoing reform of the
further education and training (FET) system,
employment support schemes and apprenticeship
programmes. Offer more workplace training;
improve and ensure the relevance of FET courses
and apprenticeships with respect to labour market
needs. Increase the level and quality of support
services provided by the Intreo labour offices.
Put in place a seamless FET referrals system
between Intreo offices and Education and
Training Boards.
long-term unemployed to benefit from activation services provided by private contractors. EUR 12
million have been earmarked in Budget 2015 for JobPath. Most of the 60 Intreo offices will be opened
by the end of 2014, and the number of case officers dealing with jobseekers has now reached a steadystate of around 550. Reforming the further education and training system and the provision of courses
is an ongoing but very gradual process. All training centres vested in SOLAS have been consolidated
under their respective Education and Training Boards (ETBs), and SOLAS recently published its three
year corporate strategy and a five year strategy for the development and delivery of an integrated FET
sector. Intreo offices and ETBs have put in place protocols to govern their interactions. These include
targets on the number of jobseekers referred to training programmes. A new iteration of Pathways to
Work, the strategy that defines Ireland's reform to activation and training services, was published in
October 2014. It defines new actions to be implemented in 2015 as well as quantitative targets, with a
bigger focus on long-term and youth unemployment. Pathways to Work 2015 specifies new measures
towards the implementation of the Youth Guarantee, including the launch JobsPlus for the youth (an
employer incentive scheme to recruit young people) and the allocation of a number of positions in the
Momentum programme to the under 25 years of age.
Overall, there has been some progress with this CSR.
CSR 5. Advance policies for the SME sector
including initiatives to address the availability of
bank and non-bank financing and debt
restructuring issues, while avoiding risks to
public finances and financial stability.
Advance initiatives to improve SME's access to
bank credit and non-bank finance. Introduce a
monitoring system for SME lending in the
banking sector.
In parallel, work to ensure that available nonbank credit facilities, including the three SME
funds co-funded by the National Pensions
Reserve Fund (NPRF), Microfinance Ireland and
the temporary loan guarantee scheme, are better
utilised. Promote the use of these and other nonbank schemes by SMEs.
Enhance the Credit Review Office's visibility and
capabilities in mediating disputes between banks
and prospective SME borrowers who have been
The legislation to replace the National Pensions Reserve Fund (NPRF) with the Ireland Strategic
Investment Fund (ISIF) was enacted in July 2014. While the NPRF held global assets, ISIF's mandate
is to invest on a commercial basis to support economic activity in Ireland. It will focus in part on SMEs
and manage assets worth EUR 7 billion (4% of GDP). The state development corporation for SMEs,
the Strategic Banking Corporation of Ireland (SBCI), is expected to begin providing loans via existing
credit institutions towards the end of 2014. It will have about EUR 800 million (0.45% of GDP) in
funds but some of the lending will involve state guarantees subject to 'de minimis' rules for state aid.
Two of three NPRF SME funds are lending with the SME Equity Fund seeing a large pipeline of
projects. However one NPRF fund, the Turnaround Fund is being closed at end-2014. In May 2014, a
supporting SMEs Online Tool (or website) was launched to increase awareness among SMEs about
available business supports. A communications campaign is being undertaken to showcase the online
guide. The awareness of this online tool was at 23% in September 2014 amongst SMEs.
The authorities publish quarterly data on bank lending to SMEs, but no longer have a formal targetbased system to monitor lending to SMEs though it is closely watched.
PTSB has agreed to participate in the Credit Review Office process as it will begin lending to SMEs.
As shown by the latest Red C SME Credit demand survey (September 2014), there are still issues with
the visibility and usage of non-bank schemes and of the Credit Review Office for appeals related to
credit refusals. Awareness and knowledge on SME funding options remains moderate as demand for
45
European Commission
Ireland - Post-Programme Surveillance
46
refused credit.
SME credit has declined recently.
Overall, there has been some progress with this CSR.
CSR 6. Monitor banks' performance against the
mortgage arrears restructuring targets. Announce
ambitious targets for the third and fourth quarters
of 2014 for the principal mortgage banks to
propose and conclude restructuring solutions for
mortgage loans in arrears of more than 90 days,
with a view to substantially resolving mortgage
arrears by the end of 2014. Continue to assess the
sustainability of the concluded restructuring
arrangements through audits and targeted on-site
reviews. Develop guidelines for the durability of
solutions.
Publish regular data on banks' SME loan
portfolios in arrears to enhance transparency.
Develop a strategy to address distressed
commercial real-estate exposures.
Establish a central credit registry.
The performance of domestic banks continues to be monitored within the Mortgage Arrears Resolution
Targets (MART) framework. In June 2014, the Central Bank of Ireland (CBI) announced targets for
the third and fourth quarters of 2014. The banks are required to propose sustainable solutions to 85% of
their customers in arrears by the end of 2014, while concluded solutions need to reach 45% of all
accounts in arrears by the same date. Furthermore, the CBI requires that a minimum of 75% of
concluded solutions are meeting the terms of the arrangement agreed. For the third quarter of 2014, the
targets were met and exceeded by the banks, with an encouraging 91% of solutions meeting the terms.
However, having in mind the heterogeneous structure of the concluded solutions and the still short
time-lapse, the sustainability of the new arrangements should continuously be monitored. To do this,
audits are taking place of the banks' MART second quarter 2014 returns.
There have been fewer advances with developing guidelines for the durability of solutions, publishing
data on banks' SME arrears exposure and with developing a strategy to address commercial real-estate
arrears. The National Asset Management Agency (NAMA), the bad bank, is ahead of schedule with
EUR 18.7 billion of asset disposals at end-December 2014 (about 28% of which are Irish disposals),
taking advantage of strong market demand. Work on the central credit register has been well underway
since January 2014, but the current timeline envisions a certain delay with the registry being
operational in late 2016.
Overall, there has been some progress in the implementation of this CSR.
ANNEX 2
Debt sustainability analysis
Graph A2.1: Annual change in gross debt ratio, baseline scenario
% of GDP
10
05
00
-05
-10
-15
-20
2013
2014
2015
2016
Stock flow adjustments
Growth effect (real)
Primary deficit
2017
2018
2019
2020
2021
2022
2023
2024
2025
Inflation effect
Interest expenditure
Change in gross public sector debt
Source: European Commission
The debt sustainability outlook has improved since the first PPS review. For Ireland, the
Commission's new enhanced debt sustainability analysis (DSA) for "vulnerable" countries is applied as
gross public debt is above 90% of GDP (52). In the DSA update for the first PPS review, the baseline
scenario (based on Commission forecasts and a no-policy change assumption for years in which no
budget is available) revealed that public debt was projected to rise over the medium term to 128% of
GDP. Only in the Stability and Convergence Programme (SCP) scenario was public debt projected to
decline to more sustainable levels (53). Following the switch to the ESA 2010 and the much better than
previously expected growth outlook in the Commission 2014 autumn forecast, the latest DSA shows that
the general government debt-to-GDP ratio should stabilise at about 104% from 2020, though still at a
high level (Figure A2.1). Under the Stability and Growth Pact (SGP) scenario (54), gross government debt
is projected to decline further to just below 80% of GDP. This highlights the importance of continued
fiscal adjustment to achieve an improvement of the primary balance over the medium term to reduce the
public-debt-to GDP ratio. Sensitivity analysis also reveals that public debt remains vulnerable to a series
(52) For
more
information
on
the
Commission's
DSA
http://ec.europa.eu/economy_finance/publications/occasional_paper/2014/pdf/ocp200_en.pdf.
methodology,
see
(53) The SCP scenario relies on the SCP's macro-fiscal assumptions over the programme horizon and a constant fiscal policy
assumption (constant structural primary balance at last programme year) beyond the programme horizon.
(54) The SGP scenario assumes that for countries under excessive deficit procedure (EDP) such as Ireland, a structural adjustment
path in compliance with the fiscal effort recommended by the Council is maintained until the excessive deficit is corrected, and
thereafter an annual structural consolidation effort of 0.5 percentage point of GDP or 0.6 percentage point if public debt exceeds
60% of GDP is maintained until the medium-term objective (MTO) is reached. The effort of 0.6 percentage point is used for
illustrative purposes and does not prejudge the actual effort in excess of the 0.5 percentage point benchmark that will be
required until the MTO is achieved.
47
European Commission
Ireland - Post-Programme Surveillance
Graph A2.2: Public debt sustainability under different scenarios
Gross public debt as % of GDP
130.0
125.0
120.0
115.0
110.0
105.0
100.0
95.0
90.0
85.0
80.0
2011
2012
2013
2014
2015
2016
2017
2018
2019
2020
2021
2022
2023
2024
2025
Baseline no-policy change scenario
Stability and Growth Pact (SGP) institutional scenario
Stability and Convergence Programme (SCP) scenario*
(1)Spring 2014 release based on ESA 95 NA methodology
Source: European Commission
of macro shocks: negative shocks to real economic growth, interest rates or inflation would raise the
public debt-to-GDP ratio to about 110% by 2025 (Figures A2.2 and A2.3).
Risks related to the government's contingent liabilities remain significant for Ireland but are
decreasing. Integrating the DSA with information on the government's contingent liabilities is important
in order to have a more comprehensive assessment of risks to public debt sustainability. In particular, it is
relevant to examine contingent liabilities arising from vulnerabilities in the banking sector, as these can
lead to rapid and substantial increases in general government debt. The size of state guarantees is still
substantial for Ireland at 41.4% of GDP in 2013, compared to the EU average 9.8% of GDP. Of these
guarantees, 31.1% of GDP in 2013 were contingent liabilities of the general government related to
financial institutions support, compared to 6.4% of GDP for the EU average. Nonetheless, the ongoing
repayment of the government guaranteed bonds issued by NAMA means that contingent liabilities are
expected to continue to decrease (55). The high share of non-performing loans (NPLs) is also still a
concern. However, the risk to government finances is mitigated by the fact that the coverage ratio for
these NPLs was also high with provisions at around 52% to NPLs in the third quarter of 2014 for the
three main domestic banks.
(55) Government guaranteed bonds were issued by the special purpose vehicle, NAMA, in order to acquire commercial property
loans from the domestic banks.
48
2. Debt sustainability analysis
Table A2.1:
Public debt projections under baseline and alternative scenarios and sensitivity tests
2012 2013 2014 2015 2016 2017 2018 2019 2020 2021 2022 2023 2024 2025
Gross debt ratio
121.7 123.3 110.5 109.4 106.0 105.1 104.6 104.2 104.1 104.0 103.9 104.0 104.1 104.3
Changes in the ratio (-1+2+3)
10.5
of which
(1) Primary balance (1.1+1.2-1.3+1.4)
1.6 -12.8
-1.2
-3.4
-0.9
-0.5
-0.4
-0.1
-0.1
-0.1
0.1
0.1
0.2
-3.9
-1.7
0.2
0.8
0.8
0.5
0.3
0.1
0.1
0.3
0.3
0.3
0.4
0.5
(1.1) Structural primary balance (kept const. at 2016 lvl)
-2.9
-0.4
0.3
0.5
0.5
0.5
0.5
0.5
0.5
0.5
0.5
0.5
0.5
0.5
(1.2) Cyclical component
-1.0
-1.4
-0.1
0.3
0.3
0.2
0.1
0.0
0.0
0.0
0.0
0.0
0.0
0.0
(1.3) Cost of ageing
0.0
0.0
0.0
0.0
0.0
0.2
0.3
0.3
0.3
0.1
0.1
0.1
0.0
-0.1
(1.4) Others (taxes and property incomes)
0.0
0.0
0.0
0.0
0.0
0.0
0.0
-0.1
-0.1
-0.1
-0.1
-0.1
-0.1
-0.1
3.0
3.0
-1.2
-1.0
-1.5
-0.3
-0.1
-0.3
0.0
0.2
0.3
0.4
0.6
0.7
4.1
4.4
4.8
3.8
3.8
3.7
3.7
3.7
3.7
3.8
3.8
3.9
4.0
4.2
Growth effect
0.3
-0.2
-5.4
-3.8
-3.8
-2.4
-2.0
-2.0
-1.7
-1.6
-1.5
-1.5
-1.4
-1.5
Inflation effect
-1.5
-1.2
-0.6
-1.0
-1.5
-1.6
-1.8
-2.0
-2.0
-2.0
-2.0
-2.0
-2.0
-2.0
3.6
-3.1 -11.4
0.6
-1.1
0.0
0.0
0.0
0.0
0.0
0.0
0.0
0.0
0.0
-7.1
-4.8
-3.3
-3.3
-3.0
-3.3
-3.6
-3.7
-3.5
-3.5
-3.6
-3.6
-3.7
(2) Snowball effect
Interest expenditure
(3) Stock flow adjustment and one-off measures
Per memo
Structural balance
-3.8
Source: European Commission
Graph A2.3: Public debt projection under interest rate shocks
Gross public debt as % of GDP
130.0
125.0
120.0
115.0
110.0
105.0
100.0
95.0
90.0
85.0
80.0
2011
2012
2013
2014
2015
2016
2017
2018
2019
2020
2021
2022
2023
2024
2025
Baseline no-policy change scenario
Standardized (permanent) negative shock (-1p.p.) to the short- and long-term interest rates on newly issued and rolled over debt
Standardized (permanent) positive shock (+1p.p.) to the short- and long-term interest rates on newly issued and rolled over debt
Source: European Commission
49
European Commission
Ireland - Post-Programme Surveillance
Graph A2.4: Public debt projection under growth and inflation shocks
Gross public debt as % of GDP
130.0
125.0
120.0
115.0
110.0
105.0
100.0
95.0
90.0
85.0
80.0
2011
2012
2013
2014
2015
2016
2017
2018
2019
2020
2021
2023
2024
2025
Standardized (permanent) negative shock (-0.5p.p.) on GDP growth
Standardized (permanent) positive shock (+0.5p.p.) on GDP growth
Standardized (permanent) negative shock (-0.5p.p.) on inflation
Standardized (permanent) positive shock (+0.5p.p.) on inflation
(1) Note, shocks to real economic growth and inflation have the same impact on public debt.
Source: European Commission
50
2022
Baseline no-policy change scenario
ANNEX 3
Supplementary tables
Table A3.1:
Fiscal accounts
2009
2010
2011
2012
2013
2014
2015
2016
% of GDP
Indirect taxes
10.8
10.9
10.3
10.5
10.9
11.0
11.0
10.8
Direct taxes
12.2
12.1
12.4
13.1
13.3
13.5
12.7
12.7
Social contributions
6.1
5.8
5.8
5.6
5.9
5.9
5.8
5.8
Sales
2.7
3.2
3.0
2.9
2.6
2.4
2.3
2.3
Other current revenue
1.3
1.4
1.5
1.8
1.9
1.7
1.5
1.3
Total current revenue
33.1
33.3
33.0
33.9
34.5
34.6
33.4
33.0
0.6
0.3
0.5
0.3
0.3
0.4
0.5
0.4
Total revenue
33.7
33.6
33.5
34.2
34.8
35.0
33.9
33.3
Compensation of employees
12.3
11.7
11.2
10.9
10.7
10.2
9.6
9.3
6.0
5.5
5.1
4.9
4.7
5.0
4.6
4.6
Capital transfers received
Intermediate consumption
Social transfers in kind via market producers
2.5
2.7
2.6
2.7
2.6
2.5
2.3
2.3
14.7
14.7
14.2
14.3
13.7
12.9
12.2
12.1
Interest paid
2.0
3.0
3.4
4.1
4.4
4.1
3.8
3.8
Subsidies
1.1
1.1
0.9
0.9
0.9
0.9
0.9
0.9
Other current expenditure
1.6
1.5
1.4
1.4
1.6
1.4
1.4
1.4
Social transfers other than in kind
Total current expenditure
40.2
40.2
38.9
39.3
38.6
36.9
35.0
34.5
Gross fixed capital formation
3.7
3.4
2.4
1.9
1.7
1.5
1.3
1.3
Other capital expenditure
3.7
22.5
4.9
1.0
0.2
0.3
0.5
0.5
47.6
66.1
46.1
42.2
40.5
38.7
36.8
36.3
Total expenditure
General government balance
-13.9
-32.4
-12.6
-8.0
-5.7
-3.7
-2.9
-3.0
Underlying government balance (EDP)
-11.5
-13.3
-8.6
-8.0
-5.7
-3.6
-2.9
-3.0
EUR billion
Indirect taxes
18.1
18.0
17.6
18.2
19.0
20.2
21.2
21.8
Direct taxes
20.5
19.9
21.2
22.6
23.2
24.9
24.5
25.7
Social contributions
11.8
10.2
9.5
10.0
9.7
10.3
10.9
11.2
Sales
4.6
5.3
5.2
4.9
4.5
4.4
4.5
4.6
Other current revenue
2.2
2.3
2.6
3.2
3.3
3.1
2.9
2.7
Total current revenue
55.6
54.9
56.5
58.5
60.3
63.5
64.3
66.6
1.1
0.6
0.9
0.6
0.6
0.8
0.9
0.8
Total revenue
56.7
55.5
57.3
59.1
60.8
64.3
65.2
67.4
Compensation of employees
20.7
19.3
19.2
18.9
18.7
18.7
18.4
18.9
Intermediate consumption
10.0
9.1
8.7
8.4
8.3
9.1
8.9
9.4
4.1
4.5
4.5
4.7
4.6
4.5
4.5
4.7
Capital transfers received
Social transfers in kind via market producers
Social transfers other than in kind
24.7
24.3
24.3
24.7
24.0
23.7
23.5
24.4
Interest paid
3.4
4.9
5.9
7.2
7.7
7.5
7.4
7.7
Subsidies
1.9
1.8
1.6
1.5
1.5
1.6
1.8
1.9
Other current expenditure
2.7
2.5
2.4
2.5
2.7
2.6
2.7
2.8
Total current expenditure
67.6
66.4
66.6
67.9
67.4
67.8
67.3
69.7
Gross fixed capital formation
6.3
5.5
4.0
3.3
3.0
2.8
2.5
2.7
Other capital expenditure
6.1
37.0
8.3
1.7
0.4
0.5
1.0
1.0
80.0
109.0
78.9
73.0
70.8
71.0
70.8
73.4
-23.4
-53.5
-21.6
-13.9
-10.0
-6.7
-5.6
-6.1
4
31.6
6.8
0.0
0.0
0.1
0.1
0.1
-19.4
-21.9
-14.8
-13.9
-10.0
-6.6
-5.5
-6.0
Total expenditure
General government balance
Deficit-increasing financial sector measures
Underlying government balance (EDP)
Source: European Commission
51
European Commission
Ireland - Post-Programme Surveillance
Table A3.2:
General government debt projections (based on 2014 Autumn forecast)
2008
2009
2010
2011
2012
2013
2014
2015
Government deficit (% of GDP)
-7.0
-13.9
-32.4
-12.6
-8.0
-5.7
-3.7
-2.9
2016
-3.0
Government gross debt (% of GDP)
42.6
62.2
87.4
111.1
121.7
123.3
110.5
109.4
106.0
levels, EUR billion
Government deficit
Gross debt
Change in gross debt
-13.1
-23.4
-53.5
-21.6
-13.9
-10.0
-6.7
-5.6
-6.1
79.6
104.5
144.2
190.1
210.2
215.6
203.1
210.2
214.1
32.5
24.9
39.6
45.9
20.1
5.3
-12.5
7.1
3.9
Nominal GDP
186.9
168.1
164.9
171.0
172.8
174.8
183.7
192.2
202.1
Real GDP
176.6
165.4
164.9
169.5
169.0
169.3
177.1
183.5
190.2
3.7
Real GDP growth (% change)
-2.6
-6.4
-0.3
2.8
-0.3
0.2
4.6
3.6
Change in gross debt (% of GDP)
17.4
14.8
24.0
26.9
11.6
3.0
-6.8
3.7
2.0
Stock-flow adjustments (% of GDP)
10.3
0.9
-8.4
14.2
3.6
-2.7
-10.5
0.8
-1.0
% of GDP
Gross debt ratio
42.6
62.2
87.4
111.1
121.7
123.3
110.5
109.4
106.0
Change in gross debt ratio
18.6
19.6
25.2
23.7
10.5
1.6
-12.8
-1.2
-3.4
Contribution to change in gross debt
Primary balance
5.8
11.9
29.4
9.2
3.9
1.3
-0.4
-0.9
-0.8
"Snow-ball" effect
2.6
6.9
4.2
0.3
3.0
3.0
-1.9
-1.0
-1.5
of which
Interest expenditure
1.3
2.0
3.0
3.4
4.1
4.4
4.1
3.8
3.8
Real growth effect
0.7
3.0
0.2
-2.3
0.3
-0.2
-5.4
-3.8
-3.8
Inflation effect
Stock-flow adjustments
Implicit interest rate
Source: European Commission
52
0.6
1.9
1.0
-0.8
-1.5
-1.2
-0.6
-1.0
-1.5
10.3
0.9
-8.4
14.2
3.6
-2.7
-10.5
0.8
-1.0
5.1
4.3
4.7
4.1
3.8
3.6
3.5
3.6
3.6
OCCASIONAL PAPERS
Occasional Papers can be accessed and downloaded free of charge at the following address:
http://ec.europa.eu/economy_finance/publications/occasional_paper/index_en.htm.
Alternatively, hard copies may be ordered via the “Print-on-demand” service offered by the EU
Bookshop: http://bookshop.europa.eu.
HOW TO OBTAIN EU PUBLICATIONS
Free publications:
• one copy:
via EU Bookshop (http://bookshop.europa.eu);
•
more than one copy or posters/maps:
from the European Union’s representations (http://ec.europa.eu/represent_en.htm);
from the delegations in non-EU countries (http://eeas.europa.eu/delegations/index_en.htm);
by contacting the Europe Direct service (http://europa.eu/europedirect/index_en.htm) or
calling 00 800 6 7 8 9 10 11 (freephone number from anywhere in the EU) (*).
(*) The information given is free, as are most calls (though some operators, phone boxes or hotels may charge you).
Priced publications:
• via EU Bookshop (http://bookshop.europa.eu).
Priced subscriptions:
• via one of the sales agents of the Publications Office of the European Union
(http://publications.europa.eu/others/agents/index_en.htm).
KC-AH-15-210-EN-N
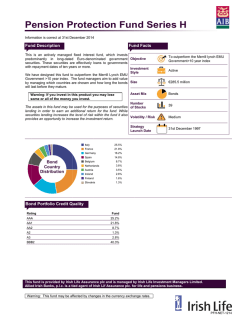
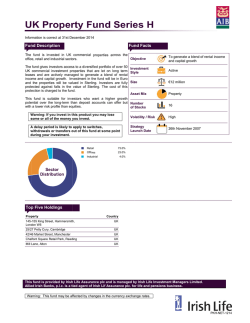


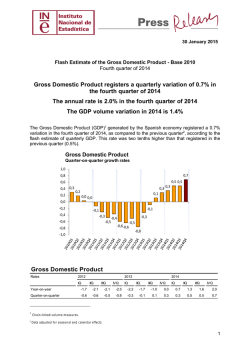
© Copyright 2026