
Local and global perspectives on the virtual water
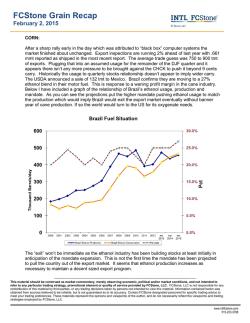
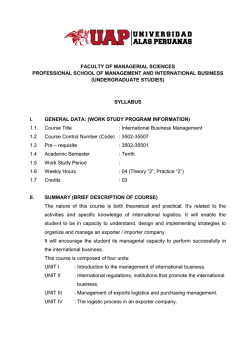
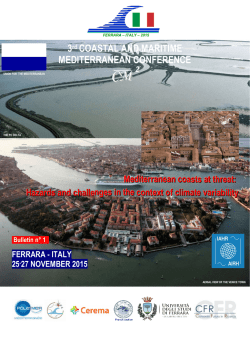
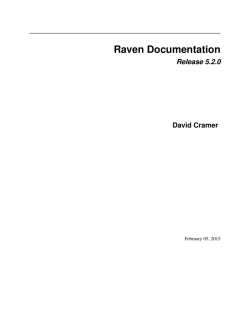
Hydrology and
Earth System
Sciences
Open Access
Ocean Science
Open Access
Hydrol. Earth Syst. Sci., 17, 1205–1215, 2013
www.hydrol-earth-syst-sci.net/17/1205/2013/
doi:10.5194/hess-17-1205-2013
© Author(s) 2013. CC Attribution 3.0 License.
cess
Model Development
Local and global perspectives on the virtual water trade
Solid Earth
Open Access
Received: 29 October 2012 – Published in Hydrol. Earth Syst. Sci. Discuss.: 14 November 2012
The Cryosphere
Revised: 18 February 2013 – Accepted: 5 March 2013 – Published: 19 March 2013
Open Access
S. Tamea1 , P. Allamano1 , J. A. Carr2 , P. Claps1 , F. Laio1 , and L. Ridolfi1
1 Department
of Environmental, Land and Infrastructure Engineering, Politecnico di Torino, Turin, Italy
2 Department of Environmental Sciences, University of Virginia, Charlottesville, Virginia, USA
Correspondence to: S. Tamea ([email protected])
Abstract. Recent studies on fluxes of virtual water are showing how the global food and goods trade interconnects the
water resources of different and distant countries, conditioning the local water balances. This paper presents and discusses the assessment of virtual water fluxes between a single country and its network of trading partners, delineating a
country’s virtual water budget in space and time (years 1986–
2010). The fluxes between the country under study and its
importing/exporting partners are visualized with a geographical representation shaping the trade network as a virtual
river/delta. Time variations of exchanged fluxes are quantified to show possible trends in the virtual water balance,
while characterizing the time evolution of the trade network
and its composition in terms of product categories (plantbased, animal-based, luxury food, and non-edible). The average distance traveled by virtual water to arrive to the place
of consumption is also introduced as a new measure for the
analysis of globalization of the virtual water trade.
Using Italy as an example, we find that food trade has
a steadily growing importance compared to domestic production, with a major component represented by plant-based
products, and luxury products taking an increasingly larger
share (26 % in 2010). In 2010 Italy had an average net import of 55 km3 of virtual water (38 km3 in 1986), a value
which poses the country among the top net importers in the
world. On average each cubic meter of virtual water travels
nearly 4000 km before entering Italy, while export goes to
relatively closer countries (average distance: 2600 km), with
increasing trends in time which are almost unique among the
world countries. Analyses proposed for Italy are replicated
for 10 other world countries, triggering similar investigations
on different socio-economic actualities.
1
Introduction
The virtual water content of a good is defined as the amount
of water necessary for its production. Since its proposal
(Allan, 1998), the concept of virtual water has been a key feature for the scientific comparison of the water consumption
of different goods (e.g., plant food, meat, textile fibers, biofuels, etc.). The impact of different categories of goods on the
available water resources can be determined by simply summing up their virtual water content, enabling the assessment
of the overall impact of product categories or specific populations, defining their so-called water footprint. The global
trade in all goods can also be translated into a corresponding
virtual water trade, allowing quantification of the import and
export fluxes of virtual water, and separating countries which
import virtual water to sustain their population from countries which are net exporters of virtual water, e.g. produce
more than needed for domestic consumption. In this sense,
the concept of virtual water also provides a novel quantitative
framework for the study of water resources used for agriculture and livestock production worldwide, and the water exchanges hidden in the food trade. In addition to this aspect,
by calculating the virtual water content of various goods,
scientists have highlighted the enormous volumes of water
needed for their production, in particular for food products.
For instance, on average in the period 1996–2005, the global
water footprint (total amount of consumed virtual water) has
been as large as 9087 km3 per year (Hoekstra and Mekonnen,
2012). A large part of this virtual water is transferred among
regions of the world by global trade: in 2010 this trade has
involved nearly 3000 km3 of virtual water, with a twofold
increase over 1986. These numbers indicate that the virtual
water consumption, dominated by food products, exceeds by
an order of magnitude the water used by people for drinking
Published by Copernicus Publications on behalf of the European Geosciences Union.
1206
and domestic usage, confirming the large impact of virtual
water on the local and global water balance.
Due to its economical, social, political, and environmental implications, virtual water trade has attracted a growing
amount of attention from the scientific community in the
last decade (e.g., Hoekstra and Chapagain, 2008; Hoekstra
and Mekonnen, 2012). Databases are now available reporting the virtual water content of hundreds of goods differentiated on the basis of the area of production. Such data
availability allows for elucidation of some key characteristics of virtual water consumption and trade, including the remarkable differences among countries, the strong predominance of net importers that rely on just a few exporting
countries, and the impact of agricultural policies and technologies (e.g., Hoekstra and Chapagain, 2008). Virtual water
trade has been studied by using the tools of the complex network theory (Barrat et al., 2008), highlighting clues of smallworld behavior (Shutters and Muneepeerakul, 2012), the occurrence of hubs and rich-club effect (Suweis et al., 2011),
and the existence of a community structure (D’Odorico et al.,
2012). Similarly, the study of the temporal evolution of the
virtual water network (Carr et al., 2012; Dalin et al., 2012;
D’Odorico et al., 2012) has shown the progressive intensification of the virtual water exchanges, and of the geography
of these variations.
Notwithstanding these achievements, the study of virtual
water trade is, in some ways, just beginning. In fact, the
complexity and the possible implications are far from being fully explored, and further efforts are needed to better
understand the information content of the available data. In
this paper, we tackle the problem by looking at the global
network of virtual water from the point of view of a single
country (hence the local component of our approach). Other
works have analyzed the virtual water balance of a single
region or country (e.g., Aldaya et al., 2010; Bulsink et al.,
2010; Feng et al., 2011). However, our main goal is to propose innovative country-based analyses and data visualization tools which are capable of detecting and investigating
new features of the virtual water trade. Such original tools
are then applied to the case of Italy and used to quantify variations in time of the virtual water traded and consumed by the
country. Results enable additional and novel insights on the
virtual water budget of Italy (a country which has not been
considered singularly in previous country-based works, such
as those mentioned above), but the tools proposed in this paper are general and can be applied to similarly investigate any
individual country (for other examples, see the Supplement
Sect. B).
2
Methods
We collected food production and international trade data
for the period 1986–2010 from the FAOSTAT database,
developed by the Food and Agricultural Organization of
the United Nations. 309 crops and animal products were
Hydrol. Earth Syst. Sci., 17, 1205–1215, 2013
S. Tamea et al.: Virtual water trade
considered, including all items with an available estimate of
the country-specific virtual water content from Mekonnen
and Hoekstra (2011): for any product m, the virtual water
content (or water footprint) is obtained by considering the
volume of water needed to produce m in a given country, including the contributions of rainfall (green water), surface
water and groundwater (blue water). We excluded from our
calculations the grey water, which is an indicator of freshwater pollution, due to the strong uncertainties inherent in its
determination (e.g., Hoekstra et al., 2011). The total number of countries considered, N, is equal to 253; since the
number of active countries varies in time (e.g., 208 in 1986
and 211 in 2010), values corresponding to inactive countries
in any given year are set to zero. The reported data were
rectified to political changes over the 25 yr period to allow
comparison among different years. Political rectification regarded Ethiopia, Eritrea, Germany, Yemen, countries from
ex-Yugoslavia, countries from the ex-Soviet union, Czech
Republic and Slovakia, as reported in detail by Carr et al.
(2013). Virtual water data for countries not reported in the estimates by Mekonnen and Hoekstra (2011) are based on the
green and blue virtual water contents of the nearest neighbor
(±10◦ of latitude and longitude). The global average values
for the green and blue virtual water contents of product m
were used for countries with no close neighbor. For a part
of the present analysis, products were further segregated into
four categories: edible crops, edible animal products, edible
luxury items (such as sugars, coffee and chocolate) and nonedible commodities (such as plant fibers, oil cakes or animal
hides), as detailed in the Supplement Sect. A. Live animal
weights were converted to live animal equivalents (heads)
based on FAOSTAT datasets (http://www.fao.org/fileadmin/
templates/ess/documents/methodology/tcf.pdf).
FAOSTAT data provide for each product, m, and year, t,
the amounts produced in any given country; these amounts
multiplied by the corresponding local virtual water contents,
give the (N ×1) vector of equivalent consumptions of virtual
water for food production, Pm (t). By summing up over nonoverlapping products, one obtains the vector of the
Ptotal virtual water consumption (for production), P (t) = m Pm (t).
Non-overlapping products are a subset of the 309 items chosen to avoid double accounting of virtual water in primary
and derived food commodities. Details are reported in the
Supplement Sect. A. An analogous procedure was followed
to obtain the virtual water fluxes among countries: for each
product, m, and year, t, a (N × N ) trade matrix, Tm (t), was
generated, where the (i, j ) element of the matrix is the export
of that product from country i, to country j . Each individual
trade matrix was then converted to a product-specific virtualwater trade matrix, Cm (t), by multiplying each product quantity by the virtual water content of such product in the country of origin.
P The total virtual water trade matrix is simply
C(t) = m Cm (t) where, in this case, summation extends to
all 309 items because double-accounting problems do not affect trade data.
www.hydrol-earth-syst-sci.net/17/1205/2013/
S. Tamea et al.: Virtual water trade
1207
Table 1. Volumes of virtual water imported and exported by Italy in 1986 and 2010 grouped by world regions (in km3 yr−1 ) and percentage
variation in time. Percentages in the import/export columns (in italic) are calculated with respect to the total value in the last row.
IMPORT
1986
3
IMPORT
2010
Var. %
(2010–1986)
EXPORT
2010
Var. %
(2010–1986)
Europe
Asia
Africa
North America
South America
Oceania
28.2
4.5
5.9
6.6
4.5
0.58
56 %
9%
12 %
13 %
9%
1.2 %
54.6
11.7
8.2
4.8
11.4
0.87
60 %
13 %
9%
5%
12 %
1.0 %
+94
+160
+39
−28
+150
+50
6.7
1.2
2.7
0.9
0.4
0.06
56 %
10 %
23 %
7%
4%
0.5 %
26.5
5.0
1.5
3.0
0.33
0.55
72 %
13 %
4%
8%
0.9 %
1.5 %
+298
+322
−45
+235
−24
+875
Total
50.3
100 %
91.4
100 %
+82
12.0
100 %
36.8
100 %
+208
Results and discussion
The international trade of food entails the displacement of
the virtual water embedded in the traded food products. Thus,
food trade generates a “flow” of virtual water from exporting
to importing countries in a global network connecting the
world’s countries. While the virtual water network has already been analyzed under a global perspective (e.g., Suweis
et al., 2011; Carr et al., 2012; Dalin et al., 2012), in this paper we propose a novel approach which aims at drawing general conclusions starting from a local view of the network to
draw, i.e. focusing on the flows and water budget of specific
countries. We take Italy as a paradigmatic example to show
the increased knowledge which can be gained by analyzing
the virtual water network from a local perspective. Examples pertaining to other countries are reported in the Supplement Sect. B to demonstrate the general applicability of the
proposed tools. The Supplement refers to a selection of ten
countries (Australia, Brazil, China, Egypt, France, Germany,
India, Indonesia, Japan, and USA) covering all continents,
a large portion of the global population (more than 50 % in
2010), and a wide range of socio-economic and cultural actualities.
3.1
EXPORT
1986
Network-related analyses
Considering first the virtual water flows associated with the
import of goods, the volumes (per year) imported by Italy
from each country are represented as river branches originating from the center of the supplying country. All branches
are then connected in the form of a (virtual) river network,
grouping all flows into a single effluent representing the total
Italian import in a given year. Such representation, although
not based on the direct connections between Italy and the
trading partners, allows for a graphical comparison of flows
from different region or continents, also quantified in the following Table 1. The virtual river is shown in Fig. 1 for year
2010.
In 2010 Italy imported 91.4 km3 of virtual water from 156
countries in all continents, but primarily from Europe. The
www.hydrol-earth-syst-sci.net/17/1205/2013/
import network evolved in time, as emerges from the inset in
Fig. 1 and from the analysis of Table 1. The network structure underwent only minor modifications between 1986 and
2010, with a small increase (14 links) in the number of supplier countries: some of these changes were caused by the
political/administrative changes in countries such as the former USSR and Yugoslavia, while some other links – e.g. with
remote islands of the Indian and Pacific Ocean – were nonpermanent and switched on and off irregularly, depending on
the year. The overall incoming flux increased by 82 % from
1986 to 2010; some major changes can be found in the Americas: North and Central America decreased their contribution (from 6.6 to 4.8 km3 ), while South America strongly increased it (from 4.1 to 11.4 km3 ); similarly, Asia underwent
stronger-than-average increases in the study period.
We report in Table 2 some exchange values for the selection of countries reported in the Supplement Sect. B as relevant examples. France remains the preferred importing partner for Italy, but the increase in the imported flux is weaker
than the world average (82 %). The USA are losing their
share in the Italian import of food, while in contrast, Brazil
and Indonesia are taking a leading role, with impressive increase rates in the last years. As of export, Italy has strongly
increased its virtual water export to the USA, exceeding the
corresponding import flux. Italian products have also relevantly increased their penetration into the Chinese, Japanese
and Australian markets, while fluxes to India and Indonesia
remained negligible. On the contrary, Egypt and Brazil have
dramatically decreased their imports from Italy to the point
that they have become nearly negligible.
A reversed spatial representation, resembling a river delta,
can be used to visualize the virtual water flows associated
with exports from Italy (Fig. 2). In this case the end-point
of each branch represents the recipient countries, and the
source represents the total Italian export in a given year. The
river delta, as well as the virtual river in Fig. 1, is not meant
to represent a network structure but to provide a graphical
representation of virtual water flows aggregated by region or
continent.
Hydrol. Earth Syst. Sci., 17, 1205–1215, 2013
1208
S. Tamea et al.: Virtual water trade
< 0.001 km3
< 0.01 km3
< 0.1 km3
3
< 1 km
3
< 10 km
3
< 91.4 km
ITALY
< −1 km3
−1 to 0 km3
3
0 to +1 km
3
> +1 km
(IMPORT 2010)
difference 2010−1986
Fig. 1. The virtual water river flowing to Italy in 2010: branches originate in the trading countries and line thicknesses and colors indicate
the virtual water volumes imported by Italy. Differences in import fluxes between 2010 and 1986 are reported in the inset.
Fig. 1. The virtual-water river flowing to Italy in 2010: branches originate in the trading countries and line thicknesses and colors indicate the virtual water volumes imported by Italy. Differences in import fluxes between
2010 and 1986 are reported in the inset.
< 0.001 km3
< 0.01 km3
< 0.1 km3
< 1 km3
< 10 km3
< 36.8 km3
< −1 km3
−1 to 0 km3
3
0 to +1 km
> +1 km3
difference 2010−1986
ITALY
(EXPORT 2010)
13
Fig. 2. The virtual water delta draining water from Italy in 2010: branches terminate in the trading countries and line thicknesses and colors
indicate the virtual water volumes exported by Italy. Differences in export fluxes between 2010 and 1986 are reported in the inset.
Fig. 2. The virtual-water delta draining water from Italy in 2010: branches terminate in the trading countries
and line thicknesses and colors indicate the virtual water volumes exported by Italy. Differences in export fluxes
2010Sci.,
and 1986
are reported2013
in the inset.
Hydrol.between
Earth Syst.
17, 1205–1215,
www.hydrol-earth-syst-sci.net/17/1205/2013/
S. Tamea et al.: Virtual water trade
1209
Table 2. Volumes of virtual water imported/exported by Italy in
1986 and 2010 from/to specific countries (in km3 yr−1 ) and (in
italic) positions of each country in the ranking for the major volumes exchanged with Italy in the two years.
IMPORT
1986
Australia
Brazil
China
Egypt
France
Germany
India
Indonesia
Japan
USA
0.47
2.37
0.47
0.24
8.94
3.70
0.26
0.97
0.003
4.89
#25
#5
#26
#33
#1
#4
#32
#15
#103
#2
IMPORT
2010
0.59
4.37
0.21
0.10
10.82
9.02
1.18
4.14
0.002
1.98
#31
#4
#49
#68
#1
#3
#21
#6
#119
#12
EXPORT
1986
0.06
0.40
0.05
0.30
1.96
1.63
0.003
0.002
0.07
0.74
#31
#8
#32
#10
#1
#2
#85
#96
#30
#4
EXPORT
2010
0.48
0.13
0.80
0.08
5.23
5.44
0.10
0.03
0.45
2.19
#17
#39
#13
#54
#2
#1
#48
#73
#20
#3
3
< −0.1 km
3
−0.1 to 0 km
3
0 to 0.1 km
0.1 to 1 km3
> 1 km3
The total Italian export in 2010 is 36.8 km3 of virtual water and more than 70 % of this flux is directed to European
Fig. 3. Net virtual water fluxes (import minus export) from Eurocountries. The total number of receiving countries is 189 in
pean countries to Italy in 2010.
2010, with an increase with respect to 1986 of 21 links. The
time evolution of the export volumes has been even stronger
than for the import: the overall flux in the delta was 12.0
production inside Italy are computed for the 1986–2010 pekm3 in 1986, which is one third
of 3.
theZoom
flux in
Thefor the
riod
(Fig.
Fig.
on2010.
Europe
net
flux4).of virtual water (import minus export) of Italy in 2010
change in the different world regions has not been homoThe volumes exchanged with foreign countries have ingeneous: Asia, Oceania and North America have tripled (or
creased regularly with time in the last few decades: the inmore) their import from Italy, while Africa and South Amercrease in export has been continuous and smooth in time,
ica slightly decreased it. Exports to other European countries
while import had some fluctuations in the most recent years.
(Table 1) overall increased from 6.7 to 26.5 km3 . Such a difProduction, on the contrary,14
remained constant until the last
ference highlights the effects of the European Union’s interdecade, when it began a weak but clear decrease. In the time
nal market, which was enlarged and strengthened over the
span considered, Italy has sensibly increased its dependence
course of the study period. Since Europe represents the preon the international market: if in 1986 the contribution of inferred source and destination for the Italian virtual water, we
ternal production to the virtual water balance was larger than
reported in Fig. 3 a representation of the net fluxes (import
import, in 2010 the situation is reversed, with down-crossing
minus export) from European countries in 2010.
occurring after year 2000. Given the relationship among the
It is clear from Fig. 3 that Italy tends to import virtual wawater balance components (in the absence of storage),
ter from Mediterranean countries and from countries in cenImport + Production = Export + Consumption ,
(1)
tral and eastern Europe, while the net flux is reversed (i.e., the
export dominates) for northern European and Balkan counthe domestic consumption results in a weakly increasing
tries. Germany and France are Italy’s preferred export trade
trend between 110 and 120 km3 yr−1 (not shown). Such volpartners, with Germany taking the leading role in more reumes are much greater than volumes used for internal procent years (Table 2), although the net flux of virtual water is
duction, confirming the strong dependence of the country on
still directed toward Italy (import greater than export).
international virtual water import. Clearly not all consumpVirtual rivers and deltas are depicted in the Supplement
tion comes from import (and not all production goes into exSect. B for the ten selected countries, showing how they
port), because Italian processing industries are often based on
change when looking at the overall network trade from the
import–export, importing raw materials and exporting propoint of view of different countries and how the relative
cessed products.
importance of different branches (e.g. continent-aggregated
Virtual water used for internal production (mainly crop
fluxes) are modified by the country-specific major fluxes.
growth) remained approximately constant in time even
3.2
Virtual water balance
The time evolution of the virtual water network trade is
now analyzed in a more extended and detailed way. Annual
volumes of virtual water imported, exported and used for
www.hydrol-earth-syst-sci.net/17/1205/2013/
though harvested area in Italy reduced of more than 20 %
(from 127 to 97 thousands km2 ) in the period 1986–2010
(FAOSTAT data). This decrease was slightly compensated
by an increase in crop yield (agricultural production per unit
surface), still resulting in a strongly decreasing volume of
agricultural production. The negative trend of production is
Hydrol. Earth Syst. Sci., 17, 1205–1215, 2013
1210
S. Tamea et al.: Virtual water trade
100
4500
90
mean weighted distance [km]
80
volume [km3]
70
60
50
40
30
Import
Export
Production
Po river runoff
4000
3500
Import
Lin. fitting
Export
3000
2500
20
10
2000
1990
1995
2000
time [years]
2005
2010
1990
1995
2000
time [years]
2005
2010
Fig. 5. Variation in time of the mean distance travelled by virtual
Fig. 4. Variation in time of the virtual water volumes imported, exwater entering Italy (import) or flowing out of Italy (export).
ported and used for food production in Italy and comparison with
Fig.
5.
Variation
in
time
of the meanindistance
the
average
annual
flow
of
the
Po
river.
iation in time of the virtual water volumes imported, exported and used for food production
Italy travelled by virtual water entering Italy (import) or
rison with the average annual flow of the Po river.
of Italy (export).
mean weighted distance [km]
contrary, in emerging countries, such as Brazil, China, India
compensated by the large increase of some crops, such as
and Indonesia, the virtual water for national production is
maize and olives, whose associated virtual water contributes
(much) larger than the exchanged fluxes which, however, are
in keeping an almost constant virtual water use for internal
increasing at a high rate.
production.
To make the comparison of Italy with other countries more
Comparing the volumes of virtual water with the avergeneral, we consider the virtual
15water flows of all countries
age annual flow of the major Italian river, the Po river
in the world during 1986 and 2010. We sort countries by de(1540 m3 s−1 or 48.6 km3 yr−1 ), one can state that in 2010
creasing net import (import minus export) flux and find that
Italy employed for food production a volume of water which
Italy held the 3rd position in 1986 and the 5th position in
4500
is around
1.5 times the annual flow in the Po river, while
2010, confirming that Italy is among the largest importers of
the Italian import of virtual water was almost twice the Po
virtual water in the world. If the sorting is repeated accordriver’s annual flow. To better comprehend this comparison,
ing to the net per-capita import, one finds that Italy ranks
4000
consider that the catchment of the Po river at the mouth covonly between 48th and 49th, because in this case the smallest
ers almost one fourth of the whole surface of Italy, and that
countries tend to have higher net imports per capita. In fact,
48.6
km3 yr−1 of water corresponds to almost half of the toaccumulating the population living in the countries with per3500
tal runoff production in Italy, Import
which has been estimated to
capita net import higher than Italy (e.g., 48 countries in 1986
Lin.estimated
fitting
be 104 km3 yr−1 (this figure was
through a multiand 47 in 2010), this adds up to only 1 % to 3 % of the global
Export
ple3000
regression analysis on 300 catchments,
including rainfall
population, demonstrating that the vast majority of the world
and Budyko index as explanatory variables). Also note that,
population has a per-capita net import of virtual water lower
of course, not all water flowing in a river can be withdrawn
than the average Italian. A similar analysis can be carried out
2500
for human use: the Po catchment, which is already intensely
by considering the virtual water per capita production: in this
exploited in terms of water resources, has a 22 km3 yr−1 of
case, Italy occupies the 113th position in 1986 and the 140th
water
withdrawn for agricultural, industrial, and domestic usin 2010, with respectively 34 % and 41 % of the global popu2000
1990
1995
2000
3 of water2010
age (Montanari,
2012). As
such,
the
∼ 90 km2005
imlation having a larger per-capita production than the average
time [years]
ported by Italy in 2010 is an impressive figure, demonstrating
Italian.
that the Italian water consumption is not sustainable with the
domestic resources only.
3.3 Distance-based analyses
iation in time of
thecountry
mean distance
travelled
virtual water
entering
Italy (import) or flowing out
The
overviews
in thebySupplement
Sect.
B show
In addition to the spatial distribution of virtual water flows
that the virtual water import of France is similar to that of
port).
exchanged by Italy, it is interesting to analyze the distances
Italy, while the export is greater and comparable to the import
of the origin/destination countries. We computed the geoacross the whole time span. Germany had similar values to
graphical distance between Italy and countries of origin and
Italy in 1986 but its virtual water import and export increased
destination by considering the distance among the most popat a faster pace in the last decades. Internal productions in the
ulated cities of each country (based on the CEPII dataset –
three countries are comparable, relatively constant, and all in
the same order of magnitude as the trading fluxes. On the
www.cepii.fr); each distance is weighted by the volumes of
15
Hydrol. Earth Syst. Sci., 17, 1205–1215, 2013
www.hydrol-earth-syst-sci.net/17/1205/2013/
Fig. 6. Variation in time of the mean distance travelled by a generic unit of virtual water exchanged wo
S. Tamea et al.: Virtual water trade
1211
global weighted distance [km]
6400
6200
6000
5800
5600
Positive trend
Negative trend
Non−significant trend
IMPORT TREND
5400
5200
1985
1990
1995
2000
time [y]
2005
2010
Fig. 6. Variation in time of the mean distance travelled by a generic
unit of virtual water exchanged worldwide.
riation in time of the mean distance travelled by a generic unit of virtual water exchanged worldwide.
virtual water respectively imported and exported, to obtain
Positive trend
a measure of the average distance travelled by a unit volNegative trend
EXPORT TREND
Non−significant trend
ume of virtual water exchanged by Italy with the rest of the
world. Figure 5 depicts the average weighted distances of oriFig. 7. Spatial representation of the trend signs for the mean disgin/destination countries across the years, from 1986 to 2010.
tance travelled by virtual water imported (above) and exported (beThe weights are calculated considering the strength
of each
Fig. 7. Spatial
representation
the country
trend signs
for the
distance
travelled by virtual water imported
low) byofeach
from/to
themean
rest of
the world.
flux, divided by the total volumes imported or
exported
by
and exported (below) by each country from/to the rest of the world.
Italy.
The average distance travelled by food and virtual water is
greater for import than for export (3700 km vs. 2600 km in
disgregation of former USSR) and partly by changes in the
2010) and, both import and export distances increase in time
international trade (see Tamea et al., 2012, – author’s com16
(both increases are significant at a 5 % level with the Stument – for further details). The general decrease of distances
in the international virtual water trade, being the result of
dent’s
t test). Considering that the number of links with other
Positive trend
Negativehad
trend only a small increase in time (see Sect. 3.1),
countries
strengthening of closer connections to the detriment of farIMPORT TREND
Non−significant trend
the explanation behind this behavior should be sought in a
ther connections, might be influenced by partitioned travdecrease of the flux exchanged with closer countries, and/or
els, where longer import and export distances are split into
in an increase of the exchanged volumes with more distant
shorter stages, where goods are accounted as both import and
countries. This second effect seems to be the dominant one:
export by the transit country. The reason why this fact should
not apply to import/export of Italy, among others, is not clear.
in fact, the exchanged volumes with closer countries (within
When the country-specific distance analysis is repeated for
1500 km of Italy) remain nearly constant in time, while fluxes
from farther countries (more than 10 000 km from Italy) douother countries, we find that increasing trends seldom ocbled their share of import (from 7 % of the total flux in 1986
cur in countries similar to Italy in size, population or gross
to 14 % in 2010), and tripled their share of export (from 1 %
domestic product. Plots of weighted distances over time, as
in Fig. 5, are presented in the Supplement Sect. B for the
to 3 % of the total flux). The Italian trade of food and related
selected countries. Most of them reveal negative trends for
products is thus showing a clear tendency toward globalizaPositive trend
trend
tion,Negative
with relevant
virtual water fluxes also to/from countries
both imports and exports (e.g., Egypt, France, Germany and
EXPORT TREND
Non−significant trend
very distant from Italy.
USA). In some cases, import and export trends are opposite
In order to place these trends in a global context, we cal(e.g. Australia) or are not statistically significant at a 5 %
culated the average weighted distance considering all links
level in a Student’s t test (e.g., import distances of Indonesia
of
the
food
trade
network
and
represented
the
results
in
or
trend
of Japan). Only China has both significantly
atial representation of the trend signs for the mean distance travelled by virtual waterexport
imported
(above)
Fig. 6. Globally, the average distance travelled by virtual waincreasing trends, the same as Italy.
ted (below) by
countryhas
from/to
the restinoftime,
the world.
ter each
worldwide
decreased
opposite to what hapExtending the trend analysis to all countries in the world,
pened to the virtual water exchanged by Italy. The decreasone can flag on a world map the countries having positive,
ing trend is statistically significant (at a 5 % level) and it can
negative and non-significant trends, and look for geographbe explained partly by political/administrative changes (e.g.,
ical patterns (significance is at a 5 % level). Figure 7 shows
16
www.hydrol-earth-syst-sci.net/17/1205/2013/
Hydrol. Earth Syst. Sci., 17, 1205–1215, 2013
Fig. 8. Contributions of each category to the total volume of virtual water imported (left) and exported (right)
in the1212
period 1986-2010.
S. Tamea et al.: Virtual water trade
1.4 5000
4000
1.4
import [%]
1
4000
0.8
0.6
3000
2000
0.4
0.4
Import
Lin. fitting
Export
2500
0.2
1.4
s
2000
1990
1990
5000
1995
2000
1995
time2000
[years]
time [years]
mean weighted distance [km]
2005
2005
1500
0.2
1000
0
2010
2010
1990
1990
4000
Plants
Animals
Luxury
Non−Edible
1.2 4500
1995
2000
1995 time [years]
2000
time [years]
2005
2005
2010
2010
Import
Lin. fitting
Export
3500
Fig. 9. Average
distance travelled by virtual water associated to different categories of goods (left panel: plant1 4000
Fig.
8. Contributions
of each category to the total volume of3000
virtual water imported (left) and exported (right)
based products,
right
panel:
animal-based
products).
0.8 1986-2010.
in the period
3500
2500
export [%]
dible
1
3000
0.8
2500
3500
0.6
0
Plants
Import
Animals
Lin. fitting
Luxury
Export
Non−Edible
1.2
3500
mean weighted distance [km]
mean weighted distance [km]
1.2 4500
export [%]
mean weighted distance [km]
Plants
Animals
Luxury
Non−Edible
0.6
3000
0.4
Import
Lin. fitting
Export
2500
0.2
2000
0
2010
1990
1990
1995
2000
time2000
[years]
1995
time [years]
2005
2005
2000
1500
1000
2010
2010
1990
1995
2000
time [years]
2005
2010
Fig. 9. Average distance travelled by virtual water associated to difFig. 8. Contributions of each category to the total volume of virtual
ferent categories of goods (upper panel: plant-based products, bot17
water imported (upper panel) and exported (bottom panel) in the
tom panel: animal-based products).
1986–2010.
Fig. period
9. Average
distance travelled by virtual water associated to different categories of goods (left panel:
otal volume of virtual water imported (left) and exported (right)
based products, right panel: animal-based products).
3.4
2500
Analyses by categories
Import
Lin. fitting
Export
In the2000
previous 1990
section, virtual
fluxes have
been studied
1995 water2000
2005
2010
timehave
[years]generated them. Howindependently of which goods
4000
ever, interesting aspects emerge if the type of good originatImport
ing the water flux is taken into account. To thisLin.
aim,
in this
fitting
hted distance [km]
3500
section we select four main categories of goods and investigate the corresponding virtual water fluxes for Italy; categories are: plants, animals, luxury, and non-edible items
4000 as in Carr et al., 2013). The main results of this anal(same
Importshows the
ysis are shown in Fig. 8 and Table 3. The former
Lin. fitting
3500
temporal
evolution of the contribution of each category
to the
Export
total italian import and export of virtual water during the period
1986–2010, while the table reports the fluxes based on
3000
the continent in which the trading partners are located.
Some
2500 general features are evident. Firstly, plants are the
main component of virtual water import throughout the study
17period. The relative importance of virtual water imports as2000
sociated with plant products increases in time from 37 % in
1986 to 50 % in 2010. In contrast, there has been a decrease
1500
in the percentage of virtual water import in animal products
(from 30 % in 1986 to 16 % in 2010), possibly reflecting
1000
commercial
and
changes 2000
resulting 2005
from health
1990 dietary
1995
2010and
time [years]
safety campaigns. Notice that
contraction in the percentage
is quite steady in time and is contributed also by a decrease
in the volume of animal-related virtual water import (and not
mean weighted distance [km]
mean weighted distance [km]
such analysis for import and export, highlighting the marked
presence of positive clusters around the Caribbean Islands,
West/Central Africa, East Asia and Oceania (for import), and
5000
Central/South
America (for export).
Selecting world countries with more than 1 million in4500 and per-capita gross domestic product higher than
habitants
10 000 USD (30 countries, considering average values in the
time4000
span), there are only 5 countries with positive import
trend (Australia, Hong Kong, Italy, Singapore, and Slovenia)
and only
3500 3 countries with a positive export trend (Israel, Italy,
and Puerto Rico). Italy is the only country with the above
characteristics
having significant trends in both import and
3000
export distances.
plant-
Export
Fig. 9. Hydrol.
Average
distance travelled by virtual water associated to different
categories of goods (left panel: plantwww.hydrol-earth-syst-sci.net/17/1205/2013/
3000 Earth Syst. Sci., 17, 1205–1215, 2013
based products, right panel: animal-based products).
2500
S. Tamea et al.: Virtual water trade
1213
Table 3. Volumes of virtual water imported/exported by Italy in 1986 and 2010 subdivided into categories of exchanged goods (in km3 yr−1 )
from/to different world regions. Percentages (in italic) are calculated with respect to the total import (and export) of each year; “<” indicates
volumes lower than 0.01 km3 .
IMPORT
PLANTS
ANIMALS
LUXURY
NON-EDIBLE
1986
2010
1986
2010
1986
2010
1986
2010
( % of total import)
18.3
37 %
43.6
50 %
15.0
30 %
13.9
16 %
10.7
21 %
23.3
26 %
6.2
12 %
7.1
8%
Europe
Asia
Africa
North America
South America
Oceania
8.2
1.8
0.6
4.9
2.7
0.05
17.3
7.6
4.9
3.3
10.3
0.2
14.3
0.09
<
0.17
0.4
0.07
13.1
<
<
0.06
0.7
0.08
4.4
0.6
3.8
0.6
1.2
<
14.6
2.2
3.0
0.9
2.5
<
1.3
1.9
1.4
0.9
0.2
0.5
2.8
1.8
2.0
0.3
0.14
0.12
TOTAL
EXPORT
PLANTS
ANIMALS
LUXURY
NON-EDIBLE
1986
2010
1986
2010
1986
2010
1986
2010
TOTAL
(% of total export)
6.8
57 %
12.4
36 %
1.5
12 %
4.1
12 %
3.2
27 %
16.5
48 %
0.4
4%
1.2
4%
Europe
Asia
Africa
North America
South America
Oceania
3.0
0.8
2.5
0.5
0.01
0.02
8.2
1.0
1.0
1.9
0.1
0.15
0.8
0.2
0.08
0.05
0.4
<
3.5
0.4
0.07
0.14
<
0.01
2.6
0.1
0.1
0.3
0.02
0.03
12.4
2.3
0.4
0.9
0.2
0.4
0.3
0.07
0.03
<
<
<
0.8
0.3
0.09
0.04
<
<
only in their relative importance with respect to the other
imports; see Table 3) in spite of the total water import having grown at great extent. In the last few years, the second
largest contribution to virtual water imports was associated
with luxury-related products (it was the third one in 1986),
which exhibited a significant increase from 21 % to 26 % of
total import.
When focusing on export, some structural differences with
respect to import become clear. Plants dominated virtual water exports at the beginning of the study period (57 %), but
underwent a remarkable reduction in the first decade (see
Fig. 8) reaching in 2010 the 36 % of virtual water export.
Luxury products have become prevalent (from 27 % in 1986
to 48 % in 2010) and the growing trend seems to continue,
even though at a weaker pace. The importance of this category testifies the existence of relevant processing food industries (e.g., wine, coffee, and confectionery industry) in
Italy. Notice that in terms of virtual water volumes, Italian
plant-related export was about 30 % of import, while this
percentage grows to 71 % for luxury. Animal products are
a minor component of virtual water exports from Italy when
compared to plant and luxury products; however, differently
from imports, no trends exist and the corresponding water export remains nearly constant around 12 %. Since Italian total
virtual water export has grown in time (see Fig. 4), this entails that the virtual water component linked to animal export
trade has grown proportionally (see Table 3).
www.hydrol-earth-syst-sci.net/17/1205/2013/
Table 3 reports other interesting facts. For example, practically all animal-related virtual water is imported from Europe. The reduction of virtual water import from North
America in the period 1986–2010 is due mainly to plants and
(to a lesser extent) to non-edible items. The import of nonedible items increases from Europe, while the contribution
from extra-European countries has decreased.
As for the virtual water export, the trade toward Europe
has grown quite homogeneously in all categories, with luxury items and plants being the most important in terms of
volume. Luxury products are the most relevant contributors
to virtual water export to Europe, Asia, South America and
Oceania, with a strong increase in the period 1986–2010.
A similar analysis was repeated for the selected countries
in the Supplement Sect. B. In general it can be observed that
the increase of the luxury quota shown in Fig. 8 represents a
typical characteristic of the Italian case. Among the examples
shown, in fact, a similar behavior is observed only for France,
while the importance of the luxury quota is minor in the other
cases. A high variability emerges in the time evolution of the
animal and plant quotas, where countries like Australia and
Brazil appear to be great exporters of both categories.
Finally, Fig. 9 shows the time behavior of the mean
weighted distance for some categories. Plant-related trade
displays the same trends and similar values as those discussed in the context of total virtual water trade (see Fig. 5).
Differently, the typical distances of the animal-related virtual
Hydrol. Earth Syst. Sci., 17, 1205–1215, 2013
1214
water trade are much lower: about 1/3 and 2/3 of the corresponding distances of plants items for import and export
respectively, suggesting that a large share of Italian importation of animals originates in European countries. Also, the
trend for export is decreasing (significantly at the 5 % level),
as opposed to the overall increasing trend (Fig. 5); clearly,
associated volumes are not large enough to invert the overall
trend.
Luxury-related and non-edible-related export distances
(not shown) increase similarly to the case of plant products.
In contrast, the corresponding import distances exhibit strong
decreasing trends. This is coherent with data reported in Table 3 that show the increment of import from Europe.
4
Conclusions
The water footprint concept is quickly becoming a key tool
to evaluate the impact of human activities on water resources
and to highlight the huge amount of water virtually embedded in the global trade of goods. We have studied the virtual
water trade by focusing on the interactions of a single country, Italy, with the global virtual water network and considered the temporal evolution in the period 1986–2010.
Coherently with the general behavior of the network, Italian import and export of virtual water have grown markedly
(82 % and 208 %, respectively). During the period analyzed,
Italy remained among the largest importers of virtual water
in the world with only 1–3 % of the world population exhibiting per-capita net import higher than Italy. According to the
country virtual water budget, the dependence on import has
increased over the last decades and has overcome the internal production since year 2000. Italian import and export –
here visualized like a river (or a delta) that feeds (drains) virtual water to (from) Italy – are well developed and connect
almost all world countries; fluxes on these networks are not
static and important changes in time occur.
Italy has been shown to import virtual water from very
distant countries with the mean distance travelled by virtual water being about 3800 km for imported and 2500 km
for exported products; this mean distance has grown significantly in the last decades. Notably, in spite of trade globalization, the majority of countries show negative or no trend. If
one subdivides the virtual water fluxes in categories (plants,
animals, luxury and non-edible), a remarkable temporal decrease of animal-related virtual water import is found. In contrast, plant-related virtual water export has decreased in time,
while a clear positive trend occurs for luxury goods.
Our analysis has demonstrated that the approach of integrating the local (country) perspective to the global perspective can shed new light on the virtual water trade. For this
reason, the systematic use of this approach appears promising to help disentangle the complex geography and dynamics
of the virtual water network. Finally, the distance-based analysis sets the basis for new insights on the characteristics of
Hydrol. Earth Syst. Sci., 17, 1205–1215, 2013
S. Tamea et al.: Virtual water trade
virtual water trade and might open the possibility of linking
virtual water to the energy consumption required to transport
it, allowing for a more comprehensive analysis of the effects
of food trade on the environment.
Supplementary material related to this article is
available online at: http://www.hydrol-earth-syst-sci.net/
17/1205/2013/hess-17-1205-2013-supplement.pdf.
Acknowledgements. Authors gratefully acknowledge Paolo
D’Odorico for precious discussions on the topic and comments on
the paper.
Edited by: A. Montanari
References
Aldaya, M. M., Martinez-Santos, P., and Llamas, M. R.: Incorporating the water footprint and virtual water into policy: reflections
from the Mancha Occidental Region, Spain, Water Resour. Manage., 24, 941–958, 2010.
Allan, J. A.: Virtual water: A strategic resource global solutions to
regional deficits, Ground Water, 36, 545–546, 1998.
Barrat, A., Barthelemy, M., and Vespignani, A.: Dynamical processes on complex networks, Cambridge University Press, New
York (NY, USA), 2008.
Bulsink, F., Hoekstra, A. Y., and Booij, M. J.: The water footprint
of Indonesian provinces related to the consumption of crop products, Hydrol. Earth Syst. Sci., 14, 119–128, doi:10.5194/hess-14119-2010, 2010.
Carr, J. A., D’Odorico, P., Laio, F., and Ridolfi, L.: On the temporal
variability of the virtual water network, Geoph. Res. Letts., 39,
L06404, doi:10.1029/2012GL051247, 2012.
Carr, J. A., D’Odorico, P., Laio, F., and Ridolfi, L.: Recent history
and geography of virtual water trade, PLoS ONE, 8, e55825,
doi:10.1371/journal.pone.0055825, 2013.
Dalin, C., Konar, M., Hanasaki, N., Rinaldo, A., and RodiguezIturbe, I.: Evolution of the globale virtual water trade
network, P. Natl. Acad. Sci. USA, 109, 5989–5994,
doi:10.1073/pnas.1203176109, 2012.
D’Odorico, P., Carr, J., Laio, F., and Ridolfi, L.: Spatial organization and drivers of the virtual water trade: a community-structure
analysis, Environ. Res. Lett., 7, 034007, doi:10.1088/17489326/7/3/034007, 2012.
Feng, K., Hubacek, K., Minx, J., Siu, Y. L., Chapagain, A., Yu, Y.,
Guan, D., and Barrett, J.: Spatially explicit analysis of water footprints in the UK, Water, 3, 47–63, doi:10.3390/w3010047, 2011.
Hoekstra, A. Y. and Chapagain, A. K.: Globalization of water: sharing the planet’s freshwater resources, Blackwell, Oxford (UK),
2008.
Hoekstra, A. Y. and Mekonnen, M. M.: The water footprint
of humanity, P. Natl. Acad. Sci. USA, 109, 3232–3237,
doi:10.1073/pnas.1109936109, 2012.
Hoekstra, A. Y., Chapagain, A. K., Aldaya, M. M., and Mekonnen, M. M.: The water footprint assessment manual: setting
www.hydrol-earth-syst-sci.net/17/1205/2013/
S. Tamea et al.: Virtual water trade
the global standard, Earthscan, London (UK), available at: http:
//doc.utwente.nl/78458/ (last access: 14 January 2013), 2011.
Mekonnen, M. M. and Hoekstra, A. Y.: The green, blue and
grey water footprint of crops and derived crop products, Hydrol. Earth Syst. Sci., 15, 1577–1600, doi:10.5194/hess-15-15772011, 2011.
Montanari, A.: Hydrology of the Po River: looking for changing
patterns in river discharge, Hydrol. Earth Syst. Sci., 16, 3739–
3747, doi:10.5194/hess-16-3739-2012, 2012.
Shutters, S. T. and Muneepeerakul, R.: Agricultural trade networks
and patterns of economic development, PLoS ONE, 7, e39756,
doi:10.1371/journal.pone.0039756, 2012.
www.hydrol-earth-syst-sci.net/17/1205/2013/
1215
Suweis, S., Konar, M., Dalin, C., Hanasaki, N., Rinaldo, A., and
Rodiguez-Iturbe, I.: Structure and controls of the global virtual water trade network, Geophys. Res. Lett., 38, L10403,
doi:10.1029/2011GL046837, 2011.
Tamea, S., Allamano, P., Carr, J. A., Claps, P., Laio, F., and
Ridolfi, L.: Local and global perspectives on the virtual water trade, Hydrol. Earth Syst. Sci. Discuss., 9, 12959–12987,
doi:10.5194/hessd-9-12959-2012, 2012.
Hydrol. Earth Syst. Sci., 17, 1205–1215, 2013


© Copyright 2026