
IMPROVED RESOLUTION MAPS OF HYDROGEN AT THARSIS
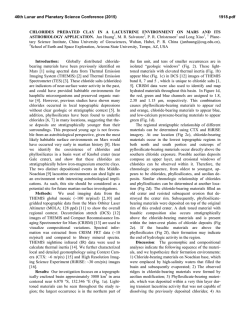
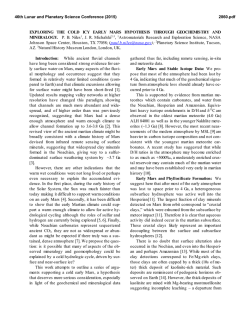
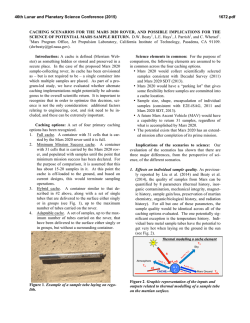
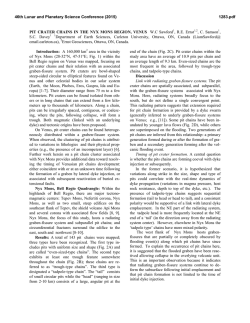
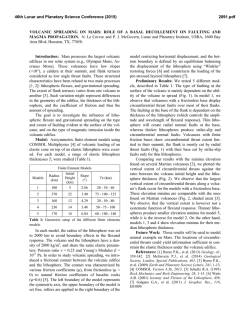
46th Lunar and Planetary Science Conference (2015)
2036.pdf
IMPROVED RESOLUTION MAPS OF HYDROGEN AT THARSIS. J. T. Wilson1, V. R. Eke1, R. J. Massey1,
R. C. Elphic2, W. C. Feldman3, S. Maurice4 and L. F. A. Teodoro5, 1Institute for Computational Cosmology, Durham
University, South Road, Durham. DH1 3LE, UK ([email protected]), 2Planetary Systems Branch, NASA
Ames Research Center, MS 245-3, Moffett Field, CA,94035-1000, USA, 3Planetary Science Institute, Tucson, AZ
85719, USA,4IRAP-OMP, Toulouse, France, 5BAER, NASA Ames Research Center, MS 245-3, Moffett Field, CA
94035, USA.
Introduction: Evidence for late Amazonian tropical mountain glaciers on the north-western flanks of
the Tharsis Montes and Olympus Mons has been detailed extensively using observations from the Mars
Express, Mars Global Surveyor and Mars Odyssey
orbiters [1,2,3]. The production of such glaciers is
impossible given the current climatic conditions at
equatorial Mars. Thus the existence of these glaciers is
interpreted to be the result of the migration of volatiles
(chiefly water) from the poles to the equator during
past periods of high orbital obliquity. Climate models
predict the accumulation of ice on the north-western
slopes of these mountains, during periods of high
obliquity, due to the adiabatic cooling of moist polar
air [4,5].
The extent to which these equatorial deposits remain and the form in which they are present is not yet
a settled question. Campbell et al. [6] see no evidence
for buried ice at Pavonis Mons using the Shallow
Radar (SHARAD) instrument onboard the Mars Reconnaissance Orbiter. However, morphological evidence is presented by Head et al. [7] in the form of
fresh Ring-mold craters at both Pavonis and Arsia
Mons, which is suggestive of the presence of buried
ice today or in the very recent past.
We have used the pixon image reconstruction
method on data from the Mars Odyssey Neutron Spectrometer (MONS) to produce a high resolution map of
the Water Equivalent Hydrogen (WEH) distribution
across the surface of Mars. Elphic et al. [8] showed,
also using MONS data, that despite the fact that the
present climate prevents the stable presence of subsurface ice within the range accessible to the neutron data
(~1m of the surface), elevated hydrogen contents are
seen on the slopes of the Tharsis Montes. However the
utility of this data set in constraining the distribution of
water on the scale of the tropical mountain glaciers has
been limited by its poor spatial resolution due to the
large footprint of the MONS (its point spread function
(PSF) has a full width at half maximum of ~550km).
Janssen’s method was used by [9] to perform image
reconstruction on the MONS data at Tharsis, however
it is known that this method amplifies noise and may
introduce spurious features [10]. Here we have used
the pixon image reconstruction technique to improve
the spatial resolution of this data set by suppressing
noise and removing the effect of blurring with the PSF.
At the poles this technique has been shown to give a
spatial resolution of between 45-100 km [11]. Our
reconstructed data set is available for the entire surface of Mars, however we will here focus on the Tharsis Montes and the implications of the WEH distribution for tropical glaciers present there.
Pixon Reconstruction: The pixon method is a
spatially adaptive image reconstruction process that
aims to produce the simplest image consistent with the
data [12,13]. Using this technique we have carried out
the first global Bayesian reconstruction of a remotely
sensed planetary data set, the result of which is shown
in Fig. 1.
The pixon method’s adaptive smoothing algorithm
works such that regions of the image with a higher
Fig. 1: Robinson projection showing a
pixon reconstruction
of the MONS prism-1
data. Underlayed is a
MOLA shaded relief
map. The black rectangle outlines the
region shown in Fig.
2.
46th Lunar and Planetary Science Conference (2015)
2036.pdf
500km
Fig. 2: Left: Gridded MONS prism-1 data at Tharsis. Right: Pixon reconstruction of the MONS prism-1 data
at Tharsis, showing the WEH conversion of [15]. Underlayed is a MOLA shaded relief map. The white contours show fan shaped deposits on the slopes of the Tharis Montes (and are based on those in [16]).
signal to noise ratio are given the freedom to vary on
small scales and those with low signal to noise ratio
vary only on larger scales. This is done to create an
image that has a spatially constant information content,
which has the effect of precisely maximizing the entropy of the reconstructed image.
We use the prism-1 data (a measure of epithermal
neutrons) from the MONS instrument of the three martian years from 2001, which has been corrected for
altitude and look direction of the spacecraft and variation in environmental conditions [14].
The conversion from epithermal neutron count rate
to WEH is done using the relation in Feldman et al.
(2004) [15].
Results: The Tharsis region, shown with a black
rectangle in Fig. 1, is presented in more detail in Fig. 2.
In the reconstruction in the right panel of Fig. 2 the
line of the Tharsis Montes is seen to separate regions
of higher and lower WEH abundances, where the
north-west side of the line is enhanced in hydrogen
with abundances >7 wt% WEH on the north-west
flanks of the Tharsis Montes. This hydrogen concentration is greater than that in the raw data (Fig. 2 left
panel) and than in [9]. The area with the highest WEH
concentration is north-west of Olympus Mons and coincides with the Lycus Sulci region where the WEH
content reaches 11 wt%.
Implications of the observed hydration: That we
see a peak in the count rate in the reconstruction so
closely coincident with the position of Olympus Mons
in MOLA topography (Fig. 2) strengthens our faith in
the other features shown in the reconstruction.
The region of enhanced hydrogen content around
Ascraeus Mons is larger than the glacial deposit identi-
fied by [17]. This may be an interesting result, although establishing its significance will require determining the precise spatial resolution of the reconstruction at this location.
Conclusions: We have created a high resolution
map of the epithermal neutron count rate across the
entire surface of Mars. Using this map we see that the
WEH content on the western slopes of the Tharsis
Montes is enhanced to ~7 wt%, which is higher than
otherwise suggested. The enhancements are located on
the north-western flanks of the Montes approximately
coincident with the regions of past glaciation, predicted, by the climate models, to form during periods of
high orbital obliquity.
References: [1] Head J. W. and Marchant D. R.
(2003) Geology, 31, 641-644. [2] Sean D. E. et al.
(2005) JGR, 110, E5. [3] Sean D. E. et al. (2007) JGR,
112, E03004. [4] Forget F. et al. (2006) Science, 311,
368-371. [5] Madeleine J. -B. et al. (2009) Icarus, 203,
390-405. [6] Campbell B. A. et al. (2013) JGR, 118
436-450. [7] Head J. W. and Weiss D. K. (2014) Planet. & Space Sci., 103, 331-338. [8] Elphic, R. C. et al.
LPC XXXV, Abstract #2011. [9] Elphic R. C. et al. LPC
XXXVI, Abstract #1805. [10] Prettyman T. H. et al.,
JGR, 114, E08005 . [11] Teodoro L. F. A. et al. LPC
XLIV, Abstract #2623. [12] Pina R. K. and Puetta R. C.
(1993) PASP, 104, 1096-1103. [13] Eke V. R. (2001)
Mon. Not. R. Astron. Soc., 324, 108-118. [14] Maurice,
S. et al. (2011) JGR, 116, E11008. [15] Feldman W. C.
et al (2004) JGR, 109, E09006. [16] Fastook J. L. et al.
Icarus, 198, 305-317. [17] Parsons R. L. and Head J.
W. LPC XXXV, Abstract #1776.


© Copyright 2026