
Correlative TEM and Atom-Probe Tomography of a Kamacite
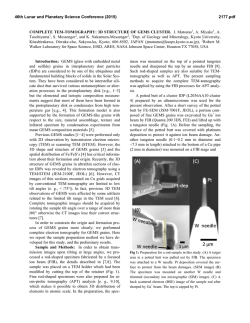
46th Lunar and Planetary Science Conference (2015) 2938.pdf CORRELATIVE TEM AND ATOM-PROBE TOMOGRAPHY OF A KAMACITE—TAENITE INTERFACE IN THE BRISTOL IRON METEORITE. S. S. Rout1,2, P. R. Heck1,2, D. Isheim4, T. Stephan2,3, A. M. Davis 2,3 and D. N. Seidman4. 1Robert A. Pritzker Center for Meteoritics and Polar Studies, The Field Museum of Natural History, 1400 S Lake Shore Drive, Chicago IL-60605, USA. 2Chicago Center for Cosmochemistry, 3 Department of Geophysical Sciences, The University of Chicago, 5734 S Ellis Avenue, Chicago IL-60637, USA. 4 Northwestern University Center for Atom-Probe Tomography, Department of Materials Science & Engineering, 2220 Campus Drive, Northwestern University, Evanston, IL-60208. E-Mail: [email protected]. Introduction: The correlated use of transmission electron microscopy (TEM) and atom-probe tomography (APT) provides information that is otherwise unobtainable. TEM delivers geometric and elemental information on a relatively large scale compared to APT, whereas APT provides a unique combination of atomic-level spatial resolution and single-atom analytical sensitivity [1,2]. While correlated TEM/APT studies are state of the art in material science [3], they have not yet been used for geochemical and cosmochemical applications. In our effort to demonstrate the utility of APT in cosmochemistry [4], we expand our range of projects from meteoritic nanodiamonds [5] and presolar silicon carbide [6,7] to other samples. Here, we present preliminary data from the first correlated TEM and APT study of an iron meteorite Iron meteorites crystallize with extremely slow cooling rates starting from 1300˚C, within the metallic cores of asteroids during which the characteristic Widmanstätten pattern forms by nucleation and growth of kamacite from taenite. The entire process of phase separation can be explained using the Fe-Ni-P phase diagram [8]. The phase transformation between 650 and 400˚C is relatively simple, but at temperatures ˂400˚C more complex phase transformations, possibly involving spinodal decomposition, ordering and/or martensitic transformation, may occur in the Ni gradient within the taenite phase near the kamacite-taenite (K-T) interface. The K-T interface consists of kamacite followed by ordered tetrataenite (FeNi), with Ni concentrations of >50 wt%, and a cloudy zone (CZ) consisting of low-Ni honeycomb region and high-Ni island regions. The microstructure of the kamacite-taenite (KT) interface has been studied in detail using TEM [8]. One of our motivations is to take advantage of the superior spatial resolution and sensitivity of APT to study the composition of the kamacite-tetrataenite-CZ region. Due to the limitations of the spatial resolution of TEMEDS, precise compositional measurement of the CZ and nanometer sized features within the tetrataenite is difficult. Due to ordering and precipitation at lower temperatures (< 320˚C) bcc precipitates can form within the tetrataenite region, and they are too small to be precisely measured by TEM-EDS [9]. Another motivation is to analyze these precipitates within the ordered tetrataenite using APT. APT can also be used to measure the isotopic fractionation of Fe and Ni during the diffusive transport process on the nanoscale. It has been shown that diffusion can fractionate the Fe and Ni isotopes [10]. Samples & Methods: We prepared a polished thick section from a Field Museum specimen of Bristol (ME 2248). Bristol is a low-P low-Ni (7.9–8.0 wt%) IVA iron meteorite that cooled at a relatively fast rate (250 K/Ma) and experienced comparably low shock pressures (˂ 13 GPa). We used the Field Museum’s Zeiss EVO 60 SEM equipped with an Oxford AZtec SDD EDS system to image the polished section. A Zeiss 1540 XB FIB-SEM at the Electron Microscopy Center (EMC) of Argonne National Laboratory (ANL) was utilized to prepare sharp nanotips for APT from a 35 µm lamella perpendicular to the kamacite/taenite interface. The nanotips were attached to a copper halfgrid with five presharpened posts. The grid was attached to a tomographic tip, fitting a tomographic TEM holder (Hummingbird Scientific). A great advantage is that the same holder can be introduced into the APT without removing the TEM grid, which minimizes the risk of sample damage or loss during handling. TEM analysis was performed using a FEI Tecnai F20ST TEM at ANL, prior to APT. APT was performed using a Cameca LEAP 4000XSi at the Northwestern University Center for Atom-Probe Tomography (NUCAPT). APT is based on the coupling of a field-ion microscope with a time-of-flight mass spectrometer [1,2]. The sharpened sample (tip radius <50 nm) is exposed to a pulsed UV laser and the atoms are field-evaporated and detected by a position sensitive detector. This enables 3-D tomographic reconstructions of the sample on an atom-by-atom basis. Results: The STEM image displays the presence of a clear interface, which was identified as the kamacite/taenite interface with EDS (Fig. 1 top). EDS measurements were performed ~500 nm below the apex, where we could detect the Ni/Fe ratio increase from ~0.6 to ~6.5, from the low Ni-kamacite region. In the APT analysis we collected 1.22107 atoms. The 3-D tomographic reconstruction (Fig. 1) shows isoconcentration surfaces for C, Fe, Ni, and Co; 3-D surfaces delineating regions with a concentration great- 46th Lunar and Planetary Science Conference (2015) er than a given threshold value for each element. The reconstruction shows clearly that Ni-rich (green) and Fe-rich (purple) isoconcentration surface regions are separated by an interface, which represents the kamacite/taenite interface that can also be seen in the TEM image (Fig. 1). It is noted that the taenite represented by the Ni-rich green isoconcentration surface has a greater Fe than Ni concentrations as in this first sample the APT analysis did not arrive at the Ni-rich zone and included only the top ~200 nm of the sample (Fig. 1). Cobalt (blue) is only seen in higher concentrations (> 0.5 atom/nm3) within the top kamacite region. Oxygen atoms, not displayed, were detected at the top of the analyzed volume and in the interface. In a profile from kamacite to taenite (Fig. 2) the Fe concentration decreases from ~87 to 68 wt%, and the Ni concentration increases from 13 to 32 wt%. Isotopic compositions of Fe and Ni were calculated only from doubly charged isotopes of Fe and Ni to avoid significant interference from hydrides [5] and were corrected for dead time effects [11]. All the isotope ratios are close to normal Solar System CI ratios. Especially for 61Ni++ peak, which was difficult to separate from a huge 60Ni++ peak tail, the apparent deviation from normal is certainly not real. Isotope ratio Measured CI values 56 Fe++/54Fe++ 15.68 ± 0.18 15.698 57 Fe++/54Fe++ 0.37 ± 0.06 0.3625 60 Ni++/58Ni++ 0.373 ± 0.016 0.3852 61 ++ 58 ++ Ni / Ni 0.012 ± 0.002 0.0167 62 Ni++/58Ni++ 0.052 ± 0.003 0.0534 64 Ni++/58Ni++ 0.013 ± 0.0009 0.0136 Table 1: Dead time corrected Fe and Ni isotope ratios from entire database. Errors are 1. Discussion & Conclusion: Our atom-probe tomographic reconstruction of the kamacite/taenite interface exhibits clearly the expected trend of a gradual Niconcentration increase from kamacite towards taenite, which is seen for the first time at this high spatial resolution. We did not observe the high-Ni tetrataenite found adjacent to kamacite in iron meteorites via TEM [8]. We identified, however, the high Ni-content phase using TEM-EDS in a volume not sampled by APT. Our APT reconstruction contains kamacite and most probably the first 50 nm region of the kamacite/taenite interface where no tetrataenite forms. Preliminary data from this correlated TEM/APT study of an iron meteorite demonstrates the potential for cosmochemically meaningful data resulting from a combination of these two powerful techniques. More details will be presented at the conference. References: [1] Seidman D. N. and Stiller K. (2009) MRS Bulletin 34, 717-724. [2] Kelly T. F. and 2938.pdf Larson D. J. (2012) Ann. Rev. Mater. Sci. 42, 1-31. [3] Moutanabbir O. et al. (2013) Nature 496, 78–82. [4] Heck et al. (2014) LPS, 45, #1811. [5] Heck P. R. (2014) Meteorit. & Planet. Sci. 49, 453–467. [6] Heck et al. (2010) LPS, 41, #2112. [7] Stadermann et al. (2010) LPS, 41, #2134. [8] Goldstein J. I. et al. (2009) Chemie der Erde, 69, 293–325. [9] Yang C. W. et al. (1997) Geochem. et Cosmochem. Acta 61, 2943–2956. [10] Dauphas N. (2007) Meteorit. & Planet. Sci. 42, 1597–1613. [11] Stephan, T. et al. (2015) Int. J. Mass Spectrom., in press. Fig. 1: Top: STEM-HAADF image of the nanotip prepared from the kamacite/taenite interface. Kamacite (Kam) and Taenite (Tae) are marked with arrows. The kamacite-taenite interface is clearly seen as a line in the STEM image and the region of APT reconstruction is shown with dashed lines. Bottom: Atom-probe tomographic reconstruction with isoconcentration surfaces of Fe (purple), Co (blue), Ni (green) and carbon (grey). The white line marks the location of the concentration profile, Fig. 2. Fig. 2: Concentration profile from APT data with Fe and Ni values normalized. Neither Co nor minor elements were detected in this region.


© Copyright 2026