
Nanodiamond Analysis Methods Compared for Consistency. J. B.
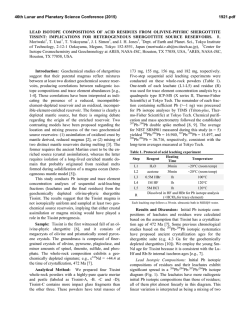
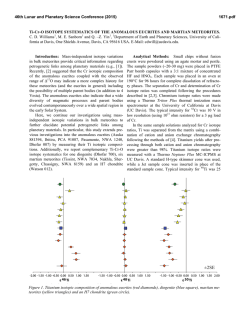
46th Lunar and Planetary Science Conference (2015)
1480.pdf
Nanodiamond Analysis Methods Compared for Consistency. J. B. Lewis1,2, D. Isheim4, C. Floss1,2, T. L. Daulton2,3, D. N. Seidman4, 1Laboratory for Space Sciences, 2Physics Dept., Washington University, 3Institute of Materials Science and Engineering, St. Louis, MO. Email: [email protected]. 4Center for Atom-Probe Tomography,
Dept. of Materials Science and Engineering, Northwestern University, Evanston, IL.
Introduction: The origins of meteoritic nanodiamonds (NDs) remain an enigma. Isotopic anomalies in
trace elements, such as Xe [1], Te [2], Pa [3], and Ba
[4] suggest a Type II supernova origin for at least a
subpopulation of the NDs. While the bulk measured C
[5] and N [6] are consistent with formation in the Solar
System, bulk measurements are not diagnostic. Poorlycrystalline to amorphous carbonaceous phases, which
can comprise a significant fraction of the residue [7],
are potentially of different origin than the nanodiamonds and hence can have different C isotopic compositions. To resolve this conundrum efforts are ongoing
to measure the 12C/13C ratio of individual ND grains
using atom-probe tomography (APT) [8]. APT
achieves high accuracy for measurements of elemental
concentration in many materials, but some “high field”
materials, including C, are known to yield biased isotopic ratios prior to correction [8, 9]. In the absence of
any standardized peak fitting technique it is necessary
to ensure that results obtained by different investigators
are reproducible. We compare two analysis procedures,
one from [9], and one introduced herein and used to
analyze nine new detonation nanodiamond standards
(DND) and three meteoritic nanodiamond residue samples from the Allende DM separate (ADM).
Experimental: A full description of specimen
preparation is given in [8, 10]. After focused ion-beam
microscope liftout, APT of nanodiamonds embedded
between sputter-deposited Pt layers was performed
with a Cameca LEAP 4000X Si [8, 10], yielding 3D
positions and time-of-flight data for ~57% of the atoms
(i.e., collection yield) in needle-shaped sample
nanotips of radius 20–100 nm. High ultraviolet laser
pulse energies (i.e., a large fraction of the energy required to remove ions from the sample surface is provided by laser pulsing rather than a standing dc voltage) must be used to reduce the probability of nanotip
fracture, but these lead to more delayed evaporation
events, which manifest themselves as peak-tails. Since
isotopes of the same element generally have similar
mass-to-charge-state (m/n) ratios, they are particularly
susceptible to tail interferences. Peak shape is determined by the base temperature, length of the laserinduced thermal pulse, nanotip shape, and material
properties. As a result, no standardized peak-fitting
method exists for APT. In [9] the width of the region of
interest for each peak to be integrated, or “range”, is
defined to begin and end when the peak crosses 2× the
background, using a 0.01 amu bin size. For this analy-
sis method, the local noise/bin is then calculated and
subtracted based on ranges on either side of each peak.
For the new data we employ a different procedure: We
first subtract the background as calculated by a linear
fit to the baseline of the time-of-flight spectrum, and
define the range as the FWHM with a bin size calibrated such that the range is covered by five bins. For minor isotopes we use the same range width as was used
for the major isotope, rather than FWHM; e.g., 13C+ is
fit with the same range width as 12C+. This is because
for same-element, same-charge-state ions none of the
factors affecting peak shape should vary, and the shift
in time-of-flight/amu over 1 amu is negligibly small
compared to bin size. Therefore, ranges are better defined by the largest peaks. Finally, for 13C (+ & 2+) the
contribution from the tails of 12C (+ & 2+) is estimated
and subtracted. This procedure is largely based on
[11]. For both methods, iterative proportional fitting of
detected multiple isotope pairs is used to generate a
correction for signal loss due to detector deadtime [9].
Results: Mean standard ratios are plotted for old
(DND1) and new (DND2) data in Fig. 1 (a), along with
standard error of the mean (SEOM) and standard deviation. These data sets are combined and compared to
Allende data, Fig. 1 (b). The SEOM is representative
of the uncertainty in the determination of the mean
value, while the standard deviation represents the scatter of the data. DND2 reproduces the significant instrumental artifact leading to an underestimation of
12 13
C/ C ratios [8, 9]. In DND2, which was analyzed
using the new procedure, the mean ratio is closer to the
expected value, but the ratios measured for different
charge states are further from agreement. In both cases
the difference is only marginally significant. The scatter for the DND2 charge state + ratios is significantly
smaller than for DND1.
Isotopic Ratios. The mean Allende ratio (for
nanodiamonds and poorly-crystalline to amorphous C
residuals) is, within uncertainties, the same as that of
the mean standard ratio. The scatter in the charge state
2+ ratio is greater than for the standards, while the
scatter in the + ratio is actually less, whereas we would
expect a greater deviation for the ADMs if isotopically
anomalous grains were present. We conclude that little
if any of the carbonaceous material we have analyzed
from the Allende residue is presolar. Given our current
sample size, the presence of non-diamond carbonaceous material, and remaining instrumental artifacts;
this conclusion should not be applied too broadly. The
46th Lunar and Planetary Science Conference (2015)
1480.pdf
Fig. 1 (a) Mean C isotopic ratios for two sets of terrestrial nanodiamond standard data, analyzed using two different
procedures. Small ovals represent ±2× the standard error of the mean. Large ovals represent ±2× the standard deviation of a datum from the mean. The diagonal line is the line of equal ratio for isotopes at the two different charge
states. The horizontal and vertical lines are the expected, solar system isotopic 12C/13C ratio, 89.9. (b) Mean C isotopic ratios for combined terrestrial standard and combined Allende DM nanodiamond data.
mean ratio of 12C/13C in charge state + is significantly
greater than in charge state 2+. There is no reason to
believe the different charge states of C would have
different isotopic ratios, therefore we take this difference to be the result of an experimental artifact that
increases the measured 12C+ and/or 13C++ as well as
possibly decreasing the measured 12C++ and/or 13C+.
Undercorrection of 12C+ or overcorrection of 12C++ for
deadtime effects could explain the discrepancy, as
could 12C2++ interference at 12 amu. (12CH)+ hydride
interference would give the opposite effect.
Deadtime Corrections. On average the correction
to the 12C++ peak is several orders of magnitude greater
than to the 12C+ peak. This feature is in agreement with
the corrections made by [12] using a different method.
It is well-known that smaller laser pulse energies in
APT lead to preferential formation of higher chargestate ions; we therefore surmise that the detection multiplicity also increases with a smaller pulse fraction.
Na and other dissolution residuals. We detected Na
and NaO in small clusters inside of large, low-density,
dirty C clusters. Trace amounts of Cl, Cr, and F were
also detected. Presumably these are residues from the
dissolution and separation process. We have begun to
reanalyze data from [9] and find evidence of Na and
other dissolution residuals in some but not all data sets.
This is consistent with observations of individual and
clustered contaminant atoms within the poorlycrystalline to amorphous-C residue [7].
Outlook: In future work we will extend the comparison of procedures by applying the new technique to the
data from [9] and the old technique to the data original
to this research. We intend to survey available APT
nanodiamond data to further investigate the possible
connection between pulse energy and detection multiplicity as calculated by deadtime correction algorithms,
to assess the effect of 12C2++ and (12CH)+ on C-ratio
measurements, and to determine if the concentration or
distribution of Na, Cr, Cl, or F vary depending on the
type of C-clusters in which they are contained. Correlated transmission electron microscopy and APT of
nanotips will allow us to compare the crystal structure
of the C residue with the reconstructed m/n data, and
allow us to distinguish between nanodiamond and
amorphous C phases
References: [1] Lewis R. S. et al. (1987) Nature 326,
160–162. [2] Richter S. et al. (1998) Nature 391, 261–
263. [3] Maas R. et al. (2001) Meteorit. Planet. Sci. 36,
849–858. [4] Lewis R. S. et al. (1991) LPS XXII, 807–
808. [5] Russell S. R. et al (1996) Meteorit. Planet.
Sci. 31, 343–355. [6] Marty B. et al. (2011), Science
332, 1533–1536. [7] Stroud R. M. et al. (2011) ApJL,
738, L27–L31. [8] Heck P. R. et al. (2014) Meteorit.
Planet. Sci. 49 (3) 453–467. [9] Lewis J. B. et al.
(2015, submitted) Ultramicroscopy. [10] Isheim D. et
al. (2013) Microsc. Microanal., 19 (Suppl 2), CD974–
CD975. [11] Hudson D. et al. (2011) Ultramicroscopy,
111, 480–486. [12] Stephan T. et al. (2015, in press)
Int. J Mass Spectrom.
This work is supported by NASA grants
NNX14AP15H (J.B.L.) and NNX13AF53G (C.F.).

© Copyright 2026