
COMET 67P/CG AS SEEN BY VIRTIS
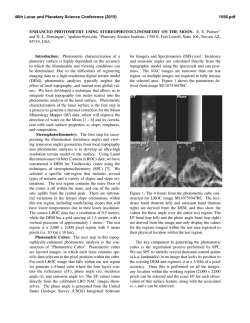
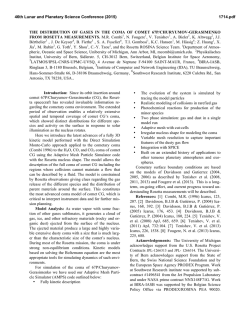
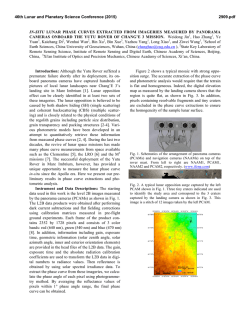
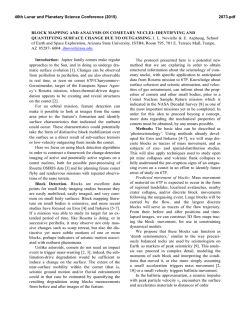
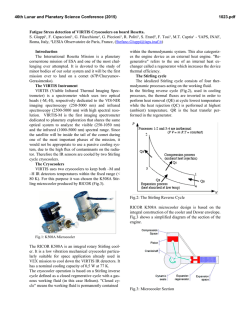
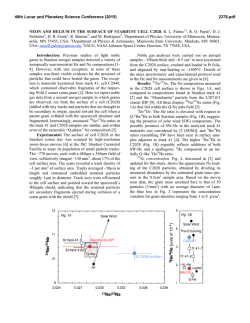
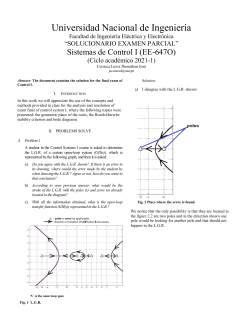
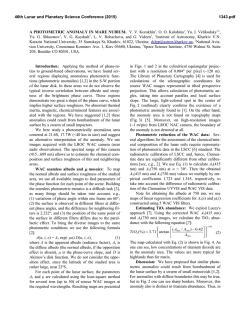
46th Lunar and Planetary Science Conference (2015)
2114.pdf
COMET 67P/CG AS SEEN BY VIRTIS-M ONBOARD ROSETTA: PHOTOMETRIC CORRECTION.
M. Ciarniello1 ([email protected]), F. Capaccioni1, G. Filacchione1, S. Erard2, C. Leyrat2, D. BockeléeMorvan2, A. Raponi1, M. C. De Sanctis1, F. Tosi1, M. T. Capria1, G. Piccioni1 , E. Palomba1, A. Longobardo1, P.
Drossart2, E. Quirico3, P. Beck3, B. Schmitt3 and the Rosetta-VIRTIS team. 1IAPS-INAF, Via del Fosso del Cavaliere 100, I-00133 Rome, Italy, [email protected]. 2LESIA, Observatoire de Paris/CNRS/UPMC/Université
Paris-Diderot, Meudon, France. 3Laboratoire de Planétologie de Grenoble (LPG) - University Joseph Fourier Grenoble, Grenboble, France.
Introduction: VIRTIS is the Visible Infrared
Thermal Imaging Spectrometer onboard the Rosetta
orbiter, which is following comet 67P/ChuryumovGerasimenko on its way to the Sun [1]. The instrument
is composed of two optical subsystems: the mapper
(VIRTIS-M) with imaging capabilities (0.25-5.1 µm)
and the high-resolution channel (VIRTIS-H), which is
a punctual spectrometer (2.0-5.0 µm). Both the instruments have extensively observed the comet and
VIRTIS-M mapped a large part of the surface. A huge
amount of spectra of the nucleus has been acquired
under different illumination and observation geometries. This induces photometric effects on the measured output that need to be estimated and minimized in
order to decipher the intrinsic spectral variability of the
surface. To achieve this goal, we calculated a photometric correction using data acquired by VIRTIS-M
starting from August 2014, when the nucleus was
largely resolved.
Photometric model: The dataset has been compared to a reflectance model which links the photometric output to the surface albedo and geometry. Since
the comet surface is extremely dark and the range of
phase angles we investigated is limited (30°-55°) we
adopted a semplified Hapke model equation, avoiding
multiple scattering and the opposition effect [2]:
I /F(i,e,g) =
w µ0
p(g)
4 µ + µ0
µ0 = cos(i)
µ = cos(e)
(1)
where I/F is the mesured signal, i, e and g are the
incidence, emission and phase angles respectively, w is
the
! surface single scattering albedo (SSA) and p(g) is
the single particle phase function (SPPF). The SPPF
has been modeled following [3]:
p(g) =
1 " b2
(1+ 2bcos(g) + b 2 ) 3 / 2
(2)
and b represent the asymmetry parameter.
Method: In Fig. 1a we report the I/F value at 550
! for all the investigated pixels as a function of the
nm
phase angle. The spread of the points at each phase
angle value is due to varying incidence and emission
angles, as well as to unresolved shadowing and instrumental noise. If the points are corrected geometrically
for the term 4(µ0+µ)/ µ0, we obtain the distribution of
Fig.1b which represents the product wp(g). The points
(a)
(b)
(c)
Fig.1. a) I/F at 550 nm as a function of phase angle. b) wp(g) at 550 nm as a function of phase angle.
The curves marked with diamonds represent the average values of wp(g) (black) and the average plus
(cyan) and minus (yellow) one standard deviation on
bins of 1°. c) w at 550 nm as a function of the phase
angle. Note that dependence on g has been eliminated.
are then averaged in 1° bins obtaining the curves reported in the plot. The cyan curve marked with diamonds represents the average plus the standard deviation. We considered this quantity for the analysis, instead of the average curve (black), in order to minimize the effect of unresolved shadows that shift the
output towards lower values. At each wavelength, the
cyan curve is fitted with the term wp(g) determining w
and b. Their spectral values are reported in Fig. 2. SSA
exhibits a red spectral slope and a wide band at ~3 µm
indicating the presence of organics [4]. The asymmetry
parameter has a negative value, slightly depending on
wavelength, indicating a back-scattering behavior.
46th Lunar and Planetary Science Conference (2015)
2114.pdf
France), Deutsches Zentrum für Luft- und Raumfahrt
(DLR-Germany), National Aeronautic and Space Administration (NASA-USA) Rosetta Program, Science
and Technology Facilities Council (UK). VIRTIS has
been built by a consortium, which includes Italy, France and Germany, under the scientific responsibility of
the Istituto di Astrofisica e Planetologia Spaziali of
INAF, Italy, which guides also the scientific operations. The VIRTIS instrument development has been
funded and managed by ASI, with contributions from
Observatoire de Meudon financed by CNES, and from
DLR.
Fig. 2. w (top panel) and b (bottom panel) vs.
wavelength. Spectra have been cut beyond 3.9 µm because of thermal emission from the surface. Missing
parts in the spectrum correspond to instrument spectral filters junctions. Values computed at 550 nm for
three other comets are reported for comparison [5],
[6], [7].
Maps: By means of applying Eq. 1 to the measured I/F for a given observation geometry (i,e,g), using
the derived values of b, it is possible to extract w, that
represents the intrinsic brightness of the surface. This
allows mapping together acquisitions taken at different
illumination conditions, as shown in Fig. 3, 4. It can be
noted that the photometric correction provides a better
match among the different acquisitions, with respect to
uncorrected data, indicating that photometric effects
have been minimized.
Conclusion and future works: We have presented a photometric correction computed from
VIRTIS-M observation of comet 67P. The values we
obtained for w and b are compatible with the ones derived for other comets in the VIS range, such as Borrelly [5], Temple 1 [6], and Hartley 2 [7], characterized
by low albedos and backscattering SPPF (Fig. 2). New
observations taken at different geometries (very small
and very large phase angles) will be included in the
analysis in order to derive more constrained parameters, accounting also for opposition effect and largescale roughness.
Acknowledgments: The authors would like to
thank the following institutions and agencies, which
supported this work: Italian Space Agency (ASI Italy), Centre National d’Etudes Spatiales (CNES-
Fig. 3 Photometrically corrected acquisitions (w)
projected onto 3D shape model of the comet.
Fig. 4. Map of a portion of the comet produced
from 5 different VIRTIS-M acquisitions. Top panel:
uncorrected reflectance. Bottom panel: SSA derived
after photometric correction.
References: [1] A. Coradini et al., 2007. Space Sci.
Rev. 128, 529-559. [2] Hapke, B., 2012. Theory of
reflectance and emittance spectroscopy. Cambridge
University Press. [3] Heyney, L.G., Greenstein, J.L.,
1941. Astrophys. J. 93, 70–83. [4] Capaccioni et al.,
2015. Science, accepted paper. [5] Li et al., 2007. Icarus 188, 195-211. [6] Li et al., 2007. Icarus 187, 4145. [7] Li et al. 2012. Icarus 222, 559-570.

© Copyright 2026