
THE EFFECTS OF LOW THERMAL CONDUCTIVITY SAND ON THE
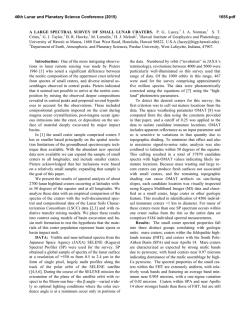
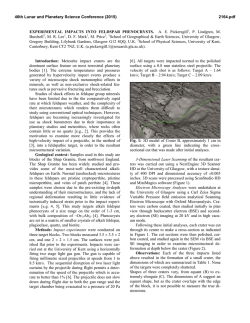
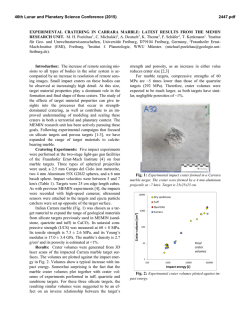
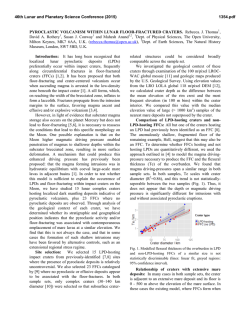
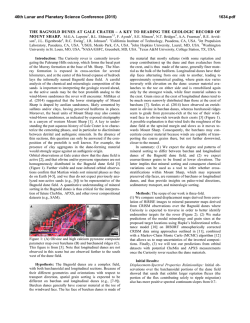
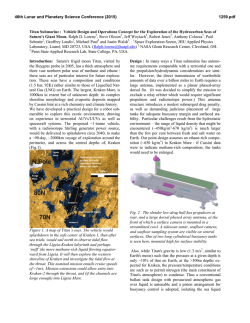
46th Lunar and Planetary Science Conference (2015)
2913.pdf
THE EFFECTS OF LOW THERMAL CONDUCTIVITY SAND ON THE RELAXATION OF TITAN’S
CRATERS Lauren R. Schurmeier1 and Andrew J. Dombard1, 1Earth & Environmental Sciences, University of Illinois at Chicago (854 W. Taylor St., Chicago, IL [email protected]).
Introduction: The surface of Saturn’s moon Titan
is unlike most satellites because the surface processes
that occur are not dominated by impact cratering, but
instead by aeolian, lacustrine, fluvial, and pluvial processes. Impact craters on Titan are neither common nor
evenly distributed. So far only 8 of the roughly 60
crater candidates identified on Titan have been named
as impact craters [1].
Recently, Neish et al. [2] used Cassini SARTopo
data to create topographic profiles of the craters Ksa,
Sinlap, Hano, Afekan, Menrva, Soi, and two “probable” unnamed craters identified by Wood et al. [1].
With the exception of Hano, these all lie within 30° of
the equator, which is also the location of Titan’s large
sand seas of linear dunes. Neish et al. [2] constrained
crater depth, rim height, and diameter, permitting assessment of crater morphology. Notably, the depth-todiameter ratios are significantly shallower than similarsized fresh craters on Ganymede [3], a moon of comparable size and composition.
Titan’s craters initially should have had similar
depths to that of fresh Ganymede and/or Callisto craters, but over time, one or more unknown processes
shallowed them by many hundreds of meters. Causes
of the shallowing could include: erosion and deposition
by rain and rivers, direct atmospheric sedimentation of
haze particles, aeolian infill of dune material, and viscous relaxation. Neish et al. [2] concluded that aeolian
infill alone was likely the cause of the shallowness of
Titan’s craters, and rejected the idea of topographic
relaxation because of Titan’s low surface temperature.
Here, we test this assumption and determine if the
unique thermal properties of Titan’s sand could aid
viscous relaxation and result in shallower craters in a
reasonable period of time.
The Thermal Conductivity of Titan’s Sand: Titan’s
sand seas are thought to be composed of hydrocarbon
sands [4]. Solid hydrocarbons, such as benzene or coal,
have very low thermal conductivities, and solidorganic sands are also very porous in nature, leading to
an even lower bulk thermal conductivity. We estimate
the thermal conductivity of the hydrocarbon sands by
scaling the thermal conductivity of benzene and coals
at temperatures and pressures relevant to Titan by a
factor commiserate with the conductivity drop between
particulate and solid silicates. Since the craters lie
within the regions containing sand seas, they may be
surrounded by and filled with sand, and the low thermal conductivity of the sand acts as a blanket that
might raise the effective surface temperature of Titan’s
craters, potentially enhancing relaxation. The final
crater morphology thus would be shallowed by both
infill and relaxation.
Sinlap and Soi: Of the identified craters with available topographic profiles, Sinlap and Soi are most similar in diameter (~80 km), but they currently have immensely different depths that are shallower than the
expected ~1100 m for a crater this size. Sinlap has a
depth that suggests a shallowing of nearly 500 m,
while Soi has lost almost all of its topography and is
shallowed by about twice as much. Soi’s topography is
almost indistinguishable from the adjacent dune field
and appears to be filled with dune material. Additionally, Soi appears to have linear dunes present much closer to its rim than Sinlap (Fig. 1). The difference in the
location of the dunes, the relative ages of the craters,
and the amount of dune material within the craters may
have lead to differences in crater relaxation resulting in
dissimilar crater depths.
!
Figure 1: Cassini SAR images of Sinlap (left)
and Soi (right). The striped radar-dark features
are linear dunes. The dunes are located closer
to Soi’s rim than Sinlap’s. Image credit: C.
Neish/NASA/JPL-Caltech/ ASI/GSFC
Methods: Our aim is to determine if we can reproduce the current shallow depths of Sinlap and Soi. Initially, we considered a uniform increase in surface
temperature, which might arise from a blanket of sand
of uniform thickness [5]. The thickness of sand deposits around a crater, however, will be spatially variable,
a scenario we consider here. Differences in the amount
of dune infill in the crater bowl and the proximity of
nearby dunes to the crater rim are investigated.
Dune Field Effective Surface Temperature: The location of nearby dunes influences the surrounding surface temperature profile around the crater and will not
yield a constant effect because of variable dune thickness. The horizontal scale of the dunes (hundreds of
meters), however, is orders of magnitude smaller than
the craters, so we seek to determine an effective increase in surface temperature appropriate to study the
relaxing craters. To determine this effective surface
46th Lunar and Planetary Science Conference (2015)
temperature produced by the dune field, we use the
commercially available Marc finite element package.
We produce meshes that crosscut 3 linear dunes with 5
surrounding interdune spaces to simulate their thermal
effects at depth. The physical surface is held at 94K,
and we find the thermal conductive equilibrium using
our estimated conductivity of Titan’s sand. Dune
shapes are assumed to have isosceles triangular shapes
through their cross-section with maximum measured
dune heights of 120-180 m, and widths and spacing
(empty interdune areas) from globally averaged measurements along with measurements specifically in the
vicinities of Sinlap and Soi [6]. We investigate different permutations of dune widths, interdune widths, and
maximum dune heights and find the equilibrium temperature at depth. Thus, we determine a temperature of
100 K is most representative of the effective surface.
Crater Relaxation: We also use Marc to simulate
the relaxation of Sinlap and Soi, assuming axisymmetry (see [7]). Sinlap’s diameter, depth, and rim
height are determined from the profiles in Neish et al.
[2]. Both craters have similar diameters within error,
~80 km. To determine the initial, unmodified shape of
both Sinlap and Soi, we use the expected depth from
the depth-to-diameter relationships of fresh craters on
Ganymede and Callisto, averaging them [3].
The viscoelastic relaxation is modeled using the
rheology of water ice at two heat flows: 4 mW/m2 (a
reasonable heat flow for Titan today [8]), and a higher
heat flow of 10 mW/m2 more appropriate for the distant past or higher than chondritic abundances of heat
producing elements. We simulate relaxation up to 4
Gyr for various increased surface temperatures within
the crater bowl. To calculate the increase in surface
temperature within the bowl, we select a maximum
infill thickness and assume that the infill is flat (Fig.
2). Using the thickness at each location within the
bowl, we calculate the increase in surface temperature
using the estimated thermal conductivity of the sand.
The approximate distance of the adjacent dune field
to the rims of Sinlap and Soi are measured from SAR
imagery. We find both minimum and maximum distances to the dunes and run both for comparison. We
set the surface temperature to 100 K from the starting
distance of the dune field out to the end of the mesh.
Note that the dunes adjacent to Soi are much closer its
rim than the dunes near Sinlap’s (Fig. 2).
For each run, we determine the minimum crater
bowl depth at each time step during crater relaxation.
However, the actual depth of the crater is reduced because of the thickness of sand infill in the crater raises
the apparent crater depth. We reduce the final depth
needed by subtracting the maximum thickness of sand
infill. We then determine the amount of relaxation time
needed to reach this reduced depth.
2913.pdf
Figure 2: Initial crater shape of both Sinlap and Soi
(black curve). Effective surface temperatures within
the crater bowl are calculated from the thicknesses of
overlying sand infill at multiple locations. The location
of the adjacent dune fields for Soi and Sinlap are
shown (arrows) and are assumed to produce an effective surface temperature of 100 K.
Preliminary Results: We find that at Titan’s expected heat flow [8] of 4mW/m2, Sinlap requires sand
thickness that is 82% of the depth change required
(375 m) to relax the remaining 85 m in just under the
expected maximum age of the dunes, 750 Myr [9]. If
98% filled with sand, it only takes 300 kyr to relax the
final 10 m, but at that level of sand fill, viscous relaxation is a negligible contributor. If Soi is 69% filled
with sand (525 m), it can relax the remaining 258 m
and eliminate all topography in under 750 Myr. When
92% filled with sand, Soi can reach its current depth in
1.2 Myr. At a higher heat flow of 10 mW/m2, if Sinlap
is 60% filled with sand, viscous relaxation will uplift
the remaining 185 m in just under 750 Myr. If 87%
filled with of sand, the remaining 60 m of uplift can
occur in 325 yr. If Soi is 69% filled with sand it can
relax to its current state in a mere 3 kyr. We also find
that the location of adjacent dunes is not an important
factor in relaxation.
Our results show that viscous relaxation aided by
Titan’s sand is a minor contributor to Sinlap and Soi’s
shallowness at Titan’s current heat flow estimate. Increased heat flow in Titan’s past or because of higher
heat sources makes viscous relaxation more important;
however, aeolian infill contributes the most to the shallow depths of Sinlap and Soi. Later simulations will
establish whether this finding holds for other craters.
References: [1] Wood C. A., et al. (2010) Icarus, 206,
168-172. [2] Neish C. D. et al. (2013) Icarus, 223, 82-90. [3]
Schenk, P. (2002) Nature, 417, 419-421. [4] Soderblom, L.
A., et al. (2007) Planetary & Space Sci., 55, 2015-2036. [5]
Schurmeier, L. R. and Dombard, A. J. (2014) Titan Through
Time 3 Abstracts. [6] Savage, C. J., et al. (2014) Icarus, 230,
180-190. [7] Dombard, A. J. and McKinnon, W. B. (2006)
JGR, 111, E01001. [8] Sohl, F. et al. (2003) JGR, 108, E12
[9] Rodriguez, S. et al. (2014) Icarus, 230, 168-179.

© Copyright 2026