
Infrared Properties of Titan Tholins in Liquid Methane and Ethane
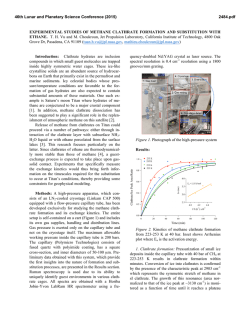
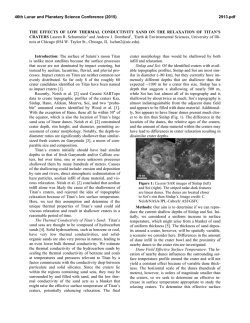
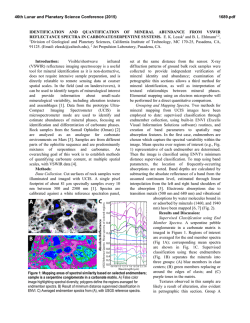
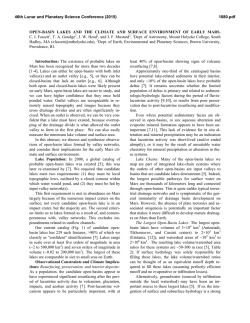
46th Lunar and Planetary Science Conference (2015)
2936.pdf
INFRARED PROPERTIES OF TITAN THOLINS IN LIQUID METHANE AND ETHANE: DETECTION
OF COMPLEX ORGANICS IN TITAN LAKES. V.F. Chevrier1, S. Singh1, D. Nna-Mvondo2, D. Mège3,2,
1
Arkansas Center for Space and Planetary Sciences, University of Arkansas, Fayetteville, AR, USA
([email protected]), 2Laboratoire de Planétologie et Géodynamique, LPG Nantes, CNRS UMR 6112, Université de
Nantes, Nantes, France, 3Institute of Geological Sciences, Polish Academy of Sciences, Research Centre in
Wrocław, Wrocław, Poland, ([email protected]).
Introduction: Since the discover by Cassini ISS and
SAR in mid-2005 and mid-2006 of a large dark feature
in the Titan south polar region, suggestive of a lake
(Ontario lacus) [1] and of a vast array of lake-like features being possibly liquid in the north polar region
[2], observation of the Titan’s lakes by Radar radiometry and VIMS from the Cassini Orbiter have emerged
to characterize the composition and physical properties
of the polar lakes. However, currently the chemical
composition of these lakes remains poorly determined,
due to the presence of strong atmospheric absorptions,
mainly CH4. Theoretical models based on thermodynamic data predict liquid ethane and methane to be
abundant in Titan lakes and seas [3] and other organic
species from atmospheric precipitation to be additional
constitutents such as complex organics including the
refractory macromolecular material of Titan’s aerosols
(Titan tholins). Previous studies have shown that
tholins should be poorly soluble in ethane [4] but methane has not been tested, essentially because it is
harder to condense and maintain in liquid state for
sufficient amounts of time. Moreover, methane and
ethane can exhibit very different behaviors with respect to solubility. Indeed, nitrogen is much more soluble in methane than in ethane, while most simple organics exhibit the opposite behavior
The main objsectives of this study is to determining if tholins dissolve in liquid hydrocarbons (methane, ethane and their mixtures) and determine if they
can be detected by conventional FTIR spectroscopy
methods.. Here we present a Titan’s lakes experimental simulation in order to examine the spectroscopic signature of a liquid methane and liquid ethane in
contact with laboratory analogs of Titan’s aerosols.
Laboratory Simulation of Titan’s lakes: Experiments have been performed in the Titan simulation
facility of the W.M Keck laboratory at the University
of Arkansas [5]. An insulated cylindrical steel cryovacuum chamber (internal diameter of 61 cm and
height of 208 cm) accommodates out a Titan module
that sits inside a main chamber. Titan module contains
a temperature control box internally and externally
lined with LN2 cooling pipes allowing approaching
temperatures relevant to Titan surface (90-94 K). Two
types of tholins were used in these experiments:
Tholins synthesized at NASA Ames Research Center
(2013 experiments, Fig. 1) and tholins synthesized
using a new CH4-N2 plasma system available in our
lab (2014 experiments, Fig. 3). Experiments were performed by subjecting a Titan gas mixture analogue
(10% CH4 in N2, high purity) to a DC glow discharge
(cold plasma) inside a glass chamber (Technics Hummer II sputtering system, DC current 0-50 mA, DC
Voltage 100-3000 V), at a continuous gas flow (flow
rate 10–40 sccm) and ambient temperature (293 K).
The tholins were then introduced inside a Petri
dish into the sample collection pan sit inside the module. The pressure was maintained at 1.5 bar throughout
the experiments to simulate Titan atmospheric pressure
at the surface. Once the required temperature and pressure was reached, the sample (methane, ethane) was
introduced into the chamber and the module through a
condenser using condenser input coils. The behavior
of the sample was monitored via FTIR, in the nearinfrared from 2.5 to 1.0 µm (4000-10000 cm-1). The
mass reading was also monitored.
a)
b)
c)
d)
Pure Methane
Figure 1: NASA AMES tholins in liquid methane. Some of
the visible tholins bands are shown in shaded region. a)
Tholins spectra at 1.5 bar and at 90 K. b) Methane + tholins
spectra after evaporating methane at 138 – 149 K. c) Methane + tholins after couple hours into experiment at 89 K. d)
Methane + tholins right after methane pour at 91 K.
Results: We have conducted series of several different
experiments. Stated with the tholins in liquid methane
and then followd by liquid methane and the mixture of
liquid ethane/acetoniltrile. Several spectra were acquired during the experiments (Fig. 1). The first results
show that the tholins infrared signature totally disappears in presence of the solvents and no new absorption bands appear in the spectra. Further IR analysis of
46th Lunar and Planetary Science Conference (2015)
the tholins exposed to the solvents neither show modification against the initial tholin optical features. These
first results seem to confirm the very low solubility/reactivity or non-solubility of Titan tholins in such
solvents as predicted theoretically [4].
Absorption band of tholins are centered at 1.54,
1.62, 1.74, 1.92, 2.0, and a negative slope at 2.1 μm
(Fig. 1, 2). In the mixture of tholins and liquid methane, numerous methane absorbtions band have been
detected. Identified methane absorption bands are centered at 1.16, 1.33, 1.41, 1.66, 1.72, 1.79 and 1.85 μm,
in agreement with Clark et al. [6]. In the presence of
liquid methane the only infrared signature of tholins
present are at 1.54, 2.0, and a negative slope at 2.1 μm.
In tholins spectra the feature at 1.4 μm is due to water
absorption and can not be trusted. Once the methane is
evaporated from the mixture all the tholins absorption
bands are retrieved and no new feature is noticed resulting in no reactivity/solubility of tholins with liquid
methane.
d)
c)
b)
a)
Figure 2: a) Pure acetonitrile at 89K b) Acetonitrile + ethene + tholins at 90K c) Pure ethane at 90K d) Ethane +
tholins at 89K. Some of the visible tholins bands are shown
in shaded region.
AA
2936.pdf
Fig. 2 shows the pure liquid ethane, acetonitrile,
and the mixture of
ethane-tholins and ethaneacetoniltrile-tholins spectra. All the tholins absorptions
bands are coverd with the liquid ethane features except
the negative slope centered at 2.1 μm . In ethane and
tholins mixture the negative slope is the only feature
tholins. All the other tholins signatures are retrieved
once ethane is evaporated resulting in no reactivity. In
the nixture of acetonitrile-ethane-tholins same process
is repeated and thus no reactivity/solubility was noticed. In higher tholins contents (Fig. 3), modifications
of the ethane bands are observed at 1.7-1.8 µm and 2.0
µm.
Conclusions/Future Work: We have observed that
tholins when in contact with these solvents are not
remaining in suspension. In this case, the refractory
material of Titan’s aerosols would not be dissolved in
the Titan’surface lakes and seas but would rather
sinks. However, to confirm these first data, additionnal
experiments are needed and are in the prospect of our
next work. Larger quantities synthesized in our laboratory show that tholins can be detected in liquid ethane,
essentially through flattening and broadening of specific bands. Our experimental approach and its resulting data are relevant in regards to current VIMS observations of Titan’s lakes and proposed future missions to Titan like the ESA’s Titan Saturn System Mission (TSSM).
Acknowledgements: This work is funded by NASA
Grant project # NNX10AE10G.
References:[1] Turtle E. P. et al. (2009) Geophys. Res.
Lett., 36(2), L02204. [2] Stofan E. R. et al. (2007) Nature, 445, 61–64. [3] Lunine J. I. et al. (1983) Science,
222, 1229–1230. [4] Raulin, F. et al. (2012) Chemical
Society Reviews 41, 5380–5393. [5] Wasiak et al.
(2012) Adv. Space Res. 51, 1213–1220. [6] R. N.
Clark et al. JGR, 114:E03001, 2009.
B
Figure 3: Spectra of tholins and ethane mixtures at 94 K (liquid C2H6) and 87 K (solid C2H6). The tholins were synthesized unsing our own plasma synthesis system, before being transferred into the Titan simulations chamber. A. Full spectral range allowed by the fiber optic (1 to 2.5 µm). B. Zoom on the region where tholins signatures can be identified.


© Copyright 2026