
Fourth Quarter 2014 Earnings Call
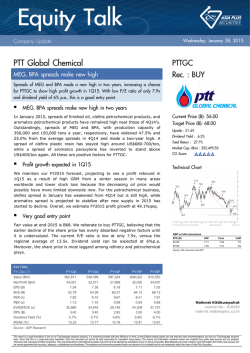
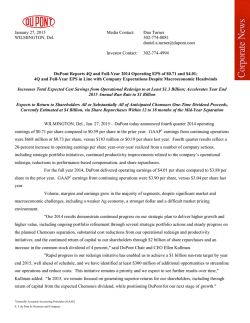
Fourth Quarter 2014 Earnings Call
Jeff Woodbury
Vice President, Investor Relations & Secretary
February 2, 2015
Cautionary Statement
• Forward-Looking Statements. Outlooks, expectations, forecasts, estimates, targets, business plans, and other
statements of future events or conditions in this presentation or the subsequent discussion period are forward-looking
statements. Actual future results, including financial and operating performance; demand growth and mix;
ExxonMobil’s volume/production growth and mix; the amount and mix of capital expenditures; resource additions and
recoveries; finding and development costs; project plans, timing, costs, and capacities; drilling programs; product sales
and mix; dividend and share purchase levels; cash and debt balances; corporate and financing expenses; and the impact
of technology could differ materially due to a number of factors. These include changes in oil or gas prices or other
market conditions affecting the oil, gas, and petrochemical industries; the occurrence and duration of economic
recessions; reservoir performance; the outcome of exploration; timely completion of development projects; war and
other political or security disturbances; changes in law or government regulation, including sanctions as well as tax and
environmental regulations; the outcome of commercial negotiations; opportunities for investments or divestments that
may arise; the actions of competitors and customers; unexpected technological developments; unforeseen technical
difficulties; and other factors discussed here and under the heading "Factors Affecting Future Results" in the Investors
section of our Web site at exxonmobil.com. See also Item 1A of ExxonMobil’s 2013 Form 10-K. Forward-looking
statements are based on management’s knowledge and reasonable expectations on the date hereof, and we assume
no duty to update these statements as of any future date.
• Frequently Used Terms. References to resources, barrels of oil, volumes of gas and liquids, and similar terms include
quantities that are not yet classified as proved reserves under SEC definitions but that we believe will likely be developed
and moved into the proved reserves category in the future. Shareholder distributions referred to in this presentation
mean cash dividends plus shares purchased to reduce shares outstanding (excluding anti-dilutive purchases). For
definitions and more information regarding resources, reserves, cash flow from operations and asset sales, free cash
flow, and other terms used in this presentation, including information required by SEC Regulation G, see the "Frequently
Used Terms" posted on the Investors section of our Web site and the additional information provided in this
presentation and in the 8-K filed today with our earnings press release and IR supplement. The Financial and Operating
Review on our Web site also shows ExxonMobil's net interest in specific projects.
• The term ‘project’ as used in this presentation can refer to a variety of different activities and does not necessarily have
the same meaning as in any government payment transparency reports.
2
Headlines
Full-year earnings $32.5 billion; Fourth quarter $6.6 billion
■ Integrated business model produces solid results throughout business cycle
■ Generated cash flow from operations and asset sales of $49.2 billion in 2014
– Free cash flow of $18.0 billion, up $7.3 billion from 2013
■ Completed a record eight major Upstream projects during the year
■ Delivered full-year production plan of 4.0 million oil-equivalent barrels per day
3
Business Environment
Global economic growth moderated in the fourth quarter
■ U.S. expansion continued, but growth slowed from the third quarter
■ China’s economy decelerated
■ Ongoing economic weakness in Europe and Japan
■ Crude oil and Henry Hub natural gas prices declined sharply
■ U.S. refining margins decreased significantly
■ Chemical specialty margins improved on lower feed costs
4
4Q14 Financial Results
Earnings
6.6
Earnings Per Share – Diluted (dollars)
1.56
Shareholder Distributions
5.9
CAPEX
10.5
Cash Flow from Operations and Asset Sales1
7.7
Cash
4.7
Debt
29.1
Billions of dollars unless specified otherwise
1
5
Includes $0.2B associated with asset sales
4Q14 Sources and Uses of Funds
Cash decreased by $0.3B in the fourth quarter
Beginning Cash1
5.0
Earnings
6.6
Depreciation
4.5
Working Capital / Other
Proceeds Associated with Asset Sales
(9.1)
Shareholder Distributions
(5.9)
Ending Cash1
Billions of dollars unless specified otherwise
2
6
0.2
PP&E Adds / Investments and Advances2
Debt / Other Financing
1
(3.6)
Beginning and ending balances include restricted cash of $0.1B and $0.1B, respectively
Includes PP&E adds of ($8.9B) and net advances of ($0.2B)
7.0
4.7
7.7
Total Earnings – 4Q14 vs. 4Q13
Earnings decreased $1.8B from lower Upstream and Downstream earnings and
higher Corporate expenses, partly offset by higher Chemical earnings
Millions of Dollars
8,350
4Q13
7
(1,318)
U/S
(419)
317
(360)
D/S
Chem
C&F
6,570
4Q14
Total Earnings – 4Q14 vs. 3Q14
Earnings decreased by $1.5B, reflecting lower Upstream and
Downstream earnings
Millions of Dollars
8,070
(948)
(527)
3Q14
8
U/S
D/S
27
(52)
6,570
Chem
C&F
4Q14
Upstream
Earnings – 4Q14 vs. 4Q13
Earnings decreased $1.3B due to lower crude prices, partly offset by
favorable sales mix effects and net positive other items
Millions of Dollars
6,786
(2,360)
640
5,468
Other
4Q14
400
4Q13
9
Realization
Vol/Mix
Upstream
Volumes – 4Q14 vs. 4Q13
Volumes decreased 0.7%*: Liquids +80 kbd, natural gas -653 mcfd
koebd
4,216
(133)
(24)
(40)
Price/Spend: -20
Net Interest: -4
4Q13
UAE Expiry
Liquids (KBD)
Gas (MCFD)
Total (KOEBD)
10
4Q13
2,235
11,887
4,216
Entitlements
4Q14
2,182
11,234
4,054
Liquids:
Gas:
Divestments
Delta
-53
-653
-162
* Excludes the impact of the UAE onshore concession expiry
35
%
-2.4%
-5.5%
-3.8%
4,054
+65
-30
Net Growth
Ex-UAE Expiry Impact:
Delta
%
+80
+3.6%
-653
-5.5%
-29
-0.7%
4Q14
Upstream
Earnings – 4Q14 vs. 3Q14
Earnings decreased $948M due to lower crude prices, partly offset by net
positive other items
Millions of Dollars
6,416
(2,160)
1,070
5,468
Other
4Q14
140
3Q14
11
Realization
Vol/Mix
Upstream
Volumes – 4Q14 vs. 3Q14
Volumes increased 5.8%: Liquids +117 kbd, natural gas +639 mcfd
koebd
3,831
76
(8)
Liquids:
Gas:
Price/Spend: +78
Net Interest: -2
3Q14
12
Entitlements
155
Divestments
4,054
+57
+98
Net Growth
4Q14
Downstream
Earnings – 4Q14 vs. 4Q13
Earnings decreased $419M due to higher maintenance activities and
unfavorable tax items
Millions of Dollars
916
40
20
(480)
497
4Q13
13
Margin
Vol/Mix
Other
4Q14
Downstream
Earnings – 4Q14 vs. 3Q14
Earnings decreased $527M reflecting lower U.S. refining margins and
higher maintenance, partly offset by favorable forex and other effects
Millions of Dollars
1,024
(360)
(20)
(150)
497
3Q14
14
Margin
Vol/Mix
Other
4Q14
Chemical
Earnings – 4Q14 vs. 4Q13
Earnings increased $317M due to higher non-U.S. margins, partly offset by
unfavorable volume/mix and forex effects
Millions of Dollars
490
(60)
(110)
1,227
910
4Q13
15
Margin
Vol/Mix
Other
4Q14
Chemical
Earnings – 4Q14 vs. 3Q14
Earnings essentially flat as stronger specialty product margins were offset by
volume/mix effects and higher maintenance
Millions of Dollars
200
(70)
1,200
3Q14
16
Margin
Vol/Mix
(100)
Other
1,227
4Q14
2014 Financial Results
Earnings
32.5
Earnings Per Share – Diluted (dollars)
7.60
Shareholder Distributions
23.6
CAPEX
38.5
Cash Flow from Operations and Asset Sales1
49.2
Cash
4.7
Debt
29.1
Billions of dollars unless specified otherwise
1
17
Includes $4.0B associated with asset sales
2014 Sources and Uses of Funds
Cash decreased by $0.2B in 2014
Beginning Cash1
4.9
Earnings
32.5
Depreciation
17.3
Working Capital / Other
(4.6)
Proceeds Associated with Asset Sales
PP&E Adds / Investments and Advances2
(31.2)
Shareholder Distributions
(23.6)
Debt / Other Financing
Ending Cash1
Billions of dollars unless specified otherwise
1
2
18
4.0
Beginning and ending balances include restricted cash of $0.3B and $0.1B, respectively
Includes PP&E adds of ($32.9B) and net advances of $1.7B
5.4
4.7
49.2
Total Earnings – 2014 vs. 2013
Earnings essentially flat as higher Upstream and Chemical earnings were
offset by lower Downstream earnings and higher Corporate expenses
Millions of Dollars
19
32,580
707
(404)
487
(850)
32,520
2013
U/S
D/S
Chem
C&F
2014
Upstream
Earnings – 2014 vs. 2013
Earnings increased $707M due to net positive other items and favorable sales
mix effects, partly offset by lower crude prices
Millions of Dollars
20
26,841
(2,010)
2013
Realization
510
Vol/Mix
2,210
27,548
Other
2014
Upstream
Volumes – 2014 vs. 2013
Volumes decreased 1.7%*: Liquids +44 kbd, natural gas -691 mcfd
koebd
4,175
(135)
(47)
(31)
Price/Spend: -43
Net Interest: -4
2013
UAE Expiry
Liquids (KBD)
Gas (MCFD)
Total (KOEBD)
21
2013
2,202
11,836
4,175
Entitlements
2014
2,111
11,145
3,969
Liquids:
Gas:
Divestments
Delta
-91
-691
-206
* Excludes the impact of the UAE onshore concession expiry
7
%
-4.1%
-5.8%
-4.9%
3,969
+69
-62
Net Growth
Ex-UAE Expiry Impact:
Delta
%
+44
+2.0%
-691
-5.8%
-71
-1.7%
2014
Downstream
Earnings – 2014 vs. 2013
Earnings decreased $404M on lower refining margins, and unfavorable forex
and tax effects, partly offset by refining optimization
Millions of Dollars
3,449
(230)
480
(650)
3,045
2013
22
Margin
Vol/Mix
Other
2014
Chemical
Earnings – 2014 vs. 2013
Earnings increased $487M due to stronger commodity product margins and
positive volume/mix effects, partly offset by higher maintenance
Millions of Dollars
520
100
(130)
4,315
Margin
Vol/Mix
Other
2014
3,828
2013
23
Strong Annual Cash Flow
Free cash flow increased by $7.3B compared to 2013
$B
50
Free Cash Flow: $18.0 billion
49.2
(31.2)
40
30
5.4
20
Share
Purchases
10
0
-10
1
2
24
(23.6)
Dividends
Cash Flow
from Operations
1
and Asset Sales
PP&E Adds /
Investments and
2
Advances
Debt / Other
Financing
Includes $4.0B associated with asset sales
Includes PP&E adds of ($32.9B) and net advances of $1.7B
Shareholder
Distributions
(0.2)
Change in Cash
Balance
Upstream
Delivering Profitable Growth
Demonstrating world-class project execution capabilities
■ Completed record 8 major projects in 2014
● Arkutun-Dagi started up
Actuals at
$109 Brent
Analyst Mtg.
$112 Brent
● Steam injection underway at Nabiye
● Lucius on-stream
■ Hadrian South start-up in February
■ Initiated early production at Upper Zakum
Arkutun-Dagi platform offshore Sakhalin Island
25
■ Kearl Expansion ahead of schedule
Upstream
New Opportunity Growth
Pursuing a broad exploration program
■ Drilling Activity
● Romania – Continuing drilling operations
United Kingdom
Canada
East Coast
Côte d’Ivoire
Romania
● Argentina – Successfully tested 2nd
operated discovery in the Vaca Muerta
Equatorial Guinea
■ New Acreage Captures
● Canada – Captured 1.6M gross acres in
three licenses offshore Newfoundland
Argentina
Drilling / Testing
Acreage Capture
EM Interest
● Côte d’Ivoire – Added 2.3M gross acres to
strong West Africa acreage position
● Equatorial Guinea – Captured 160k gross
acres offshore Bioko island
● UK North Sea – Awarded a 50% working
interest in two licenses near producing fields
26
Summary
Strong performance underscores value of integrated business model
Billions of dollars
unless specified otherwise
2014
Earnings
32.5
Highlights
■ Delivered full-year production plan
■ Disciplined capital allocation
Upstream Production (MOEBD)
■ Improved production mix/profitability
Upstream Unit Profitability1
19.47
■ Increased free cash flow
Free Cash Flow
18.0
■ Robust shareholder distributions
Shareholder Distributions
23.6
($/OEB)
1
27
4.0
ExxonMobil volume excludes noncontrolling interest share
Questions


© Copyright 2026