
4Q 2014 Performance Results
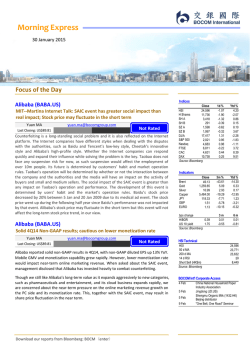
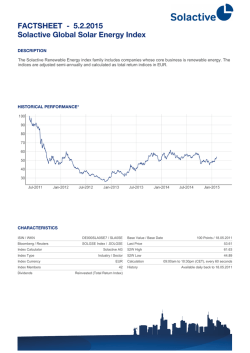
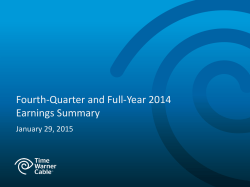
4Q14 Earnings Release th 2015 2012년 29 2월 1일 January 0 All information regarding management performance and financial results of LG Electronics (the “Company”) during the 4th quarter of 2014 as contained herein has been prepared on a consolidated basis in accordance with International Financial Reporting Standards (“IFRS”). Please note that starting from January 1, 2013, the Company accounted LG Innotek as a consolidated subsidiary of the Company pursuant to the enactment of K-IFRS 1110, 'Consolidated Financial Statements'. In addition, the Company has discontinued the PDP business during 2014 and has separated all its profit and loss line items of PDP business operations from the continuing operations and has reclassified them into a separate account called “Income(Loss) from discontinued operations”, and also has restated the comparative information in conformity with the same classification in the current period. In addition, the information regarding results of 4th quarter of 2014 has been prepared in advance, prior to being reviewed by outside auditors, solely for the convenience of investors of the Company, and is subject to change in the process of final reviewing by external auditors. The information contained herein includes forward-looking statements in respect to future plans, prospects, and performances of the Company as well as the Company’s projected sales plan for 1st quarter of 2015. These forward-looking statements also refer to the Company’s performance on consolidated base, as indicated. The aforementioned forward-looking statements are influenced by changes in the management environment and relative events, and by their nature, these statements refer to uncertain circumstances. Consequently, due to these uncertainties, the Company’s actual future results may differ materially from those expressed or implied by such statements. Please note that as the forward-looking statements contained herein are based on the current market situation and the Company’s management direction, they are subject to change according to the changes in future market environment and business strategy. The information contained herein should not be utilized for any legal purposes in regards to investors’ investment results. The Company hereby expressly disclaims any and all liability for any loss or damage resulting from the investors’ reliance on the information contained herein. Table of Contents Ⅰ. 4Q14 Results (Consolidated) Ⅱ. Performance and Outlook by Division 4Q14 Results Ⅰ. 4Q14 Results (Consolidated) Sales/Profit Sales Profit (Unit : KRW tn) 14.71 3Q’14 3.8%↑ 15.27 4Q’14 (Unit : KRW bn) 4.9%↑ 3Q’14 4Q’14 4Q’13 Operating Profit 465 275 214 EBITDA 956 775 710 Net Profit 203 -206 - 63 14.56 4Q’13 * The Company has separated all its profit and loss line items of PDP business operations from the continuing operations and has reclassified them into a separate account called “Income from discontinued operations”, and also has restated the comparative information in conformity with the same classification in the current period. 1 Ⅰ. 4Q14 Results (Consolidated) Net Profit Investment Income (Unit : KRW bn) (Unit : KRW bn) Gain/Loss on equity method investment 140 Net Profit 69 Net financial income/expense 289 Other non-operating income/expense 3Q’14 4Q’14 LG Display 124 148 Others -3 Gain/Loss Gain/Loss on on equity equity method investment method investment 121 275 99 Tax -8 Op. Profit Loss from discontinued operation 164 - 206 140 Net Loss * The Company has separated all its profit and loss line items of PDP business operations from the continuing operations and has reclassified them into a separate account called “Income from discontinued operations”, and also has restated the comparative information in conformity with the same classification in the current period. 2 Ⅰ. 4Q14 Results (Consolidated) Cash Flow Statement 4Q Net Cash Flow *1 Cash Flow Statement (Unit : KRW bn) Cash In (Unit : KRW bn) Cash Out Cash at beginning of period 140 Change in working capital Gain/Loss on equity method investment Cash flow from operating activities Net income/loss Depreciation 430 Gain/Loss on equity method investment Change in working capital 607 Cash flow from investing activities Others Cash flow from investing activities Increase in tangible assets Increase in intangible assets 500 Cash flow from financing activities - 206 247 Increase/Decrease in debt - 270 FX effect from foreign currency denominated cash 3Q’14 4Q’14 2,701 2,950 915 335 203 491 - 121 - 99 441 - 206 500 - 140 430 - 249 - 535 - 607 - 447 - 72 - 549 - 87 - 97 - 435 - 72 - 427 - 34 1 249 - 706 2,950 2,244 Depreciation Net Income/ Loss Others*2 * Net= Excluding Cash flow from financing activities * Others includes FX effect from foreign currency denominated cash Net Net changes in cash Cash at end of period 3 Ⅰ. 4Q14 Results (Consolidated) Financial Structure Balance Sheet Financial Ratio (Unit: KRW tn) (Unit : %) 4Q’13 3Q’14 4Q’14 Assets 35.53 38.50 37.07 Current Assets 16.33 19.32 17.48 2.65 4.84 2.95 6.29 2.24 5.71 19.20 19.18 19.59 Cash Inventory Non-Current Assets Liabilities 22.84 25.25 24.08 Current Liabilities 15.01 Non-Current Liabilities 7.82 16.60 8.65 15.76 8.32 Equity 13.25 12.99 12.69 Debt 9.21 9.43 9.00 Net Debt 6.57 6.48 6.76 4Q’13 Total Liability to Equity 3Q’14 4Q’14 191 185 180 73 71 69 Debt to Equity Net Debt to Equity 52 49 52 4 Performance and Outlook Ⅱ. Performance and Outlook by Division Home Entertainment 4Q14 Performance 2013년 2분기 실적 Sales: Increased 20% QoQ due to seasonality and was flat YoY Business Performance (KRW tn) LCD TV: Sales increased QoQ in Europe, CIS, and North America due to increased shipments for the peak season Op. Margin 4.6% Profitability: Operating profit margins declined QoQ 3.3% 2.8% due to weaker currency movements in emerging markets such as Russia and Brazil, and intensified competition for the peak season 3.0% 0.0% 2015 Outlook Sales Market: Expect demands for premium TVs such as OLED TV and UHD TV to increase continuously. Also we expect the B2B markets, mainly for monitor signage, to grow 4.78 5.43 4.66 4.51 5.43 4Q‘13 1Q‘14 2Q‘14 3Q‘14 4Q‘14 LGE: Although we expect instable economic conditions in the emerging markets and intensifying competition in developed market to continue, plan to manage profitability with better product mix and optimizing cost structure by leading the premium TV market * The Company has separated all its profit and loss line items of PDP business operations from the continuing operations and has reclassified them into a separate account called “Income from discontinued operations”, and also has restated the comparative information in conformity with the same classification in the current period. 5 Ⅱ. Performance and Outlook by Division Mobile Communications 4Q14 Performance Sales: Increased by 5% YoY and decreased by 11% QoQ Business Performance (KRW tn) to 3.8 trillion won Op. Margin 3.9% 2.4% 1.8% Achieved 15.6M units of smartphone shipments (YoY 18%↑, QoQ 7%↓) Total shipments in North America were 5.7M (YoY 78%↑, QoQ 6%↓) Total shipments in domestic market decreased QoQ due to weaker demand driven by the handset distribution reform law Profitability: Operating profit margins decreased QoQ due to lower ASP driven by intensifying competition, weaker demand in the domestic market, and unfavorable FX movements -0.3% -1.2% 2015 Outlook Sales Market: Expect smartphone market to grow continuously, especially for the LTE market. However, competition to gain market share will be intensified in all regions with stronger lineups from global handset players 3.59 3.62 3.41 4.25 3.78 4Q‘13 1Q‘14 2Q‘14 3Q‘14 4Q‘14 LGE: Plan to improve profitability along with better brand equity while strengthening our presence in the premium market by launching market leading products, running models more efficiently, and concentrating more on selective markets 6 Ⅱ. Performance and Outlook by Division Home Appliance 4Q14 Performance Sales: Increased by 1% YoY to 2.9 trillion won Business Performance (KRW tn) Domestic: Sales increased by 1% YoY due to stronger sales in premium refrigerators Op. Margin 4.0% 3.2% 2.9% 3.0% 1.8% Overseas: Sales increased by 1% YoY due to stronger sales in Europe and emerging markets such as the Middle East, and Southeast Asia despite weaker sales in North America Profitability: Profit improved YoY due to stronger sales in premium products and optimizing cost structure inspite of Increasing marketing expense Sales 2015 Outlook 2.84 2.72 3.03 2.91 2.88 Market: Expect demand recovery to be limited due to slower economic growth in developed market, lower oil prices, and unpredictable FX movement 4Q‘13 1Q‘14 2Q‘14 3Q‘14 4Q‘14 LGE: Plan to lead the premium markets continuously with differentiated technology for customers together with leadership in energy efficiency. Also, plan to improve cost competitiveness with lower the raw material costs 7 Ⅱ. Performance and Outlook by Division Air-Conditioning & Energy Solution 4Q14 Performance Sales : Increased by 9% YoY due to incremental growth in commercial Business Performance (KRW tn) Op. Margin air-conditioners to 0.8 trillion won but decreased by 16% QoQ due to seasonality 10.0% Domestic: Sales increased by 6% YoY due to stronger commercial air-conditioner sales Overseas: Sales increased by 10% due to stronger sales in the Middle East and Central and South America 7.4% Profitability: Achieved operating profit in 4Q for two consecutive years 1.0% -0.3% despite it being the off-season due to continuous growth in sales for commercial air-conditioners 0.5% Sales 2015 Outlook Market: Expect market conditions mainly for the US to improve and 1.64 also demand for high energy efficient products to grow as importance of energy efficiency is emphasized while there is still remaining concerns for uncertainty in the global economy 1.22 0.93 0.72 0.78 4Q‘13 1Q‘14 2Q‘14 3Q‘14 4Q‘14 LGE: Plan to improve cost and product competitiveness with higher energy efficient products. Also, plan to lead the market with market customized products 8 http://www.lg.com Appendix Summarized Financial Statements (Consolidated) Income Statement (Unit : KRW bn) 2013 1Q 2Q 100% 14,882.7 2014 3Q 4Q Total 100% 56,772.3 1Q 100% 13,988.8 2Q 100% 15,066.9 3Q 100% 14,713.0 4Q 100% Sales 13,770.7 100% 13,562.7 100% 14,556.2 100% 59,040.8 100% Cost of goods sold 10,682.4 77.6% 11,254.1 75.6% 10,339.4 76.2% 11,320.2 77.8% 43,596.1 76.8% 10,763.8 76.9% 11,399.2 75.7% 11,150.3 75.8% 11,985.8 78.5% 45,299.1 76.7% Gross profit 3,088.3 22.4% 3,628.6 24.4% 3,223.3 23.8% 3,236.0 22.2% 13,176.2 23.2% 3,225.0 23.1% 3,667.7 24.3% 3,562.7 24.2% 3,286.3 21.5% 13,741.7 23.3% Selling & admin expense 2,732.9 19.8% 3,146.4 21.1% 3,026.2 22.3% 3,021.7 20.8% 11,927.2 21.0% 2,746.2 19.6% 3,058.0 20.3% 3,097.7 21.1% 3,011.2 19.7% 11,913.1 20.2% Operating income (Loss) 355.4 2.6% 482.2 3.2% 197.1 1.5% 214.3 1.5% 1,249.0 2.2% 478.8 3.4% 609.7 4.0% Financial income (Expense) -74.8 -0.5% -95.8 -0.6% -106.8 -0.8% -91.2 -0.6% -368.6 -0.6% -101.0 -0.7% -97.5 Gains (loss) on equity method investment -25.6 -0.2% 34.9 0.2% 85.9 0.6% 30.8 0.2% 126.0 0.2% -54.7 -0.4% 98.3 Other non operating income (Loss) -68.9 -0.5% -169.5 -1.1% -44.6 -0.3% -133.9 -0.9% -416.9 -0.7% -54.0 -0.4% Net income before tax 186.1 1.4% 251.8 1.7% 131.6 1.0% 20.0 0.1% 589.5 1.0% 269.1 1.9% Tax 158.0 1.1% 81.8 0.5% 29.3 0.2% 89.3 0.6% 358.4 0.6% 191.9 1.4% 196.9 28.1 0.2% 170.0 1.1% 102.3 0.8% -69.3 -0.5% 231.1 0.4% 77.2 0.6% 423.7 Income (Loss) from discontinued operations -6.0 0.0% -14.5 -0.1% 6.2 0.0% 5.9 0.0% -8.4 0.0% 15.4 0.1% -11.9 Net income 22.1 0.2% 155.5 1.0% 108.5 0.8% -63.4 -0.4% 222.7 0.4% 92.6 0.7% 411.8 Controlled shares 24.2 132.0 84.0 -63.4 176.8 74.9 369.1 159.7 -204.3 399.4 Noncontrolled shares -2.1 23.5 24.5 0.0 45.9 17.7 42.7 43.0 -1.4 102.0 Income (Loss) from continuing operations 465.0 3.2% -0.6% -68.0 0.7% 120.7 10.1 0.1% 620.6 4.1% 15,272.1 Total 275.1 1.8% 1,828.6 3.1% -0.5% -69.3 -0.5% -335.8 -0.6% 0.8% 140.1 0.9% 304.4 0.5% -246.4 -1.7% -288.6 -1.9% -578.9 -1.0% 271.3 1.8% 57.3 0.4% 1,218.3 2.1% 1.3% 51.8 0.4% 99.2 0.6% 539.8 0.9% 2.8% 219.5 1.5% -41.9 -0.3% 678.5 1.1% -0.1% -16.8 -0.1% -163.8 -1.1% -177.1 -0.3% 2.7% 202.7 1.4% -205.7 -1.3% 501.4 0.8% * The Company has separated all its profit and loss line items of PDP business operations from the continuing operations and has reclassified them into a separate account called “Income from discontinued operations”, and also has restated the comparative information in conformity with the same classification in the current period. * Since this is not an audited nor reviewed report, content may be changed in the future if an auditor has a concern. 9 Appendix Summarized Financial Statements (Consolidated) Balance Sheet (Unit : KRW bn) 2013 1Q 2Q 3Q 4Q 1Q 2Q 3Q 4Q 37,146.6 37,192.8 36,413.3 35,528.1 37,158.2 37,433.8 38,503.5 37,068.4 18,301.5 18,067.5 17,423.8 16,325.1 18,204.5 18,446.6 19,320.8 17,482.7 Cash and cash equivalents 2,453.9 2,011.0 2,339.1 2,645.3 2,713.8 2,701.1 2,949.7 2,244.4 Accounts receivable 8,533.4 8,621.1 7,388.1 7,117.4 8,147.9 8,406.6 8,277.7 7,683.9 Inventory 5,525.3 5,524.0 5,857.1 4,838.8 5,572.6 5,548.8 6,288.1 5,711.3 Assets Current Assets Other Non-current Assets Investment 1,788.9 1,911.4 1,839.5 1,723.6 1,770.2 1,790.1 1,805.3 1,843.1 18,845.1 19,125.3 18,989.5 19,203.0 18,953.7 18,987.2 19,182.7 19,585.7 4,179.6 4,292.2 4,311.2 4,329.6 4,248.8 4,287.2 4,450.7 4,594.5 10,265.0 10,390.9 10,221.2 10,342.0 10,306.8 10,429.1 10,504.1 10,596.9 Intangible assets 1,221.6 1,262.7 1,283.9 1,363.7 1,335.2 1,330.3 1,309.4 1,394.3 Other 3,178.9 3,179.5 3,173.2 3,167.7 3,062.9 2,940.6 2,918.5 3,000.0 24,317.5 24,040.2 23,535.0 22,838.7 24,368.0 24,377.0 25,247.9 24,077.3 Accounts payable 6,989.3 6,819.4 6,533.1 5,691.1 6,875.7 6,725.1 7,404.9 6,741.7 Debt 9,396.9 8,902.2 8,974.3 9,211.0 9,654.0 9,524.0 9,429.7 9,002.4 Other 7,931.3 8,318.6 8,027.6 7,936.6 7,838.3 8,127.9 8,413.3 8,333.2 12,829.1 13,152.6 12,878.3 12,689.4 12,790.2 13,056.8 13,255.6 12,991.1 PP&E Liabilities Equity 2014 * Since this is not an audited nor reviewed report, content may be changed in the future if an auditor has a concern. 10 Appendix Divisional Sales (Consolidated) (Unit : KRW bn) 1Q'13 2Q'13 3Q'13 4Q'13 `13 Total 1Q'14 2Q'14 3Q'14 4Q'14 QoQ 20% YoY 0% -11% 5% -1% 1% -16% 9% 6% 18% `14 Total 4,489.1 23.4 0.5% 3,202.3 132.5 4.1% 2,806.1 101.7 3.6% 1,216.6 81.7 6.7% 857.3 -0.4 4,766.0 102.2 2.1% 3,123.1 61.2 2.0% 3,187.0 121.6 3.8% 1,733.5 171.0 9.9% 892.2 -9.9 4,522.3 109.5 2.4% 3,045.4 -79.7 -2.6% 2,966.8 108.7 3.7% 973.2 19.5 2.0% 809.7 -17.6 5,430.5 153.0 2.8% 3,591.5 -43.4 -1.2% 2,838.9 83.3 2.9% 719.7 7.3 1.0% 802.0 -16.3 19,207.9 388.1 2.0% 12,962.3 70.6 0.5% 11,798.8 415.3 3.5% 4,643.0 279.5 6.0% 3,361.2 -44.2 4,661.4 215.1 4.6% 3,407.0 -8.8 -0.3% 2,717.9 109.2 4.0% 1,220.1 89.8 7.4% 871.7 13.8 4,783.2 158.0 3.3% 3,620.3 85.9 2.4% 3,030.5 97.8 3.2% 1,635.0 164.2 10.0% 841.8 16.6 4,507.0 134.2 3.0% 4,247.0 167.4 3.9% 2,911.5 51.8 1.8% 925.6 -2.5 -0.3% 892.3 11.6 5,427.0 1.7 0.0% 3,783.1 67.4 1.8% 2,880.3 85.0 3.0% 781.4 3.6 0.5% 945.6 56.2 LGE Consolidated before including LG Innotek (①) Sales Op. Income (%) 12,571.4 338.9 2.7% 13,701.8 446.1 3.3% 12,317.4 140.4 1.1% 13,382.6 183.9 1.4% 51,973.2 1,109.3 2.1% 12,878.1 419.1 3.3% 13,910.8 522.5 3.8% 13,483.4 362.5 2.7% 13,817.4 213.9 1.5% 2% 3% 54,089.7 1,518.0 2.8% 4% LG Innotek earnings excluding internal transactions with LGE (②) Sales Op. Income 1,550.9 15.8 1,521.1 35.7 1,595.5 55.7 1,544.0 28.9 6,211.5 136.1 1,458.8 63.1 1,542.9 89.9 1,649.3 103.0 1,815.1 58.0 10% 18% 6,466.1 314.0 4% LGE earnings from LG innotek (③) Sales Op. Income 351.6 -0.7 340.2 -0.4 350.2 -1.0 370.4 -1.5 1,412.4 -3.6 348.1 3.4 386.8 2.7 419.7 0.5 360.4 -3.2 -14% -3% 1,515.0 3.4 7% LGE Consolidated (①+②-③) Sales Op. Income (%) 13,770.7 355.4 2.6% 14,882.7 482.2 3.2% 13,562.7 197.1 1.5% 14,556.2 214.3 1.5% 56,772.3 1,249.0 2.2% 13,988.8 478.8 3.4% 15,066.9 609.7 4.0% 14,713.0 465.0 3.2% 15,272.1 275.1 1.8% 4% 5% 59,040.8 1,828.6 3.1% 4% MC (Mobile Communications) HA (Home Appliance) AE (Air Conditioning & Energy Solution) Others 19,378.6 509.0 2.6% 15,057.4 311.9 2.1% 11,540.2 343.8 3.0% 4,562.1 255.1 5.6% 3,551.4 98.2 YoY 1% Sales Op. Income (%) Sales Op. Income (%) Sales Op. Income (%) Sales Op. Income (%) Sales Op. Income HE (Home Entertainment) 16% -2% -2% * The Company has separated all its profit and loss line items of PDP business operations from the continuing operations and has reclassified them into a separate account called “Income from discontinued operations”, and also has restated the comparative information in conformity with the same classification in the current period. * Since this is not an audited nor reviewed report, content may be changed in the future if an auditor has a concern. 6% 11


© Copyright 2026