
TOYOTA MOTOR CORP
February 5, 2015
NYSE: TM
TOYOTA MOTOR CORP
BUY
A+
A
A-
HOLD
B+
B
Annual Dividend Rate
$2.89
B-
C+
C
Annual Dividend Yield
2.17%
SELL
C-
D+
D
Beta
0.64
Sector: Consumer Goods & Svcs
TM BUSINESS DESCRIPTION
Toyota Motor Corporation designs, manufactures,
assembles, and sells passenger cars, minivans,
commercial vehicles, and related parts and
accessories in Japan, North America, Europe, Asia,
and internationally. It operates through Automotive,
Financial Services, and All Other segments.
Weekly Price: (US$)
D-
E+
E
E-
F
Market Capitalization
$226.7 Billion
BUY
52-Week Range
$103.38-$134.24
Sub-Industry: Automobile Manufacturers
SMA (50)
RATING SINCE
TARGET PRICE
SMA (100)
04/02/2012
$153.25
Price as of 2/4/2015
$132.68
Source: S&P
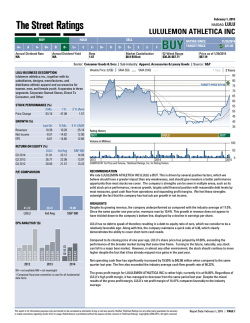
1 Year
2 Years
160
TARGET
TARGET
TARGETPRICE
PRICE
PRICE$153.25
$153.25
$153.25
TARGET
150
140
130
120
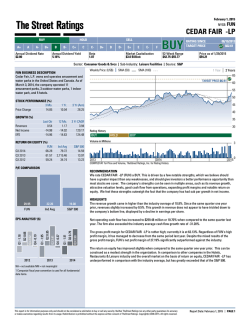
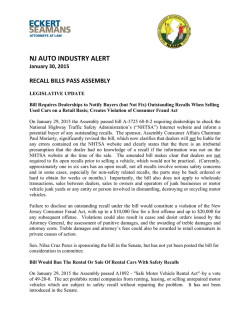
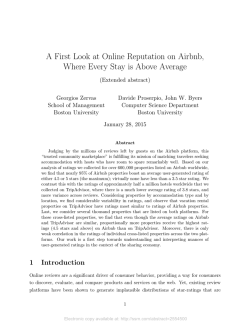
STOCK PERFORMANCE (%)
3 Mo.
Price Change
11.12
1 Yr.
17.94
3 Yr (Ann)
20.16
12 Mo.
3.02
2.18
2.20
3 Yr CAGR
2.14
95.53
94.55
110
100
90
GROWTH (%)
Last Qtr
-8.03
-4.33
-4.05
Revenues
Net Income
EPS
80
Rating History
BUY
Volume in Millions
5
RETURN ON EQUITY (%)
TM
12.93
12.76
6.77
Q3 2014
Q3 2013
Q3 2012
Ind Avg
6.95
7.74
8.41
S&P 500
14.59
13.97
13.23
3
2013
2014
2015
0
COMPUSTAT for Price and Volume, TheStreet Ratings, Inc. for Rating History
RECOMMENDATION
We rate TOYOTA MOTOR CORP (TM) a BUY. This is based on the convergence of positive investment
measures, which should help this stock outperform the majority of stocks that we rate. The company's
strengths can be seen in multiple areas, such as its attractive valuation levels, solid stock price performance,
notable return on equity and largely solid financial position with reasonable debt levels by most measures.
We feel these strengths outweigh the fact that the company has had sub par growth in net income.
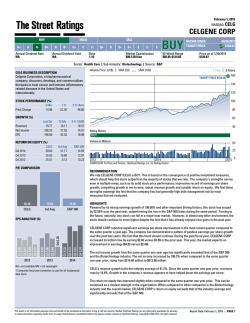
P/E COMPARISON
11.93
14.42
19.27
TM
Ind Avg
S&P 500
HIGHLIGHTS
TOYOTA MOTOR CORP' earnings per share from the most recent quarter came in slightly below the year
earlier quarter. This company has reported somewhat volatile earnings recently. But, we feel it is poised for
EPS growth in the coming year. During the past fiscal year, TOYOTA MOTOR CORP increased its bottom line
by earning $11.17 versus $6.46 in the prior year. This year, the market expects an improvement in earnings
($11.69 versus $11.17).
EPS ANALYSIS¹ ($)
2013
Q3 2.61
Q2 2.83
Q1 3.66
Q4 2.02
Q3 2.72
Q2 2.85
Q1 3.58
Q3 0.28
2012
Q4 1.73
Q2 2.15
Q1 2.30
Compared to where it was a year ago today, the stock is now trading at a higher level, regardless of the
company's weak earnings results. Turning our attention to the future direction of the stock, it goes without
saying that even the best stocks can fall in an overall down market. However, in any other environment, this
stock still has good upside potential despite the fact that it has already risen in the past year.
The return on equity has improved slightly when compared to the same quarter one year prior. This can be
construed as a modest strength in the organization. Compared to other companies in the Automobiles
industry and the overall market on the basis of return on equity, TOYOTA MOTOR CORP has outperformed in
comparison with the industry average, but has underperformed when compared to that of the S&P 500.
2014
NA = not available NM = not meaningful
1 Compustat fiscal year convention is used for all fundamental
data items.
Regardless of the drop in revenue, the company managed to outperform against the industry average of 8.9%.
Since the same quarter one year prior, revenues slightly dropped by 8.0%. Weakness in the company's
revenue seems to have hurt the bottom line, decreasing earnings per share.
This report is for information purposes only and should not be considered a solicitation to buy or sell any security. Neither TheStreet Ratings nor any other party guarantees its accuracy
or makes warranties regarding results from its usage. Redistribution is prohibited without the express written consent of TheStreet Ratings. Copyright(c) 2006-2015. All rights reserved.
Report Date: February 5, 2015
PAGE 1
February 5, 2015
NYSE: TM
TOYOTA MOTOR CORP
Sector: Consumer Goods & Svcs Automobile Manufacturers Source: S&P
Annual Dividend Rate
$2.89
Annual Dividend Yield
2.17%
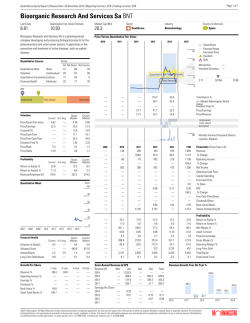
PEER GROUP ANALYSIS
140%
KNDI
V
FA
AB
OR
LE
R
VO
FA
HMC
LE
AB
-20%
UN
THO WGO
TM
2%
Price as of 2/4/2015
$132.68
Huge health care and fringe benefits provided to big three employees give foreign competitors a strong
advantage. All three are negotiating new labor contracts with the United Auto Workers (UAW) union. With
these on-going negotiations, the big three hope to reduce the profit-per-vehicle gap. Reduced sales, different
platforms for parts, high raw material costs and tough exchange rates are other hurdles facing the industry.
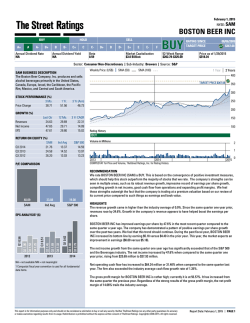
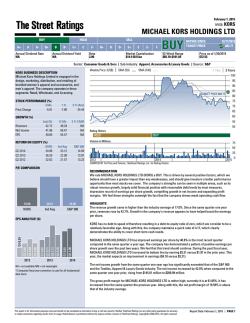
16%
EBITDA Margin (TTM)
Companies with higher EBITDA margins and
revenue growth rates are outperforming companies
with lower EBITDA margins and revenue growth
rates. Companies for this scatter plot have a market
capitalization between $573.7 Million and $226.7
Billion. Companies with NA or NM values do not
appear.
*EBITDA – Earnings Before Interest, Taxes, Depreciation and
Amortization.
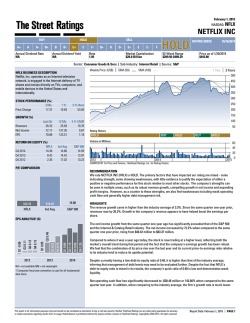
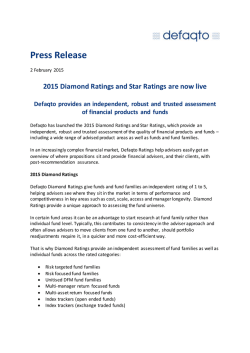
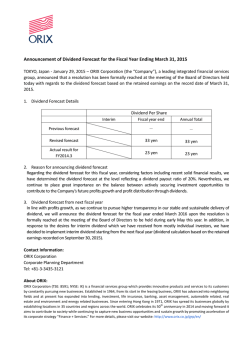
REVENUE GROWTH AND EARNINGS YIELD
Consumer choice in vehicles is more than ever being influenced by fuel efficiency. Automakers are exploring
alternate fuels such as ethanol and electric fuel cells and are delivering hybrid gasoline-electric vehicles and
pure-electric car for sale. The new cars are lighter, provide better fuel efficiency, enhanced safety features,
and many come with tax credits from the government to make costs competitive. Having an auto industry is
considered to be in the strategic interest of America and was bailed-out to help it survive the Great
Recession.
140%
V
FA
AB
OR
Manufacturers have recognized growing demand from developing economies and the opportunity to increase
auto parts sourcing from these economies.
LE
PEER GROUP: Automobiles
TSLA
UN
THO
R
VO
FA
LE
AB
-2%
US congress toughened the Corporate Average Fuel Economy (CAFE) regulations in 2007 that no longer grant
exemptions to light trucks classified as SUVs or passenger vans unless they exceed 10,000 lbs. In the near
future, the standard is to be modified to accommodate many larger vehicles.
The motorcycle industry is reeling under pressures such as volatile raw material costs, high gasoline prices
and reduced consumer spending. Harley’s heavy motorcycle sales have remained relatively flat, but light
motorcycle sales have been hurt by tough economic conditions.
KNDI
-20%
52-Week Range
$103.38-$134.24
Surging oil prices have shifted demand away from SUVs and light trucks to more fuel-efficient options. This
change in consumer preferences has supported German, Japanese and Korean manufacturers, whose
market share has consequently expanded. The big three are trying to adapt their product lines to changing
preferences.
TSLA
Revenue Growth (TTM)
Market Capitalization
$226.7 Billion
INDUSTRY ANALYSIS
The automobile industry is comprised of companies that design, manufacture, engineer, assemble and market
automobiles and motorcycles as well as provide leasing and financial services. Industry performance is
closely linked with overall economic performance. Major players include General Motors (GM), Ford Motor
Company (F) and Chrysler. This group is commonly referred to as Detroit’s big three. BMW, Daimler (DAI),
Honda (HMC), Hyundai, Mazda, Nissan, Subaru, Toyota (TM) and Harley-Davidson (HOG) are other prominent
players. There are also niche players such as Winnebago Industries (WGO) for motor- homes and Tesla
Motors (TSLA) for high-end electric cars.
REVENUE GROWTH AND EBITDA MARGIN*
Revenue Growth (TTM)
Beta
0.64
GM
F HOG
WGO
HMC
TM
10%
Earnings Yield (TTM)
Companies that exhibit both a high earnings yield
and high revenue growth are generally more
attractive than companies with low revenue growth
and low earnings yield. Companies for this scatter
plot have revenue growth rates between -1.6% and
138.8%. Companies with NA or NM values do not
appear.
Ticker
TM
KNDI
F
GM
WGO
HMC
THO
TSLA
HOG
Company Name
TOYOTA MOTOR CORP
KANDI TECHNOLOGIES GROUP
FORD MOTOR CO
GENERAL MOTORS CO
WINNEBAGO INDUSTRIES
HONDA MOTOR CO LTD
THOR INDUSTRIES INC
TESLA MOTORS INC
HARLEY-DAVIDSON INC
Recent
Price ($)
132.68
13.21
15.87
35.83
21.31
31.32
58.62
218.55
62.76
Market
Cap ($M)
226,750
611
59,954
57,699
574
56,734
3,130
27,402
13,447
Price/
Earnings
11.93
NM
20.35
21.85
13.15
10.65
17.60
NM
16.22
Net Sales
TTM ($M)
235,637.00
167.90
144,107.00
155,929.00
946.90
109,446.50
3,647.49
2,856.91
6,228.51
Net Income
TTM ($M)
17,613.00
-4.04
3,187.00
3,949.00
43.80
5,285.75
176.82
-202.68
844.61
The peer group comparison is based on Major Automobile Manufacturers companies of comparable size.
This report is for information purposes only and should not be considered a solicitation to buy or sell any security. Neither TheStreet Ratings nor any other party guarantees its accuracy
or makes warranties regarding results from its usage. Redistribution is prohibited without the express written consent of TheStreet Ratings. Copyright(c) 2006-2015. All rights reserved.
Report Date: February 5, 2015
PAGE 2
February 5, 2015
NYSE: TM
TOYOTA MOTOR CORP
Sector: Consumer Goods & Svcs Automobile Manufacturers Source: S&P
Annual Dividend Rate
$2.89
Annual Dividend Yield
2.17%
COMPANY DESCRIPTION
Toyota Motor Corporation designs, manufactures,
assembles, and sells passenger cars, minivans,
commercial vehicles, and related parts and accessories
in Japan, North America, Europe, Asia, and
internationally. It operates through Automotive, Financial
Services, and All Other segments. The company offers
hybrid cars under the Prius, Crown, Lexus RX450h,
HS250h, SAI, and CT200h brand names; conventional
engine vehicles, including subcompact and compact cars
under the Corolla, Yaris, micropremium iQ, Passo, Ractis,
Vitz, Corolla Axio/Fielder, Porte, Spade, Auris, Etios, and
Vios brand names; mini-vehicles, passenger vehicles,
commercial vehicles, and auto parts under the Toyota
brand name; mid-size cars under the Camry, REIZ,
Avensis, and Mark X brand names; luxury cars under the
Lexus and Crown brand names; Century limousines; and
sports cars under the Scion tC and Lexus brand names. It
also manufactures sport-utility vehicles under the
Sequoia, 4Runner, RAV4, Highlander, FJ Cruiser, Land
Cruiser, and Lexus brand names; pickup trucks under the
Tacoma and Tundra brand names; minivans under the
Alphard, Vellfire, Corolla Verso, Wish, Noah/Voxy,
Estima, Sienta, Isis, and the Sienna brand names; large,
medium, and small trucks; and large, small, and
micro-buses. Toyota Motor Corporation sells its products
through dealers. In addition, it provides a range of
financial services comprising retail financing, retail
leasing, wholesale financing, insurance, and credit cards.
Further, the company is involved in the design,
manufacture, and sale of prefabricated housing;
information technology related businesses, such a Web
portal for automobile information known as GAZOO.com;
and sale promotion of KDDI communication related
products, primarily the au brand. Toyota Motor
Corporation was founded in 1933 and is headquartered
in Toyota City, Japan.
TOYOTA MOTOR CORP
1 Toyota-cho
Toyota City 471-8571
JPN
Phone: 81 5 6528 2121
http://www.toyota.co.jp
Employees: 339000
Beta
0.64
Market Capitalization
$226.7 Billion
52-Week Range
$103.38-$134.24
Price as of 2/4/2015
$132.68
STOCK-AT-A-GLANCE
Below is a summary of the major fundamental and technical factors we consider when determining our
overall recommendation of TM shares. It is provided in order to give you a deeper understanding of our rating
methodology as well as to paint a more complete picture of a stock's strengths and weaknesses. It is
important to note, however, that these factors only tell part of the story. To gain an even more comprehensive
understanding of our stance on the stock, these factors must be assessed in combination with the stock’s
valuation. Please refer to our Valuation section on page 5 for further information.
FACTOR
SCORE
4.0
Growth
out of 5 stars
weak
Measures the growth of both the company's income statement and
cash flow. On this factor, TM has a growth score better than 70% of the
stocks we rate.
strong
4.5
Total Return
out of 5 stars
weak
Measures the historical price movement of the stock. The stock
performance of this company has beaten 80% of the companies we
cover.
strong
4.0
Efficiency
out of 5 stars
weak
Measures the strength and historic growth of a company's return on
invested capital. The company has generated more income per dollar of
capital than 70% of the companies we review.
strong
4.0
Price volatility
out of 5 stars
weak
Measures the volatility of the company's stock price historically. The
stock is less volatile than 70% of the stocks we monitor.
strong
3.0
Solvency
out of 5 stars
weak
Measures the solvency of the company based on several ratios. The
company is more solvent than 50% of the companies we analyze.
strong
4.0
Income
out of 5 stars
weak
Measures dividend yield and payouts to shareholders. The company's
dividend is higher than 70% of the companies we track.
strong
THESTREET RATINGS RESEARCH METHODOLOGY
TheStreet Ratings' stock model projects a stock's total return potential over a 12-month period including both
price appreciation and dividends. Our Buy, Hold or Sell ratings designate how we expect these stocks to
perform against a general benchmark of the equities market and interest rates. While our model is
quantitative, it utilizes both subjective and objective elements. For instance, subjective elements include
expected equities market returns, future interest rates, implied industry outlook and forecasted company
earnings. Objective elements include volatility of past operating revenues, financial strength, and company
cash flows.
Our model gauges the relationship between risk and reward in several ways, including: the pricing drawdown
as compared to potential profit volatility, i.e.how much one is willing to risk in order to earn profits; the level of
acceptable volatility for highly performing stocks; the current valuation as compared to projected earnings
growth; and the financial strength of the underlying company as compared to its stock's valuation as
compared to projected earnings growth; and the financial strength of the underlying company as compared
to its stock's performance. These and many more derived observations are then combined, ranked, weighted,
and scenario-tested to create a more complete analysis. The result is a systematic and disciplined method of
selecting stocks.
This report is for information purposes only and should not be considered a solicitation to buy or sell any security. Neither TheStreet Ratings nor any other party guarantees its accuracy
or makes warranties regarding results from its usage. Redistribution is prohibited without the express written consent of TheStreet Ratings. Copyright(c) 2006-2015. All rights reserved.
Report Date: February 5, 2015
PAGE 3
February 5, 2015
NYSE: TM
TOYOTA MOTOR CORP
Sector: Consumer Goods & Svcs Automobile Manufacturers Source: S&P
Annual Dividend Rate
$2.89
Annual Dividend Yield
2.17%
Consensus EPS Estimates² ($)
IBES consensus estimates are provided by Thomson Financial
NA
11.69 E
12.92 E
NA
2015(E)
2016(E)
Beta
0.64
Market Capitalization
$226.7 Billion
52-Week Range
$103.38-$134.24
Price as of 2/4/2015
$132.68
FINANCIAL ANALYSIS
TOYOTA MOTOR CORP's gross profit margin for the third quarter of its fiscal year 2014 has increased when
compared to the same period a year ago. Sales and net income have dropped, however the growth has
outpaced the average competitor within the industry. TOYOTA MOTOR CORP has weak liquidity. Currently,
the Quick Ratio is 0.83 which shows a lack of ability to cover short-term cash needs. The company's liquidity
has increased from the same period last year.
During the same period, stockholders' equity ("net worth") has remained unchanged from the same quarter
last year. Overall, the key liquidity measurements indicate that the company is in a position in which financial
difficulties could develop in the future.
STOCKS TO BUY: TheStreet Quant Ratings has identified a handful of stocks that can potentially TRIPLE in the
next 12-months. To learn more visit www.TheStreetRatings.com.
INCOME STATEMENT
Net Sales ($mil)
EBITDA ($mil)
EBIT ($mil)
Net Income ($mil)
Q3 FY14
49,788.00
7,898.00
5,318.00
4,133.00
Q3 FY13
54,131.00
7,492.00
4,860.00
4,320.00
Q3 FY14
37,886.00
389,839.00
160,619.00
136,137.00
Q3 FY13
33,948.00
384,970.00
155,563.00
135,013.00
Q3 FY14
25.47%
15.86%
10.68%
0.60
4.51%
12.93%
Q3 FY13
23.59%
13.84%
8.98%
0.59
4.47%
12.76%
Q3 FY14
1.06
0.54
54.00
98.48
Q3 FY13
1.05
0.54
47.00
103.40
Q3 FY14
1,573
0.00
2.61
86.56
NA
363,043
Q3 FY13
1,585
0.00
2.72
85.20
NA
364,719
BALANCE SHEET
Cash & Equiv. ($mil)
Total Assets ($mil)
Total Debt ($mil)
Equity ($mil)
PROFITABILITY
Gross Profit Margin
EBITDA Margin
Operating Margin
Sales Turnover
Return on Assets
Return on Equity
DEBT
Current Ratio
Debt/Capital
Interest Expense
Interest Coverage
SHARE DATA
Shares outstanding (mil)
Div / share
EPS
Book value / share
Institutional Own %
Avg Daily Volume
2 Sum of quarterly figures may not match annual estimates due to
use of median consensus estimates.
This report is for information purposes only and should not be considered a solicitation to buy or sell any security. Neither TheStreet Ratings nor any other party guarantees its accuracy
or makes warranties regarding results from its usage. Redistribution is prohibited without the express written consent of TheStreet Ratings. Copyright(c) 2006-2015. All rights reserved.
Report Date: February 5, 2015
PAGE 4
February 5, 2015
NYSE: TM
TOYOTA MOTOR CORP
Sector: Consumer Goods & Svcs Automobile Manufacturers Source: S&P
Annual Dividend Rate
$2.89
Annual Dividend Yield
2.17%
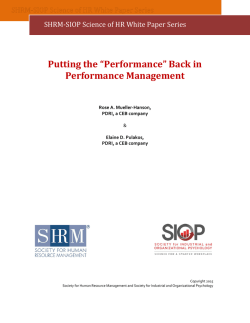
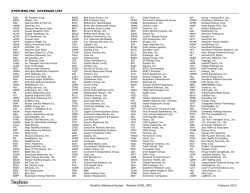
RATINGS HISTORY
Our rating for TOYOTA MOTOR CORP has not
changed since 4/2/2012. As of 2/4/2015, the stock
was trading at a price of $132.68 which is 1.2%
below its 52-week high of $134.24 and 28.3% above
its 52-week low of $103.38.
2 Year Chart
Beta
0.64
BUY: $98.13
$140
Price/Earnings
$120
$110
52-Week Range
$103.38-$134.24
1
2
3
premium
4
5
TM 11.93
Peers 14.42
• Discount. A lower P/E ratio than its peers can
signify a less expensive stock or lower growth
expectations.
• TM is trading at a discount to its peers.
Price/Projected Earnings
From
Buy
To
Buy
RATINGS DEFINITIONS &
DISTRIBUTION OF THESTREET RATINGS
3
47.33% Buy - We believe that this stock has the
opportunity to appreciate and produce a total return of
more than 10% over the next 12 months.
29.84% Hold - We do not believe this stock offers
conclusive evidence to warrant the purchase or sale of
shares at this time and that its likelihood of positive total
return is roughly in balance with the risk of loss.
22.83% Sell - We believe that this stock is likely to
decline by more than 10% over the next 12 months, with
the risk involved too great to compensate for any
possible returns.
4
5
Price/Book
1
2
3
premium
4
5
Price/Sales
1
2
premium
3
4
5
Price to Earnings/Growth
4
5
discount
1
2
3
premium
4
5
discount
TM 2.55
Peers 1.99
• Premium. The PEG ratio is the stock’s P/E divided by
the consensus estimate of long-term earnings
growth. Faster growth can justify higher price
multiples.
• TM trades at a significant premium to its peers.
Earnings Growth
1
2
3
4
lower
5
higher
TM 2.20
Peers 22.31
• Lower. Elevated earnings growth rates can lead to
capital appreciation and justify higher
price-to-earnings ratios.
• However, TM is expected to significantly trail its
peers on the basis of its earnings growth rate.
Sales Growth
discount
TM 0.89
Peers 1.24
• Discount. In the absence of P/E and P/B multiples,
the price-to-sales ratio can display the value
investors are placing on each dollar of sales.
• TM is trading at a significant discount to its
industry on this measurement.
3
TM 7.21
Peers 17.66
• Discount. The P/CF ratio, a stock’s price divided by
the company's cash flow from operations, is useful
for comparing companies with different capital
requirements or financing structures.
• TM is trading at a significant discount to its peers.
discount
TM 1.53
Peers 3.39
• Discount. A lower price-to-book ratio makes a
stock more attractive to investors seeking stocks
with lower market values per dollar of equity on the
balance sheet.
• TM is trading at a significant discount to its peers.
2
premium
discount
TM 10.27
Peers 31.32
• Discount. A lower price-to-projected earnings ratio
than its peers can signify a less expensive stock or
lower future growth expectations.
• TM is trading at a significant discount to its peers.
(as of 2/4/2015)
Research Contact: 212-321-5381
Sales Contact: 866-321-8726
2
premium
Price reflects the closing price as of the date listed, if available
TheStreet Ratings
14 Wall Street, 15th Floor
New York, NY 10005
www.thestreet.com
1
1
Price/CashFlow
discount
2014
MOST RECENT RATINGS CHANGES
Date
Price
Action
2/1/13
$98.13 No Change
Price as of 2/4/2015
$132.68
VALUATION
BUY. This stock's P/E ratio indicates a discount compared to an average of 14.42 for the Automobiles industry
and a discount compared to the S&P 500 average of 19.27. To use another comparison, its price-to-book ratio
of 1.53 indicates a discount versus the S&P 500 average of 2.72 and a significant discount versus the industry
average of 3.39. The current price-to-sales ratio is well below the S&P 500 average and is also below the
industry average, indicating a discount. Upon assessment of these and other key valuation criteria, TOYOTA
MOTOR CORP proves to trade at a discount to investment alternatives within the industry.
$130
2013
Market Capitalization
$226.7 Billion
1
2
3
lower
4
5
higher
TM 3.02
Peers 6.73
• Lower. A sales growth rate that trails the industry
implies that a company is losing market share.
• TM significantly trails its peers on the basis of sales
growth
DISCLAIMER:
The opinions and information contained herein have been obtained or derived from sources believed to be reliable, but
TheStreet Ratings cannot guarantee its accuracy and completeness, and that of the opinions based thereon. Data is provided
via the COMPUSTAT® Xpressfeed product from Standard &Poor's, a division of The McGraw-Hill Companies, Inc., as well as
other third-party data providers.
TheStreet Ratings is a division of TheStreet, Inc., which is a publisher. This research report contains opinions and is provided
for informational purposes only. You should not rely solely upon the research herein for purposes of transacting securities or
other investments, and you are encouraged to conduct your own research and due diligence, and to seek the advice of a
qualified securities professional, before you make any investment. None of the information contained in this report constitutes,
or is intended to constitute a recommendation by TheStreet Ratings of any particular security or trading strategy or a
determination by TheStreet Ratings that any security or trading strategy is suitable for any specific person. To the extent any of
the information contained herein may be deemed to be investment advice, such information is impersonal and not tailored to the
investment needs of any specific person. Your use of this report is governed by TheStreet, Inc.'s Terms of Use found at
http://www.thestreet.com/static/about/terms-of-use.html.
This report is for information purposes only and should not be considered a solicitation to buy or sell any security. Neither TheStreet Ratings nor any other party guarantees its accuracy
or makes warranties regarding results from its usage. Redistribution is prohibited without the express written consent of TheStreet Ratings. Copyright(c) 2006-2015. All rights reserved.
Report Date: February 5, 2015
PAGE 5


© Copyright 2026