
proprietary research stoxx 600 earnings outlook
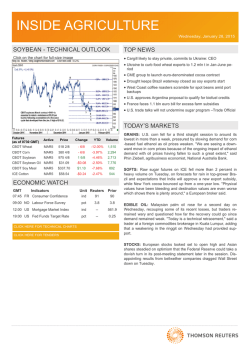
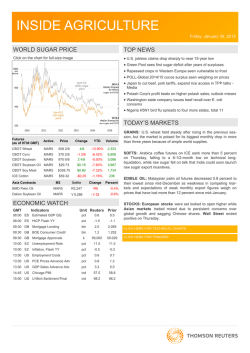
PROPRIETARY RESEARCH EARNINGS AGGREGATES REPORTING ANALYST: Greg Harrison Media Questions/Earnings Hotline: 617-856-2459 PR team: 646-223-5985 January 29, 2015 [email protected] STOXX 600 EARNINGS OUTLOOK EUROPEAN AGGREGATE ESTIMATES AND REVISIONS Fourth quarter earnings are expected to grow 27.0% from Q4 2013. Fourth quarter revenue is expected to decline 3.8% from Q4 2013. 20 companies in the STOXX 600 have reported earnings to date for Q4 2014. Of these, 75% reported earnings above analyst estimates. In a typical quarter 48% beat analyst EPS estimates. 24 companies in the STOXX 600 have reported revenue to date for Q4 2014. Of these, 46% reported revenue above analyst estimates. In a typical quarter 53% beat analyst revenue estimates. The forward P/E ratio for the STOXX 600 is 15.0. There are 47 STOXX 600 companies with quarterly estimates expected to report Q4 2014 earnings during the week of February 2. SECTION A: EARNINGS OUTLOOK Q4 2014: EARNINGS REVISIONS Exhibit 1A. STOXX 600: Q4 2014 Earnings Growth Estimate Trend 29.0% 28.0% 27.0% 26.0% 25.0% 24.0% 4/9 4/2 3/26 3/19 3/12 3/5 2/26 2/19 2/12 2/5 1/29 1/22 1/15 1/8 1/1 12/25 12/18 12/11 23.0% Source: Thomson Reuters I/B/E/S STOXX 600 Earnings Outlook provides analysis and commentary on aggregate earnings estimate revisions, growth rates and valuations for companies in the STOXX Europe 600 index. View all Thomson Reuters Proprietary Research subscription channels. All data sourced from Thomson Reuters Eikon, a complete solution for research and analytics. It places the most comprehensive market information, news, analytics and trading tools available into a desktop as simple to use as the Internet. Thomson Reuters Eikon clients can run fundamental and technical screens against a global dataset representing more than 100 countries and over 200,000 securities. Learn more. Request a free trial of Thomson Reuters Eikon today. © 2014 Thomson Reuters. All marks herein are used under license. THOMSON REUTERS PROPRIETARY RESEARCH STOXX 600 EARNINGS OUTLOOK JANUARY 29, 2015 Q4 2014: EARNINGS SCORECARDS Exhibit 2A. STOXX 600: Q4 2014 Earnings vs. Expectations Sector Basic Materials Above % Match % 0% Cyclical Consumer Goods & Services Non-Cyclical Consumer Goods & Services Below % 100% Surprise Reported Factor % Total # 0% Cos. w/ Ests. Total # 0% 1 33 29 100% 0% 0% 5% 3 0% 0% 100% -13% 1 12 - - - - 0 19 Energy Financials 75% 0% 25% 11% 4 68 Healthcare 67% 33% 0% 11% 3 23 Industrials 67% 0% 33% -10% 3 48 Technology 100% 0% 0% 7% 5 14 Telecommunications Services - - - - 0 17 Utilities - - - - 0 8 75.0% 10.0% 15.0% 6% 20 271 STOXX 600 Source: Thomson Reuters I/B/E/S Through January 29, 20 companies in the STOXX 600 Index reported earnings for Q4 2014. Of these, 75.0% reported earnings above analyst estimates, 10.0% reported earnings in line with analyst estimates, and 15.0% reported earnings below analyst estimates. In a typical quarter (since 2011), 48% of companies beat estimates, 8% match and 44% miss estimates. Over the past four quarters, 48% of companies beat the estimates, 8% matched and 44% missed estimates. In aggregate, companies are reporting earnings that are 6% above estimates, which is above the 4% longterm (since 2011) average surprise factor, and is above the 5% surprise factor recorded over the past four quarters. Exhibit 3A. STOXX 600: Full Year 2013 Earnings vs. Expectations Reported Sector Above % Match % Below % Cos. w/ Ests. Total # Total # Basic Materials 57% 2% 41% 51 52 Cyclical Consumer Goods & Services 51% 7% 41% 68 70 Non-Cyclical Consumer Goods & Services 58% 10% 32% 31 33 Energy 44% 9% 47% 32 32 Financials 59% 5% 36% 118 120 Healthcare 65% 3% 32% 31 33 Industrials 51% 8% 41% 103 108 Technology 55% 5% 40% 20 22 Telecommunications Services 57% 0% 43% 23 25 Utilities STOXX 600 65% 12% 24% 17 17 55.5% 6.1% 38.5% 494 512 Source: Thomson Reuters I/B/E/S © 2014 Thomson Reuters. All marks herein are used under license. TRPR_83201_66 2 THOMSON REUTERS PROPRIETARY RESEARCH STOXX 600 EARNINGS OUTLOOK JANUARY 29, 2015 Q4 2014: REVENUE SCORECARDS Exhibit 4A. STOXX 600: Q4 2014 Revenue vs. Expectations Sector Basic Materials Above % Match % 0% Cyclical Consumer Goods & Services Below % 0% Surprise Reported Factor % Total # 100% Cos. w/ Ests. Total # 0% 1 32 34 50% 0% 50% 0% 4 0% 0% 100% -10% 4 21 - - - - 0 19 Financials 75% 0% 25% 1% 4 66 Healthcare 33% 0% 67% 0% 3 25 Industrials 67% 0% 33% 1% 3 54 Technology 60% 0% 40% 0% 5 14 Telecommunications Services - - - - 0 17 Utilities - - - - 0 4 45.8% 0.0% 54.2% -3% 24 286 Non-Cyclical Consumer Goods & Services Energy STOXX 600 Source: Thomson Reuters I/B/E/S Through January 29, 24 companies in the STOXX 600 Index reported revenues for Q4 2014. Of these, 20.0% beat analyst expectations. In aggregate, companies are reporting revenues that are 3% below estimates. Exhibit 5A. STOXX 600: Full Year 2013 Revenue vs. Expectations Reported Sector Above % Match % Below % Cos. w/ Ests. Total # Total # Basic Materials 34% 0% 66% 50 52 Cyclical Consumer Goods & Services 52% 3% 45% 67 70 Non-Cyclical Consumer Goods & Services 19% 0% 81% 31 33 Energy 34% 0% 66% 32 32 Financials 48% 0% 52% 118 120 Healthcare 45% 0% 55% 31 33 Industrials 40% 0% 60% 103 108 Technology 50% 0% 50% 20 22 Telecommunications Services 35% 0% 65% 23 25 Utilities STOXX 600 59% 0% 41% 17 17 42.5% 0.4% 57.1% 492 512 Source: Thomson Reuters I/B/E/S © 2014 Thomson Reuters. All marks herein are used under license. TRPR_83201_66 3 THOMSON REUTERS PROPRIETARY RESEARCH STOXX 600 EARNINGS OUTLOOK JANUARY 29, 2015 Q4 2014: EARNINGS GROWTH RATES Exhibit 6A. STOXX 600: Q4 2014 Earnings Growth (Based on 271 Companies with Estimates) Sector Earnings $B Q414 Earnings $B Q413 Growth $B Q414 Growth % Q414 Basic Materials 5.5 3.9 1.6 41.1% Cyclical Consumer Goods & Services 9.3 8.1 1.2 14.6% Non-Cyclical Consumer Goods & Services 4.3 5.2 -0.9 -17.6% Energy 12.0 14.7 -2.8 -18.8% Financials 24.4 3.6 20.7 570.7% Healthcare 13.3 13.7 -0.4 -2.7% Industrials 8.8 9.2 -0.5 -4.9% Technology 4.2 3.8 0.5 11.9% Telecommunication Services 3.1 3.7 -0.6 -16.5% Utilities 1.2 1.7 -0.6 -34.0% 85.9 67.7 18.2 27.0% STOXX 600 Source: Thomson Reuters I/B/E/S The estimated earnings growth rate for the STOXX 600 for Q4 2014 is 27.0%. The STOXX 600 expects to see share-weighted earnings of $85.9B in Q4 2014, compared to share-weighted earnings of $67.7B (based on the year-ago earnings of the current constituents) in Q4 2013. Four of the ten sectors in the index expect to see an improvement in earnings relative to Q4 2013. The Financials sector has the highest earnings growth rate for the quarter, while the Utilities sector has the weakest anticipated growth compared to Q4 2013. The Financials sector has the highest earnings growth rate (570.7%) of any sector. It is expected to earn $24.4B in Q4 2014, compared to earnings of $3.6B in Q4 2013. Two of the four industry groups in the sector are anticipated to see higher earnings than a year ago. The Banking Services industry group has the highest growth rate within the sector. The Utilities sector has the lowest growth rate (-34.0%) of any sector. It is expected to earn $1.2B in Q4 2014, relative to earnings of $1.7B in Q4 2013. Exhibit 7A. STOXX 600: Full Year 2014 Earnings Growth (Based on 508 Companies with Estimates) Sector Earnings $B Earnings $B Growth $B 2014 2013 2014 Growth % 2014 Basic Materials 39.9 37.3 2.6 7.0% Cyclical Consumer Goods & Services 62.9 57.9 5.0 8.7% Non-Cyclical Consumer Goods & Services 53.2 51.6 1.6 3.1% Energy 68.6 72.3 -3.8 -5.2% Financials 152.0 142.2 9.8 6.9% Healthcare 67.1 67.4 -0.3 -0.4% Industrials 62.4 58.6 3.8 6.5% Technology 14.6 10.8 3.8 35.6% Telecommunications Services 24.3 29.1 -4.8 -16.4% 27.5 34.1 -6.6 -19.4% 572.5 561.3 11.2 2.0% Utilities STOXX 600 Source: Thomson Reuters I/B/E/S © 2014 Thomson Reuters. All marks herein are used under license. TRPR_83201_66 4 THOMSON REUTERS PROPRIETARY RESEARCH STOXX 600 EARNINGS OUTLOOK JANUARY 29, 2015 Q4 2014: REVENUE GROWTH RATES Exhibit 8A. STOXX 600: Q4 2014 Revenue Growth (Based on 278 Companies with Estimates) Sector Revenue $B Revenue $B Growth $B Q414 Q413 Q414 Basic Materials Growth % Q414 105.8 105.5 0.3 0.3% Cyclical Consumer Goods & Services 233.1 223.0 10.1 4.5% Non-Cyclical Consumer Goods & Services 102.7 100.2 2.5 2.5% Energy 303.5 379.8 -76.3 -20.1% Financials 228.9 216.1 12.8 5.9% Healthcare 88.6 86.1 2.5 2.9% Industrials 229.2 227.7 1.4 0.6% 31.1 33.1 -2.0 -6.2% Technology Telecommunications Services 62.4 62.6 -0.2 -0.3% Utilities 56.3 64.4 -8.1 -12.6% 1,441.5 1,498.5 -57.0 -3.8% STOXX 600 Source: Thomson Reuters I/B/E/S The estimated revenue growth rate for the STOXX 600 for Q4 2014 is -3.8%. The STOXX 600 is expected to earn revenues of $1,441.5B in Q4 2014 compared to $1,498.5B in Q4 2013. Six of the ten sectors anticipate revenue growth for the quarter. The Financials sector is expected to have the highest revenue growth rate for the quarter, while the Energy sector is expected to have the lowest revenue growth rate. The Financials sector expects the highest revenue growth rate (5.9%) for the quarter. It is expected to generate sales of $228.9B in Q4 2014, compared to sales of $216.1B in Q4 2013. The Energy sector has the lowest revenue growth rate at (-20.1%). The sector is expected to post sales of $303.5B in Q4 2014, relative to sales of $3779.8B in Q4 2013. Exhibit 9A. STOXX 600: Full Year 2014 Revenue Growth (Based on 507 Companies with Estimates) Sector Revenue $B Revenue $B Growth $B 2014 2013 2014 Growth % 2014 Basic Materials 608.0 613.5 -5.5 Cyclical Consumer Goods & Services 1,252.1 1,212.7 39.4 3.2% 747.4 748.4 -1.0 -0.1% Energy 1,701.8 1,776.7 -74.8 -4.2% Financials 1.8% Non-Cyclical Consumer Goods & Services -0.9% 1,463.3 1,438.1 25.2 Healthcare 401.6 397.0 4.6 1.2% Industrials 1,287.3 1,296.5 -9.1 -0.7% Technology 138.8 147.9 -9.2 -6.2% Telecommunications Services 336.0 360.2 -24.2 -6.7% 651.1 689.5 -38.4 -5.6% 8,587.4 8,680.5 -93.1 -1.1% Utilities STOXX 600 Source: Thomson Reuters I/B/E/S © 2014 Thomson Reuters. All marks herein are used under license. TRPR_83201_66 5 THOMSON REUTERS PROPRIETARY RESEARCH STOXX 600 EARNINGS OUTLOOK JANUARY 29, 2015 Q4 2014: EARNINGS GROWTH RATES BY COUNTRY Exhibit 10A. STOXX 600: Q4 2014 Earnings Growth Rate Estimates by Country Luxembourg Ireland Great Britain Finland Bermuda STOXX 600 Spain Sweden Jersey Netherlands Germany Czech Republic Belgium Switzerland France Norway Denmark ‐40% ‐20% 0% 20% 40% 60% 80% 100% 120% Source: Thomson Reuters I/B/E/S Analysts expect positive earnings growth from 15 of the 22 countries represented in the STOXX 600 index. Luxembourg (99%) and Ireland (96%) have the highest estimated earnings growth rates, while Denmark (-28%) and Norway (-16%) have the lowest estimated growth. © 2014 Thomson Reuters. All marks herein are used under license. TRPR_83201_66 6 THOMSON REUTERS PROPRIETARY RESEARCH STOXX 600 EARNINGS OUTLOOK JANUARY 29, 2015 FORWARD FOUR-QUARTER P/E RATIO Exhibit 11A. STOXX 600: Forward P/E Ratio P/E Ratio Number of Companies CY 2015 15.1 508 Forward 15.0 508 CY 2016 13.5 508 Source: Thomson Reuters I/B/E/S The forward P/E ratio for the STOXX 600 is 15.0. Q4 2014 – Q3 2015: EARNINGS GROWTH The estimated earnings growth rates for the STOXX 600 for Q4 2014 through Q3 2015 are 27%, 0%, 6% and 7%, respectively. For sector-level growth rates for Q4 2014 through Q3 2015, see Exhibits 2C-5C in this report. EARNINGS CALENDAR The next several weeks will see companies report earnings for Q4 2014. There are 47 STOXX 600 companies with quarterly estimates scheduled to report Q4 2014 earnings during the week of February 2. Exhibit 12A. Number of Companies Reporting Q4 2014 Earnings Q4 2014 STOXX 600 Reported Report Report Report To Date This Week Next Week Remaining 20 47 53 151 Source: Thomson Reuters StreetEvents. © 2014 Thomson Reuters. All marks herein are used under license. TRPR_83201_66 7 THOMSON REUTERS PROPRIETARY RESEARCH STOXX 600 EARNINGS OUTLOOK JANUARY 29, 2015 SECTION B: EARNINGS CALENDAR MONDAY: FEBRUARY 2 Exhibit 1B. Monday Earnings Calendar Date 2/2/2015 2/2/2015 2/2/2015 2/2/2015 2/2/2015 2/2/2015 2/2/2015 Ticker BCP.LS BION.S BKIA.MC RYA.I ZOT.MC GIVN.VX LVMH.PA Company BANCO COMR.PORTUGUES 'R' BB BIOTECH N BANKIA RYANAIR HOLDINGS ZARDOYA OTIS GIVAUDAN 'N' LVMH Qtr/Semi QTR QTR QTR QTR QTR SEMI SEMI Est Yr Ago % Dif 0.00 -0.01 0.02 0.01 -0.03 Source: Thomson Reuters StreetEvents. © 2014 Thomson Reuters. All marks herein are used under license. TRPR_83201_66 8 N/A NA NA -133.3 NA NA NA THOMSON REUTERS PROPRIETARY RESEARCH STOXX 600 EARNINGS OUTLOOK JANUARY 29, 2015 TUESDAY: FEBRUARY 3 Exhibit 2B. Tuesday Earnings Calendar Date 2/3/2015 2/3/2015 2/3/2015 2/3/2015 2/3/2015 2/3/2015 2/3/2015 2/3/2015 2/3/2015 Ticker ALFA.ST AZN.L BG.L BILL.ST BP.L SAN.MC SWEDa.ST UPM1V.HE BAER.VX Company ALFA LAVAL ASTRAZENECA BG GROUP BILLERUD KORSNAS BP BANCO SANTANDER SWEDBANK 'A' UPM-KYMMENE JULIUS BAR GRUPPE Qtr/Semi QTR QTR QTR QTR QTR QTR QTR QTR SEMI Est 0.32 0.84 0.16 0.20 0.09 0.13 0.46 0.29 Yr Ago % Dif 0.29 1.23 0.33 0.08 0.15 0.09 0.43 0.31 Source: Thomson Reuters StreetEvents. © 2014 Thomson Reuters. All marks herein are used under license. TRPR_83201_66 9 10.3 -31.7 -51.5 150.0 -40.0 44.4 7.0 -6.5 NA THOMSON REUTERS PROPRIETARY RESEARCH STOXX 600 EARNINGS OUTLOOK JANUARY 29, 2015 WEDNESDAY: FEBRUARY 4 Exhibit 3B. Wednesday Earnings Calendar Date 2/4/2015 2/4/2015 2/4/2015 2/4/2015 2/4/2015 2/4/2015 2/4/2015 2/4/2015 2/4/2015 2/4/2015 2/4/2015 2/4/2015 2/4/2015 Ticker BBVA.MC FUM1V.HE GJFS.OL GSK.L KPN.AS LUPE.ST MHG.OL MTGb.ST NES1V.HE ORNBV.HE SECUb.ST SHBa.ST STERV.HE Company BBV.ARGENTARIA FORTUM GJENSIDIGE FORSIKRING GLAXOSMITHKLINE KPN KON LUNDIN PETROLEUM MARINE HARVEST MODERN TIMES GP.MTG 'B' NESTE OIL ORION 'B' SECURITAS 'B' SVENSKA HANDBKN.'A' STORA ENSO 'R' Qtr/Semi QTR QTR QTR QTR QTR QTR QTR QTR QTR QTR QTR QTR QTR Est 0.14 0.35 0.18 0.40 -0.05 -0.12 0.21 0.74 0.69 0.37 0.21 0.71 0.15 Yr Ago % Dif 0.14 0.51 0.29 0.46 -0.02 0.08 0.24 0.71 0.79 0.45 0.18 0.66 0.17 Source: Thomson Reuters StreetEvents. © 2014 Thomson Reuters. All marks herein are used under license. TRPR_83201_66 10 0.0 -31.4 -37.9 -13.0 150.0 -250.0 -12.5 4.2 -12.7 -17.8 16.7 7.6 -11.8 THOMSON REUTERS PROPRIETARY RESEARCH STOXX 600 EARNINGS OUTLOOK JANUARY 29, 2015 THURSDAY: FEBRUARY 5 Exhibit 4B. Thursday Earnings Calendar Date 2/5/2015 2/5/2015 2/5/2015 2/5/2015 2/5/2015 2/5/2015 2/5/2015 2/5/2015 2/5/2015 2/5/2015 2/5/2015 2/5/2015 2/5/2015 2/5/2015 2/5/2015 2/5/2015 2/5/2015 2/5/2015 Ticker ABBN.VX AMEAS.HE BNPP.PA DAIGn.DE DAST.PA DNB.OL MEO1V.HE NRE1V.HE ORK.OL SASY.PA SCMN.VX SN.L TDC.CO TGS.OL VOLVb.ST HRGV.L SGEF.PA SYNN.VX Company ABB LTD N AMER SPORTS BNP PARIBAS DAIMLER DASSAULT SYSTEMES DNB METSO NOKIAN RENKAAT ORKLA SANOFI SWISSCOM 'R' SMITH & NEPHEW TDC TGS-NOPEC GEOPHS. VOLVO 'B' HARGREAVES LANSDOWN VINCI SYNGENTA Qtr/Semi QTR QTR QTR QTR QTR QTR QTR QTR QTR QTR QTR QTR QTR QTR QTR SEMI SEMI SEMI Est 0.35 0.48 1.15 1.83 0.66 0.38 0.58 0.47 0.09 1.56 9.12 0.25 0.15 0.73 0.16 Yr Ago % Dif 0.34 0.36 1.24 1.74 0.57 0.44 0.65 -0.34 0.04 1.55 8.96 0.23 0.16 0.86 0.06 Source: Thomson Reuters StreetEvents. © 2014 Thomson Reuters. All marks herein are used under license. TRPR_83201_66 11 2.9 33.3 -7.3 5.2 15.8 -13.6 -10.8 -238.2 125.0 0.6 1.8 8.7 -6.3 -15.1 166.7 NA NA NA THOMSON REUTERS PROPRIETARY RESEARCH STOXX 600 EARNINGS OUTLOOK JANUARY 29, 2015 FRIDAY: FEBRUARY 6 Exhibit 5B. Friday Earnings Calendar Date 2/6/2015 2/6/2015 2/6/2015 2/6/2015 2/6/2015 2/6/2015 2/6/2015 2/6/2015 2/6/2015 2/6/2015 2/6/2015 2/6/2015 Ticker ALUA.PA COFB.BR DANSKE.C O DSV.CO FGP.L HEXAb.ST HPOLb.ST HUSQb.ST INDUa.ST STL.OL NUO.AS UMI.BR Company Qtr/Semi Est Yr Ago % Dif ALCATEL-LUCENT COFINIMMO QTR QTR 0.07 1.70 0.12 1.67 -41.7 1.8 DANSKE BANK DSV 'B' FIRST GROUP HEXAGON 'B' HEXPOL 'B' HUSQVARNA 'B' INDUSTRIVARDEN 'A' STATOIL NUTRECO UMICORE QTR QTR QTR QTR QTR QTR QTR QTR SEMI SEMI 0.43 0.43 0.29 0.41 0.40 1.00 -0.04 0.33 0.90 -0.06 0.33 0.60 48.3 4.9 NA 21.2 11.1 -33.3 NA -45.0 NA NA Source: Thomson Reuters StreetEvents. © 2014 Thomson Reuters. All marks herein are used under license. TRPR_83201_66 12 THOMSON REUTERS PROPRIETARY RESEARCH STOXX 600 EARNINGS OUTLOOK JANUARY 29, 2015 SECTION C: EARNINGS DATA TABLES Exhibit 1C. STOXX 600: Q4 2014 Earnings Scorecard Sector Basic Materials Cyclical Consumer Goods & Services Non-Cyclical Consumer Goods & Services Energy Financials Healthcare Industrials Technology Telecommunications Services Utilities STOXX 600 Above 0% 100% 0% 75% 67% 67% 100% 75.0% Match 100% 0% 0% 0% 33% 0% 0% 10.0% Below 0% 0% 100% 25% 0% 33% 0% 15.0% Surprise 0% 5% -13% 11% 11% -10% 7% 6% Reported 1 3 1 0 4 3 3 5 0 0 20 Index 33 29 12 19 68 23 48 14 17 8 271 Source: Thomson Reuters I/B/E/S Exhibit 2C. STOXX 600: Q4 2014 Earnings Growth Sector Basic Materials Cyclical Consumer Goods & Services Non-Cyclical Consumer Goods & Services Energy Financials Healthcare Industrials Technology Telecommunications Services Utilities STOXX 600 Number of Companies Included in Estimate Today 41.1% 14.6% -17.6% -18.8% 570.7% -2.7% -4.9% 11.9% -16.5% -34.0% 27.0% 271 1 Jan 43.1% 22.7% -15.4% -12.9% 371.3% -3.6% -3.0% 5.6% -36.2% -0.9% 27.0% 269 1 Oct 49.5% 19.3% -14.0% 14.0% 297.5% -1.8% 31.9% 7.4% -17.9% 18.1% 39.7% 257 1 Jul 23.6% 23.6% 11.6% 17.1% 221.3% 3.1% 28.2% 11.7% -21.9% -18.0% 39.9% 247 1 Apr 17.6% 20.5% 45.1% 23.8% 101.4% 6.7% 31.8% 16.9% 24.7% -12.9% 32.8% 200 Today 77.8% -12.9% 16.2% -52.8% 40.2% 0.0% 21.6% 21.1% 28.9% -29.4% 0.4% 168 1 Jan 47.8% 4.0% 16.6% -41.1% 39.0% -0.4% 17.3% 25.9% 25.2% -23.5% 2.0% 152 1 Oct 46.2% 17.0% 58.3% -6.9% 31.1% -6.6% 34.1% 28.5% 24.3% -21.3% 16.8% 138 1 Jul 28.8% 21.9% 80.9% -4.9% 36.4% 15.0% 43.7% 38.8% 88.9% -8.3% 21.3% 125 1 Apr 17.3% 30.3% 9.1% 7.3% 6.4% 21.8% 48.9% 73.9% 8.0% -7.9% 18.9% 94 Source: Thomson Reuters I/B/E/S Exhibit 3C. STOXX 600: Q1 2015 Earnings Growth Sector Basic Materials Cyclical Consumer Goods & Services Non-Cyclical Consumer Goods & Services Energy Financials Healthcare Industrials Technology Telecommunications Services Utilities STOXX 600 Number of Companies Included in Estimate Source: Thomson Reuters I/B/E/S © 2014 Thomson Reuters. All marks herein are used under license. TRPR_83201_66 13 THOMSON REUTERS PROPRIETARY RESEARCH STOXX 600 EARNINGS OUTLOOK JANUARY 29, 2015 Exhibit 4C. STOXX 600: Q2 2015 Earnings Growth Sector Basic Materials Cyclical Consumer Goods & Services Non-Cyclical Consumer Goods & Services Energy Financials Healthcare Industrials Technology Telecommunications Services Utilities STOXX 600 Number of Companies Included in Estimate Today 49.2% 12.0% 35.5% -52.2% 86.4% -2.8% 10.1% 6.2% 10.6% -22.3% 6.3% 169 1 Jan 20.9% 11.0% 20.0% -30.2% 85.5% -4.8% 17.4% 8.5% 14.6% -27.1% 9.3% 152 1 Oct 21.6% 13.0% 20.9% 6.9% 20.3% -8.2% 19.0% 7.9% 29.7% -24.4% 10.5% 130 1 Jan -23.9% 82.9% 36.7% -25.7% 46.0% 5.0% 15.5% 12.0% 13.1% 17.0% 13.4% 156 1 Oct 24.1% 136.6% 11.3% 3.8% 14.4% 14.9% 19.4% 16.3% 14.8% 10.3% 20.6% 113 1 Jul 12.8% 179.1% -39.6% 11.5% 3.9% 15.4% 13.0% 20.9% 6.3% 7.4% 29.5% 106 Source: Thomson Reuters I/B/E/S Exhibit 5C. STOXX 600: Q3 2015 Earnings Growth Sector Basic Materials Cyclical Consumer Goods & Services Non-Cyclical Consumer Goods & Services Energy Financials Healthcare Industrials Technology Telecommunications Services Utilities STOXX 600 Number of Companies Included in Estimate Today -22.1% 82.4% 32.2% -46.8% 38.8% 5.8% 13.3% 12.3% 16.1% 14.2% 6.7% 173 Source: Thomson Reuters I/B/E/S Exhibit 6C. STOXX 600: Q4 2015 Earnings Growth Sector Basic Materials Cyclical Consumer Goods & Services Non-Cyclical Consumer Goods & Services Energy Financials Healthcare Industrials Technology Telecommunications Services Utilities STOXX 600 Number of Companies Included in Estimate Today 6.3% 83.5% 22.2% -9.1% 52.0% 10.2% 42.3% 13.9% 5.3% 19.6% 21.1% 151 1 Jan -2.4% 85.9% 18.3% -3.0% 104.7% 14.2% 17.5% 18.0% 7.6% 14.8% 21.4% 134 Source: Thomson Reuters I/B/E/S © 2014 Thomson Reuters. All marks herein are used under license. TRPR_83201_66 14 THOMSON REUTERS PROPRIETARY RESEARCH STOXX 600 EARNINGS OUTLOOK JANUARY 29, 2015 Exhibit 7C. STOXX 600: CY 2014 Earnings Growth Sector Basic Materials Cyclical Consumer Goods & Services Non-Cyclical Consumer Goods & Services Energy Financials Healthcare Industrials Technology Telecommunications Services Utilities STOXX 600 Number of Companies Included in Estimate Today 7.0% 8.7% 3.1% -5.2% 6.9% -0.4% 6.5% 35.6% -16.4% -19.4% 2.0% 508 1 Jan 7.5% 8.8% 2.7% -2.8% 12.3% 0.0% 7.5% 31.9% -12.4% -19.4% 4.0% 505 1 Oct 12.5% 8.0% 4.0% 6.6% 14.3% 0.8% 10.9% 24.5% -8.9% -17.7% 6.8% 508 1 Jul 11.1% 9.8% 4.5% 9.1% 17.2% 2.1% 14.7% 25.2% -11.6% -17.4% 8.6% 507 1 Apr 13.4% 12.7% 6.3% 9.5% 17.0% 4.7% 17.6% 29.5% -5.8% -10.0% 10.8% 503 1 Jan 12.0% 15.6% 8.4% -7.6% 20.7% 7.6% 14.9% 20.3% 10.9% 1.9% 11.6% 505 1 Oct 17.5% 16.5% 9.4% 10.7% 20.7% 9.3% 17.2% 20.2% 8.7% 4.4% 14.9% 505 1 Jul 16.7% 17.2% 9.7% 9.9% 18.9% 10.9% 16.3% 18.8% 8.8% 5.6% 14.5% 503 1 Apr 14.7% 16.0% 9.0% 9.4% 17.6% 9.1% 16.0% 18.2% 6.5% 5.3% 13.4% 502 Source: Thomson Reuters I/B/E/S Exhibit 8C. STOXX 600: CY 2015 Earnings Growth Sector Basic Materials Cyclical Consumer Goods & Services Non-Cyclical Consumer Goods & Services Energy Financials Healthcare Industrials Technology Telecommunications Services Utilities STOXX 600 Number of Companies Included in Estimate Today 8.7% 16.3% 4.9% -22.1% 24.4% 5.0% 15.2% 16.2% 18.5% 0.3% 10.1% 508 Source: Thomson Reuters I/B/E/S © 2014 Thomson Reuters. All marks herein are used under license. TRPR_83201_66 15 THOMSON REUTERS PROPRIETARY RESEARCH STOXX 600 EARNINGS OUTLOOK JANUARY 29, 2015 Exhibit 9C. STOXX 600: Actual Earnings Growth Rates Sector Basic Materials Cyclical Consumer Goods & Services Non-Cyclical Consumer Goods & Services Energy Financials Healthcare Industrials Technology Telecommunications Services Utilities STOXX 600 3Q14 19.4% 18.9% 8.5% -3.2% 23.5% 6.8% 6.6% 35.5% -2.6% -3.4% 11.7% 2Q14 13.3% 24.8% 25.8% 23.7% 2.3% 2.1% 12.4% 47.9% -11.9% 7.3% 11.1% 1Q14 6.2% 17.8% 19.2% -2.1% -0.2% -1.0% 31.0% 47.2% -32.0% -19.0% 1.1% 4Q13 -8.0% -1.0% 41.1% -21.8% 33.6% 1.0% 34.2% 51.4% -28.1% -46.9% 1.9% 3Q13 7.7% -29.8% 1.6% -21.2% -13.8% -2.9% -10.4% 13.7% -18.6% -60.7% -14.5% 1Q14 45% 7% 48% 4Q13 53% 7% 40% 3Q13 45% 10% 44% 1Q14 7.4% 4Q13 3.7% 3Q13 -0.8% Source: Thomson Reuters I/B/E/S Exhibit 10C. STOXX 600: Actual vs. Estimate (Above/Match/Below) Above Match Below 3Q14 52% 9% 39% 2Q14 48% 8% 44% Source: Thomson Reuters I/B/E/S Exhibit 11C. STOXX 600: Actual vs. Estimate (Aggregate Difference) Surprise Factor 3Q14 3.9% 2Q14 4.0% Source: Thomson Reuters I/B/E/S © 2014 Thomson Reuters. All marks herein are used under license. TRPR_83201_66 16 THOMSON REUTERS PROPRIETARY RESEARCH STOXX 600 EARNINGS OUTLOOK JANUARY 29, 2015 NOTES / DEFINITIONS ABOUT THOMSON REUTERS EIKON Thomson Reuters Eikon is more comprehensive and collaborative than anything you’ve ever worked with. It is a real-time research and portfolio management solution that delivers a broad and deep range of global financial content and insight. You get direct, unfiltered access to industry-leading sources of financial information and analytics, all in a fully integrated workspace designed to help you better analyze your investable universe and monitor your holdings. In a single application, you can: access broker research, estimates, financials, events, news, fixed income and credit analysis, and more; conduct indepth portfolio analysis versus indices, sectors, and industries; investigate data aggregates and complex data relationships; broaden your understanding of the credit markets; monitor negative developments and uncover new investment ideas. We also provide effortless integration of our content into your proprietary spreadsheets, and allow you to stay connected to critical portfolio information on your BlackBerry®. ABOUT THOMSON REUTERS Thomson Reuters is the world’s leading source of intelligent information for businesses and professionals. We combine industry expertise with innovative technology to deliver critical information to leading decision makers in the financial, legal, tax and accounting, scientific, healthcare and media markets, powered by the world’s most trusted news organization. With headquarters in New York and major operations in London and Eagan, Minnesota, Thomson Reuters employs more than 50,000 people in 93 countries. Thomson Reuters shares are listed on the New York Stock Exchange (NYSE: TRI) and Toronto Stock Exchange (TSX: TRI). For more information, go to www.thomsonreuters.com. IMPORTANT NOTICE This disclaimer is in addition to and not in replacement of any disclaimer of warranties and liabilities set forth in a written agreement between Thomson Reuters and you or the party authorizing your access to the Service (“Contract Disclaimer”). In the event of a conflict or inconsistency between this disclaimer and the Contract Disclaimer the terms of the Contract Disclaimer shall control. By accessing these materials, you hereby agree to the following: These research reports and the information contained therein is for your internal use only and redistribution of this information is expressly prohibited. These reports including the information and analysis, any opinion or recommendation is not intended for investment purposes and does not constitute investment advice or an offer, or an invitation to make an offer, to buy or sell any securities or any derivatives related to such securities. Thomson Reuters does not warrant the accuracy of the reports for any particular purpose and expressly disclaims any warranties of merchantability or fitness for a particular purpose; nor does Thomson Reuters guarantee the accuracy, validity, timeliness or completeness of any information or data included in these reports for any particular purpose. Thomson Reuters is under no obligation to provide you with any current or corrected information. Neither Thomson Reuters nor any of its affiliates, directors, officers or employees, will be liable or have any responsibility of any kind for any loss or damage (whether direct, indirect, consequential, or any other damages of any kind even if Thomson Reuters was advised of the possibility thereof) that you incur in connection with, relating to or arising out of these materials or the analysis, views, recommendations, opinions or information contained therein, or from any other cause relating to your access to, inability to access, or use of these materials, whether or not the circumstances giving rise to such cause may have been within the control of Thomson Reuters. The information provided in these materials is not intended for distribution to, or use by, any person or entity in any jurisdiction or country where such distribution or use would be contrary to law or regulation or which would subject Thomson Reuters or its affiliates to any registration requirement within such jurisdiction or country. © 2014 Thomson Reuters. All marks herein are used under license. TRPR_83201_66 17


© Copyright 2026