
Bank of Baroda - Prabhudas Lilladher
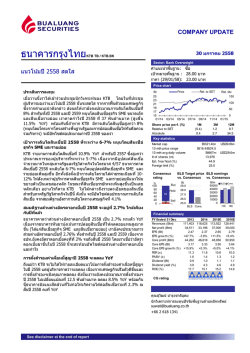
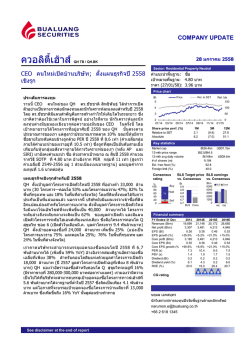
Bank of Baroda January 30, 2015 Nitin Kumar [email protected] +91‐22‐66322236 Pritesh Bumb [email protected] +91‐22‐66322232 Rating Price Target Price Implied Upside Sensex Nifty BUY Rs193 Rs220 14.0% 29,183 8,809 BOB reported disappointing results with 3Q FY15 PAT plunging by 68% y‐y led by aggravated provisions and one‐off tax expenses of Rs4.1bn (including penalty) levied by Dubai Income Tax Authority. Business growth remains muted (1% decline in 9MFY15) leading to ~5.5% miss in our NII estimate. Asset quality deteriorated sharply which management ascribed to prolonged economic slowdown while the guidance for the next quarter remains equally cautious. We believe that while BOB still has relatively better asset quality and coverage ratio than peers any turnaround is now pushed into FY16. We cut our FY16E earnings by 19% and reduce our price target to Rs220 based on 1.2x Mar‐17E ABV. Retain BUY. PPOP growth remains modest; domestic NIM declines by 10bp q‐q: BOB’s PPOP growth stood modest at 6.4% YoY dragged by weak NII growth (affected by interest reversals and 10bp margin compression) even as core‐fee income registered healthy growth of 16% y‐y. However aggravated provisioning to maintain coverage ratio and one‐off tax expenses of Rs4.1bn (including penalty) levied by Dubai Income Tax Authority resulted in 68% y‐y decline in net profits. Business growth remains flat; BOB is prudently shunning high‐cost deposits: BOB’s business growth remains tepid (1% decline in 9MFY15) led by weak trends in both domestic and international business. BOB shed preferential term deposits from Rs117.9 bn at FY14 end to Rs80.8bn while cut down the share of CDs in term deposits from 7.5% to 2.5% during the similar period. Management pointed that an acute dearth of loan demand arising from prolonged economic slowdown remains an overhang on business growth. Asset quality surprises negatively; cut earnings and revise PT: Fresh slippages stood elevated at Rs30.42 bn while BOB restructured loans worth Rs15.98bn (Rs 11.75bn in 2QFY15). The bank guided for elevated levels of slippages/potential restructuring in 4QFY15 as well. We cut our FY16E earnings by 19% and reduce our price target to Rs220 based on 1.2x Mar‐17E ABV. Retain BUY. (Prices as on January 30, 2015) Trading data Market Cap. (Rs bn) Shares o/s (m) 3M Avg. Daily value (Rs m) Major shareholders Promoters Foreign Domestic Inst. Public & Other Stock Performance (%) 1M 6M Absolute (10.8) 8.9 Relative (17.3) (2.9) How we differ from Consensus EPS (Rs) PL Cons. 2016 22.4 29.0 2017 26.2 34.3 415.9 2,153.4 2345.2 56.26% 17.96% 17.97% 7.81% 12M 81.8 39.4 Key financials ( Y/e March) Net interest income (Rs m) Growth (%) Operating profit (Rs m) PAT (Rs m) EPS (Rs) Growth (%) Net DPS (Rs) % Diff. ‐22.8 ‐23.6 Price Performance (RIC: BOB.BO, BB: BOB IN) (Rs) 250 2014 119,653 5.7 92,910 45,411 21.3 (0.8) 5.0 2015E 130,219 8.8 95,346 37,245 17.3 (18.8) 4.6 2016E 144,407 10.9 104,608 48,179 22.4 29.4 5.0 2017E 167,587 16.1 120,949 56,434 26.2 17.1 5.5 2014 1.98 13.4 0.75 1.2 1.4 9.1 2.6 2015E 1.90 10.0 0.54 1.1 1.5 11.2 2.4 2016E 1.88 11.9 0.63 1.0 1.3 8.6 2.6 2017E 1.87 12.7 0.63 0.9 1.1 7.4 2.8 200 150 100 50 Source: Bloomberg Nov‐14 Sep‐14 Jul‐14 May‐14 Mar‐14 Jan‐14 0 Profitability & Valuation NIM (%) RoAE (%) RoAA (%) P / BV (x) P / ABV (x) PE (x) Net dividend yield (%) Source: Company Data; PL Research Prabhudas Lilladher Pvt. Ltd. and/or its associates (the 'Firm') does and/or seeks to do business with companies covered in its research reports. As a result investors should be aware that the Firm may have a conflict of interest that could affect the objectivity of the report. Investors should consider this report as only a single factor in making their investment decision. Please refer to important disclosures and disclaimers at the end of the report Q3FY15 Result Update Disappointing results; normalcy to return from FY16 only Bank of Baroda Exhibit 1: BOB Q3FY15 – Disappointing quarter as high provisions on NPA and one off taxes dent earnings NII performance came in weak sequentially as high slippages led to high interest reversals coupled with lower loan growth Staff expenses remained low despite providing run‐rate provisions Bank upfront has provided taxes levied by Dubai tax authorities of Rs~4.1bn pertaining to earlier years . Loan growth has come off to 12% YoY. Management does not see any significant pick‐up in loan book as fresh capex has been muted P&L (Rs mn) Q3FY15 Interest Income 107,180 Q3FY14 YoY gr. (%) 96,907 10.6 Q2FY15 QoQ gr. (%) 108,257 (1.0) Interest Expense 74,319 66,336 12.0 74,246 0.1 Net Interest Income (NII) 32,861 30,571 7.5 34,011 (3.4) Treasury income 4,966 3,876 28.1 4,314 15.1 Other income exc. Treasury 5,938 5,445 9.1 5,602 6.0 Total income 43,765 39,892 9.7 43,928 (0.4) Operating expenses 20,375 17,917 13.7 19,898 2.4 ‐Staff expenses 11,198 10,557 6.1 11,078 1.1 ‐Other expenses 9,177 7,360 24.7 8,820 4.0 Operating profit 23,390 21,975 6.4 24,029 (2.7) Core operating profit 18,424 18,099 1.8 19,715 (6.5) Total provisions 12,623 7,619 65.7 8,880 42.1 Profit before tax 10,768 14,356 (25.0) 15,149 (28.9) Tax 7,428 3,722 99.6 4,107 80.9 Profit after tax 3,340 10,478 (68.1) 11,042 (69.8) Deposits 5,645,997 5,037,718 12.1 5,669,259 (0.4) Advances 3,936,305 3,524,462 11.7 3,857,663 154,530 119,258 29.6 82,913 66,236 230,988 211,692 Balance sheet (Rs mn) Gross NPA (Rs mn) Net NPA (Rs mn) O/S Std. restr. assets (Rs mn) 2.0 130,576 18.3 25.2 67,045 23.7 9.1 224,170 3.0 Profitability ratios Margins were down on domestic loans on high interest reversals, but overseas margins also have come under pressure as spreads have come off RoaA 0.2 0.7 (53) 0.7 (48) RoaE 3.4 13.1 (963) 11.7 (832) NIM 2.2 2.4 (17) 2.4 (20) Yield on Advances 8.1 8.3 (21) 8.4 (27) Cost of Deposits 5.2 5.2 (6) 5.2 ‐ 3.9 3.3 53 3.3 53 Asset Quality Gross NPL ratio Net NPL ratio Asset quality deteriorates as Bank reported Coverage ratio Std. rest. Assets/ Total 2.1 1.9 23 1.7 37 46.3 44.5 189 48.7 (231) 5.9 6.0 (14) 5.8 6 fresh slippages of Rs30bn & Rs15.7bn of Business & Other Ratios fresh restructuring constituting from the Low‐cost deposit mix 32.4 32.3 15 31.9 53 Cost‐income ratio 46.6 44.9 164 45.3 126 Non int. inc / total income 24.9 23.4 155 22.6 234 Credit deposit ratio 69.7 70.0 (24) 68.0 167 CAR 12.4 12.0 41 12.2 23 Tier‐I 9.4 8.7 69 9.3 15 Infra, textiles & Construction EPC Source: Company Data, PL Research January 30, 2015 2 Bank of Baroda Exhibit 2: Loan growth was muted especially the domestic loan book Domestic Loan growth International Loan growth 50.0% 40.0% 30.0% 20.0% 10.0% 3Q15 2Q15 1Q15 4Q14 3Q14 2Q14 1Q14 4Q13 3Q13 2Q13 1Q13 4Q12 3Q12 2Q12 1Q12 4Q11 0.0% Source: Company Data, PL Research Exhibit 3: Both domestic and overseas margins have come under Exhibit 4: CASA growth has been the only positive for BOB pressure CASA (%) 35.0% NIM (%) Domestic NIM (%) 4.5% 34.0% 4.0% 33.0% 32.0% 3.5% 31.0% 3.0% 30.0% 29.0% 2.5% 3Q15 2Q15 1Q15 4Q14 3Q14 2Q14 1Q14 4Q13 3Q13 2Q13 1Q13 4Q12 3Q12 2Q12 4Q11 4Q11 1Q12 2Q12 3Q12 4Q12 1Q13 2Q13 3Q13 4Q13 1Q14 2Q14 3Q14 4Q14 1Q15 2Q15 3Q15 1Q12 28.0% 2.0% Source: Company Data, PL Research Source: Company Data, PL Research Exhibit 5: Gross slippages came in extremely high and was negative surprise 2Q14 3Q14 4Q14 1Q15 2Q15 3Q15 Opening NPAs 97,625 108,879 119,536 118,759 120,868 132,685 Gross Slippages 20,170 15,339 11,175 20,221 17,570 30,420 Recovery 2,391 1,970 6,265 5,626 2,780 2,380 Up‐gradations 1,851 2,987 516 7,412 2,350 1,800 4,674 (274) 5,171 5,073 3,680 3,280 Write offs Closing 108,879 119,536 118,759 120,868 130,576 154,530 Annualized Slippages % 2.43% 1.77% 1.19% 2.08% 1.83% 3.15% Restructuring Incremental 16,370 12,130 11,570 9,860 11,750 15,980 (% of loans) 1.97% 1.40% 1.24% 1.01% 1.22% 1.6% Source: Company Data, PL Research January 30, 2015 3 Exhibit 6: Fresh slippages rose to highest in any given quarter Bank of Baroda Exhibit 7: Credit cost was high on high slippages Gross Slippages (%), annualized 3.50% Credit Cost 3.00% 1.5% 2.50% 1.2% 2.00% 0.9% 1.50% Source: Company Data, PL Research 3Q15 2Q15 1Q15 4Q14 3Q14 2Q14 1Q14 4Q13 3Q13 2Q13 1Q13 4Q12 3Q12 2Q12 4Q11 3Q15 2Q15 1Q15 4Q14 3Q14 2Q14 1Q14 4Q13 3Q13 2Q13 1Q13 4Q12 3Q12 0.0% 2Q12 0.00% 1Q12 0.3% 4Q11 0.50% 1Q12 0.6% 1.00% Source: Company Data, PL Research Exhibit 8: ROAs will inch up gradually over FY16E ROA decomposition 2011 2012 2013 2014 2015E 2016E 2017E Net Interest Income/Assets 2.83% 2.63% 2.33% 2.03% 1.95% 1.93% 1.92% Fees/Assets 0.76% 0.72% 0.62% 0.63% 0.56% 0.61% 0.58% Investment profits/Assets 0.14% 0.15% 0.13% 0.13% 0.12% 0.07% 0.08% Net revenues/Assets 3.74% 3.50% 3.08% 2.79% 2.63% 2.62% 2.58% Operating Expense/Assets ‐1.49% ‐1.31% ‐1.23% ‐1.20% ‐1.20% ‐1.22% ‐1.19% Provisions/Assets ‐0.43% ‐0.65% ‐0.86% ‐0.65% ‐0.56% ‐0.49% ‐0.48% Taxes/Assets ‐0.45% ‐0.26% ‐0.07% ‐0.16% ‐0.31% ‐0.26% ‐0.26% Total Costs/Assets ‐2.37% ‐2.23% ‐2.16% ‐2.02% ‐2.07% ‐1.97% ‐1.93% ROA 1.36% 1.28% 0.92% 0.77% 0.56% 0.64% 0.65% Equity/Assets 5.40% 5.87% 5.90% 5.66% 5.58% 5.40% 5.08% ROE 25.3% 21.7% 15.7% 13.6% 10.3% 12.3% 13.1% Source: Company Data, PL Research Exhibit 9: We reduce our TP to Rs220 from Rs235 on sharp cut in earnings PT calculation and upside Fair price ‐ EVA 214 Fair price ‐ Two stage GGM 226 Average of the two 220 Target P/ABV 1.2 Target P/ABV2 1.4 Target P/E 8.4 Current price, Rs 192 Upside (%) 15% Dividend yield (%) 2.2% Total return (%) 17% Source: Company Data, PL Research January 30, 2015 4 Bank of Baroda Exhibit 10: We cut our earnings by 25% in FY15E & by 20% in FY16E on higher credit costs & one‐offs (Rs mn) Old New % Change FY15E FY16E FY15E FY16E FY15E FY16E Net interest income 132,732 150,425 130,219 144,407 (1.9) (4.0) Operating profit 103,093 120,277 95,346 104,608 (7.5) (13.0) 50,097 59,728 37,245 48,179 (25.7) (19.3) 23.3 27.7 17.3 22.4 (25.7) (19.3) 149.5 169.4 129.2 153.5 (13.6) (9.4) Net profit EPS (Rs) ABVPS (Rs) Price target (Rs) 235 220 Recommendation BUY BUY (6.5) Source: Company Data, PL Research January 30, 2015 5 Income Statement (Rs m) Y/e March Int. Earned from Adv. Int. Earned from Invt. Others Total Interest Income Interest expense NII Growth (%) Treasury Income NTNII Non Interest Income Total Income Growth (%) Operating Expense Operating Profit Growth (%) NPA Provisions Investment Provisions Total Provisions PBT Tax Provisions Effective Tax Rate (%) PAT Growth (%) 2014 2015E 2016E 2017E 278,781 86,960 23,656 389,397 269,744 119,653 5.7 7,438 37,189 44,627 434,025 11.8 71,371 92,910 3.2 29,352 1,986 37,937 54,973 9,562 17.4 45,411 1.3 335,962 85,935 24,691 446,587 316,368 130,219 8.8 8,182 37,338 45,520 492,107 13.4 80,394 95,346 2.6 36,874 (1,243) 37,151 58,195 20,950 36.0 37,245 (18.0) 371,120 90,687 27,926 489,734 345,326 144,407 10.9 5,138 45,844 50,982 540,716 9.9 90,782 104,608 9.7 34,152 (746) 36,751 67,857 19,679 29.0 48,179 29.4 429,648 101,284 30,738 561,669 394,082 167,587 16.1 6,577 50,523 57,100 618,769 14.4 103,738 120,949 15.6 37,361 (448) 41,464 79,485 23,051 29.0 56,434 17.1 Quarterly Financials (Rs m) Y/e March Q4FY14 Q1FY15 Q2FY15 Q3FY15 Interest Income Interest Expense Net Interest Income Non Interest Income CEB Treasury Net Total Income Operating Expenses Employee Expenses Other Expenses Operating Profit Core Operating Profit Provisions Loan loss provisions Investment Depreciation Profit before tax Tax PAT before EO Extraordinary item PAT 102,886 71,643 31,243 13,263 4,192 893 44,506 18,710 10,399 8,311 25,796 24,903 11,532 6,374 — 14,264 2,536 11,728 — 11,728 106,580 73,297 33,283 10,245 3,473 2,242 43,529 18,733 11,055 7,678 24,796 22,554 5,267 7,718 — 19,529 5,910 13,619 — 13,619 108,257 74,246 34,011 9,917 3,328 1,790 43,928 19,898 11,078 8,820 24,029 22,240 8,880 5,843 — 15,149 4,107 11,042 — 11,042 107,180 74,319 32,861 10,904 3,732 2,436 43,765 20,375 11,198 9,177 23,390 20,954 12,623 11,498 — 10,768 7,428 3,340 — 3,340 2014 2015E 2016E 2017E 193 2,153 415,926 6.3 21.3 162 134 9.1 1.2 1.4 5.0 2.6 193 2,153 415,926 5.9 17.3 174 129 11.2 1.1 1.5 4.6 2.4 193 2,153 415,926 5.1 22.4 191 154 8.6 1.0 1.3 5.0 2.6 193 2,153 415,926 4.3 26.2 211 177 7.4 0.9 1.1 5.5 2.8 2014 2015E 2016E 2017E 2.0 0.8 13.4 1.9 0.5 10.0 1.9 0.6 11.9 1.9 0.6 12.7 Efficiency Y/e March 2014 2015E 2016E 2017E Cost‐Income Ratio (%) C‐D Ratio (%) Business per Emp. (Rs m) Profit per Emp. (Rs lacs) Business per Branch (Rs m) Profit per Branch (Rs m) 43.4 69.8 210 9.9 1,958 9 45.7 70.0 194 7.0 14,657 53 46.5 70.2 195 7.9 13,925 57 46.2 71.3 199 8.1 13,913 56 Asset Quality Y/e March 2014 2015E 2016E 2017E Gross NPAs (Rs m) 118,759 Net NPAs (Rs m) 60,348 Gr. NPAs to Gross Adv. (%) 3.0 Net NPAs to Net Adv. (%) 1.5 NPA Coverage (%) 49.2 Source: Company Data, PL Research. 172,050 96,898 4.1 2.3 43.7 165,559 80,166 3.4 1.6 51.6 164,690 73,159 2.8 1.3 55.6 Key Ratios Y/e March CMP (Rs) Equity Shrs. Os. (m) Market Cap (Rs m) M/Cap to AUM (%) EPS (Rs) Book Value (Rs) Adj. BV (100%) (Rs) P/E (x) P/BV (x) P/ABV (x) DPS (Rs) Dividend Yield (%) Balance Sheet (Rs m) Y/e March 2014 2015E 2016E 2017E Par Value 2 No. of equity shares 2,153 Equity 4,307 Networth 359,857 Adj. Networth 299,509 Deposits 5,688,944 Growth (%) 20.0 Low Cost deposits 1,464,878 % of total deposits 25.7 Total Liabilities 6,595,045 Net Advances 3,970,058 Growth (%) 21.0 Investments 1,161,127 Total Assets 6,595,045 Source: Company Data, PL Research. 2 2,153 4,307 385,611 288,712 6,035,969 6.1 1,533,136 25.4 7,104,400 4,224,142 6.4 1,167,258 7,104,400 2 2,153 4,307 421,300 341,134 6,953,437 15.2 1,814,847 26.1 8,233,893 4,883,108 15.6 1,322,663 8,233,893 2 2,153 4,307 463,995 390,837 8,121,614 16.8 2,192,836 27.0 9,674,037 5,791,366 18.6 1,495,773 9,674,037 Bank of Baroda Profitability (%) Y/e March NIM RoAA RoAE January 30, 2015 6 Bank of Baroda Prabhudas Lilladher Pvt. Ltd. 3rd Floor, Sadhana House, 570, P. B. Marg, Worli, Mumbai‐400 018, India Tel: (91 22) 6632 2222 Fax: (91 22) 6632 2209 % of Total Coverage Rating Distribution of Research Coverage 45% 40% 35% 30% 25% 20% 15% 10% 5% 0% PL’s Recommendation Nomenclature 42.4% 37.6% 18.8% Accumulate Reduce : Over 15% Outperformance to Sensex over 12‐months Accumulate : Outperformance to Sensex over 12‐months Reduce : Underperformance to Sensex over 12‐months Sell : Over 15% underperformance to Sensex over 12‐months Trading Buy : Over 10% absolute upside in 1‐month Trading Sell : Over 10% absolute decline in 1‐month Not Rated (NR) : No specific call on the stock Under Review (UR) : 1.2% BUY BUY Rating likely to change shortly Sell DISCLAIMER/DISCLOSURES ANALYST CERTIFICATION We/I, Mr. Nitin Kumar (B.E, PGDM, CFA), Mr. Pritesh Bumb (MBA, M.com), Research Analysts, authors and the names subscribed to this report, hereby certify that all of the views expressed in this research report accurately reflect our views about the subject issuer(s) or securities. We also certify that no part of our compensation was, is, or will be directly or indirectly related to the specific recommendation(s) or view(s) in this report. Terms & conditions and other disclosures: Prabhudas Lilladher Pvt. Ltd, Mumbai, India (hereinafter referred to as “PL”) is engaged in the business of Stock Broking, Portfolio Manager, Depository Participant and distribution for third party financial products. PL is a subsidiary of Prabhudas Lilladher Advisory Services Pvt Ltd. which has its various subsidiaries engaged in business of commodity broking, investment banking, financial services (margin funding) and distribution of third party financial/other products, details in respect of which are available at www.plindia.com This document has been prepared by the Research Division of PL and is meant for use by the recipient only as information and is not for circulation. This document is not to be reported or copied or made available to others without prior permission of PL. It should not be considered or taken as an offer to sell or a solicitation to buy or sell any security. The information contained in this report has been obtained from sources that are considered to be reliable. However, PL has not independently verified the accuracy or completeness of the same. Neither PL nor any of its affiliates, its directors or its employees accepts any responsibility of whatsoever nature for the information, statements and opinion given, made available or expressed herein or for any omission therein. Recipients of this report should be aware that past performance is not necessarily a guide to future performance and value of investments can go down as well. The suitability or otherwise of any investments will depend upon the recipient's particular circumstances and, in case of doubt, advice should be sought from an independent expert/advisor. Either PL or its affiliates or its directors or its employees or its representatives or its clients or their relatives may have position(s), make market, act as principal or engage in transactions of securities of companies referred to in this report and they may have used the research material prior to publication. PL may from time to time solicit or perform investment banking or other services for any company mentioned in this document. PL is in the process of applying for certificate of registration as Research Analyst under Securities and Exchange Board of India (Research Analysts) Regulations, 2014 PL submits that no material disciplinary action has been taken on us by any Regulatory Authority impacting Equity Research Analysis activities. PL or its research analysts or its associates or his relatives do not have any financial interest in the subject company. PL or its research analysts or its associates or his relatives do not have actual/beneficial ownership of one per cent or more securities of the subject company at the end of the month immediately preceding the date of publication of the research report. PL or its research analysts or its associates or his relatives do not have any material conflict of interest at the time of publication of the research report. PL or its associates might have received compensation from the subject company in the past twelve months. PL or its associates might have managed or co‐managed public offering of securities for the subject company in the past twelve months or mandated by the subject company for any other assignment in the past twelve months. PL or its associates might have received any compensation for investment banking or merchant banking or brokerage services from the subject company in the past twelve months. PL or its associates might have received any compensation for products or services other than investment banking or merchant banking or brokerage services from the subject company in the past twelve months PL or its associates might have received any compensation or other benefits from the subject company or third party in connection with the research report. PL encourages independence in research report preparation and strives to minimize conflict in preparation of research report. PL or its analysts did not receive any compensation or other benefits from the subject Company or third party in connection with the preparation of the research report. PL or its Research Analysts do not have any material conflict of interest at the time of publication of this report. It is confirmed that Mr. Nitin Kumar (B.E, PGDM, CFA), Mr. Pritesh Bumb (MBA, M.com), Research Analysts of this report have not received any compensation from the companies mentioned in the report in the preceding twelve months Compensation of our Research Analysts is not based on any specific merchant banking, investment banking or brokerage service transactions. The Research analysts for this report certifies that all of the views expressed in this report accurately reflect his or her personal views about the subject company or companies and its or their securities, and no part of his or her compensation was, is or will be, directly or indirectly related to specific recommendations or views expressed in this report. The research analysts for this report has not served as an officer, director or employee of the subject company PL or its research analysts have not engaged in market making activity for the subject company Our sales people, traders, and other professionals or affiliates may provide oral or written market commentary or trading strategies to our clients that reflect opinions that are contrary to the opinions expressed herein, and our proprietary trading and investing businesses may make investment decisions that are inconsistent with the recommendations expressed herein. In reviewing these materials, you should be aware that any or all o the foregoing, among other things, may give rise to real or potential conflicts of interest. PL and its associates, their directors and employees may (a) from time to time, have a long or short position in, and buy or sell the securities of the subject company or (b) be engaged in any other transaction involving such securities and earn brokerage or other compensation or act as a market maker in the financial instruments of the subject company or act as an advisor or lender/borrower to the subject company or may have any other potential conflict of interests with respect to any recommendation and other related information and opinions. January 30, 2015 7


© Copyright 2026