
CAN SLIM
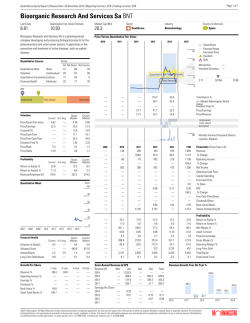
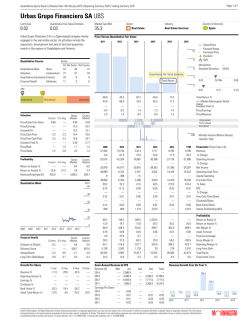
How to Make
Money in
Stocks
This page intentionally left blank.
How to Make
Money in
Stocks
A Winning System in Good Times or Bad
William J. O’Neil
Second Edition
McGraw-Hill, Inc.
New York San Francisco Washington, D.C. Auckland Bogotá
Caracas Lisbon London Madrid Mexico City Milan
Montreal New Delhi San Juan Singapore
Sydney Tokyo Toronto
Copyright © 1995, 1991, 1988 by McGraw-Hill, Inc. All rights reserved. Manufactured in the United
States of America. Except as permitted under the United States Copyright Act of 1976, no part of this
publication may be reproduced or distributed in any form or by any means, or stored in a database or
retrieval system, without the prior written permission of the publisher.
0-07-139480-X
The material in this eBook also appears in the print version of this title: 0-07-048017-6.
All trademarks are trademarks of their respective owners. Rather than put a trademark symbol after
every occurrence of a trademarked name, we use names in an editorial fashion only, and to the benefit
of the trademark owner, with no intention of infringement of the trademark. Where such designations
appear in this book, they have been printed with initial caps.
McGraw-Hill eBooks are available at special quantity discounts to use as premiums and sales promotions, or for use in corporate training programs. For more information, please contact George
Hoare, Special Sales, at [email protected] or (212) 904-4069.
TERMS OF USE
This is a copyrighted work and The McGraw-Hill Companies, Inc. (“McGraw-Hill”) and its licensors
reserve all rights in and to the work. Use of this work is subject to these terms. Except as permitted
under the Copyright Act of 1976 and the right to store and retrieve one copy of the work, you may not
decompile, disassemble, reverse engineer, reproduce, modify, create derivative works based upon,
transmit, distribute, disseminate, sell, publish or sublicense the work or any part of it without
McGraw-Hill’s prior consent. You may use the work for your own noncommercial and personal use;
any other use of the work is strictly prohibited. Your right to use the work may be terminated if you
fail to comply with these terms.
THE WORK IS PROVIDED “AS IS”. McGRAW-HILL AND ITS LICENSORS MAKE NO GUARANTEES OR WARRANTIES AS TO THE ACCURACY, ADEQUACY OR COMPLETENESS OF
OR RESULTS TO BE OBTAINED FROM USING THE WORK, INCLUDING ANY INFORMATION THAT CAN BE ACCESSED THROUGH THE WORK VIA HYPERLINK OR OTHERWISE,
AND EXPRESSLY DISCLAIM ANY WARRANTY, EXPRESS OR IMPLIED, INCLUDING BUT
NOT LIMITED TO IMPLIED WARRANTIES OF MERCHANTABILITY OR FITNESS FOR A
PARTICULAR PURPOSE. McGraw-Hill and its licensors do not warrant or guarantee that the functions contained in the work will meet your requirements or that its operation will be uninterrupted or
error free. Neither McGraw-Hill nor its licensors shall be liable to you or anyone else for any inaccuracy, error or omission, regardless of cause, in the work or for any damages resulting therefrom.
McGraw-Hill has no responsibility for the content of any information accessed through the work.
Under no circumstances shall McGraw-Hill and/or its licensors be liable for any indirect, incidental,
special, punitive, consequential or similar damages that result from the use of or inability to use the
work, even if any of them has been advised of the possibility of such damages. This limitation of liability shall apply to any claim or cause whatsoever whether such claim or cause arises in contract, tort
or otherwise.
DOI: 10.1036/007139480X
Want to learn more?
,
We hope you enjoy this McGraw-Hill eBook! If you d like
more information about this book, its author, or related books
and websites, please click here.
Success in a free country is simple.
Get a job, get an education, and
learn to save and invest wisely.
Anyone can do it.
You can do it.
This page intentionally left blank.
For more information about this title, click here.
Contents
Preface
ix
Part 1 A Winning System: C-A-N S-L-I-M
Introduction: Learning from the Greatest Winners
1. C = Current Quarterly Earnings Per Share: How Much
Is Enough?
2
5
2. A = Annual Earnings Increases: Look for Meaningful
Growth
14
3. N = New Products, New Management, New Highs:
Buying at the Right Time
22
4. S = Supply and Demand: Small Capitalization Plus
Big Volume Demand
29
5. L = Leader or Laggard: Which Is Your Stock?
34
6. I = Institutional Sponsorship: A Little Goes a Long Way
40
7. M = Market Direction: How to Determine It
44
Part 2 Be Smart from the Start
8. Finding a Broker, Opening an Account, and What It
Costs to Buy Stocks
80
vii
Copyright 1995, 1991, 1988 by McGraw-Hill, Inc. Click Here for Terms of Use.
viii
Contents
9. When to Sell if Your Selection or Timing Might Be
Wrong
10. When to Sell and Take Your Profit
85
97
11. Should You Diversify, Invest for the Long Pull, Buy
on Margin, Sell Short?
109
12. Should You Buy Options, OTC Stocks,
New Issues…?
115
13. How You Could Make a Million Owning Mutual
Funds
131
Part 3 Investing like a Professional
14. Models of the Greatest Stock Market Winners:
1953–1993
140
15. How to Read Charts like an Expert and Improve
Your Stock Selection and Timing
160
16. How to Make Money Reading the Daily Financial
News Pages
180
17. The Art of Tape Reading: Analyzing and Reacting to
News
207
18. How to Pick the Best Industry Groups, Subgroups,
and Market Sectors
218
19. Improving Management of Pension and Institutional
Portfolios
230
20. 18 Common Mistakes Most Investors Make
254
Index
259
Preface
America is the world’s leader in successful new, entrepreneurial companies. Many are in the computer, communications, and technology sectors. Others are in the medical, retail, and leisure and entertainment
industries. As an investor, you should develop the skills and acquire the
knowledge necessary to recognize and invest in the fast-growing, innovative companies that comprise our New America.
But how do you pick which stocks to buy and how can you significantly minimize the risk you take in buying stocks? And, most importantly,
when do you sell your stocks? This book will answer all of those questions for you.
How to Make Money in Stocks gives you a simple, easy-to-use system
called C-A-N S-L-I-M. The C-A-N S-L-I-M method is based on an exhaustive, ongoing analysis of every big winning stock each year since 1953.
Each letter in C-A-N S-L-I-M stands for one of the seven key factors that
all of these past super winners had in common. So, this is not some theoretical or academic method. This is based on how the stock market
actually works.
How well does the C-A-N S-L-I-M method work? It is the best method
devised and available for individual investors, whether new or experienced. More than 200,000 people have attended our free investment
seminars and all-day paid workshops where the method is explained in
detail. At each session, many people tell us how they made 50% or
100% in the previous year using the C-A-N S-L-I-M system.
David Ryan was the first to use the method in the U.S. Investing
Championship and won three years in a row. He invested his own
ix
Copyright 1995, 1991, 1988 by McGraw-Hill, Inc. Click Here for Terms of Use.
x
Preface
money in an actual account that was monitored by CPAs. He averaged
over 100% per year and is now the portfolio manager of the New USA
Mutual Fund.
Ced Moses entered the contest in 1991 using the method and came
in first with a record-setting 379%. Lee Freestone, one of our associates,
came in second that year with a 279% increase using C-A-N S-L-I-M. In
1994, Lee won it with a 234% increase. The Dow Jones Industrials that
year increased 13.7%. There are numerous other examples, such as Dan
Running of the University of Baltimore, who won the USA Today championship with a 115% increase in 1994; and Jay Plisco of Cold Spring
Harbor, N.Y., who won the 1995 Fidelity Investment Challenge by using
C-A-N S-L-I-M for an impressive 135% gain.
You may want to read this book a couple of times to get it all down,
but anyone can learn to invest more successfully if he or she is willing to
work at it. Any why shouldn’t you learn to capitalize on and benefit
financially from the most successful entrepreneurial companies in
America?
How to Make Money in Stocks took me many years to write, and I’ve now
been in the battlefield of the financial marketplace for 40 years. So this
book can and should help you avoid most of the pitfalls all investors
face in this treacherous arena.
In the long run, the U.S. market always goes up because businesses
create new products, new services, and new technological inventions. It
is the companies with the best new products and services that serve the
most people that are always the top stock market winners.
In the last 100 years, the stock market has had 25 bear market
declines. These were natural corrections of the previous bull market
advances. Every time the market recovered and ultimately soared back
into new high ground. So don’t get sidetracked by the vast number of
gloom and doomers. They rarely have made money for anyone. Besides,
I don’t ever remember meeting a successful pessimist.
In the early 1960s, William O’Neil & Co. created the first daily computer database on the stock market in the United States. In 1970, we
created Datagraphs, an institutional investors’ service. Today, more than
600 top institutional investors take a wide variety of our research services. We also publish Daily Graphs, a daily charting service provided
weekly and designed for individual investors.
In 1983, I created the basic format for a new national daily business
and financial newspaper, Investor’s Business Daily. Investor’s Business Daily
made major advances in the quality and availability of vital, relevant
information for all public investors and people in business. Sold nationally in every city, the newspaper is the fastest-growing newspaper in the
xi
Preface
United States. It has steadily taken share of market away from the century-old Wall Street Journal.
For those still uncertain if C-A-N S-L-I-M really works, William O’Neil
& Co. was started solely with profits made in Syntex stock in 1963 and
Investor’s Business Daily was built and promoted with profits made in Pic
N Save, Price Company, and Amgen.
My deepest appreciation and heartfelt thanks go out to those loyal
hardworking souls who read, edited, worked on the graphics, criticized,
typed, and retyped the endless changes made to this work. Some of
those dedicated individuals are Anne Gerhard, Carolyn Hoffman,
Jeannie Kihm, Jim Lan, Stanley Liu, Diane Marin, Milton Perrin, Kathy
Russell, Lindee Shadrake, Kathy Sherman, Frank Spillers, and Susan
Warfel. And, of course, a great amount of valuable assistance and
numerous suggestions were provided by my wife, Fay, and Bill Sabin in
the original edition and Philip Ruppel and the excellent McGraw-Hill
staff in this second revised edition.
William J. O’Neil
This page intentionally left blank.
How to Make
Money in
Stocks
xiv
Chart courtesy of Securities Research Company, a division of Babson-United Investment Advisors, Inc., Babson-United Building,
101 Prescott Street, Wellesley Hills, MA 02181-3319.
PART 1
A Winning
System:
C-A-N S-L-I-M
Copyright 1995, 1991, 1988 by McGraw-Hill, Inc. Click Here for Terms of Use.
Introduction:
Learning from the Greatest
Winners
In the following chapters, I will show you exactly how to pick more big
winners in the stock market and how to substantially reduce your losses
and mistakes. I will examine and discuss other investments, as well.
In the past, most people who bought and sold stocks either had
mediocre results or lost money because of their clear lack of knowledge.
But no one has to lose money.
This book will provide you with most of the investment understanding, skills, and methods you need to become a more successful investor.
I believe that most people in this country and many others throughout the free world, young and old, regardless of profession, education,
background, or economic position, can and definitely should own common stock. This book isn’t written for an elite but for the millions of little guys and gals everywhere who want a chance to be better off.
YOU CAN
START SMALL
If you are a typical working man or woman or a
beginning investor, it doesn’t take a lot of
money to start. You can begin with as little as
$500 to $1000 and add to it as you earn and
save more money. I began with the purchase
of just five shares of Procter & Gamble when
I was only 21 and fresh out of school.
You live in a fantastic time of unlimited opportunity, an era of outstanding new ideas, emerging industries, and new frontiers. But you
have to read to learn how to recognize and take advantage of these
extraordinary situations.
2
Copyright 1995, 1991, 1988 by McGraw-Hill, Inc. Click Here for Terms of Use.
3
Introduction
The opportunities are out there for everyone. You are now witnessing
a New America. We lead the world in high technology, medical
advancements, computer software, military capabilities, and innovative
new entrepreneurial companies. The communist socialist system was
finally relegated to the ash heap of history under Ronald Reagan and
our system of freedom and opportunity serves as a prime success model
for the majority of countries in the world.
It is not enough today to just work and earn a salary. To do the things
you want to do, to go the places you want to go, to have the things you
want to have in your life, you absolutely must save and invest intelligently. The second income from your investments and the net profits you
can make will help you reach your goals and provide real security.
SECRET TIP #1
The first step in learning to pick stock market
winners is for you to examine leading winners
of the past to learn all the characteristics of the
most successful stocks. You will learn from this
observation what type of price patterns these
stocks developed just before their spectacular
price advances.
Other key factors you will uncover include what kind of company
quarterly-earnings reports were publicly known at the time, what the
annual earnings histories of these organizations had been in the prior
five years, what amount of stock trading volume was present, what
degree of relative price strength occurred in the price of the stocks
before their enormous success, how many shares of common stock were
outstanding in the capitalization of each company, how many of the
greatest winners had significant new products or new management, and
how many were tied to strong industry group moves caused by important changes occurring in an entire industry.
It is easy to conduct this type of practical, commonsense analysis of
past successful leaders. I have already completed such a comprehensive
study. In our historical analysis, we selected the greatest winning stocks
in the stock market each year (in terms of percentage increase for the
year), spanning more than 40 years.
We call the study The Record Book of Greatest Stock Market Winners.
It covers the period from 1953 through 1993 and analyzes in detail over
500 of the biggest winning companies in recent stock market history:
super stocks such as Texas Instruments, whose price soared from $25 to
$250 from January 1958 through May 1960; Xerox, which escalated
from $160 to the equivalent of $1340 from March 1963 to June 1966;
4
A Winning System: C-A-N S-L-I-M
Syntex, which leaped from $100 to $570 in only six months during the
last half of 1963; Dome Petroleum and Prime Computer, which respectively advanced 1000% and 1595% in the 1978–1980 stock market;
Limited Stores, which wildly excited lucky shareowners with a 3500%
increase between 1982 and 1987; and Cisco Systems, which advanced
from a split-adjusted $1.88 to $40.75 between October 1990 and March
1994. Home Depot and Microsoft both increased more than 20 times
during the 1980s and early ’90s. Home Depot was one of the all-time
great performers jumping twentyfold in less than 2 years from its initial
public offering in September of 1981 and then again climbing another
10 times from 1988 to 1992. All of these companies offered exciting
new products and concepts.
Would you like to know the common characteristics and secret rules
of success we discovered from this intensive study of all past glamorous
stock market leaders?
It’s all in the next few chapters and in a simple easy-to-remember formula we have named C-A-N S-L-I-M . Write the formula down, and
repeat it several times so you won’t forget it.
Each letter in the words C-A-N S-L-I-M stands for one of the seven
chief characteristics of these great winning stocks at their early developing stages, just before they made huge profits for their shareholders.
You can learn how to pick winners in the stock market, and you can
become part owner in the best companies in the world. So, let’s get
started right now. Here’s a sneak preview of C-A-N S-L-I-M.
C
ϭ Current Quarterly Earnings Per Share: How Much Is Enough?
A
ϭ Annual Earnings Increases: Look for Meaningful Growth.
N
ϭ New Products, New Management, New Highs: Buying at the Right Time.
S
ϭ Supply and Demand: Small Capitalization Plus Volume Demand.
L
ϭ Leader or Laggard: Which Is Your Stock?
I
ϭ ⌱nstitutional Sponsorship: A Little Goes a Long Way.
M
ϭ Market Direction: How to Determine It?
Please begin immediately with Chapter 1.
1
C ϭ Current Quarterly Earnings
Per Share:
How Much Is Enough?
M/A-Com Inc.
Humana Inc.
Kirby Exploration Co.
What did shares of the above-mentioned microwave component manufacturer, hospital operator, and oil service company have in common?
From 1977 to 1981, they all posted price run-ups surpassing 900%.
In scrutinizing these and other past stock market superstars, I’ve
found a number of other similarities as well.
For example, trading volume in these sensational winners swelled
substantially before their giant price moves began. The winning stocks
also tended to shuffle around in price consolidation periods for a few
months before they broke out and soared. But one key variable stood
out from all the rest in importance: the profits of nearly every outstanding stock were booming.
The common stocks you select for purchase should show a major percentage increase in the current quarterly earnings per share (the most
recently reported quarter) when compared to the prior year’s same
quarter.
Earnings per share are calculated by dividing a company’s total aftertax profits by the company’s number of common shares outstanding.
The percentage increase in earnings per share is the single most important element in stock selection today.
The greater the percentage of increase, the better, as long as you
5
Copyright 1995, 1991, 1988 by McGraw-Hill, Inc. Click Here for Terms of Use.
6
A Winning System: C-A-N S-L-I-M
aren’t misled by comparing current earnings to nearly nonexistent
earnings for the year earlier quarter, like 1 cent a share.
Ten cents per share versus one cent may be a 900% increase, but it is
definitely distorted and not as meaningful as $1 versus $.50. The 100%
increase of $1 versus $.50 is not overstated by comparison to an unusually low number in the year ago quarter.
I am continually amazed at how many professional pension fund
managers, as well as individual investors, buy common stocks with the
current reported quarter’s earnings flat (no change), or even worse,
down. There is absolutely no reason for a stock to go anywhere if the
current earnings are poor.
Even if the present quarter’s earnings are up 5% to 10%, that is simply not enough of an improvement to fuel any significant upward price
movement in a stock. It is also easier for a corporation currently showing a mere increase of 7% or 8% to suddenly report lower earnings the
next quarter.
Seek Stocks Showing Big
Current Earnings Increases
In our models of the 500 best performing stocks in the 40 years from
1953 through 1993, three out of four of these securities showed earnings increases averaging more than 70% in the latest publicly reported
quarter before the stocks began their major price advance. The one out
of four that didn’t show solid current quarter increases did so in the
very next quarter, and those increases averaged 90%!
If the best stocks had profit increases of this magnitude before they
advanced rapidly in price, why should you settle for mediocre or down
earnings?
Our study showed that among all big gainers between 1970 and 1982,
86% reported higher earnings in their most recently published quarter,
and 76% were up over 10%. The median earnings increase was 34%
and the mean (average) was up 90%.
You may find that only about 2% of all stocks listed for trading on the
New York or American stock exchanges will, at any one time, show
increases of this proportion in current quarterly net income.
But, remember you want to find the exceptional stocks rather than
the lackluster ones, so set your sights high and start looking for the
superior stocks, the small number of real leaders. They are there.
Success is built on dreams and ideas; however, it helps to know exactly what you’re looking for. Before you start your search for tomorrow’s
super stock market leader, let me tell you about a few of the traps and
pitfalls.
C = Current Quarterly Earnings Per Share
7
Watch Out for Misleading
Reports of Earnings
Have you ever read a corporation’s quarterly earnings report that stated,
“We had a terrible first three months. Prospects for our company are turning down due to inefficiencies in the home office. Our competition just
came out with a better product, which will adversely affect our sales.
Furthermore, we are losing our shirt on the new midwestern operation,
which was a real blunder on management’s part.”
No! Here’s what you see. “Greatshakes Corporation reports record sales
of $7.2 million versus $6 million (+ 20%) for the quarter ended March
31.” If you own their stock, this is wonderful news. You certainly are not
going to be disappointed. You think this is a fine company (otherwise you
wouldn’t own its stock), and the report confirms your thinking.
Is this record-breaking sales announcement a good report? Let’s suppose the company also had record earnings of $2.10 per share of stock for
the quarter. Is it even better now?
What if the $2.10 was versus $2 (+ 5%) per share in the same quarter
the previous year? Why were sales up 20% and earnings ahead only 5%?
Something might be wrong—maybe the company’s profit margins are
crumbling. At any rate, if you own the stock, you should be concerned and
evaluate the situation closely to see why the earnings increased only 5%.
Most investors are impressed with what they read, and companies love
to put their best foot forward. Even though this corporation may have had
all-time record sales, up 20%, it didn’t mean much. You must be able to
see through slanted published presentations if you want the vital facts.
The key factor for the winning investor must always be how much the
current quarter’s earnings are up in percentage terms from the same quarter the year before!
Let’s say your company discloses that sales climbed 10% and net income
advanced 12%. This sounds good, but you shouldn’t be concerned with
the company’s total net income. You don’t own the whole organization.
You own shares of stock in the corporation. Perhaps the company issued
additional shares or there was other dilution of the common stock. Just
because sales and total net income for the company were up, the report
still may not be favorable. Maybe earnings per share of common stock
inched up only 2% or 3%.
Break Down Six or Nine
Month Earnings into Quarterly
Percentage Changes
Suppose your company announces that earnings for the six months that
ended June 30 were $2.50 per share versus $2 for the same period a year
8
A Winning System: C-A-N S-L-I-M
earlier (+ 25%). Your “pet” stock must be in great shape. You couldn’t
ask for better results—or could you?
Beware. The company reported earnings for six months. What did
the stock earn in the last quarter, the three months ended in June?
Maybe in the first quarter ended in March the stock earned $1.60 per
share versus $1 (+ 60%). What does this leave for the last quarter ended
June 30? Ninety cents versus one dollar. This is a terrible report, even
though the way it was presented to you sounded terrific.
If you own common stock in a company whose earnings had been up
60% and they came out with a statement of $.90 versus $1 (down 10%),
you had better wake up. The outfit might be deteriorating.
You can’t always assume that because an earnings report appears to
be rosy, everything is fine. You have to look deeper and not accept the
reassuring manner of corporate news releases reported in your favorite
newspaper.
Many times, earnings declarations are published for the most recent
nine months. This tells you nothing, and all too often it masks serious
weakness in the numbers that really count. The first quarter may have
been up 30%, the second quarter up 10%, and the last quarter off 10%.
By always breaking down the figures to show the quarter-by-quarter
earnings, you will be able to see a completely different picture and
trend.
Omit a Company’s One-Time
Extraordinary Gains
The last important trap the winning investor should sidestep is being
influenced by nonrecurring profits.
If an organization that manufactures computers reports earnings for
the last quarter that include profits from the sale of real estate or a
plant, for example, that part of the earnings should be subtracted from
the report. Those are one-time, nonrecurring earnings and are not representative of the true, ongoing profitability of corporate operations.
Ignore them.
Set a Minimum Level for
Current Earnings Increases
As a general guide for new or experienced investors, I would suggest
you not buy any stock that doesn’t show earnings per share up at least
18% or 20% in the most recent quarter versus the same quarter the
C = Current Quarterly Earnings Per Share
9
year before. Many successful money-makers use 25% or 30% as their
minimum earnings parameter. And make sure you calculate the percentage change; don’t guess or assume. You will be even safer if you
insist the last two quarters each show a significant percentage increase
in earnings from year-ago quarters.
During bull markets, I prefer to concentrate in equities (common
stocks) that show powerful current earnings leaping 40% or 50% up to
500%. Why not buy the very best merchandise available?
If you want to further sharpen your stock selection process, before
you buy, look ahead to the next quarter or two and check the earnings
that were reported for those same quarters the previous year. See if the
company will be coming up against unusually large or small earnings
achieved a year ago.
In some instances, where the unusual year-earlier earnings are not
due to seasonal factors (the December quarter is always big for retailers,
for example), this procedure may help you anticipate a strong or poor
earnings report due ahead in the coming months.
Many individuals and institutions alike buy stocks with earnings down
in the most recently reported quarter just because they like a company
and think the stock’s price is cheap. Usually they accept a story that
earnings will rebound strongly in the near future.
While this may be true in some cases (it frequently isn’t), the main
point is that at any time in the market, you have the choice of investing
in at least 5000 or more stocks. You don’t have to accept promises of
something that may never occur when alternative investments are actually showing current earnings advancing strongly.
The Debate on Overemphasis
of Current Earnings
Recently it has been noted that Japanese firms concentrate more on
longer-term profits rather than on trying to maximize current earnings
per share.
This is a sound concept and one the better-managed organizations in
the United States (a minority of companies) also follow. That is how
well-managed entities create colossal quarterly earnings increases, by
spending several years on research, developing superior new products,
and cutting costs.
But don’t be confused. You as an individual investor can afford to wait
until the point in time when a company positively proves to you its
efforts have been successful and are starting to actually show real earnings increases.
10
A Winning System: C-A-N S-L-I-M
Requiring that current quarterly earnings be up a hefty amount is just
another smart way the intelligent investor can reduce the risk of excessive mistakes in stock selection.
Many corporations have mediocre management that continually produces second-rate earnings results. I call them the “entrenched maintainers.” These are the companies you want to avoid until someone has
the courage to change top management. Ironically, these are generally
the companies that strain to pump up their current earnings a dull 8%
or 10%. True growth companies with outstanding new products do not
have to maximize current results.
Look for Accelerating
Quarterly Earnings Growth
My studies of thousands of the most successful concerns in America
proved that virtually every corporate stock with an outstanding upward
price move showed accelerated quarterly earnings increases some time
in the previous ten quarters before the towering price advance began.
Therefore, what is crucial is not just that earnings are up or that a
certain price-to-earnings ratio (a stock’s price divided by its last twelve
months’ earnings per share) exists; it is the change and improvement
from the stock’s prior percentage rate of earning increases that causes a
supreme price surge. Wall Street now calls these earnings surprises.
I once mentioned this concept of earnings acceleration to Peter
Vermilye, the former head of Citicorp’s Trust Investment Division in
New York City. He liked the term and felt it was much more accurate
and relevant than the phrase “earnings momentum” sometimes used by
investment professionals.
If a company’s earnings are up 15% a year and suddenly begin spurting 40% to 50% a year, it usually creates the basic conditions for important stock price improvement.
Two Quarters of Major
Earnings Deceleration May
Mean Trouble
Likewise, when the rate of earnings growth starts to slow and begins
meaningful deceleration (for instance, a 50% rate of increase suddenly
decreases to only 15% for a couple quarters), the security probably has
either topped out permanently, regardless of what analysts and Wall
Street may say, or the rate of upward progress will dwindle into a
C = Current Quarterly Earnings Per Share
11
lengthy and unrewarding price consolidation period characterized by
prolonged sideways movement.
I prefer to see two quarters of material slowdown before turning negative on a company’s earnings since the best of organizations can periodically have one slow quarter.
Consult Log Scale
Weekly Graphs
One reason that logarithmic scale graphs are of such great value in
security analysis is that acceleration or deceleration in the percentage
rate of quarterly earnings increases can be seen very clearly on a log
graph.
Log graphs show percentage changes accurately, since one inch anywhere on the price or earnings scale represents the same percentage
change. This is not true of arithmetically scaled charts.
For example, a 100% stock price increase from $10 to $20 a share
would show the same space change as a 50% increase from $20 to $30 a
share on an arithmetically scaled chart. A log graph, however, would
show the 100% increase as twice as large as the 50% increase.
The principle of earnings acceleration or deceleration is essential to
understand.
Fundamental security analysts who recommend stocks because of an
absolute level of earnings expected for the following year could be looking at the wrong set of facts. A stock that earned $5 per share and
expects to report $6 the next year can mislead you unless you know the
previous trend in the percentage rate of earnings change.
Arithmetic price scale
12
A Winning System: C-A-N S-L-I-M
Log price scale
To say the security is undervalued just because it is selling at a certain
price-earnings ratio or because it is in the low range of its historical P/E
ratio is also usually nonsense unless primary consideration has first
been given to whether the momentum and rate of change in earnings is
substantially increasing or decreasing.
Perhaps this partially explains who so few public or institutional
investors, such as banks and insurance companies, make worthwhile
money following the buy-and-sell recommendations of most securities analysts.
You, as a do-it-yourself investor, can take the latest quarterly earnings
per share, add them to the prior three quarters’ earnings of a company,
and plot the amounts on a logarithmic scale graph. The plotting of the
most recent twelve-month earnings each quarter should, in the best
companies, put the earnings per share close to or already at new highs.
Check Other Key Stocks in
the Group
For added safety, it is wise to check the industry group of your stock.
You should be able to find at least one other noteworthy stock in the
industry also showing good current earnings. This acts as a confirming
factor. If you cannot find any other impressive stock in the group displaying strong earnings, the chances are greater that you have selected
the wrong investment.
Note the date when a company expects to report its next quarterly
earnings. One to four weeks prior to the report’s release, a stock frequently displays unusual price strength or weakness, or simply “hesitates”
C = Current Quarterly Earnings Per Share
13
while the market and other equities in the same group advance. This
could give you an early clue of an approaching good or bad report. You
may also want to be aware and suspicious of stocks that have gone several
weeks beyond estimated reporting time without the release of an earnings announcement.
Where to Find Current
Corporate Earnings Reports
New quarterly corporate earnings statements are published every day in
the financial section of your local paper, in Investor’s Business Daily, and
in The Wall Street Journal. Investor’s Business Daily separates all new
earnings reports into companies with “up” earnings and those disclosing
“down” results so you can easily see who produced excellent gains.
Which earnings report do you think is best?
Chart services published weekly also show earnings reported during
the prior week as well as the most recent earnings figures for every stock
they chart.
One last point to clarify: You should always compare a stock’s percentage increase in earnings for the quarter ended December, to the
December quarter a year earlier. Never compare the December quarter
to the immediately prior September quarter.
You now have the first critical rule for improving your stock selection:
Current quarterly earnings per share should be up a major percentage
(at least 20% to 50% or more) over the same quarter last year. The best ones
might show earnings up 100% to 500%! A mediocre 8% or 10% isn’t
enough! In picking winning stocks, it’s the bottom line that counts.
2
A ϭ Annual Earnings Increases:
Look for Meaningful Growth
If you want to own part of a business in your home town, do you
choose a steadily growing, successful concern or one that is unsuccessful, not growing and highly cyclical?
Most of you would prefer a business that is showing profitable growth.
That’s exactly what you should look for in common stocks. Each
year’s annual earnings per share for the last five years should show an
increase over the prior year’s earnings. You might accept one year
being down in the last five as long as the following year’s earnings
quickly recover and move back to new high ground.
It is possible that a stock could earn $4 a share one year, $5 the next
year, $6 the next, and the following year—$2. If the next annual earnings statement were $2.50 versus the prior year’s $2 (+ 25%), that would
not be a good report. The only reason it may seem attractive is that the
previous year ($2) was so depressed any improvement would look good.
In any case, the profit recovery is slow and is still substantially below the
company’s peak earnings of $6.
Select Stocks with 25% to
50% Annual Growth Rates
Owning common stock is just the same as being a part owner in a business. And who wants to own part of an establishment showing no growth?
The annual compounded growth rate of earnings in the superior firms
you hand pick for purchasing stock in should be from 25% to 50%, or
even 100% or more, per year over the last 4 or 5 years.
Between 1970 and 1982, the average annual compounded earnings
14
Copyright 1995, 1991, 1988 by McGraw-Hill, Inc. Click Here for Terms of Use.
A = Annual Earnings Increases
15
growth rate of all outstanding performing stocks at their early emerging
stage was 24%. The median, or most common, growth rate was 21% per
year, and three out of four of the prominent winners revealed at least
some positive annual growth rate over the five years preceding the giant
increase in the value of the stock. One out of four were turnarounds.
A typical successful yearly earnings per share growth progression for a
company’s latest five-year period might look something like $.70, $1.15,
$1.85, $2.80, $4.
The earnings estimate for the next year should also be up a healthy
percentage; the greater the percentage, the better. However, remember
estimates are opinions. Opinions may be wrong whereas actual reported
earnings are facts that are ordinarily more dependable.
What Is a Normal Stock
Market Cycle?
Most bull (up) market cycles last two to four years and are followed by a
recession or bear (down) market and eventually another bull market in
common stocks.
In the beginning phase of a new bull market, growth stocks are usually the first sector to lead the market and make new price highs. Heavy
basic industry groups such as steel, chemical, paper, rubber, and
machinery are commonly more laggard followers.
Young growth stocks will usually dominate for at least two bull market
cycles. Then the emphasis may change for the next cycle, or a short
period, to turnaround or cyclical stocks or newly improved sectors of
the market, such as consumer growth stocks, over-the-counter growth
issues, or defense stocks that sat on the sidelines in the previous cycle.
Last year’s bloody bums become next year’s heroes. Chrysler and
Ford were two such spirited turnaround plays in 1982. Cyclical and
turnaround opportunities led in the market waves of 1953–1955,
1963–1965, and 1974–1975. Papers, aluminums, autos, chemicals, and
plastics returned to the fore in 1987. Yet, even in these periods, there
were some pretty dramatic young growth stocks available. Basic industry
stocks in the United States frequently represent older, more inefficient
industries, some of which are no longer internationally competitive and
growing. This is perhaps not the area of America’s future excellence.
Cyclical stocks’ price moves tend to be more short-lived when they do
occur, and these stocks are much more apt to suddenly falter and
encounter disappointing quarterly earnings reports. Even in the stretch
where you decide to buy strong turnaround situations, the annual compounded growth rate could, in many cases, be 5% to 10%.
16
A Winning System: C-A-N S-L-I-M
Requiring a company to show two consecutive quarters of sharp earnings recovery should put the earnings for the latest twelve months into,
or very near, new high ground. If the 12 months earnings line is shown
on a chart, the sharper the upswing the better. This will make it possible in many cases for even the “old dog” about-face stock to show some
annual growth rate for the prior five-year time period. Sometimes one
quarter of earnings turnaround will suffice if the earnings upswing is so
dramatic that it puts the 12 months ended earnings line into new highs.
Check the Stability of a
Company’s Five-Year
Earnings Record
While the percentage rate of increase in earnings is most important, an
additional factor of value, which we helped pioneer in the measurement and use of, is the stability and consistency of the past five years’
earnings. We display the number differently than most statisticians do.
Our stability measurements are expressed on a scale from 1 to 99.
The lower the figure, the more stable the past earnings record. The figures are calculated by plotting quarterly earnings for the last five years
and fitting a trend line around the plot points to determine the degree
of deviation from the basic earnings trend.
Growth stocks with good stability of earnings tend to show a stability
figure below 20 or 25. Equities with a stability rating over 30 are more
cyclical and a little less dependable in their growth. All other things
being equal, you may want to choose the security showing a greater
degree of consistency and stability in past earnings growth.
Earnings stability numbers are usually shown immediately after a
company’s five-year growth rate, although most analysts and investment
services do not bother to make the calculation.
Earnings stability rank
If you primarily restrict your selections to ventures with proven
growth records, you avoid the hundreds of investments having erratic
earnings histories or a cyclical recovery in profits that may top out as
they approach earnings peaks of the prior cycle.
A = Annual Earnings Increases
17
How to Weed Out the Losers
in a Group
When you investigate a specific industry group, using the five-year
growth criteria will also help you weed out 80% of the stocks in an
industry. This is because the majority of companies in an industry have
lackluster growth rates or no growth.
When Xerox was having its super performance of 700% growth from
March 1963 to June 1966, its earnings growth rate averaged 32% per
year. Wal-Mart Stores, a discount retailer, sported an annual growth
rate from 1977 to 1990 of 43% and boomed in price an incredible
11,200%. Cisco Systems growth rate in October 1990 was an enormous
257% per year and Microsoft’s was 99% in October 1986, both before
their long advances.
The fact that an investment possesses a good five-year growth record
doesn’t necessarily cause it to be labeled a growth stock. Ironically, in
fact, some companies called growth stocks are producing a substantially
slower rate of growth than they did in several earlier market eras. These
should usually be avoided. Their record is more like a fully matured or
nearly senile growth stock. Older and larger organizations frequently
show slow growth.
New Cycles Create New
Leaders
Each soaring new cycle in the stock market will catapult fresh leadership stocks to the attention of the market, some of which will begin to
be called growth stocks. The growth record in itself, however, is only a
starting point for would-be victorious investors, and it should be the
first of many earnings measurements you should check.
For example, companies with outstanding five-year growth records of
30% per year but whose current earnings in the last two quarters have
slowed significantly to ϩ 15% and ϩ 10% should be avoided in most
instances.
Insist on Both Annual and
Current Quarterly Earnings
Being Excellent
We prefer to see current quarterly earnings accelerating or at least maintaining the trend of several past quarters. A standout stock needs a
18
A Winning System: C-A-N S-L-I-M
sound growth record during recent years but also needs a strong current
earnings record in the last few quarters. It is the unique combination of
these two critical factors, rather than one or the other being outstanding,
that creates a superb stock, or at least one that has a higher chance of
true success.
Investor’s Business Daily provides a relative earnings ranking (based
on the latest five-year annual earnings record and recent quarterly earnings reports) for all common stocks shown in the daily NYSE, AMEX,
and OTC stock price quotation tables.
More than 6000 stocks are compared against each other and ranked on
a scale from 1 to 99. An 80 earnings per share rank means a company’s
current and five-year historical earnings record outclassed 80% of all
other companies.
The earnings record of a corporation is the most critical, fundamental
factor available for selecting potential winning stocks.
Are Price-Earnings Ratios
Important?
Now that we’ve discussed the indispensable importance of a stock’s current quarterly earnings record and annual earnings increases in the last
five years, you may be wondering about a stock’s price-to-earnings
(P/E) ratio. How important is it in selecting stocks? Prepare yourself for
a bubble-bursting surprise.
P/E ratios have been used for years by analysts as their basic measurement tool in deciding if a stock is undervalued (has a low P/E) and
should be bought or is overvalued (has a high P/E) and should be sold.
Factual analysis of each cycle’s winning stocks shows that P/E ratios
have very little to do with whether a stock should be bought or not. A
stock’s P/E ratio is not normally an important cause of the most successful stock moves.
Our model book studies proved the percentage increase in earnings
per share was substantially more crucial than the P/E ratio as a cause of
impressive stock performance.
During the 33 years from 1953 through 1985 the average P/E for the
best performing stocks at their early emerging stage was 20 (the Dow
Profile of a standout stock
A = Annual Earnings Increases
19
Jones Industrial’s P/E at the same time averaged 15). While advancing,
these stocks expanded their P/Es to approximately 45 (125% expansion
of P/E ratio).
Why You Missed Some
Fabulous Stocks!
While these figures are merely averages, they do strongly imply that if
you were not willing to pay an average of 20 to 30 times earnings for
growth stocks in the 40 years through 1993, you automatically eliminated most of the best investments available!
P/Es were higher on average from 1953 to 1970 and lower between
1970 and 1982. From 1974 through 1982, the average beginning P/E
was 15 and expanded to 31 at the stock’s top. P/Es of winning stocks
during this period tended to be only slightly higher than the general
market’s P/E at the beginning of a stock’s price advance.
High P/Es were found to occur because of bull markets. With the
exception of cyclical stocks, low P/Es generally occurred because of bear
markets. Some OTC growth stocks may also display lower P/Es if the
stocks are not yet widely owned by institutional investors.
Don’t buy a stock solely because the P/E ratio looks cheap. There
usually are good reasons why it is cheap, and there is no golden rule in
the marketplace that a stock which sells at eight or ten times earnings
cannot eventually sell at four or five times earnings. Many years ago,
when I was first beginning to study the market, I bought Northrop at
four times earnings and in disbelief watched the outfit decline to two
times earnings.
How Price-Earnings Ratios
Are Misused
Many Wall Street analysts inspect the historical high and low price-earnings ratios of a stock and feel intoxicating magic in the air when a security sells in the low end of its historical P/E range. Stocks are frequently
recommended by researchers when this occurs, or when the price starts
to drop, because then the P/E declines and the stock appears to be a
bargain.
Much of this kind of analysis is based on questionable personal opinions or theories handed down through the years by academicians and
some analysts. Many “green” newcomers to the stock market use the
20
A Winning System: C-A-N S-L-I-M
faulty method of selecting stock investments based chiefly on low P/E
ratios and go wrong more often than not.
This system of analysis often ignores far more basic trends. For example, the general market may have topped out, in which case all stocks are
headed lower and it is ridiculous to say “Electronic Gizmo” is undervalued because it was 22 times earnings and can now be bought for 15 times
earnings. The market break of 1987 hurt many value buyers.
The Wrong Way to Analyze
Companies in an Industry
Another common, poor use of price-earnings ratios by both amateurs
and professionals alike is to evaluate the stocks in an industry and conclude that the one selling at the cheapest P/E is always undervalued
and is therefore, the most attractive purchase. This is usually the company with the most ghastly earnings record, and that’s precisely why it
sells at the lowest P/E.
The simple truth is that stocks at any one time usually sell near their
current value. So the stock which sells at 20 times earnings is there for
one set of reasons, and the stock that trades for 15 times earnings is
there for other reasons the market already has analyzed. The one selling for seven times is at seven times because its overall record is more
deficient. Everything sells for about what it is worth at the time.
If a company’s price level and price-earnings ratio changes in the
near future, it is because conditions, events, psychology, and earnings
continue to improve or suddenly start to deteriorate as the weeks and
months pass.
Eventually a stock’s P/E will reach its ultimate high point, but this
normally is because the general market averages are peaking and starting an important decline, or the stock definitely is beginning to lose its
earnings growth.
High P/E stocks can be more volatile, particularly if they are in the
high-tech area. The price of a high P/E stock can also get temporarily
ahead of itself, but so can the price of low P/E stocks.
Some High P/Es That Were
Cheap
It should be remembered that in a few captivating smaller-company
growth situations that have revolutionary new product breakthroughs,
high P/E ratios can actually be low. Xerox sold for 100 times earnings
A = Annual Earnings Increases
21
in 1960—before it advanced 3300% in price (from a split-adjusted price
of $5 to $170). Syntex sold for 45 times earnings in July 1963, before it
advanced 400%. Genentech was priced at 200 times earnings in the
over-the-counter market in early November 1985, and it bolted 300% in
the next five months. All had fantastic new products.
Don’t Sell High P/E Stocks
Short
When the stock market was at rock bottom in June 1962, a big, heavyset
Beverly Hills investor barged into the office of a broker friend of mine
and in a loud voice shouted Xerox was drastically overpriced because it
was selling for 50 times earnings. He sold 2000 shares short at $88.
After he sold short this “obviously overpriced stock,” it immediately
started advancing and ultimately reached a price equal to $1300 before
adjusting for stock splits. So much for amateur opinions about P/E
ratios being too high. Investors’ personal opinions are generally wrong;
markets seldom are.
Some institutional research firms in recent years published services
and analyses based on the principle of relative P/E ratios for companies, compared to individual company earnings growth rates. Our
detailed research over many cycles has shown these types of studies to
be misleading and of little practical value.
The conclusion we have reached from years of in-depth research into
winning corporations is that the percentage increase and acceleration
in earnings per share is more important than the level of the stock’s
P/E ratio. At any rate, it may be easier to spot emerging new trends
than to accurately assess correct valuation levels.
In summary: Concentrate on stocks with a proven record of significant annual earnings growth in the last five years. Don’t accept excuses;
insist the annual earnings increases plus strong recent quarterly earnings improvements be there.

© Copyright 2026