
2014 Fourth-Quarter and Full-Year Earnings Summary Slides (PDF
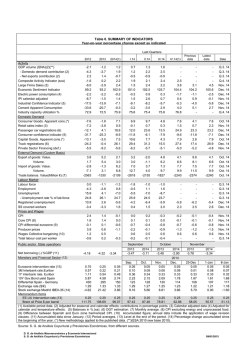
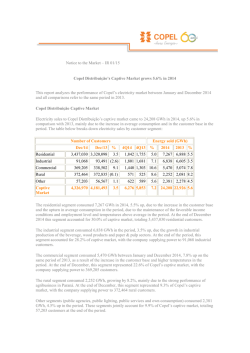
Fourth-Quarter and Full-Year 2014
Earnings Summary
January 29, 2015
Caution Concerning Forward-Looking Statements
and Non-GAAP Financial Measures
This presentation includes certain forward-looking statements within the meaning of the Private Securities Litigation
Reform Act of 1995 and Time Warner Cable intends that all such statements be covered by the safe harbor provisions
of the federal securities laws. Statements herein regarding future financial and operating results and any other
statements about future expectations constitute “forward-looking statements.” These forward-looking statements may
be identified by words such as “believe,” “expects,” “anticipates,” “projects,” “intends,” “should,” “estimates” or similar
expressions. These statements are based on management’s current expectations or beliefs, and are subject to
uncertainty and changes in circumstances. Actual results may vary materially from those expressed or implied by the
statements herein due to changes in economic, business, competitive, technological, strategic and/or regulatory
factors, and other factors affecting the operations of Time Warner Cable, including the proposed merger with Comcast
Corporation. More detailed information about these factors may be found in filings by Time Warner Cable with the SEC,
including its most recent Annual Report on Form 10-K and Quarterly Reports on Form 10-Q. Time Warner Cable is
under no obligation to, and expressly disclaims any such obligation to, update or alter its forward-looking statements,
whether as a result of new information, future events, or otherwise.
This presentation includes information regarding the historical financial performance through December 31, 2014 of
Time Warner Cable and its expectations regarding future performance, including historical financial performance as
reflected in non-GAAP financial measures such as OIBDA (Operating Income before Depreciation and Amortization),
Adjusted OIBDA, Adjusted net income attributable to TWC shareholders, Adjusted Diluted EPS and Free Cash Flow.
Please note that schedules setting out the reconciliation of historical non-GAAP financial measures to Operating
Income, net income attributable to TWC shareholders and cash provided by operating activities or other most directly
comparable GAAP financial measures, as applicable, are included in the trending schedules posted on the Time Warner
Cable company website at www.twc.com/investors and, as applicable, also are included in the Company’s earnings
release for the quarter and year ended December 31, 2014, which can also be accessed from the Company’s website.
2
Highlights
Financial Highlights
• Full-year 2014 revenue grew 3.1% year over year with Business Services revenue up 22.8%, residential high-speed data revenue up
10.4% and advertising revenue up 10.6%.
• Fourth-quarter 2014 revenue grew 3.8% year over year with Business Services revenue up 22.6%, residential high-speed data revenue
up 7.4% and advertising revenue up 19.4%.
• Full-year Adjusted OIBDA(1) was $8.2 billion — up 3.1% year over year. Operating Income of $4.6 billion increased 1.1% year over year.
• Fourth-quarter Adjusted OIBDA(1) was $2.1 billion — up 5.6% year over year. Operating Income of $1.2 billion increased 4.5% year
over year.
• Full-year Adjusted Diluted EPS(2) increased 14.4% to $7.56. Diluted EPS(3) increased 7.0% to $7.17.
• Fourth-quarter Adjusted Diluted EPS(2) increased 11.5% to $2.03. Diluted EPS(3) increased 3.2% to $1.95.
Operational Highlights
• Fourth-quarter subscriber performance in each category below was the best in at least seven years.
o Total customer relationship net additions of 67,000
o Residential high-speed data net additions of 168,000
o Residential voice net additions of 295,000 – best fourth quarter ever
o Residential video net declines of 38,000
o Residential triple play net additions of 273,000 – best fourth quarter ever
• Full-year capital expenditures of $4.1 billion reflect the Company’s accelerated investment in “TWC Maxx,” improved customer
experience and network expansion.
o The roll out of TWC Maxx, including the “all digital” conversion and Internet speeds of up to 300 Mbps, was completed in New
York City and Los Angeles during 2014. The Company expects to complete the roll out in Austin, Texas in early 2015 and plans to
expand TWC Maxx to Charlotte, Dallas, Hawaii, Kansas City, Raleigh, San Antonio and San Diego in 2015.
o TWC continued to improve its customers’ experience by deploying more than eight million new set-top boxes, digital-to-analog
converters and advanced modems in customers’ homes during 2014.
o During 2014, TWC added nearly 70,000 commercial buildings to its network, ending the year with connectivity to 930,000
commercial buildings.
• TWC achieved record “on-time” performance with technicians arriving at more than 97% of customer appointments within the
designated one-hour appointment window during the fourth quarter.
Refer to Endnotes on slide 12 for definitions.
3
Selected Consolidated Financial Results
(in millions, except per share data)
4th Quarter
Full Year
Change
2014
2013
$
Change
%
2014
2013
$
%
Revenue
$
5,790 $
5,577 $
213
3.8%
$
22,812
$
22,120 $
692
3.1%
Adjusted OIBDA(1)
$
2,140 $
2,026 $
114
5.6%
$
8,228
$
7,980 $
248
3.1%
Operating Income+
$
1,226 $
1,173 $
53
4.5%
$
4,632
$
4,580 $
52
1.1%
Diluted EPS(3)
$
1.95 $
1.89 $
0.06
3.2%
$
7.17
$
6.70 $
0.47
7.0%
Adjusted Diluted EPS(2)
$
2.03 $
1.82 $
0.21
11.5%
$
7.56
$
6.61 $
0.95
14.4%
Cash provided by operating activities+
$
1,810 $
1,599 $
211
13.2%
$
6,350
$
5,753 $
597
10.4%
Capital expenditures
$
918 $
827 $
91
11.0%
$
4,097
$
3,198 $
899
28.1%
Free Cash Flow(4)+
$
891 $
773 $
118
15.3%
$
2,347
$
2,606 $
(259)
(9.9%)
+ Operating Income is reduced by merger-related and restructuring costs of $38 million for each of the fourth quarters of 2014 and 2013 and $225
million and $119 million for the year ended December 31, 2014 and 2013, respectively. Cash provided by operating activities and Free Cash Flow are
reduced by merger-related and restructuring payments of $19 million and $20 million for the fourth quarter of 2014 and 2013, respectively, and $128
million and $111 million for the year ended December 31, 2014 and 2013, respectively.
Refer to Endnotes on slide 12 for definitions.
4
Record 4Q Subscriber Results
4Q Net Adds (Declines)
(in Thousands)
0
4Q
250
4Q
2007
-50
2008
2009
-100
2010
2011
-150
2012
2013
-200
2007
200
2008
2009
150
2010
2011
100
2012
2013
50
2014
-250
2014
0
Residential Video
Residential HSD
350
80
4Q
2007
60
4Q
2007
2008
40
2008
2009
20
2009
200
2010
0
2010
150
2011
-20
2011
2012
-40
2012
2013
-60
2013
300
250
100
50
2014
0
-100
Residential Voice
2014
-80
Total Customer Relationships
5
Total Revenue
Total Customer Relationship ARPU(5)
Revenue
($ in Millions)
$5,577
+3.8%
$5,790
$434
+2.9%
$381
$755
$616
$127.35
$123.81
$4,580
$4,601
4Q13
4Q14
Residential Services
Business Services
Refer to Endnotes on slide 12 for definitions.
4Q13
4Q14
Other
6
Revenue by Segment
Residential Services
Business Services
($ in Millions)
($ in Millions)
Other Operations+
($ in Millions)
+0.5%
$4,580
$4,601
$493
$470
$755
$23
$20
+22.6%
$93
$616
$51
$1,531
$1,644
$51
$112
$89
$70
$429
$138
$151
$2,464
$361
$293
4Q13
Video
4Q14
HSD
Voice
4Q13
Other
HSD
Voice
$498
$166
$113
$2,536
+16.1%
$278
4Q13
4Q14
Wholesale
transport
+ Includes intersegment revenue of $64 million in Q4 2014 and $48 million in Q4 2013.
Video
Other
Advertising
$332
4Q14
Other
7
Adjusted OIBDA(1) & Operating Income
($ in Millions)
Adjusted OIBDA(1)
+5.6%
Operating Costs and
+2.8%
$3,551
Expenses+
$3,650
$191
$217
$371
$387
$551
$537
Margin(6)
$2,026
$2,140
4Q13
4Q14
36.3%
37.0%
Merger-related and Restructuring Costs
—
$1,207
$38
$1,191
+3.6%
4Q13
$1,231
$38
4Q14
Operating Income
$1,318
+4.5%
4Q13
4Q14
Programming and content
Other operating
Sales and marketing
Technical operations
Customer care
Margin(7)
$1,173
$1,226
4Q13
4Q14
21.0%
21.2%
+ Total operating costs and expenses excludes depreciation, amortization and merger-related and restructuring costs.
Refer to Endnotes on slide 12 for definitions.
8
Diluted Earnings Per Share
Diluted EPS(3)
Adjusted Diluted EPS(2)
+3.2%
+11.5%
$1.89
$1.95
4Q13
4Q14
$2.03
$1.82
4Q13
4Q14
Average Diluted Common Shares
Outstanding
(in Millions)
Refer to Endnotes on slide 12 for definitions.
4Q13
4Q14
285.2
284.2
9
Capital Expenditures
Capital Expenditures
($ in Millions)
+28.1%
•
$3,198
$4,097
FY2013
FY2014
Capital Expenditures increased primarily due
to the Company’s investments (including
TWC Maxx) to improve network reliability,
upgrade older customer premise equipment
and expand its network to additional
residences, commercial buildings and cell
towers.
Capital Intensity(8)
FY2013
14.5%
Refer to Endnotes on slide 12 for definitions.
FY2014
18.0%
10
Free Cash Flow(4)
Free Cash Flow(4)
($ in Millions)
•
The decrease in Free Cash Flow was driven
by higher capital expenditures, partially
offset by an increase in cash provided by
operating activities. The increase in cash
provided by operating activities was
primarily driven by lower income tax
payments, higher Adjusted OIBDA and lower
interest payments, partially offset by an
increase in working capital requirements.
•
Free Cash Flow was reduced by mergerrelated and restructuring payments of $128
million and $111 million during 2014 and
2013, respectively.
(9.9%)
$2,606
$2,347
FY2013
Refer to Endnotes on slide 12 for definitions.
FY2014
11
Endnotes
(1) Adjusted OIBDA is defined as Operating Income before Depreciation and Amortization excluding the impact, if any, of
noncash impairments of goodwill, intangible and fixed assets; gains and losses on asset sales; and merger-related and
restructuring costs.
(2) Adjusted Diluted EPS means net income per diluted common share attributable to TWC common shareholders excluding
the impact, if any, of noncash impairments of goodwill, intangible and fixed assets and investments; gains and losses on
asset sales; merger-related and restructuring costs; changes in the Company’s equity award reimbursement obligation to
Time Warner Inc.; and certain changes to income tax provision; as well as the impact of taxes on the above items.
(3) Diluted earnings per share (EPS) is defined as net income per diluted common share attributable to TWC common
shareholders.
(4) Free Cash Flow is defined as cash provided by operating activities (as defined under GAAP) excluding the impact, if any,
of cash provided or used by discontinued operations, plus (i) any income taxes paid on investment sales and (ii) any
excess tax benefit from equity-based compensation, less (i) capital expenditures, (ii) cash paid for other intangible assets
(excluding those associated with business combinations), (iii) partnership distributions to third parties and (iv) principal
payments on capital leases.
(5) ARPU represents average monthly revenue per unit. Total customer relationship ARPU represents total revenue divided
by the corresponding average customer relationships for the period.
(6) Adjusted OIBDA margin is defined as Adjusted OIBDA as a percentage of total revenue.
(7) Operating Income margin is defined as Operating Income as a percentage of total revenue.
(8) Capital intensity is defined as capital expenditures as a percentage of total revenue.
12


© Copyright 2026