
Sare Holding SAB de CV Class B XSARE
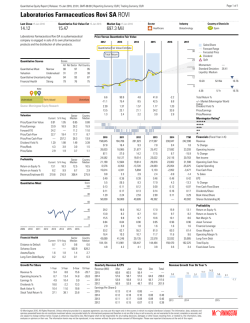
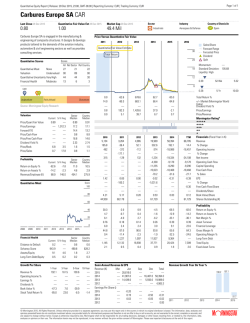
Page 1 of 1
Quantitative Equity Report | Release: 05 Jan 2016, 23:01, GMT-06:00 | Reporting Currency: MXN | Trading Currency: EUR
Sare Holding SAB de CV Class B XSARE
Last Close 05 Jan 2016
Quantitative Fair Value Est 05 Jan 2016
Market Cap 05 Jan 2016
Sector
Industry
Country of Domicile
0.02
0.02
105.0 Mil
t Consumer Cyclical
Residential Construction
MEX Mexico
The Company is engaged in the development, construction
and sale of residential and touristic buildings in Mexico.
Price Versus Quantitative Fair Value
2012
2013
2014
2015
2016
2017
Sales/Share
Forecast Range
Forcasted Price
Dividend
Split
Quantitative Fair Value Estimate
10
Total Return
Quantitative Scores
8
Scores
Momentum:
—
Standard Deviation: 57.72
Liquidity: High
All Rel Sector Rel Country
Quantitative Moat
None
Valuation
Undervalued
Quantitative Uncertainty Very High
Financial Health
Moderate
48
79
67
50
48
72
67
41
6
30
82
32
14
4
0.01
52-Wk
0.03
0.01
5-Yr
1.82
2
XSARE
t
Undervalued
MEX
Fairly Valued
Overvalued
Source: Morningstar Equity Research
Valuation
Sector
Median
Country
Median
0.81
73.8
—
3.5
3.6
—
1.9
13.8
0.92
17.8
13.8
10.6
18.1
2.25
1.7
0.9
1.02
23.6
21.2
12.1
18.7
1.56
2.0
1.4
Current 5-Yr Avg
Sector
Median
Country
Median
12.0
5.3
0.5
Current 5-Yr Avg
Price/Quant Fair Value
Price/Earnings
Forward P/E
Price/Cash Flow
Price/Free Cash Flow
Dividend Yield %
Price/Book
Price/Sales
0.86
0.9
—
—
—
—
2.3
64.8
Profitability
Return on Equity %
Return on Assets %
Revenue/Employee (Mil)
-22.8
-8.9
0.4
-67.3
-16.7
4.1
Quantitative Moat
-13.8
-30.6
-51.8
-68.1
1.8
5.4
0.0
0.7
-13.6
-11.3
—
-0.3
1.4
—
-0.1
-0.8
—
-0.3
-1.5
—
0.9
65.4
—
0.8
64.8
Total Return %
+/– Market (Morningstar World
Index)
Dividend Yield %
Price/Earnings
Price/Revenue
Morningstar RatingQ
QQQQQ
QQQQ
QQQ
QQ
Q
Financials (Fiscal Year in K)
Revenue
% Change
2010
2011
2012
2013
2014
TTM
2,341,421
-15.3
1,580,128
-32.5
388,183
-75.4
139,211
-64.1
15,775
-88.7
35,185
123.0
288,315
-31.5
93,081
-46,057
-116.0
-117,932
-1,778,078
—
-1,806,778
-1,257,567
—
-1,016,372
-738,564
—
-630,365
-245,461
—
-254,853
Operating Income
% Change
Net Income
10.5
4.4
2.1
575,811
-1,464
574,347
24.5
191,958
-2,763
189,195
12.0
1,453,518
—
1,453,518
374.4
602,295
-604
601,691
432.2
-112,557
-168
-112,725
-714.6
-128,480
—
-129,687
-368.6
Operating Cash Flow
Capital Spending
Free Cash Flow
% Sales
Score
100
0.20
-57.8
-0.08
-0.19
-193.2
0.04
-2.64
—
0.12
-1.48
—
0.12
-0.11
—
0.00
0.45
—
0.00
—
0.21
859
—
0.24
859
—
0.08
5,526
—
0.03
5,526
—
0.01
—
—
0.01
5,526
Dividends/Share
Book Value/Share
Shares Outstanding (Mil)
2.8
1.0
4.0
0.26
2.4
-3.8
-1.6
-8.2
0.20
2.4
-85.4
-31.1
-465.4
0.07
3.6
-146.1
-28.5
-730.1
0.04
14.7
-102.1
-22.6
-3,996.0
0.01
2.7
-22.8
-8.9
-724.3
0.01
2.6
Profitability
Return on Equity %
Return on Assets %
Net Margin %
Asset Turnover
Financial Leverage
24.2
12.3
1,361,027
13.2
-2.9
601,771
6.3
-458.1
311,833
-6.9
-903.4
226,600
-12.1
-4,681.9
89,507
1,351.5
-697.6
744,728
Gross Margin %
Operating Margin %
Long-Term Debt
3,759,045
3.9
3,028,526
1.0
1,203,762
0.3
187,390
9.5
1,047,488
3.3
989,429
8.0
Total Equity
Fixed Asset Turns
80
EPS
% Change
Free Cash Flow/Share
60
40
20
0
2009
2010
2011
2012
2013
2014
2015
Financial Health
Current 5-Yr Avg
Distance to Default
Solvency Score
Assets/Equity
Long-Term Debt/Equity
0.6
779.6
2.7
0.1
0.3
—
5.9
0.4
2016
Sector
Median
Country
Median
0.6
494.5
1.8
0.2
0.7
528.3
2.3
0.4
Growth Per Share
Revenue %
Operating Income %
Earnings %
Dividends %
Book Value %
Stock Total Return %
1-Year
3-Year
5-Year
10-Year
-88.7
—
—
—
-13.1
-13.6
-77.5
—
—
—
-62.2
-24.4
-64.4
—
—
—
-49.6
-59.9
-40.0
—
—
—
—
-44.6
Quarterly Revenue & EPS
Revenue (Mil)
Mar
2015
0.0
2014
45.6
2013
57.8
2012
402.0
Earnings Per Share ()
2015
-0.02
2014
-0.04
2013
-0.08
2012
-0.08
Revenue Growth Year On Year %
Jun
66.0
18.1
232.2
322.5
Sep
26.5
9.4
83.5
362.7
Dec
—
-57.3
-234.3
-699.0
Total
—
15.8
139.2
388.2
-0.01
-0.05
-0.45
-0.42
0.00
-0.50
-0.45
-0.38
—
0.46
-0.50
-1.51
—
-0.11
-1.48
-2.64
265.0
182.4
-21.1
-77.0
2013
-66.5
-92.2
-88.8
2014
© Morningstar 2016. All Rights Reserved. Unless otherwise provided in a separate agreement, you may use this report only in the country in which its original distributor is based. The information, data, analyses and
opinions presented herein do not constitute investment advice; are provided solely for informational purposes and therefore is not an offer to buy or sell a security; are not warranted to be correct, complete or accurate; and
are subject to change without notice. Except as otherwise required by law, Morningstar shall not be responsible for any trading decisions, damages or other losses resulting from, or related to, the information, data,
analyses or opinions or their use. The information herein may not be reproduced, in any manner without the prior written consent of Morningstar. Please see important disclosures at the end of this report.
-75.6
-100.0
2015
®
ß
© Copyright 2026