
Synthesis and characterization of nanocrystalline UO2 ceramics
Synthesis and characterization of
nanocrystalline UO2 ceramics
DOCTORAL THESIS
Dissertation by
M.Eng. Raquel Jovani-Abril1,2
Directors:
Prof.Dr. Arturo López Quintela1
Dr. José Luis Spino2
1
2
Universidad de Santiago de Compostela (USC), Spain
Institute for Transuranium Elements (ITU), Germany
Santiago de Compostela (Spain), 2014
Memoria de tesis presentada por Raquel Jovani-Abril para la obtención del título de
Doctor por la Universidad de Santiago de Compostela dentro del Programa de Doctorado en Ciencia de los Materiales.
Raquel Jovani-Abril
i
ii
D. Arturo López Quintela, Profesor Doctor Catedrático del Departamento de
Química-Física de la Universidad de Santiago de Compostela, y D. José Luis Spino,
Investigador Doctor Senior del Institute for Transuranium Elements Joint Research
Centre de la Comisión Europea,
informan:
Que la presente memoria, titulada “Synthesis and characterization of nanocrystalline UO2 ceramics” (“Síntesis y caracterización de cerámicas nanocristalinas de
UO2 ”), que para optar al título de Doctor por la Universidad de Santiago de
Compostela dentro del Programa de Doctorado en Ciencia de los Materiales
presenta Dª. Raquel Jovani-Abril, ha sido realizada en el Institute for Transuranium Elements Joint Research Centre de la Comisión Europea en colaboración con el
Departamento de Química Física de la Universidad de Santiago de Compostela bajo
nuestra dirección.
Considerando que constituye trabajo de Tesis, autorizan su presentación en la
Comisión de Tercer Ciclo de la Universidad de Santiago de Compostela.
Y para que así conste, firmamos el presente informe:
Prof.Dr. Arturo López Quintela
Dr. José Luis Spino
iii
iv
Al fin y al cabo somos lo que hacemos para cambiar lo que somos.
Eduardo Galeano
A Daniel i Jordi
v
vi
Acknowledgements
The work presented in this study has been carried out in the framework of a European
thesis to obtain the degree of Doctor from the University of Santiago de Compostela
(USC) and sponsored by the European Commission. This thesis has been enabled by
the collaboration and direction of Prof.Dr. Arturo López Quintela from the Department
of Physical-Chemistry of the USC, and Dr. José Luis Spino from the Nuclear Fuels
Department of the Institute for Transuranium Elements (ITU). I wish to express my
gratitude to both of them to take the challenge of the supervision of the thesis and the
collaboration in the distance.
I would like to thank the Director of ITU, Prof.Dr. Thomas Fanghänel, for offering
me the opportunity to make the research in this renowned institute.
I want to greatly acknowledge Dr. Daniel Baron, Dr. Joaquin Cobos Sabaté,
Prof.Dr. Joan de Pablo Ribas, Prof.Dr. Ian Farnan, Prof.Dr. Haas Didier, Dr. Ralph
Hania, Dr. Rikard Malmbeck, Prof.Dr. Francisco Rivadulla, Dr. Vicenzo V. Rondinella,
Dr. Joseph Somers, Prof.Dr. Carlos Vázquez Vázquez and Dr. Marcus Walter, who
accepted without complications to be part of the possible elected members of the
jury/revisers for my thesis defence.
I want now to special thank all the colleagues who made that experience possible.
I do not use here your title, but your name. Not because I do not want to treat you
with the respect you all deserve, but because your title does not say anything about
you as a person. It is your name, which represents for me the patience, the love, the
time and the laughter we enjoyed together.
First, thank to the Nuclear Fuels Department because, although I was moving
around any corner of the institute, this was the unit I was belonging to. I really
enjoyed the four years with you.
Thanks to Marc Couland, Herwin Hein and Serge Fourcaudot. You showed me how
to move inside this special institute in my first time in ITU as a trainee and later on in
the PhD. You opened doors for me which would remain longer closed for a new student.
Thanks also for slowly trusting me making your baby-experiments. For finishing the
preparation of my samples for an urgent project when I needed to fly to Spain without
expecting it from one day to the other. Thanks for the office-conversations.
Thanks to Michael Holzhäuser, Co Boshoven, Mairead Murray Farthing, John
Mcginley, Sarah Stohr, Patrick Lajarge, Sebastien Gardeur, Antony Guiot, Emmanuel
Vermorel, Andrea Cambriani, Alexandre Dockendorf and Annette Küst, who worked
in one or other step of the pellet performance. Thank to put your specific experience
in this work.
vii
Olivier Pauvert, Chris Selfslag, Ivana Bianchi, Ian Farnan and later Laura Martel,
for the patience in the preparation of the NMR samples, the different attempts and
posterior interpretation of the results. Marika Vespa for the EXAFS experience in
ANKA and Damien Prieur for helping me that much with the interpretation even
without knowing us personally. Merci!
Thanks to the electrochemistry group Mathieu Gibilaro, Christophe Nourry, Pavel
Souc̆ek and Michel Ougier for the experiments together, for the transport of the
equipment from one wing to another, from the set-up arrangements. Paul Carbol to
borrow me the wing-A fume hood although I was not belonging to his group. Wim
de Weerd, Dimitrios Papaioannou and Didier Laux for the SAM tests. Thank to the
people working in the Hot Cells Department to allow me to take the cupboard keys each
time I was looking for something to set up my experiments. Miriam Weiss, Alfred Morgenstern and Christos Apostolidis for the supply of material for my experiments when I
was missing something. Thanks for the strong and warmly holá each morning in wing-F.
Eric Colineau and Jean-Christophe Griveau for the first tests to determine magnetic
properties of this nc-material. Damien Hudry for our office-discussions late in the
evening. Stephen Heathman and Carmen Elena Zvoriste-Walters for the studies about
the HP-XRD and nc-UO2 . Special thank to Giorgio Pagliosa, Daniel Bouëxière and
Rachel Eloirdi who analyzed and discussed with me no idea how many samples under
the XRD and the HT-XRD.
Arne Janssen, Bert Cremer, Hartmut Thiele and Thierry Wiss. I want to thank
you for the beautiful TEM/SEM pictures you took from my nanoparticles and from
the pellets in all the possible positions always surrounded by the music of Radio Swiss
Classic. Markus Ernstberger to teach me about indentation and let me open door to
his lab. Sylvain Morel for those first oxygen determination tests. Ondr̆ej Benes̆ for the
time spent with me in the Raman determination. Markus Beilmann to borrow me his
glove-box in those last experiments. Darío Manara for the melting point determination
tests. Alessandro Zappia and Dragos Staicu for the thermal diffusion determination.
Luka Vlahovic for the POLARIS tests. I would like to thank Rudy Konings to let me
work with the team and instruments of the Material Research Department although I
was not belonging to his unit. Thanks you for the smile that you constantly give.
Asunción Fernández Carretero as my supervisor in my time in ITU as trainee. You
were right and in the end (I was not that sure at the beginning) you left me here with a
good team of supervisors for the PhD. Roberto Caciuffo to put me in connection with
my thesis-Director who for coincidence was also from Spain (but from the opposite
side where I am coming from!). I have never imagined I would go to Santiago de
Compostela by plane.
I am greatly indebted with der Elektriker, with Fritz, Alfred and all the team of
Joachim Küst, who really changed thousand and one things I asked for the set-up of
my glove-boxes. Danke, dass ihr immer so schnell und ernst meine Anfragen bearbeitet
habt. Danke an die ganze AGS-Gruppe, aber besonders an Rainer Thrun für deine
keine Ahnung wie viele Kontrollen. Für deine jeden Tag (das ist überhaupt nicht
leicht!) freundliche Art und Weise mit den Menschen umzugehen.
viii
Birgit Christiansen for the effort to get together all the students. Corinne Brossard,
Matthias Schulz, Monica Marucci doing easily the not easy task of taking material
in and out from ITU. The IT-team but in special to Uemit Zobu, who received the
major part of my computer-problem-calls. Klaus Paris und Giovanni von IKFT für
das Bauen meines Reaktors.
Many thanks to Krisztina Varga, Petra Strube, Ursula Brettschneider and specially
to Anna Matthei-Socha (danke auch für deine vor-Eventmeineslebens-Empfehlungen),
Fermín Pérez-Painceiras and Benito Doce, who always immediately resolved any
problem I had with the administration work at different stages of the PhD. Muy
agradecida!
I wish now to thank all the people with whom I shared this time in a more beautiful
and funnier way with excursions, sharing flat, birthdays, meetings at Mühlburger-TorGuesthouse, sharing the everyday-forest-bike-journey to ITU, weddings, coffees, bon
dia noia com si estigués a Sant Mateu, meals in the canteen, parties in Schlosspark,
travels, confidences, advices and friendship distributed now everywhere around the
world. Thanks to Cedric Cozzo, Caroline Cozzo, Julie Tondeur, Stefan Maenhout,
Simona Nucifora, Matteo Ciucci, Ernesto González Robles, Ernesto Fontana, Gerard
Montagnier, Frank de Bruycker, Petronela Gotcu-Freis, Konstantinos Boboridis,
Danilo Maddalo, Catherine Ho, Pietro Botazzoli, Rosa Sureda Pastor, Ivana Bianchi,
Martin Vargas Zuniga, Joan Horta Domenech, Pedro Amador Celdrán, Ramon Carlos
Márquez, Victor Esteban Gran, Ana Isabel Martínez-Ferri, Belén Hurtado, Daniel
Serrano Purroy, Eddie López-Honorato, Mathieu Gibilaro, Ondr̆ej Benes̆, Carmen
García Pérez, Laura Aldave de las Heras, Encarnación Luque Pérez, Mariangela
Cardinale, Alfred Jiménez Segarra, Stefanie Kannengiesser, Tomasz Klimczuk, Betül
Öztürk, Marco Klipfel, Judit Krajko, Ilaria Marchetti, Peter Pogany, Francesca Quinto,
Zeynep Talip, Antonio Garcia Miralles, Joanna Ciezkowska, Robert Böhler, Doroteya
Kostadinova, Katalin Bárczi, Octavian Valu Sorin, Michael Welland and Mattia
DelGiacco.
Also thanks to the funny people of the course “Science and Technology of Colloids and Interfaces” for the great time discovering together the city of Santiago de
Compostela. The climbing club, Ralf Gretter, Arne Janssen, Noreen Lembke, Markus
Ernstberger, Sylvain Morel, Markus Beilmann, Stefaan Van Winckel and Philipp Pöml.
It was great to learn from you how to “just” trust the person who is down securing
you. The Quartier Latin, for the singing evenings even if sometimes we were quite
out of tune. Merci to Mark Sierig, Darío Manara, Eglantine Courtois, Ana Sánchez
Hernández and specially to Matteo Rini, Alessandro Zappia and Clarita Riva que ya
sois como medio de la familia.
To Úrsula Carvajal-Núñez. When you arrived I felt my area invaded. There was
no place for two Spanish. But in the end you became the confident of the most of
my private worries. Gracias por estar tan loca de venirte hasta España y volverte sin
pasar por la Mare de Déu. Para mi es como si hubieses estado allí.
I wish to express my truthful gratitude to Rikard Malmbeck, José Luis Spino and
Joseph Somers. It was a great combination because depending on what I needed, I
could always ask one or the other for advice. It made me feel I was not belonging to
one unit but I was connected to the whole institute. It was a pleasure to speak, discuss
ix
and also argue with you. I have learnt a lot because of the latter.
Thank to Rikard Malmbeck because of everything I learnt from you in the labs.
For discussing with me in the afternoon to find solutions for the problems which were
appearing at each step. For connecting me to so many people. For having the aptitude
to perceive when somebody is not feeling right.
Thank to José Luis Spino because your wonderful source of ideas. For transmitting
to me the deep knowledge and passion you have for this novel nano-structure. I tried
to defend it in the institute as if the idea was mine. Thanks for the personal friendship
we have developed in parallel to this thesis.
Thank to Joseph Somers because you brought clarity and structure to the abstract.
Because I took you as referent point when things shifted. Because you told me you
would stay there, and it was like that in the end. I am really grateful for your help in
the not easy task to conclude the project.
A special thank I want to give to the people who had and has the major influence
in the person that today I am.
I want to thank Juan Luis Jovaní Ripoll and Obdulia Abril Ferreres because
of the cheerful childhood I had. Because you were there to give me strength in
that first important time of my life. Because you worked 25 hours a day to give
us the education we have. Because you gave me the values which accompany
me everywhere I am. Because the new relationship we are building now together
after things have changed that much. Thank to Magdalena Jovaní Ripoll because
I know you gave me always, the in-your-own-way best love you had. Thank to
Amparo Ripoll Ferrer because even if not being really present in this period of my
life, you transmitted me your vigour and the roots, which I grasp when I miss my
path. Thank to Ruth Jovaní Abril, because despite of our distance you are the person
I know I can always trust. The person, who is always there whatever changes around us.
Finally I want to thank the two most important persons in my today-time, who are
responsible for making me continuously think outside the box. Jordi Forchheim-Jovani,
thank for your novelty, your each day to day teaching, your smile and laughter, your
moment-presence, your energy, your cheerfulness. Because you have given me the
present to experience something so precious in my life. Thank to Daniel Forchheim,
because you are the one who really supported and encouraged every moment in all
this process. The pre, during and after. Thank for your patience and love. It has been
astonishing to live so many special moments since we knew each other. Thank to be
as cheerful as a child. Thank to be that open to reflect from the difficult situations we
had. It is wonderful to grow and grow from all that together. It is really amazing to
experience together this deep-revolution in our private-professional-outside-inside-lives.
To all of you who brought me were I am now...
... una abraçada gegant!
Raquel
x
Abstract
High-performance ceramics with nanosized grains provide today the technical base
for a large variety of improved applications in many technologies. This type of
microstructure is of special interest as well in the nuclear field as it appears at the
periphery of light water reactor (LWR) UO2 fuels at high burn-up (BU), where the
material transforms spontaneously to a closed porous nanocrystalline nc-structure after
surpassing a critical dose. The mechanical properties of this newly formed material are
superior to those of the fresh fuel due to the nanostructure. Taking this into account,
the aim of this work is to develop a fuel consisting of nc-UO2 , which, besides the
advantages of enhanced plasticity and faster creep, characteristic of the nc-state, which
diminish the pellet clad interaction (PCI) stresses and cladding failure risks, has also
the potentiality to develop closed porosity under irradiation, to largely retain fission
gases. The study of its behaviour is therefore important, especially during accident
conditions under which large amounts of radioactive fission products could be released
into the reactor vessel, or to the exterior if the core containment breaks. Its potentiality for retention of fission gas and its improved mechanical properties and resistance
to radiation-damage make so the nc-fuel material worthy of deep experimental analysis.
xi
xii
Resumen
Origen del estudio
Hoy en día los combustibles nucleares están hechos en gran medida de dióxido de
uranio (UO2 ). Se ha alcanzado ya un alto nivel de competencia en este tipo de
tecnología con combustibles desde medio hasta alto grado de combustión en el reactor.
Sin embargo, se necesitaría un enfoque más radical para alcanzar grados de combustión
(BU; burn-up) más elevados reduciendo así la cantidad de combustible fresco inicial
necesario y por tanto la cantidad de combustible usado (residuos radiactivos). Para
ello se requiere una mejora en la capacidad del combustible para retener los gases de
fisión, así como una solución para la interacción mecánica y química (PCMI y PCCI;
pellet clad mechanical and chemical interaction) con el revestimiento de la varilla que
contiene las pastillas de combustible. El riesgo de fallo de este revestimiento podría
intensificarse a altos grados de combustión debido al incremento de fragilidad del
mismo. Así pues, se puso un proyecto en desarrollo con el objetivo de sintetizar polvo
nanocristalino (nc)-UO2 para la fabricación de pastillas (monolitos) de nc-combustible
y posterior caracterización de sus propiedades mecánicas fuera de pila, así como su
comportamiento bajo irradiación.
El origen de la idea que empujó este estudio se encuentra en minuciosas observaciones previas de la transformación que sufren los combustibles nucleares altamente
irradiados. La pastilla de combustible dentro del reactor nuclear es un material
sometido a condiciones extremas que van cambiando sus propiedades con el tiempo
y la dosis de irradiación. Aparecen daños y defectos locales como intersticiales,
bucles y vacantes. Además, la acumulación de productos sólidos de fisión en el
parámetro de red, así como la formación de burbujas de gas, disminuyen aún más
las propiedades térmicas de la pastilla de combustible. La aparición de grietas en
la pastilla debido a las tensiones térmicas sucede desde el primer momento en que
se inicia la irradiación. Asimismo se produce un hinchamiento de las pastillas de
combustible debido a la acumulación de las burbujas de gas de fisión que se forman
en la matriz y de la segregación de productos de fisión de baja densidad (precipitados
metálicos y cerámicos). El material combustible se aproxima al revestimiento de la
varilla que lo contiene como resultado de este hinchamiento. La interacción física y/o
química por contacto con el revestimiento puede inducir el deterioro del revestimiento
y su ruptura [Garzarolli et al., 1979]. Este tipo de cambios pueden afectar también
el perfil de temperatura de la pastilla de combustible por modificación de las condiciones de transferencia térmica en el espacio entre el combustible y el revestimiento,
limitando también el tiempo de vida del combustible (y el grado de combustión o BU)
en el interior del reactor en el caso que se produjese una ruptura prematura de la varilla.
El combustible nuclear sufre una transformación en su estructura tras el daño
acumulado una vez alcanzado el tercer ciclo de irradiación (alrededor de 40 GWd/tM).
xiii
Esta transformación comienza en el borde de la pastilla del combustible y de
manera constante progresa hacia el interior mientras se sucede la irradiación
[Matzke and Spino, 1997] [Spino and Papaioannou, 2000]. La microestructura original de micro- granos (o granos-grandes) se transforma en una matriz nc-porosa
[Nogita and Une, 1994] a través de la reestructuración de los defectos de irradiación
acumulados. Se trata de un tipo de acción de “auto-curación”, donde el material
se cura del daño sufrido reordenándose a sí mismo [Spino et al., 2012]. La nueva
nc-estructura que aparece entonces, recibe el nombre de estructura de alto grado
de combustión (HBS; high burn-up structure), también llamada estructura de borde
(rim-structure) porque en los combustibles de UO2 ésta se inicia en el borde o en las
zonas exteriores de las pastillas (región que recibe mayor cantidad de fisiones).
En un principio se pensó que la HBS era la causa de los fallos que observados en el
revestimiento de las varillas debido a aumento adicional del volumen (hinchazón) en
pila y un supuesto comportamiento frágil del material así transformado [Matzke, 1992].
Además se creyó que esta estructura que aparece en el borde de la pastilla podría
actuar como una nueva fuente de liberación de gas. De hecho todavía hay líneas de
investigación que defienden esta opinión. Sin embargo, otros estudios han demostrado
que el porcentaje de gas liberado desde el borde de las pastillas de combustible, donde
aparece la HBS, es bajo en comparación con el gas que viene de las partes internas de
la pastilla donde la estructura original todavía está presente [Mogensen et al., 1999]. A
esta segunda filosofía le han seguido otras publicaciones que demuestran un evolución
en general favorable de las propiedades del combustible con la aparición de esta nueva
estructura a altos valores de combustión, en particular el aumento en la retención de
los gases de fisión.
Asímismo, las propiedades de la HBS indican una mayor tolerancia a la radiación
[Spino et al., 2012]. Este estudio coincide con una evidencia importante e innovadora
en la literatura que demuestra que los materiales de granos nano resisten más el daño
por radiación que los correspondientes materiales de grano micro, debido a la recombinación de defectos en los múltiples límites de grano [Nita et al., 2005]. Se anticipan
también otras tendencias en el material como la mejora de la conductividad térmica
y otros efectos de la radiación en las propiedades del material debido a la liberación
de estrés en el parámetro de red después de la recristalización [Ronchi et al., 2004], así
como el aumento de la tenacidad a la fractura y curación de grietas [Spino et al., 2003].
En lo que concierne a la seguridad, los últimos experimentos realizados en combustibles sometidos a alto grado de combustión en reactores nucleares de agua ligera
(LWR; light water reactor), no indicaron aumento en la liberación de gas, así como
tampoco en la susceptibilidad de fallo durante accidentes de reactividad iniciados (RIA;
reactivity initiated accident) transitorios [Sasajima et al., 2010] [Fuketa et al., 2006].
También ha sido observada una disminución de la velocidad de corrosión acuosa bajo
condiciones típicas de depósito geológico simuladas en combustibles con presencia
de HBS [Ekeroth et al., 2009] [Carbol et al., 2009]. Ambos hechos confirmaron la
estanqueidad de esta estructura.
Así pues, se ha demostrado que la HBS tiene cualidades excepcionales incluso en
comparación con la matriz original (estructura de grano-grande), con una mejora de
propiedades que serían muy ventajosas para un combustible. Entonces, ¿por qué no
imitar este material recristalizado?. ¿Por qué no imitar esta estructura (HBS) que
xiv
aparece en el borde del combustible a altos grados de combustión y se introduce en esta
forma como un combustible nuevo en el interior del reactor?. ¿Por qué no sintetizar
una matriz de combustible mimetizando la HBS que debido a su aparente resiliencia
al daño resistiría tiempos más largos bajo irradiación?.
Aquí es cuando empieza el desarrollo de este proyecto con el objetivo de sintetizar polvo nanocristalino (nc)-UO2 para la fabricación de pastillas (monolitos) de
nc-combustible. Las piezas monolíticas fabricadas a partir de este polvo, tendrían un
volumen de aproximadamente 1 cm3 y una matriz uniforme de granos de un tamaño
entre 100 y 250 nm imitando la estructura que aparece a altos grados de combustión
(HBS; high burn-up structure). Durante este trabajo se consiguió la creación de esta
nueva microestructura de combustible pasando por distintas fases. Desde la síntesis
del nc-material, a la fabricación de la pastilla de combustible, distintas etapas de
este proceso, previamente desconocido o inexplorado, tuvieron que ser especialmente
desarrolladas y/u optimizadas.
Síntesis de nc-UO2 y nc-ThO2
Un trabajo considerable fue dedicado al desarrollo del polvo inicial para la producción
de los monolitos o pastillas de nc-UO2 imitando la HBS que aparece en los combustibles
de los LWR. Dos vías de síntesis química diferentes fueron estudiadas para obtener
precipitados defloculados de nc-UO2 y nc-ThO2 como compensación a la falta de
disponibilidad comercial. El ThO2 tiene una estructura similar al UO2 pero tiene, a su
vez como ventaja, una sola valencia (IV ). Para conseguir obtener mayores cantidades
de nc-UO2 que las publicadas en literatura, y proporcionar así material suficiente para
la fabricación de los monolitos, ambos métodos fueron convenientemente ajustados,
desarrollados y escalados de acuerdo a las necesidades. El material así producido fue
objeto de estudio mediante microscopio electrónico de transmisión (TEM) y difracción
de rayos X (XRD).
El primer método desarrollado fue una precipitación controlada que utiliza una
disolución acuosa electrolíticamente reducida de nitrato de uranilo como precursor
y una solución goteada de NaOH como agente de alcalinización para desencadenar
la precipitación del nc-material lo más próximamente posible a la línea de solubilidad del UIV . Este método fue originalmente descrito por [Rousseau et al., 2002],
[Rousseau et al., 2006]. Un estudio intensivo de los rango de concentración de U y
acidez en los que se produce la precipitación de nc-UO2+x fue llevado a cabo. Se
utilizaron para ello disoluciones de nitrato de uranilo electrolíticamente reducidas,
usando U-concentraciones más elevadas (10−1 M) que las observadas en literatura
(10−2 M) [Rousseau et al., 2006], y por tanto intervalos de pH de trabajo más bajos,
siempre siguiendo la línea de solubilidad del UIV . Como resultado se obtuvieron hasta
10 g de nc-UO2+x por experimento, en lugar de los pocos nanogramos publicados hasta
ahora en literatura. La fase sólida así obtenida y estudiada bajo XRD, cristalizó bajo la
típica estructura de fluorita UO2 -fcc (grupo espacial Fm-3m), con un parámetro de red
a=0.5417(1) nm y un tamaño de cristal promedio de 3.79 nm, también en concordancia
con el tamaño medio observado por TEM de 3.9(8) nm. El difractograma predominante
de las muestras correspondía inequívocamente a UO2 pero en un estado ligeramente
oxidado. Esto último se manifestó a través de una contracción del parámetro de red
de aproximadamente 0.9% de la fase precipitada (a=0.5417(1) nm) con respecto a los
xv
valores típicos de UO2 estequiométrico (a=0.547 nm).
El segundo método estudiado fue una descomposición térmica en fase orgánica
usando acetilacetonato de uranilo (UAA) como precursor. Éste se añade a una
mezcla de ácido oleico y oleilamina calentándose a continuación hasta temperaturas
por encima de los 300°C para inducir la precipitación de las nanopartículas de UO2
por descomposición térmica del UAA. Este procedimiento fue descrito originalmente
por [Wu et al., 2006] y fue aquí modificado para reducir la cantidad de agentes
tensoactivos respecto al porcentaje de metal utilizado. AsÌ mismo, se escalaron los
0.1 g de nc-UO2 por experimento obtenidos según lo publicado por [Wu et al., 2006],
a 2.3 g de nc-UO2 por experimento en el presente trabajo. El mismo método fué
extrapolado para la síntesis de nc-ThO2 , utilizando acetilacetonato de torio (ThAA)
o acetato de torio (ThA) como precursores, obteniéndose finalmente nano-varillas de
ThO2 . La razón por la cual se obtuvieron precipitados en forma de varilla, en vez de
la forma esférica obtenida para nc-UO2 , es todavía desconocida en este estudio. El
rendimiento por experimento (0.3 g nano-varillas de ThO2 ) fue más bajo que en la
síntesis de nc-UO2 por el mismo método. Tanto en la síntesis de nc-UO2 como en la
de ThO2 bajo este método, se probaron diferentes condiciones de trabajo: velocidad
de calentamiento, tiempo de envejecimiento de la disolución final, temperatura de
envejecimiento, así como distintos precursores iniciales (ThAA y ThA) en la síntesis
de nc-ThO2 . No obstante, se encontraron siempre resultados similares en términos de
estructura y geometría (esféricas para nc-UO2 y en forma de varilla para nc-ThO2 ) de
los precipitados. En el estudio bajo el XRD se determinó una fase sólida perfectamente
cristalizada con la típica estructura de fluorita UO2 -fcc (grupo espacial Fm-3m), un
tamaño de cristal promedio (diámetro de la esfera) de 5.52 nm y un parámetro de red
de 0.5431(0) nm, también en concordancia con el tamaño promedio observado con el
TEM de (4.9(3) nm) y por dispersión dinámica de luz (DLS) de (3.7(1) nm). En las
nano-varillas de ThO2 , se encontró una estructura típica de fluorita (grupo espacial
Fm-3m) ThO2 -fcc, con un tamaño de cristalito (diámetro varilla) de 1.42 nm y un
parámetro de red de 0.5579(1) nm. No se observó agregación de partículas en las
imágenes de TEM del material sintetizado por ambos métodos.
Cristalización y crecimiento de grano en f(T) del ncUO2
La composición de los precipitados obtenidos por ambos métodos arriba mencionados
y su propensión a la expansión térmica en el estado no consolidado, se estudiaron
en el material así sinterizado y recocido a diferentes temperaturas. Para ello se
utilizaron técnicas de análisis térmico y de difracción de rayos X, como el análisis
termogravimétrico y el análisis térmico diferencial (TGA/DTA), difracción de rayos X
(XRD) y difracción de rayos X a alta temperatura (HT-XRD), técnicas espectroscópicas tales como la espectroscopía de absorción de rayos X (XAS), espectroscopía de
resonancia magnética nuclear (MAS-NMR), espectroscopía infrarroja (IR), y técnicas
de caracterización como la microscopía electrónica de transmisión (TEM).
La evolución del tamaño de los cristales, el parámetro de red y la tensión de red se
determinaron para el material así sintetizado y a distintas temperaturas de recocido
del material (bajo atmósfera inerte) hasta 1200°C. Para el caso del material nc-UO2
xvi
precipitado en fase acuosa se observó tan sólo un pequeño aumento en el tamaño de
los cristales, permaneciendo éstos por debajo de los 7 nm hasta llegar a la temperatura
de recocido de 700°C. A partir de esta temperatura, el tamaño de los cristales creció
acusadamente y de manera constante con la temperatura, hasta alcanzar un valor de
73 nm a 1200°C. Por el contrario, el incremento mayor del parámetro de red se observó
en el intervalo más bajo de temperatura 20°C-700°C. En el intervalo 700°C-1200°C
sólo se observó un pequeño aumento en el parámetro de red coincidiendo con la
expansión térmica reversible típica del UO2 . Hay que añadir que en la mediciones del
parámetro de red a temperatura ambiente y después del tratamiento a temperatura
bajo atmósfera estática de He, se observó una recuperación de la estructura típica
cristalina del UO2 , pasando del valor de parámetro de red inicial de 0.5417 nm para el
nc- UO2 así sintetizado, a un valor de 0.5473 nm después de la exposición a 1200°C.
La contracción del parámetro de red inicialmente medida para el material nc-UO2 así
sintetizado por debajo del valor normal típico para UO2 (a=0.5470 nm) se atribuyó
principalmente a oxidación.
En el caso del nc-UO2 precipitado por el método en fase orgánica, se observó un
comportamiento similar en el crecimiento de las partículas con la temperatura, sin
apenas cambio en el tamaño de cristal hasta una temperatura de 700°C (debido al
pre-tratamiento a temperatura aplicado), seguido de un crecimiento intenso del tamaño
de cristal hasta obtener un tamaño de 150 nm a 1100°C. Se determinó una oxidación
inicial de las partículas sintetizadas bajo el método en fase orgánica derivada de los
valores de parámetro de red, aunque menos acusada que en las partículas sintetizadas
en fase acuosa. Las partículas recobraron el valor típico de parámetro de red para UO2
a temperaturas de recocido por encima de los 750°C.
En cuanto al parámetro de estrés de red, un comportamiento similar fue también
observado para las partículas obtenidas por ambos métodos. La observación principal
en ambos casos fue la disminución continua del parámetro de estrés con la temperatura,
hasta extinguirse prácticamente a la temperatura en que los cristales empezaron a
crecer. Esto confirmaba que la presencia del parámetro de estrés de red actuó en
ambos casos como inhibidor del crecimiento cristalino.
Estudio de la estructura y estequiometría del oxígeno
mediante XRD, XANES, EXAFS, NMR AND FTIR
La estructura del material nc-UO2 producido en función de la temperatura pero en este
caso bajo atmósfera reductora, se estudió también bajo el XRD y se comparó con el
material de referencia UIV O2 -grano-grande (granos de tamaño micrométrico). Se midió
el parámetro de red del material tras enfriarse después de alcanzar diferentes temperaturas máximas (600°C y 1200°C). Esto permitió la separación de la contribución de
la expansión térmica en los valores medidos a temperatura para obtener curvas más
limpias de expansión térmica frente a temperatura, y parámetro de red frente a tamaño
de cristal. No se encontraron grandes diferencias en el tamaño de cristal, parámetro de
red y tensión, entre las mediciones realizadas bajo atmósfera inerte (arriba comentado)
y bajo atmósfera reductora (medición realizada tras el enfriamiento) para el material
obtenido por el método acuoso. Sin embargo. se observó un cambio notable en el
tamaño de los cristales para el material obtenido por el método orgánico al llegar a
xvii
temperaturas de recocido de 1100°C bajo atmósfera de He con una talla de cristal de
150 nm, y un tamaño de tan sólo de 12 nm bajo atmósfera de Ar/5%H2 . Comparando
el material nc-UO2 obtenido por ambos métodos, acuoso y orgánico, bajo atmósfera
reductora (Ar/5%H2 ) y sin ningún otro tratamiento térmico previo del polvo, no se
detectaron grandes cambios hasta la temperatura de recocido de 600°C. Pero sí se
observaron a la temperatura de 1200°C, obteniendo un tamaño de 82 nm para el
material del método acuoso frente a 12 nm para el material del método orgánico.
Esto podría ser atribuido a la capa orgánica protectora presente para estas últimas
nanopartículas.
Junto al estudio de XRD se llevó a cabo un estudio de XANES para determinar
el estado de oxidación de los cationes de U, las fracciones molares correspondientes y
la relación de O/U derivada. Los espectros de XANES en el borde U-L3 mostraron
tendencias similares para el nc-UO2 sintetizado por ambos métodos (acuoso y
orgánico): reducción de la estequiometría (x) del UO2+x , al aumentar la temperatura
de tratamiento. Se estudiaron muestras de nc-UO2 así sintetizado y después del
tratamiento térmico a 600°C y 1200°C en atmósfera de Ar/5%H2 y se compararon
con el material de referencia UIV O2 (grano-grande), detectándose con la temperatura
un ligero desplazamiento del pico de la WL (white line) hacia energías más bajas, así
como un aumento de la intensidad y de las oscilaciones en las regiones de XANES.
La amplitud de estas oscilaciones disminuyó con el aumento de la temperatura de
tratamiento térmico mostrando un mayor orden de la estructura para las muestras
recocidas.
Este efecto podría deberse al pequeño tamaño de los cristales del material nc-UO2
o al simple desplazamiento de la estequiometría del material así producido respecto
al material de referencia UIV O2 (grano-grande). Para cuantificar la contribución del
tamaño del cristal a este efecto sería necesario un estudio con nc-UO2 de distintos
tamaños de cristal y una estequiometría de oxígeno fija (a ser posible la característica
del UO2 de referencia). Dado que en el momento de realización del estudio esta síntesis
selectiva de nc-UO2 no fue posible, un estudio alternativo para determinar el efecto
de la talla del cristal en la estequiometría fue llevado a cabo. Para ello se utilizó un
substituto como es el oxido de torio (ThO2 ) que cristaliza con la misma estructura de
fluorita que el UO2 y que posee además un único estado de valencia (catión) ThIV .
Se llevo a cabo un estudio de una muestra de nc-ThO2 así producido (no tratado
térmicamente). En los espectros XANES correspondientes al borde Th-L3 , el pico de la
WL correspondiente al nc-ThO2 así sintetizado, se encontró en una posición y amplitud
idénticas a las de los espectros del ThIV O2 (grano-grande) de referencia. Tan sólo se
detectó una ligera disminución en la intensidad y número de oscilaciones, indicando
solo un efecto débil en las distancias interatómicas y el orden reflejado en el espectro de
XANES debido a la talla del cristal del material nc-ThO2 . Este prácticamente idéntico
comportamiento del material de referencia ThIV O2 (grano-grande) y el nc-ThO2 ,
sugiere que los desplazamientos observados anteriormente para el material de nc-UO2
tendrían su origen, no al tamaño de partícula sino más bien al desplazamiento de
la valencia-catión hacia un estado más oxidado (UV I ) del material así sintetizado.
Teniendo esto en cuenta, la determinación de la O/M de nc-UO2 a partir de la técnica
de XANES estaría justificada.
En los espectros de EXAFS k3 -ponderado para el material nc-UO2 sintetizado por
xviii
el método acuoso, las oscilaciones y su amplitud aumentaron con la temperatura de
recocido y el creciente tamaño de los cristales, aproximándose gradualmente al espectro
típico para la estructura del UO2 (fcc). El material nc-UO2 así precipitado de 4 nm
resultó difícil de ajustar a la estructura de fluorita pura. Los ajustes no eran estables y
los datos tenían mucho ruido. La muestra recocida a 600°C y tamaño de cristal de 9 nm
mostró un ordenamiento intermedio con oscilaciones claramente identificables. Tanto
la muestra original así sintetizada de 4 nm como la muestra recocida a 600°C (9 nm)
mostraron claramente distancias de enlace U-O y O-O más cortas en comparación con
la referencia de UIV O2 -(grano-grande). Esto resultó compatible con los estudios de
XRD que mostraron una considerable contracción del parámetro de red para la muestra
así sintetizada de 4 nm, siendo ésta menor con la temperatura de recocido. En última
instancia, para la temperatura de recocido de 1200°C y un tamaño de cristal de 82 nm,
las oscilaciones de EXAFS fueron similares, si no coincidieron totalmente con las del
material de referencia UIV O2 , indicando misma estructura-fcc (Fm-3m) y mismas
distancias interatómicas. Esto concordó con la similar estructura mostrada en XRD
entre la muestra de nc-UO2 recocida a 1200°C y la referencia de UIV O2 -(grano-grande).
También resultó coherente con el estudio de XANES que no mostró prácticamente
ninguna diferencia respecto a la estructura típica de fluorita para el caso de la muestra
nc-UO2 recocida a 1200°C. Los resultados de los espectros de EXAFS de k3 -ponderada
para el material nc-UO2 de origen orgánico, fueron distintos a los arriba comentados
para el material nc-UO2 de origen acuoso, siendo no sólo el material de 5 nm nc-UO2
así precipitado difícil de ajustar a la estructura de fluorita pura, sino también las
muestras tratadas a 600°C y 1200°C. Todas las muestras presentaron un alto grado de
desorden y no se pudieron ajustar al material de referencia UIV O2 -(grano-grande), por
lo que debería tenerse en cuenta otra fase todavía aquí no identificada.
Se adquirieron espectros de NMR Hahn-echo 17 O MAS de muestras tratadas a
distintas temperaturas de recocido en atmósfera reductora (Ar/5%H2 ). Se identificaron
tres tipos diferentes de oxígeno a partir del ajuste del desplazamiento químico de los
registros obtenidos para estas muestras, es decir, del desplazamiento del pico 17 O
de frecuencia de resonancia respecto al del espécimen de referencia y expresado en
unidades relativas (ppm). En el presente estudio se tomo como referencia la resonancia
del 17 O de una muestra de H2 O dopada con 17 O y se definió como 0 ppm. La primera
identificación correspondió a especies de oxígeno con un desplazamiento químico de
casi 900 ppm para las muestras recocidas hasta una temperatura 650°C. Los otros
dos tipos de especies de oxígeno identificados aparecieron claramente en el rango de
temperatura entre 650°C y 1200°C. Estas especies mostraron una un pico agudo y
la otra un pico 17 O amplio. Éstos podrían atribuirse a un 17 O en un entorno más
bien cristalino y en otro entorno más desordenado (debido a la amplitud del pico),
respectivamente. Ambos picos disminuyeron fuertemente su desplazamiento químico
y su anchura a media altura (FWHM; Full Width at Half Maximum) en el intervalo
de temperatura de 650°C a 800°C, para converger rápidamente a temperaturas por
encima de 800°C a valores cercanos a los de la muestra recocida a 1200°C con 717 ppm
(desplazamiento químico) y 5 ppm (FWHM), respectivamente. Este pequeño valor de
FWHM es sinónimo de un entorno bien cristalizado, aunque sigue siendo ligeramente
más ancho que los 3 ppm encontrados para el UIV O2 -(grano-grande) de referencia. A
pesar de ello, el desplazamiento químico (717 ppm) fue el mismo que el encontrado para
dicha referencia UIV O2 -(grano-grande). Puede decirse entonces que el entorno, para
la muestra con el cristal de mayor tamaño (∼80 nm), de las posiciones del parámetro
de red del oxígeno, está muy próximo al medido para la muestra de referencia
xix
UIV O2 -(grano-grande). Basándose en la FWHM puede decirse que para que la señal
de UO2 -cristalino sea observable, es necesario llegar a un tamaño de cristal por encima
de los 80 nm. Esto estaría en consonancia con la observación hecha mediante XRD
para este tamaño de cristal de una estructura UO2 -fcc con parámetro de red 0.5472 nm.
Varias muestras de material nc-UO2 sintetizadas por el método acuoso y tratadas
a distintas temperaturas-clave de recocido, fueron analizadas bajo el espectrómetro
de FTIR. Se observaron hasta 4 picos en el intervalo 400-4000 cm−1 para la muestra
de nc-UO2 así sintetizada (RT). Estos podrían asignarse a la vibración bending (o
de tijereteo) del H-O-H del agua coordinada, y a un posible estado más oxidado del
material (UO2+x ). Todos los picos disminuyeron en intensidad con la temperatura
de recocido de las muestras. Además, para la muestra tratada a la temperatura de
recocido de 1200°C, el espectro de IR se asemejaba al espectro de la muestra de
referencia de UIV O2 . Esto concuerda con los resultados de XANES arriba comentados
donde se observó una estructura electrónica diferente para la muestra tratada a 600°C,
mientras que la muestra tratada a una temperatura de 1200°C presentó una estructura
similar a la de la muestra de referencia de UIV O2 . También los resultados del EXAFS
se caracterizaron por un orden pobre a 600°C, pero pares de oscilación totalmente
ajustados a los de la muestra de referencia de UIV O2 para la muestra tratada a 1200°C.
Se llevo a cabo un estudio isotérmico para el material nc-UO2 sintetizado, del
crecimiento de grano durante periodos de tiempo largos y bajo el HT-XRD. Para las
temperaturas de recocido de 500°C, 700°C y 900°C, bajo atmósfera estática e inerte
de He, el crecimiento de grano se produjo en las primeras horas de tratamiento a
temperatura constante alcanzando un tamaño de cristal promedio estable a dicha
temperatura (el crecimiento de grano cesó a partir de ese momento). En el caso de la
isoterma a 1200°C y bajo atmósfera estática de He, el material presentó un crecimiento
continuo sin llegar a alcanzar un tamaño constante de grano en las primeras 50 h. Se
obtuvo una energía de activación de la difusión entre 0.93 eV a 1.25 eV. Estos pequeños
valores de energía de activación obtenidos, podrían deberse principalmente a los límites
de difusión de grano (superficie e interfaz).
Se midió un parámetro de red de 0.5472 nm para las muestras tratadas durante 50 h a 900°C bajo atmósfera de Ar/H2 (y tras el enfriamiento del material),
obteniendo una talla final de cristal de unos 50 nm. Es por ello que, en principio
no sería necesario alcanzar una temperatura de 1200°C (y por tanto una talla
de cristal de 80 nm) para conseguir un material con el típico valor de parámetro
de red del UO2 de granos grandes (a=0.5472 nm), como se había comentado más arriba.
Además, un tamaño medio de cristal de 322 nm fue medido a 1200°C durante
50 h en atmósfera estática de He. Teniendo esto en cuenta, durante el proceso de
sinterización de los monolitos sería necesaria una temperatura por debajo de 1200°C
para evitar el crecimiento extremo de las partículas (>200 nm). Sin embargo, se
midió un tamaño final de cristal de 85 nm para las muestras de nc-UO2 recocidas a
1200°C durante 50 h bajo atmósfera reductora de Ar/H2 . Incluso después de 200 h
a esta temperatura en condiciones reductoras, se midió un tamaño final de cristal de
150 nm (bastante menor que el valor de 322 nm observado bajo atmósfera de He y
50 h de tratamiento). Esta diferencia podría deberse al estado inicial de oxidación de
las muestras así sintetizadas de nc-UO2 y su evolución bajo atmósfera estática e inerte
de He. Un UO2 sobreestequiométrico presentaría un aumento mayor de los coeficientes
xx
de auto-difusión y del flujo de masa, incrementando así el movimiento en el límite de
grano (o cristal) y crecimiento del grano. De hecho las diferencias entre el coeficiente
de difusión del UO2 de granos grandes y el nc-UO2 , son compatibles con una mejora
de los procesos difusión, ya sea por efecto del tamaño de grano o por el ratio O/U>2.
Consolidación y caracterización de monolitos de ncUO2
Se probaron diferentes rutas alternativas para la consolidación de los monolitos (ej.
prensado convencional uniaxial, float packing, etc). Las pastillas así prensadas, fueron
sinterizadas a temperaturas entre 900°C y 1200°C bajo atmósfera de Ar/H2 . Las
condiciones óptimas de sinterización se dedujeron a partir del estudio de crecimiento
de cristal isotermo durante largos periodos de tiempo bajo atmósferas de He y de
Ar/H2 . Esto evitó el riesgo de un crecimiento de grano desproporcionado incluso a
la temperatura más alta estudiada de 1200°C. En algunos casos se practicó también
un pre-tratamiento térmico del polvo de nc-UO2 para evitar la formación de grietas
durante la etapa de sinterización debido a la presencia de agua o compuestos orgánicos
en el material dependiendo de la síntesis utilizada. Las pastillas sinterizadas presentaron una apariencia fuerte aunque se podían observar grietas finas en algunas
de ellas. Se obtuvieron densidades de sinterización entre 75.5-90.5% de la densidad
teórica (TDU O2 =10.96 g/cm3 ). Se obtuvo un tamaño de grano promedio de ∼200 nm,
replicando la estructura que aparece a altos grados de combustión (HBS; high burn-up
structure) para los diferentes tipos de monolitos de nc-UO2 sinterizados.
También se llevaron a cabo experimentos de dilatometría donde se comparó la
contracción entre la pastilla fabricada con material de nc-UO2 , con la pastilla fabricada
con el típico UO2 -(grano-grande) y a partir del proceso estándar de fabricación.
Se observaron mejores actividades de sinterización a temperaturas inferiores para
el material nanocristalino en comparación con las medidas para las pastillas de
UO2 -(grano-grande). El rango de temperatura desde el inicio hasta la completa
densificación, ocurrió a temperaturas mucho más bajas para las pastillas de nc-UO2
(200-955°C, con un ratio máximo de sinterización a 740°C), en comparación con las
pastillas de UO2 -(grano-grande) [Lahiri et al., 2006] (900-1540°C, con un máximo
de sinterización a 1200°C). Esto podría deberse a la mayor superficie presente en el
material de nc-UO2 comparado con el típico UO2 -(grano-grande), lo que llevaría a una
sinterización más efectiva (a temperaturas más bajas). Se encontró una energía de
activación de la sinterización de Q = 171 ± 7 kJ/mol asumiendo difusión de superficie,
y Q = 114 ± 5 kJ/mol asumiendo difusión de volumen para el monolito de nc-UO2 .
La energía de activación determinada para un monolito de UO2 de grano grande es de
Q = 287 kJ/mol según [Lahiri et al., 2006]. Ambos mecanismos de difusión mostraron
pues valores bajos para las energías de activación de sinterización como es típico para
los nano-materiales. Esto se traduce en una clara ventaja tecnológica en la fabricación
de monolitos de nc-UO2 debido a su alta capacidad de densificación a temperaturas
bajas. El mantenimiento de un rango de temperaturas aceptablemente bajo durante el
proceso de sinterización disminuirá costos y simplificará la tecnología de fabricación.
Los monolitos de nc-UO2 ofrecen también la posibilidad de ajustar el tamaño de grano
a voluntad mediante la variación de las temperaturas y tiempos de sinterización.
xxi
Las macroestructuras de los distintos monolitos de nc-UO2 se caracterizaron por
microscopía óptica (OM). Las microestructuras se caracterizaron por observación de
la fractura-fresca a distintas ampliaciones bajo el SEM. En las imágenes de SEM de
la fractura-fresca de las pastillas sinterizadas a la temperatura más baja de 900°C,
se observaron granos no del todo definidos. La sinterización de los cristales parecía
todavía en fase de desarrollo, por lo que a partir de este momento se utilizaron
temperaturas de sinterización de 1200°C. Se observaron macro-fisuras en algunas de las
pastillas, pero no para los monolitos fabricados con nc-UO2 sintetizado por el método
orgánico con polvo con pre-tratamiento térmico, y tampoco para la muestra del método
de consolidación float-packing y polvo sintetizado por el método acuoso. Todas las
macroestructuras, con excepción de esta última, mostraron densificación no homogénea
(porosidad residual entre las zonas densificadas). También la muestra con prensado
convencional de polvo nc-UO2 pre-deshidratado sintetizado por el método acuoso,
mostró una buena calidad en comparación con el resto, desde el punto de vista de la
densificación. Sin embargo, es necesario la introducción de mejoras en la formación de
los monolitos para evitar el problema de las grietas durante el sinterizado (y por lo
tanto disminución de las propiedades del material). En cuanto a la microestructura
de la superficie de fractura-fresca, la pastilla de nc-UO2 sintetizado por el método
acuoso y fabricada por consolidación float-packing y sinterización a 1200°C, fue la
aproximación más cercana al material HBS obtenido hasta ahora. El tamaño medio de
grano para los diferentes monolitos estuvo entre 170 nm y 250 nm. Esto fue un de los
grandes logros de este trabajo.
Propiedades mecánicas como la dureza Vickers (HV ), dureza Knoop (HK ) y módulo
de Young (E) se determinaron para las pastillas de nc-UO2 sinterizadas. Un aumento
en la dureza (HV ) y valores bajos para módulo-E (de hasta un 30%) fueron en general
observados para los diferentes monolitos de nc-UO2 en comparación con aquellos
de UO2 -(grano-grande). También se utilizó microscopía de barrido acústico (SAM)
para la estimación y la comparación del módulo de Young obtenido por identación.
Los resultados obtenidos por SAM (E=155 GPa) coincidieron con los derivados por
micro-indentación (E=155 GPa). La diferencia observada con respecto a pastillas
de grano-grande de UO2 (220 GPa), podría estar influenciada por las imperfecciones
de la microestructura (nano-cavidades en las intersecciones de tres granos, poros,
grietas, etc.). Sin embargo, esta caída del módulo es todavía demasiado grande
como para ser totalmente atribuida a la presencia de cavidades. El mismo tipo de
tendencia observado en las muestras de nc-UO2 , es decir, aumento de los valores de
HV y disminución de los valores del módulo-E, ya se había determinado antes en
el combustible estándar de UO2 tras haber alcanzado valores elevados de BU. En
este caso la disminución del módulo-E tampoco pudo ser totalmente atribuída a un
aumento de la porosidad, y contradijo el efecto de la disolución de los productos de
fisión que provoca en realidad un aumento de la rigidez del material. Dado que los
combustibles nucleares irradiados se transforman en una estructura nano-recristalizada
con el aumento de BUs [Spino et al., 2012], los efectos (parcial) del aumento de HV
(la disolución de los productos de fisión provocan también endurecimiento) y además
la disminución del módulo-E (sumado al causado por la porosidad), al igual que los
efectos observados en el presente trabajo, podrían atribuirse a la nano-estructura de
los combustibles sometidos a elevados BUs.
Se confirmó con éxito la dependencia con el tamaño del cristal, de las propiedades
físico-químicas del nc-UO2 . Así, se comprobó que la compresibilidad del nc-UO2 era
xxii
de hecho mayor que la del estándar-UO2 de tamaño grande. Se confirmó también
una dependencia de las propiedades de expansión térmica con el tamaño del cristal
para el material de nc-UO2 . La expansión térmica aumentó con la disminución del
tamaño de cristal, al mismo tiempo que el módulo de compresibilidad disminuyó. Esto
es compatible con la relación Grüneisen que presenta un producto constante entre la
conductividad térmica y el módulo de compresibilidad. Sin embargo sigue pendiente la
verificación de esta tendencia sobre el calor específico (Cp), necesaria para completar
el análisis de la relación de Grüneisen.
En cuanto a la compresibilidad del material bajo difracción de rayos X in situ
de alta presión (HP-XRD), se realizó un estudio de la dependencia del módulo de
compresibilidad con el tamaño de cristal para el material nc-UO2 . Se estudiaron tres
tamaños de nc-UO2 diferentes (4 nm, 6 nm y 34 nm) hasta una presión de 27 GPa,
y se determinaron las constantes de compresibilidad correspondientes B0 y B0 . El
módulo de compresibilidad del UO2 sufrió una disminución extrema para las partículas
de tamaño dentro del rango nanométrico. Para las partículas de nc-UO2 de 4 nm se
observó un módulo de compresibilidad (B0 ) en torno a un 40% menor que el medido
UO2 -grano-grande (granos de tamaño micrométrico) [Pujol et al., 2004]. Esto confirmó
la dependencia del módulo de compresibilidad con el tamaño de las partículas. Sin
embargo, un estudio con partículas de tamaños mayores que los aquí considerados (>34 nm) sería necesario para garantizar que la tendencia observada en estos
monolitos (disminución del módulo de elasticidad) se debe al tamaño de los granos,
y no sólo debido a las imperfecciones y porosidad posiblemente presente en las muestras.
Los resultados de las pruebas de difusividad térmica para el material de nc-UO2
compactado mostraron un comportamiento similar al del material UO2 -estándar
(micro-grano). La difusividad térmica para las pastillas sinterizadas de nc-UO2
(∼200 nm, 90% densidad), se determinó en el rango de temperatura 254°C a 1165°C.
Se hizo una extrapolación de los resultados obtenidos hasta una densidad de 95% y se
encontró la misma difusividad térmica que en las pastillas fabricadas con estándar-UO2
(grano-grande) y densidad del 95% [Fink, 2000]. Respecto al temido empeoramiento
de la conductividad térmica del material en la HBS debido al efecto del tamaño de
grano (resistencia Kapitza), quedó aquí demostrado el no-deterioro de las propiedades
térmicas para las pastillas de UO2 con un tamaño de grano de 200 nm imitando la HBS.
Se llevo a cabo la determinación del punto de fusión por calentamiento-láser y
detección de la temperatura pirométrica para nc-UO2 -compactado de dos tamaños
diferentes de nano-grano (aproximadamente 10 nm y 200 nm), evaluándose su variación
con respecto al UO2 -estándar de grano grande. Se encontró una disminución del punto
de fusión para el compacto con material nc-UO2 -(10 nm), de aproximadamente 150°K
con respecto al valor típico para UO2 -estándar. Esta reducción sería a priori debido
al tamaño nano de los granos. Sin embargo, el parámetro de red medido para dicha
muestra antes de aplicar la fusión (a=0.5438 nm) resultó inferior al valor típico de la
referencia UO2 -estándar (a=0.547 nm), indicando por tanto la presencia de un óxido
sobre-estequiométrico el cual también podría ser causante de esta disminución del
punto de fusión. Para corroborar la tendencia medida con la reducción de tamaño
de grano, sería necesaria una muestra de nc-UO2 estrictamente estequiométrica. Sin
embargo para el compacto con material nc-UO2 -(200 nm) se encontró un punto de
fusión igual al de la referencia UO2 -estándar. Una estequiometría de O/M=2.00 del
parámetro de red fue medida para esta muestra antes de provocar la fusión. Éste es
xxiii
un importante resultado tecnológico para el posterior uso de las cerámicas de nc-UO2
como combustible nuclear. De hecho, un punto de fusión más bajo plantearía un
problema para la concesión de licencias de los monolitos como combustible para el
reactor. Afortunadamente la posibilidad de un punto de fusión a menor temperatura
desaparece para muestras de nc-UO2 con un tamaño de grano de 200 nm, como
también debe ocurrir para el material HBS en el reactor.
Así, dichos nano-efectos tales como la disminución de la conductividad térmica
y del punto de fusión se podrían excluir como puntos débiles para el uso de nc-UO2
como combustible nuclear. Estos efectos pueden ser relevantes para tamaños pequeños
de cristal o grano (∼10 nm), pero desaparecen para tamaños de grano de ∼ 200 nm
donde convenientemente las propiedades ventajosas de la nano-estructura buscadas
(super-plasticidad, baja hinchazón bajo bombardeo de Xe [Spino et al., 2012], crecimiento de grano autolimitado, etc.), permanecen presentes todavía. Ésto anticipa
que no existe pérdida de propiedades de las pastillas de nc-UO2 desarrolladas para
aplicaciones técnicas dentro este rango de tamaño.
Recomendaciones para el Futuro
La concesión de licencia para combustible nuclear se hace en base a su seguridad de
actuación no sólo bajo condiciones normales de operación, sino también cuando se
produce un aumento de temperatura en el combustible. Esto podría ocurrir debido
a un accidente por pérdida de refrigerante (LOCA; Loss of Coolant Accident) o en
un accidente de reactividad iniciado (RIA; Reactivity Initiated Accident). Bajo estas
condiciones extremas podría ocurrir una fragmentación del combustible. Durante
esta tesis se intentó simular un accidente de este tipo mediante un experimento
utilizando una muestra de nc-Y-ZrO2 en vez del nc-UO2 . Esta prueba se realizó en una
instalación del ITU (Institute for Transuranium Elements) conocida como POLARIS
y que permite un calentamiento por láser de la muestra muy rápido.
El material inicial sometido al POLARIS estaba libre de poros y su superficie
era plana. El tratamiento con láser mostró como se produjo una hinchazón local a
través de la formación de porosidad. No hubo un perfecto control del experimento,
sin embargo es probable que la hinchazón observada se debiese al CO o CO2 gas
generado al reaccionar la impureza de carbono presente en el material con el oxígeno
de la atmósfera, causando la formación de poros en un proceso similar a la producción
de espuma de vidrio. Un resultado particularmente interesante de la prueba es que
los poros formados estaban cerrados y eran sorprendentemente similares a los de la
zona-HBS en los combustibles de alto grado de combustión. Sería posible pues, que
en este tipo de accidentes de fusión del combustible al menos parte del gas de fisión
podría ser atrapado en poros formados potencialmente cerrados, como ocurre en el
material de HBS a bajas temperaturas. Aunque estos experimentos son preliminares
sugieren un método novel y prometedor para probar la capacidad de retención de gas
del combustible nc-UO2 en condiciones de accidente.
Por último, otro método importante para entender la resistencia de los nc-materiales
a la irradiación, podría ser la irradiación de haces de iones. Esto puede llevarse a cabo
en instalaciones como las del ANL (Argonne Nacional Laboratory) IVEM-Tandem en
Chicago, donde la irradiación con iones de gas inerte (He o Xe) junto con la observación
xxiv
TEM on-line, proporciona una manera muy útil para implantar los átomos de gas y
evaluar cómo se comportan éstos en la matriz (ej. disolución de la misma, formación
de burbujas, transporte de burbujas a lo largo de los límites de grano, etc.).
Observaciones finales
Se consiguió con éxito la consolidación de polvo sintetizado de UO2 nanocristalino en
pastillas densas imitando, como sistema ideal, la estructura que aparece a altos grados
de combustión (HBS). Desde los diferentes polvos de nc-UO2 sintetizados (4-5 nm
de tamaño de cristal), hasta los compactos monolitos de nc-UO2 con un tamaño de
grano medio de 200 nm y densidad aproximadamente de 90%. Se mostró la estabilidad
de ésta estructura después del sinterizado, así como una cinética de crecimiento de
grano autolimitada hasta temperaturas de 1200°C. Se confirmó la semejanza entre
las pastillas de nc-UO2 sinterizadas de las propiedades mecánicas fuera de pila (en
términos de dureza y módulo de elasticidad), y las propias del material-HBS in pila.
Se encontraron propiedades beneficiosas como estabilidad de la estructura, mejora de
las propiedades mecánicas y crecimiento autolimitado de grano, lo que alenta a la
realización de pruebas de irradiación para verificar este comportamiento en el reactor.
Según lo determinado previamente en experimentos fuera de pila con monolitos del
sistema nanocristalino hermano nc-Y-ZrO2 [Spino et al., 2012], una fuerte reducción de
la hinchazón por burbujas de gas, estabilidad térmica a largo plazo de la configuración
poros-grano, así como un notable comportamiento superplástico y un creep acelerado,
se esperarían también para los monolitos de nc-UO2 aquí desarrollados. Se confirmaron
anomalías en las propiedades físicas y químicas del material para tamaños de grano
en el nano-intervalo absoluto (<30 nm), en consonancia con lo observado en otros
sistemas nanocristalinos. Estos nano-efectos perniciosos, como disminución de la
conductividad térmica y el punto de fusión, que podrían significar un punto débil
para el uso de nc-UO2 como combustible, mostraron ser relevantes sólo para tamaños
muy pequeños de cristal/grano (<30 nm) desapareciendo para tamaños de grano
de ∼200 nm donde convenientemente las propiedades ventajosas buscadas de la
nano-estructura (super-plasticidad, baja hinchazón por burbujas de gas, crecimiento
de grano autolimitado, etc.), permanecen. Esto anticipa que no existe pérdida de las
propiedades de las pastillas de nc-UO2 desarrolladas para aplicaciones técnicas dentro
este rango de tamaño. Finalmente éste ha sido un trabajo muy gratificante con una
serie de avances logrados. Se ha aprendido mucho en el tránsito pero aún queda mucho
por hacer para determinar el verdadero potencial de este intrigante material.
xxv
xxvi
Summary
Origin of the work
Today’s nuclear fuels are largely based on uranium dioxide (UO2 ). A high level of
proficiency has been reached in this technology with fuels achieving moderate to high
burn-up (BU) in the reactor. However, to go beyond the today’s achievements a
more radical approach may be needed, in order to enable the fuel to reach yet higher
BUs. This is desirable for the reduction of the amount of fresh fuel required and the
mass of spent fuel inventories (radioactive waste). To achieve these goals, improved
fission gas retention capability of the fuel is required as well as a solution to the pellet
clad mechanical and chemical interaction (PCMI and PCCI) failure risks problem is
needed, which could intensify at high BUs due to boosted cladding embrittlement. A
project to synthesize nanocrystalline (nc)-UO2 powders for the manufacture of bulk
nc-fuel compounds for the characterization of their out-of-pile mechanical properties
and irradiation behaviour was built.
The kicking idea of the above development was originated after careful observations
of the transformations in the highly irradiated nuclear fuels. Indeed, the fuel pellet
working inside the nuclear reactor is a material subjected to extreme conditions that
change its properties with time and irradiation dose. Damage in the material and local
defects like interstitials, loops and vacancies are created. Furthermore, accumulation
of solid fission products in the lattice and formation of gas bubbles make the pellet
thermal conductivity to decrease. Fuel cracks appear from the beginning of the
irradiation due to thermal stresses and make the thermal properties to decrease even
more. The fuel pellets swell owing to the accumulation of fission gas bubbles in the
matrix and the segregation of low-density fission-products phases (metallic and ceramic
precipitates). As a result of the swelling, the fuel approaches the clad. Physical and/or
chemical interaction can occur upon contact, which can induce clad deterioration and
rupture [Garzarolli et al., 1979]. These types of changes can affect also the temperature
profile of the fuel pellet by modification of the gap thermal transfer conditions, limiting
as well the life-time of the fuel (and BUs) inside the reactor, if premature rod rupture
occurs.
After all this accumulated damage, nuclear fuels approximately at the end of the
third irradiation cycle (about 40 GWd/tM) undergo then a structure transformation
which begins at the edge of the fuel pellet and steadily progresses to its centre as the
irradiation proceeds [Matzke and Spino, 1997] [Spino and Papaioannou, 2000]. The
original microstructure of micro-grains (or larger-grains) transforms into a nc-porous
matrix [Nogita and Une, 1994] through restructuring of the accumulated irradiation
defects. This is a sort of “self-healing” action where the material gets cured from damage by reordering itself [Spino et al., 2012]. The new nc-structure appearing is called
high burn-up structure (HBS). It is called also rim-structure because in UO2 fuels it
xxvii
initiates at the rim or outer zones of the pellets (region which receives the most fissions).
At the beginning it was thought that the HBS could be responsible for cladding
failures due to additional in-pile volume increase (swelling) and a supposed brittle
behaviour of the transformed material was postulated [Matzke, 1992]. Also, it was
thought that the rim-structure could act as a new source of gas release. Indeed, there
are still investigation-lines that defend this opinion. However, other studies found
that the percentage of gas liberated from the rim of the fuel pellets, where the HBS
appeared, was low in comparison with the gas coming from the inner parts of the fuel
where the original structure is still present [Mogensen et al., 1999]. This philosophy
has been followed in other publications, which demonstrate a generally beneficial
evolution of the fuel properties, in particular the retention of the fission gases, after
the structure transformation.
Besides that, the properties of the HBS indicate an enhanced radiation tolerance
as reported by [Spino et al., 2012]. This study coincided with the important novel
evidence in the literature that nano-grained materials are more resilient to radiation
damage than their large-grained pairs due to defects-recombination at their multiple
grain boundaries [Nita et al., 2005]. Also improvement of the thermal conductivity and
other radiation-defects-depending properties were found due to lattice-strain release
after recrystallization [Ronchi et al., 2004], as well as fracture toughness increase and
crack-healing tendency were anticipated [Spino et al., 2003].
Moreover, in relation to safety issues, the latest experiments on the high BULWR (Light Water Reactor) fuels indicated no increase in the gas release and
in the failure susceptibility during reactivity initiated accident (RIA) transients
[Sasajima et al., 2010] [Fuketa et al., 2006]. Also diminution of the aqueous corrosion
rate under simulated geologic repository conditions for fuels containing HBS was found
out [Ekeroth et al., 2009] [Carbol et al., 2009]. Both last facts confirmed the tightness
of the structure.
So it has been demonstrated that the HBS has exceptional qualities even in
comparison with the original fresh matrix (large-grain structure), with a number of
improved properties that are really advantageous for a fuel. Then, why not imitate
this recrystallized material?. And why not imitate the structure appearing in the
rim (HBS) and introduce it in this form as a fresh fuel inside the reactor?. Why not
synthesize a fuel matrix like this HBS, which due to its apparent damage-resilience
would withstand longer times under irradiation?.
Here is were the project to synthesize nanocrystalline (nc)-UO2 powders for the
manufacture of bulk nc-fuel compounds began. The produced monolithic pieces from
these powders would have a volume of approximately 1 cm3 with a uniform matrix of
grains with size between 100 and 250 nm to mimic the rim-structure. The creation of
this novel fuel microstructure has been achieved in this work by passing through very
different steps. From the nc-material synthesis to the fuel pellet manufacture, many
individual process stages, previously unknown or unexplored, had to be specifically
developed and/or optimized.
xxviii
Synthesis of nc-UO2 and nc-ThO2
Regarding the initial powder for synthesizing nc-UO2 monoliths mimicking the HBS
of LWR-fuels (nanostructured), considerable work was devoted to the development of
two different chemical synthesis routes leading to deflocculated nc-UO2 and nc-ThO2
precipitates to compensate for their lack of commercial availability. ThO2 is similar
in structure to UO2 but has the advantage of a single valence state (i.e. IV ). To
obtain large amounts of nc-UO2 as required for pellets forming, both methods were
conveniently adjusted, developed and scaled-up according to the aim needs. The
material in the as-produced condition was studied by transmission electron microscopy
(TEM) and X-ray diffraction (XRD).
The first method developed was a controlled precipitation that uses an electrolytically reduced aqueous solution of uranyl nitrate as precursor and a dropped
NaOH-solution as alkalinisation agent that is used to trigger the precipitation of the ncmaterial in the vicinity of the U4+ solubility line. This method was originally described
in [Rousseau et al., 2002] [Rousseau et al., 2006]. An intensive study of the range of
U-concentration and acidity for nc-UO2+x precipitation from electrolytically reduced
uranyl nitrate solutions was endeavoured, using higher U-concentration (10−1 M)
ranges as the observed in literature (10−2 M) [Rousseau et al., 2006], and therefore
lower pH ranges, following the solubility line of UIV . As a final result, 10 g of nc-UO2+x
per batch were obtained, instead of the few nanograms of yield appearing hitherto in
the literature. The resulting solid phase, as studied by XRD, was found to crystallize
with the typical UO2 -fcc fluorite structure (Fm-3m space group), with a lattice
parameter a=0.5417(1) nm and average crystallite size of 3.79 nm, also in agreement
with an average size observed by TEM of 3.9(8) nm. The predominant diffractogram of
the samples corresponded unmistakably to UO2 , but in a slightly oxidized state. The
latter was manifested through a lattice contraction of about 0.9% of the precipitated
phase (a=0.5417(1) nm) with respect to the values of stoichiometric UO2 (a=0.547 nm).
The second method studied concerned the thermal decomposition of an organic
phase using uranyl acetylacetonate (UAA) as precursor, which was added to a mixture
of oleic acid and oleylamine, which was then heated as a whole up to temperatures
above 300°C to induce the precipitation of UO2 nanoparticles by thermal decomposition
of the UAA. This original procedure was described in [Wu et al., 2006]. Reduction
of surfactant quantities with respect to the metal content, as well as scale up of the
method from 0.1 g of nc-UO2 as reported by [Wu et al., 2006] to 2.3 g of nc-UO2 ,
was achieved. The same method was extrapolated for the synthesis of nc-ThO2 , using
thorium acetylacetonate (ThAA) or thorium acetate (ThA) as precursor, from which
ThO2 nanorods have been obtained. The reason for the rod-shape of the precipitates
is hitherto unknown. Batch sizes of 0.3 g ThO2 nanorods were obtained by this means,
i.e. with a much lower production yield than in the case of UO2 nanoparticles. Different
conditions for the heating rate, ageing time, ageing temperature and initial precursors
(ThAA and ThA) were explored for the UO2 and ThO2 cases. However, similar results
were always found, in terms of the structure and geometry (round-shaped for nc-UO2
and rod-shaped for nc-ThO2 ) of the precipitates. Perfectly crystallized solid phases,
as studied by XRD, with the typical UO2 -fcc fluorite structure (Fm-3m space group),
with an average crystallite size (spheres diameter) of 5.52 nm and a lattice parameter
of 0.5431(0) nm were found for the UO2 case, also in agreement with the average size
observed by TEM (4.9(3) nm) and DLS (3.7(1) nm). For the ThO2 nanorods, also the
typical ThO2 -fcc fluorite structure (Fm-3m space group), with a crystallite size (rods
xxix
diameter) of 1.42 nm and a lattice parameter of 0.5579(1) nm, was found. In both cases,
no aggregation of the precipitated nanoparticles has been observed on the TEM images.
Crystallization and grain growth in f(T) for nc-UO2
To study the composition of the precipitates obtained by both methods above
mentioned and their propensity to thermal growth in the unconsolidated state, further
analysis of the precipitated material annealed at different temperatures was performed
by applying the thermal analytical and X-ray diffraction techniques like thermogravimetric analysis and differential thermal analysis (TGA/DTA), X-ray diffraction (XRD)
and high temperature X-ray diffraction (HT-XRD), and spectroscopic techniques such
as X-ray absorption spectroscopy (XAS), magic angle spinning nuclear magnetic resonance spectroscopy (MAS-NMR) and infrared spectroscopy (IR) and characterization
techniques like transmission electron microscopy (TEM).
The evolution of the crystallite size, the lattice parameter and the lattice strain
were determined from ambient temperature up to 1200°C under inert atmosphere.
For the aqueous precipitated nc-UO2 , only a weak effect of temperature on the
crystallite size occurred below 700°C, remaining this below 7 nm in this temperature
range. On exceeding 700°C, the crystal size grew, however, steadily with temperature,
to reach the value of 73 nm at 1200°C. Opposite, the strongest lattice parameter
increase was measured in the lowest temperature range 20°C-700°C, whereas in the
temperature range 700°C-1200°C only a weak lattice expansion was observed, which
almost coincided with the reversible thermal expansion of UO2 . Thus, on the base
of measurements done after cooling, a recovery of the UO2 typical crystal structure
was achieved during this annealing under static He atmosphere, passing from the
initial lattice parameter value of 0.5417 nm for the as-produced nc-UO2 , to the value
of 0.5473 nm after exposure to 1200°C. The verified initial lattice contraction of the
as-produced nc-UO2 below the normal value of bulk stoichiometric UO2 (a=0.5470 nm)
is attributed mainly to oxidation.
For the organic precipitated nc, a similar particle-growth behaviour with temperature was observed, with almost no crystal-dimension changes up to 700°C (because of
the pre-thermal treatment performed), followed by an intense crystal-growth between
this temperature threshold and the final annealing temperature of 1100°C, obtaining
a final crystal size of 150 nm. As for the derived oxygen stoichiometry from the
lattice parameter values, also an initial oxidation of the nc-particles produced by the
organic method was confirmed, although in lower extent as for the case of the particles
produced by the aqueous method. The particles recovered the normal lattice dimension
of bulk stoichiometric UO2 for annealing temperatures above 750°C.
As for the determined lattice strain, also a similar behaviour was observed for particles obtained from both preparation methods. The main observation in both cases was
that the lattice strain decreased continuously with temperature, until being practically
extinguished at the temperature at which the boosted crystal growth started. This
confirmed the lattice strain to having acted in both cases as crystal-growth inhibitor.
xxx
Structure and oxygen-stoichiometry studies by XRD,
XANES, EXAFS, NMR AND FTIR
The structure of the produced nc-UO2 material as a function of temperature and, in
this case under reducing atmosphere, was also studied by XRD and compared to the
reference bulk-UIV O2 . The lattice constant of the material in the cooled state after
reaching different maximum temperatures (600°C and 1200°C) was measured. This
allowed the separation of the thermal expansion contribution in the high-temperature
values to obtain cleaner curves of thermal expansion vs. temperature and lattice
dimension vs. crystal size. No big differences in crystal size, lattice and strain, were
observed between measurements made under inert (above commented) and reducing
atmospheres (measurement after cooling) for the material obtained by the aqueous
method. However, a notable change in the crystallite size was observed for the material
obtained with the organic method at 1100°C, which showed a size of 150 nm under
He and a size of only 12 nm under Ar/5%H2 . Comparing the aqueous and organic
produced material under reducing atmosphere (Ar/5%H2 ) and without pre-thermal
treatment, no big change was observed until 600°C anneal, but at 1200°C. At the
last temperature, a size of 82 nm was measured for the aqueous method material
compared to the 12 nm obtained for the particles from the organic method at the same
temperature under reducing atmosphere (Ar/5%H2 ), were measured. That could be
ascribed to the surface layer protecting the organic precipitated nanoparticles.
In addition to the XRD studies, XANES was used to determine the oxidation state
of the U cations and the corresponding molar fractions and the derived O/U ratios.
The XANES spectra at the U-L3 edge for the aqueous method material and for the
organic method material, showed similar improving trends with increasing temperature
and as the stoichiometry shift (x) decreased (UO2+x ). The samples studied were
nc-UO2 as produced and after thermal treatment at 600°C and 1200°C under Ar/5%H2 .
Compared to the reference sample of bulk (large grain) UIV O2 material, the peak of
the WL shifted slightly to lower energies and increased in intensity, and the oscillations
within the XANES regions increased. The amplitude of these oscillations decreased
with the increasing temperature of thermal treatment showing a higher structural
order of these annealed samples.
This effect could be either due to the small crystal size of nc-UO2 samples or to
the stoichiometry shift of the synthesised material. To quantify these contributions
a dedicated study with nc-UO2 with fixed oxygen stoichiometry and different crystal
sizes would be needed. Since at this moment this kind of selective synthesis of nc-UO2
was not possible, an alternative separate study of the size effect in the stoichiometric
nano-oxide-material was attempted using the substitute thorium dioxide (ThO2 ),
known to crystallize with the same fluorite structure as UO2 and to maintain a unique
cation-valence state ThIV .
In this work, a study of as-produced nc-ThO2 (not thermally treated) was done.
In the corresponding XANES spectra at the Th-L3 edge, the peak of the WL corresponding to nc-ThO2 at RT (as-produced) had an identical position and amplitude
as the one of the reference spectra of large-grain bulk ThIV O2 . Only a slight peak
intensity decrease and somewhat fewer oscillations were detected, which indicated only
a weak effect of the crystal size on the interatomic distances and ordering reflected
in the XANES spectra. This identical behaviour of the large grain ThIV O2 and the
xxxi
nc-ThO2 suggested that the displacements observed formerly for nc-UO2 would have
been not due to the particle size, but rather to the shift of the cation-valence towards
the oxidised state (UV I ). Having that into account, determining the O/M of nc-UO2
from the XANES shift seems to be justified.
In the k3 -weighted EXAFS spectra of nc-UO2 particles from the aqueous method
the oscillations and their amplitude increased with the annealing temperature and the
resulting growing crystal size, approaching gradually those typical of the UO2 (fcc)structure. The as-precipitated 4 nm as-precipitated sample was very difficult to fit
with a pure fluorite structure, as the fits were non stable and the data noisy. The
600°C annealed 9 nm sample showed an intermediate ordering with clearly identified
oscillations. Both the original 4 nm-sample and the 600°C-annealed 9 nm-sample
showed clearly shorter U-O and O-O bond-distances compared to the reference
bulk-UIV O2 sample. This was compatible with the XRD studies showing considerable
lattice contraction for the as-received sample and in lower extent, with intensity
decreasing with temperature, for the annealed samples below 1200°C. Ultimately, for
particles annealed at 1200°C and with a crystal size of 82 nm, the EXAFS oscillations
were similar, if not entirely matching, to those of the bulk-UIV O2 , indicating the
same fcc-structure (Fm-3m) and same interatomic distances and substantial crystal
perfection. That was in agreement with the structure-similarity shown in the XRD
analysis between the nc-UO2 sample annealed at 1200°C and the reference large-grain
bulk-UIV O2 sample; and was also consistent with the XANES studies, showing no
departure from the fluorite structure for the fully annealed UO2 nanoparticles. In the
k3 -weighted EXAFS spectra of the UO2 nanoparticles from the organic origin, the
results were different as above, being not only the as-precipitated 5 nm sample very
difficult to fit with a pure fluorite structure, but the samples treated at 600°C and
1200°C, too. All samples presented a high degree of disorder and could not match at
all the reference signature of bulk-UIV O2 , with the meaning that another unidentified
phase must be taken into account in this case.
NMR Hahn-echo 17 O MAS spectra could be acquired for samples prepared
by the aqueous method after annealing at different temperatures under reducing
atmosphere (Ar/5%H2 ). Three different oxygen environments could be identified
from the fitting of the chemical-shift signatures of these samples, i.e., the records of
the 17 O-resonance-frequency peak displacement with respect to that of a reference
specimen, expressed in relative units (ppm). In the present case, the 17 O-resonance
of a 17 O-dopped H2 O sample was taken as reference, and defined as 0 ppm. The first
identification corresponded to oxygen species having a chemical shift of nearly 900 ppm
and was found for samples annealed up to 650°C. The two other types of oxygen
species identified appeared clearly in the temperature range 650°C-1200°C. These new
species, i.e., one showing a sharp and the other a broad 17 O-peak, could be respectively
attributed to 17 O in a well crystalline environment and in a more disordered one; the
last due to the larger peak broadening. Both peaks diminished strongly their chemical
shifts and half-maximum widths in the temperature range 650°C-800°C, to converge
rapidly at temperatures above 800°C to values near those of the sample annealed at
1200°C, i.e., respectively, 717 ppm (chemical shift) and 5 ppm (FWHM), which due to
very small peak broadening (FWHM) indicated a very well crystallized environment.
This last was still slightly bigger than the 3 ppm found for UIV O2 -bulk. Despite this,
the chemical shift (717 ppm) was the same as that found for UIV O2 -bulk. Hence,
one can say that the environment around the oxygen lattice positions in the case
xxxii
of the sample with the biggest crystallite size (∼80 nm) was very close to that of
UIV O2 -bulk. Based on the FWHM, one can say that to observe the signal of crystalline
UO2 a crystallite size above 80 nm should be reached. This is in line with the observation by XRD of an UO2 -fcc structure with lattice parameter 0.5472 nm in this case.
Several samples from the aqueous method at key annealing temperatures were also
analysed under the FTIR spectrometer. In the case of nc-UO2 in the as-produced
condition (RT), four peaks in the range 400-4000 cm−1 could be observed. They could
be assigned to the bending vibration of H-O-H of the coordinated water, and to a
possible more oxidised state (UO2+x ). All these peaks diminished in intensity with
the annealing temperature. Hence, at 1200°C the IR spectra looked like the one of
the UIV O2 reference sample. That was also in agreement with the above commented
XANES results where a different electronic structure was seen at 600°C, while at
1200°C a similar structure to bulk-UIV O2 was found. Also EXAFS was characterized
by poor ordering at 600°C but entirely matching with the bulk-UIV O2 oscillation pairs
at 1200°C.
Isothermal grain-growth study of the synthesized nc-UO2 was then performed by
XRD and HT-XRD. For the annealing temperatures of 500°C, 700°C and 900°C and
a static and inert atmosphere of He, the grain growth took place in the first hours
of isothermal hold until a stable average crystal size was established at the applied
temperature, at which time grain growth ceased. For the isotherm at 1200°C and a
static atmosphere of He, the material had a continuous growth not reaching a constant
grain value in the first 50 h. An activation energy of diffusion of 0.93 eV to 1.25 eV
was obtained. The low activation energies obtained could be related predominantly to
grain boundary (surface and interface) diffusion.
A lattice parameter of about 0.5472 nm was already found for the samples treated
at 900°C after 50 h dwell time under Ar/H2 obtaining a final size about 50 nm.
Therefore a temperature of 1200°C (and in consequence a final crystallite size of
80 nm) would be, in principle not necessary to reach the typical lattice parameter of
the reference large-grained UO2 (a=0.5472 nm), as above commented.
An average crystal size of 322 nm was measured after cooling for the heat treatment
at the highest temperature of 1200°C after 50 h dwell time under He. Taking that
into account, it appears that a temperature below 1200°C would be necessary in the
sintering process of the monoliths to avoid extreme growth of the particles (>200 nm).
Nevertheless for the nc-UO2 samples annealed at 1200°C during 50 h under Ar/H2
dynamic atmosphere, a final crystal size of 85 nm was measured after cooling. Even
after 200 h dwell time at this temperature under reducing atmosphere, a final crystal
size of 150 nm was seen (quite far from the 322 nm observed under He atmosphere
after 50 h). This difference could be due to the initial oxidation state of the nc-UO2
samples and their evolution under a static He atmosphere. An hyperstoichiometric
UO2 would present a stronger increase of the self-diffusion coefficients and in the same
way raise the mass-flow, for which enhanced grain-boundary motion and grain (or
crystal) growth will occur. In fact the differences in the diffusion coefficient between
bulk-large-grain-UO2 and nc-UO2 are compatible with an enhancement of the diffusion
processes either by a diminishing of the grain size or by O/U>2 effects.
xxxiii
nc-UO2 monolith consolidation and characterization
Different alternative routes for consolidation into green bodies (e.g. conventional
uniaxial pressing, float packing, etc.) have been tested. Afterwards the green bodies
were sintered at temperatures between 900°C and 1200°C under Ar/H2 atmosphere.
The optimum sintering conditions were deduced from the long-isothermal crystallite
growth studies under He and Ar/H2 atmosphere. This ensured lack of disproportionate
grain growth risks even at the highest temperature used of 1200°C. Also thermal
pre-conditioning of the powder before pressing was in some cases done to avoid cracks
during the sintering step due to the presence of water or organics (depending on the
case) in the material. The pellets sintered presented a strong appearance although fine
cracks were visually observable in some cases. Sintering densities between 75.5-90.5% of
the theoretical density (TDU O2 =10.96 g/cm3 ), were obtained. An average grain size of
∼200 nm, replicating the HBS, was obtained for all the different sintered nc-UO2 pellets.
Additional dilatometry experiments were performed to compare the shrinkage
of the fabricated nc-UO2 pellet with that of bulk-UO2 (large grain) produced by
a standard fabrication process. Enhanced sinter activities of the nanocrystalline
materials compared to microcrystalline UO2 were found at lower temperatures. The
temperature range from onset to completion of the densification occurred at much
more lower temperatures for the nc-UO2 (200-955°C, with a maximum sintering rate at
740°C), compared to the bulk-UO2 [Lahiri et al., 2006] (900-1540°C, with a maximum
sintering at 1200°C). The reason of that might be the higher surface present in the
nc-UO2 compared with the bulk-UO2 material, rendering the sintering to become more
effective (at lower temperatures). The sintering activation energy was determined as
Q = 171 ± 7 kJ/mol assuming surface diffusion and Q = 114 ± 5 kJ/mol assuming
volume diffusion for the nc-UO2 monolith, compared to Q = 287 kJ/mol determined
for bulk-UO2 in the literature [Lahiri et al., 2006]). Both diffusion mechanisms showed
low values of the sintering activation energies as typical for nanopowders. That means
a clear technological advantage in the fabrication of nc-UO2 monoliths due to its
high densification capacity at low temperatures. Furthermore, the nc-UO2 offered the
possibility of adjusting the grain size at will by varying sintering temperatures and
times. Maintaining an acceptably low temperature range in the sintering process, it
will diminish the costs and simplify the manufacturing technology.
Characterization of macrostructures by optical microscopy (OM), and microstructures by fresh-fracture observation by SEM, for different samples at different
magnifications, was performed. Not well defined grains were observable in the
fresh-fracture SEM images of the pellets sintered at low temperature of 900°C. The
sinter of the crystals was still under development, therefore sintering temperatures of
1200°C were used afterwards. Macrocracks across different samples were observed,
but not for the monoliths from nc-UO2 synthesized by the organic-route with powder
thermal pre-treatment, and not for the monoliths from the float-packing consolidation
method and powder of the aqueous-synthesis. All macrostructures, with exception
of the last one, showed non-homogeneous densification (residual porosity between
densified areas). Also the conventional pressed sample of pre-dehydrated powder
from the aqueous route showed a good quality in comparison to the rest, from the
point of view of the densification. However, improvements in the performance of the
monoliths would be necessary to avoid the problem of cracks in the sintered pellets
(and therefore the diminishing material’s properties). Looking at the fresh fracture
surfaces, the microstructure of the aqueous-route-powder pellet produced by float
xxxiv
packing consolidation and sintering at 1200°C, was the closest approximation to the
HBS material obtained until now. The average grain size for the different monoliths was in the 170 nm to 250 nm range. Here a major success of this work was achieved.
Mechanical properties as Vickers Hardness (HV ), Knoop Hardness (HK ) and
Young’s modulus (E) were determined for sintered nc-UO2 pellets. An increase in
hardness (HV ) and low values for E-modulus (up to 30%) were in general seen for
the different nc-UO2 monoliths in comparison with bulk-UO2 . Also scanning acoustic
microscopy (SAM) was used for the estimation and comparison of the Young’s Emodulus obtained by indentation. The results by SAM (E=150 GPa) matched the ones
derived from microindentation (E=155 GPa). This difference observed with respect
to bulk-UO2 pellets (220 GPa), could be influenced by microstructure imperfections
(nanocavities at triple-grain junctions, pores, cracks, etc.). However, the drop was still
too large to be attributed only to the presence of cavities. The same type of tendency
observed in the nc-UO2 specimens, i.e. with increase of HV values and decrease of
the E-modulus values, has been found before in irradiated standard-UO2 fuel at high
BUs. In this case also the E-modulus decrease could not be fully attributed to a
porosity increase and was to contradict the effect of the fission products dissolution,
which causes in reality an increase of the material’s stiffness. Since with the increase
of BU the irradiated nuclear fuels transform into a nano-recrystallized structure
[Spino et al., 2012], the effects of (partial) HV -increase (fission products dissolution
causes as well hardening) and additional E-modulus decrease (beside that caused by
porosity) like the effects observed in the present work could be attributed in high BU
fuels due to the nanostructure.
The confirmation of the size-dependent physical-chemical properties of nc-UO2 has
been successfully accomplished. So the compressibility of nc-UO2 was proved in fact to
be larger than that of standard-UO2 . A size-dependence of the thermal expansion properties of nc-UO2 was also confirmed. The thermal expansion was shown to increase with
the size-decrease, at the time that the bulk modulus decreased. This is compatible with
the Grüneisen relationship showing a constant product between the thermal conductivity and the bulk modulus. However, verification of the trend in the specific heat (Cp)
is still lacking, which is indeed neeeded to complete the Grüneisen-relationship analysis.
Regarding the material’s compressibility, in-situ high pressure X-ray diffraction
(HP-XRD) has been performed for the study of the bulk modulus dependence on the
crystal size in nc-UO2 . Three different nc-UO2 sizes (4 nm, 6 nm and 34 nm) were
studied up to a pressure of 27 GPa and the corresponding compressibility constants
B0 and B0 determined. The bulk modulus of UO2 suffered an extreme decrease in
the nano-size particle range. For the 4 nm-size nc-UO2 -particles, a bulk modulus
(B0 ) around 40% lower than the one measured for bulk-UO2 (micron-size grains)
[Pujol et al., 2004], has been observed. This confirmed the dependence of the bulk
modulus with the crystallite size. However, studies with bigger particle sizes as the
ones here studied (>34 nm) would be necessary to guarantee that the tendency
observed in the monoliths (decrease of E-modulus), is due to the size of the grains and
not just because of imperfections and porosity possibly present in the samples.
The results of thermal diffusivity tests of the compacted nc-UO2 -material showed
similar behaviour as that of standard, nuclear grade UO2 (bulk). The thermal
diffusivity for sintered nc-UO2 (∼200 nm, 90% density), was determined between
xxxv
254°C to 1165°C. Extrapolation to 95% density was done and same thermal diffusivity
as standard bulk-UO2 pellet [Fink, 2000] with 95% density was found. Regarding
the feared worsening of the thermal conductivity of the HBS material due to grainsize effect (Kapitza resistance), it has been here shown that no thermal properties
deterioration has to be expected for the 200 nm-UO2 pellet material mimicking the HBS.
Determination of the melting point by laser-heating and pyrometric temperature
detection has been performed for compacted nc-UO2 with two different nano-grain sizes
(about 10 nm and 200 nm) and their variation with respect to bulk-UO2 (large-grain),
assessed. A melting point depression of about 150°K with respect to the normal value
of bulk-UO2 was found for the 10 nm-size nc-UO2 sample. This reduction would be
a priori due to the nano-size grains. However, the measured lattice constant of the
sample before melting (a=0.5438 nm) was below the value of bulk-UO2 (a=0.547 nm)
and indicated in reality a hyperstoichiometric oxide, which would also cause a melting
point decrease. To corroborate the measured tendency with the grain-size reduction, a
strictly stoichiometric nc-UO2 sample would be needed. However, an identical melting
point as for bulk-UO2 , was found for the 200 nm-sample for which a stoichiometry of
O/M=2.00 was confirmed from the lattice constant measurement before melting. This
is an important technological result for the use of nc-UO2 ceramics as nuclear fuel.
Indeed, a lower melting point would pose a problem for the licensing of the monoliths
as a fuel for the reactor. Fortunately the possibility of a lower melting point disappears
for the 200 nm-UO2 samples, as it would occur for the HBS material in the reactor, too.
So, postulated nano-effects such as diminution of the thermal conductivity and the
melting point could be here excluded as weak points for the use of nc-UO2 as a nuclear
fuel. These effects might be relevant for very low crystal/grain sizes (∼10 nm) but they
disappear for grain sizes of ∼ 200 nm, where, conveniently, the sought advantageous
properties of the nano-structure (super-plasticity, low swelling under Xe-bombardment
[Spino et al., 2012], self-limiting grain growth, etc.), still remain. This anticipates the
lack of property loss of the developed nc-UO2 monoliths for technical applications in
this size range.
Future Recommendations
The licensing of nuclear fuel is made on basis of its safety performance not just only
under normal operation conditions, but also when a temperature rise occurs in the
fuel. This could be caused in a Loss of Coolant Accident (LOCA) or in a Reactivity
Initiated Accident (RIA). Under such extreme conditions fuel fragmentation could
occur. During this thesis, one attempt was made to mimic such an accident in an out
of pile experiment using nc-Y-ZrO2 as a sample instead of nc-UO2 . This test was made
in a facility at ITU (Institute for Transuranium Elements) known as POLARIS, which
permits very rapid laser heating of the sample.
The initial material tested in POLARIS was pore free and its surface was flat. The
laser treatment showed that a local swelling occurred through formation of porosity.
This experiment was not perfectly well controlled, but it is likely that the observed
swelling was due to CO or CO2 gas generated when the carbon impurity in the
material reacted with oxygen from the atmosphere, which caused pore formation, in
a process similar to the production of foamed glass. A particularly interesting result
xxxvi
of the test is that the formed pores were closed and astonishingly similar to those of
the HBS-zone in high burn-up fuels. Chances appear therefore that during such kind
of postulated fuel melting accident, at least part of the fission gas could be trapped
in potentially forming closed pores, as it occurs in the HBS material at low temperatures. Although these experiments are preliminary they suggest a promising novel
method to test the gas retention capability of the nc-UO2 fuel under accident conditions.
Finally, another important method to understand the resistance of nc-materials to
irradiation can be provided by ion beam irradiation tests. This can be done at facilities
like the ANL (Argonne National Laboratory) IVEM-Tandem facility in Chicago, where
irradiation with inert gas ions (He or Xe) with on-line TEM observation provides a
very useful way to implant the gas atoms and to evaluate how they behave in the
matrix, e.g. dissolution therein, formation of bubbles, transport of bubbles along grain
boundaries, etc.
Concluding remarks
Successful consolidation of the synthesized nanocrystalline UO2 nanopowders into
dense pellets mimicking of the High Burn-up Structure (HBS) as ideal system has
been achieved. From the different synthesized nc-UO2 powders (4-5 nm size) to the
nc-UO2 compacted monoliths with 200 nm average grain size and about 90% density
were achieved. Stability of the structure after ageing and self limiting grain growth
kinetics up to temperatures of 1200°C, were shown. The out-of-pile mechanical
properties of sintered pellets (in terms of hardness and elastic modulus) were confirmed
to closely resemble those of the HBS-material in-pile. Beneficial properties found,
like stability of the structure, enhanced mechanical properties and self-limiting grain
growth, strongly encourage the performance of irradiation tests to verify the in-reactor
behaviour. As determined previously in out-of-pile tests of monoliths of the brother
system of nanocrystalline nc-Y-ZrO2 [Spino et al., 2012], a strong reduction of the
gas bubble swelling, long term thermal stability of the pore-grain configuration, and
striking superplastic behaviour and accelerated creep, would be expected as well for the
developed nc-UO2 . Confirmation of anomalies in the physical properties of the material
for grain sizes in the absolute nanorange (<30 nm), consistent with observations in
other nc-systems was also achieved. These pernicious nano-effects, as diminution of
the thermal conductivity and the melting point, which could be a weak point for the
use of nc-UO2 as a fuel, were found, however, to become relevant only at very low
crystal/grain sizes (<30 nm) and to disappear for grain sizes of ∼200 nm, where,
suitably, the other searched beneficial properties of this nanostructure super-plasticity,
low gas-bubble swelling, self-limiting grain growth, etc., remain. This anticipates the
lack of property loss of the developed nc-UO2 monoliths for technical applications in
this size range. This has been a very rewarding work, with a number of breakthroughs
achieved. Much has been learned, but more needs to be done to determine the true
potential of this intriguing material.
xxxvii
xxxviii
Contents
Abstract
xii
Resumen
xxvi
Summary
xxxviii
List of Symbols and Abbreviations
xliii
1 Introduction
1.1 Background and state of the art. . . . . . . . . . . . . . . . . . . . . .
1.2 Goal of the thesis. . . . . . . . . . . . . . . . . . . . . . . . . . . . . . .
1
1
10
2 Analytical and characterization techniques
2.1 Electrochemical analysis . . . . . . . . . . . . . . . . . . . . . . . . . .
2.1.1 Cyclic Voltammetry (CV) . . . . . . . . . . . . . . . . . . . . .
2.1.2 Electrolysis . . . . . . . . . . . . . . . . . . . . . . . . . . . . .
2.2 Spectroscopy . . . . . . . . . . . . . . . . . . . . . . . . . . . . . . . .
2.2.1 Ultraviolet-visible spectroscopy (UV-Vis) . . . . . . . . . . . . .
2.2.2 Dynamic Light Scattering (DLS) . . . . . . . . . . . . . . . . .
2.2.3 X-ray Absorption Near Edge Structure (XANES) and Extended
X-ray Absorption Fine Structure (EXAFS) . . . . . . . . . . . .
2.2.4 Nuclear Magnetic Resonance spectroscopy (NMR) . . . . . . . .
2.2.5 Infrared spectroscopy (IR) . . . . . . . . . . . . . . . . . . . . .
2.3 Electron microscopy . . . . . . . . . . . . . . . . . . . . . . . . . . . .
2.3.1 Scanning Electron Microscopy (SEM) . . . . . . . . . . . . . . .
2.3.2 Transmission Electron Microscopy (TEM) . . . . . . . . . . . .
2.4 X-ray scattering . . . . . . . . . . . . . . . . . . . . . . . . . . . . . . .
2.4.1 Room Temperature X-Ray Diffraction (RT-XRD) . . . . . . . .
2.4.2 High Temperaure X-Ray Diffraction (HT-XRD) . . . . . . . . .
2.5 Thermogravimetry/Differential Thermal Analysis (TGA/DTA) . . . . .
2.6 Dilatometry . . . . . . . . . . . . . . . . . . . . . . . . . . . . . . . . .
2.7 Mechanical Characterization . . . . . . . . . . . . . . . . . . . . . . . .
2.7.1 Microindentation . . . . . . . . . . . . . . . . . . . . . . . . . .
2.7.2 High Pressure X-Ray Diffraction (HP-XRD) . . . . . . . . . . .
2.7.3 Scanning Acoustic Microscopy (SAM) . . . . . . . . . . . . . . .
2.8 Thermophysical characterization . . . . . . . . . . . . . . . . . . . . . .
2.8.1 Thermal Diffusivity . . . . . . . . . . . . . . . . . . . . . . . . .
2.8.2 Melting Point . . . . . . . . . . . . . . . . . . . . . . . . . . . .
13
13
13
14
15
15
15
16
17
17
18
18
18
18
19
19
19
20
20
20
20
21
21
21
22
xxxix
3 Synthesis of nc-UO2 by controlled massive precipitation in Aqueous
phase
3.1 Introduction and principles. . . . . . . . . . . . . . . . . . . . . . . . .
3.1.1 U-stability: environmental studies. . . . . . . . . . . . . . . . .
3.1.2 U-redox chemistry pertinent to nc-UO2 synthesis. . . . . . . . .
3.1.3 nc-UO2 synthesis principles. . . . . . . . . . . . . . . . . . . . .
3.2 Mother solution preparation. . . . . . . . . . . . . . . . . . . . . . . . .
3.3 UIV /UV I cyclic voltammetric and spectrophotometric study. . . . . . .
3.3.1 Cyclic voltammetric study of the mother solution. . . . . . . . .
3.3.1.1 Experimental arrangement. . . . . . . . . . . . . . . .
3.3.1.2 Results and discussion. . . . . . . . . . . . . . . . . . .
3.3.2 Electrochemical reduction of the mother solution. . . . . . . . .
3.3.2.1 Experimental arrangement. . . . . . . . . . . . . . . .
3.3.2.2 Results and discussion. . . . . . . . . . . . . . . . . . .
3.3.3 UV-Vis spectrophotometry of the solution. . . . . . . . . . . . .
3.3.3.1 Experimental. . . . . . . . . . . . . . . . . . . . . . . .
3.3.3.2 Results and discussion. . . . . . . . . . . . . . . . . . .
3.4 Precipitation and separation of the UO2 -nanocrystals. . . . . . . . . . .
3.4.1 Introduction remarks. . . . . . . . . . . . . . . . . . . . . . . .
3.4.2 Experimental steps. . . . . . . . . . . . . . . . . . . . . . . . . .
3.4.3 Spectrophotometry of the solution. . . . . . . . . . . . . . . . .
3.5 Characterisation of the as-produced nanocrystals. . . . . . . . . . . . .
3.5.1 Precipitates morphology and composition. . . . . . . . . . . . .
3.5.2 Precipitates crystal structure. . . . . . . . . . . . . . . . . . . .
3.6 Results and discussion. . . . . . . . . . . . . . . . . . . . . . . . . . . .
25
25
25
26
27
28
28
28
28
37
38
38
39
39
39
41
43
43
44
45
46
46
46
47
4 Synthesis of nc-UO2 and nc-ThO2 by a precursor thermal decomposition in Organic phase
4.1 Introduction and principles. . . . . . . . . . . . . . . . . . . . . . . . .
4.2 Experimental. . . . . . . . . . . . . . . . . . . . . . . . . . . . . . . . .
4.2.1 Solution preparation. . . . . . . . . . . . . . . . . . . . . . . . .
4.2.1.1 UO2 nanocrystals preparation. . . . . . . . . . . . . .
4.2.1.2 ThO2 nanocrystals preparation. . . . . . . . . . . . . .
4.2.2 Reaction step. . . . . . . . . . . . . . . . . . . . . . . . . . . . .
4.2.2.1 UO2 nanocrystals production. . . . . . . . . . . . . . .
4.2.2.2 ThO2 nanocrystals production. . . . . . . . . . . . . .
4.3 Precipitation and separation of the nanocrystals. . . . . . . . . . . . . .
4.3.1 UO2 nanocrystals recovery. . . . . . . . . . . . . . . . . . . . . .
4.3.2 ThO2 nanocrystals recovery. . . . . . . . . . . . . . . . . . . . .
4.4 Characterisation of the as produced nanocrystals. . . . . . . . . . . . .
4.4.1 Precipitates morphology and composition. . . . . . . . . . . . .
4.4.1.1 UO2 nanocrystals morphology. . . . . . . . . . . . . .
4.4.1.2 ThO2 nanocrystals morphology. . . . . . . . . . . . . .
4.4.2 Precipitates crystal structure. . . . . . . . . . . . . . . . . . . .
4.4.2.1 UO2 nanocrystal structure. . . . . . . . . . . . . . . .
4.4.2.2 ThO2 nanocrystal structure. . . . . . . . . . . . . . . .
4.5 Results and discussion. . . . . . . . . . . . . . . . . . . . . . . . . . . .
55
55
57
59
59
59
60
60
61
62
62
62
64
64
64
64
66
67
68
70
xl
5 Crystallization and Grain Growth in f(T) for nc-UO2 by Aqueous
route
73
5.1 Generalities. . . . . . . . . . . . . . . . . . . . . . . . . . . . . . . . . .
73
5.2 Thermal evolution and mass changes as probed by TGA/DTA. . . . . .
73
5.3 Lattice parameter and crystal growth in neutral atmosphere. . . . . . .
74
5.3.1 Grain growth as a function of temperature under neutral atmosphere. . . . . . . . . . . . . . . . . . . . . . . . . . . . . . . . .
75
5.3.2 Lattice parameter and linear thermal expansion coefficient as a
function of temperature. . . . . . . . . . . . . . . . . . . . . . .
76
5.3.3 Lattice strain evolution as a function of temperature. . . . . . .
80
5.4 Lattice parameter and crystal growth under reducing conditions. . . . .
80
5.4.1 Crystal size and lattice parameter evolution as a function of temperature as probed by XRD. . . . . . . . . . . . . . . . . . . . .
80
5.4.2 O/M ratio as a function of temperature as probed by XANES. .
83
5.4.3 Order and disorder probed by local methods, as Debye-Waller
EXAFS, NMR and FTIR, as a function of crystal size. . . . . .
87
5.4.3.1 Local structures as probed by Debye-Waller EXAFS distances. . . . . . . . . . . . . . . . . . . . . . . . . . . .
87
5.4.3.2 Local structure and valence state as probed by MAS
NMR. . . . . . . . . . . . . . . . . . . . . . . . . . . .
89
5.4.3.3 Local structure and valence state as probed by FTIR. .
94
5.5 nc-UO2 long-isothermal grain growth as probed by XRD under neutral
and reducing conditions. . . . . . . . . . . . . . . . . . . . . . . . . . .
98
5.6 Results and discussion. . . . . . . . . . . . . . . . . . . . . . . . . . . . 103
6 Crystallization and Grain Growth in f(T) for nc-UO2 by Organic route111
6.1 Generalities. . . . . . . . . . . . . . . . . . . . . . . . . . . . . . . . . . 111
6.2 Thermal evolution and mass changes as probed by TGA/DTA. . . . . . 111
6.3 Lattice parameter and crystal growth in neutral atmosphere. . . . . . . 111
6.3.1 Grain growth as a function of temperature under neutral atmosphere. . . . . . . . . . . . . . . . . . . . . . . . . . . . . . . . . 113
6.3.2 Lattice parameter and linear thermal expansion coefficient as a
function of temperature. . . . . . . . . . . . . . . . . . . . . . . 114
6.3.3 Lattice strain evolution as a function of temperature. . . . . . . 117
6.4 Lattice parameter and crystal growth under reducing conditions. . . . . 117
6.4.1 Crystal size and lattice parameter evolution as a function of temperature as probed by XRD. . . . . . . . . . . . . . . . . . . . . 117
6.4.2 O/M ratio as a function of temperature as probed by XANES. . 119
6.4.3 Order and disorder probed by local methods, as Debye-Waller
EXAFS, as a function of crystal size. . . . . . . . . . . . . . . . 124
6.5 Results and discussion. . . . . . . . . . . . . . . . . . . . . . . . . . . . 124
129
7 nc-UO2 monolith consolidation and characterization
7.1 Introduction and principles. . . . . . . . . . . . . . . . . . . . . . . . . 129
7.2 Compaction methods . . . . . . . . . . . . . . . . . . . . . . . . . . . . 130
7.2.1 Conventional uniaxial pressing . . . . . . . . . . . . . . . . . . . 130
7.2.2 Float-packing . . . . . . . . . . . . . . . . . . . . . . . . . . . . 131
7.3 Characterization of the nc-UO2 monoliths. . . . . . . . . . . . . . . . . 132
7.3.1 Green Specimens. . . . . . . . . . . . . . . . . . . . . . . . . . . 132
7.3.1.1 Conventional pressed pellets of nc-UO2 from aqueous
route. With/without thermally pre-treated powder. . . 132
xli
7.3.1.2
Float packing consolidation of nc-UO2 from aqueous
route in pellet form. . . . . . . . . . . . . . . . . . . .
7.3.1.3 Conventional pressed pellet of nc-UO2 from organic
route. Thermally pre-treated powder. . . . . . . . . . .
7.3.2 Sintered of the nc-UO2 green bodies. . . . . . . . . . . . . . . .
7.3.3 Macro and microstructural characterization of the nc-UO2 monoliths. . . . . . . . . . . . . . . . . . . . . . . . . . . . . . . . . .
7.3.4 Results and discussion. . . . . . . . . . . . . . . . . . . . . . . .
7.4 Mechanical properties of nc-UO2 . . . . . . . . . . . . . . . . . . . . . .
7.4.1 Hardness and Young’s modulus of nc-UO2 monoliths as probed
by Vickers and Knoop indentation. . . . . . . . . . . . . . . . .
7.4.2 Young’s modulus as probed by scanning acoustic microscopy
(SAM). . . . . . . . . . . . . . . . . . . . . . . . . . . . . . . .
7.4.3 Bulk and Young’s modulus of nc-UO2 as a function of the crystal
size by high pressure XRD. . . . . . . . . . . . . . . . . . . . .
7.4.4 Results and discussion. . . . . . . . . . . . . . . . . . . . . . . .
7.5 Thermophysical properties of nc-UO2 monoliths. . . . . . . . . . . . . .
7.5.1 Thermal Diffusivity in nc-UO2 monoliths. . . . . . . . . . . . .
7.5.2 Melting Point Depression in nc-UO2 monoliths. . . . . . . . . .
7.5.3 Results and discussion. . . . . . . . . . . . . . . . . . . . . . . .
7.6 Results and discussion. . . . . . . . . . . . . . . . . . . . . . . . . . . .
8 Overall Discussion and Conclusions
8.1 Synthesis of nc-UO2 and nc-ThO2 . . . . . . . . . . . . . . . .
8.2 Crystallization and Grain Growth in f(T) for nc-UO2 . . . . . .
8.3 Structure and oxygen-stoichiometry studies by XRD, XANES,
NMR AND FTIR. . . . . . . . . . . . . . . . . . . . . . . . .
8.4 nc-UO2 monolith consolidation and characterization. . . . . .
. . . . .
. . . . .
EXAFS,
. . . . .
. . . . .
133
133
134
138
145
147
147
152
153
158
162
163
163
165
166
171
171
173
175
179
9 Future Recommendations
183
9.1 Synthesis of the nanoparticles. . . . . . . . . . . . . . . . . . . . . . . . 183
9.1.1 Synthesis of ThO2 nanoparticles to study a unique valence system.183
9.1.2 Synthesis of PuO2 nanoparticles and 238 Pu doping to enable damage in the nc-UO2 . . . . . . . . . . . . . . . . . . . . . . . . . . 183
9.1.3 Synthesis of nanoparticles of different controlled sizes. . . . . . . 183
9.1.4 Use of ThO2 nanorods as reinforcement in the the nc-monoliths
to increase strength. . . . . . . . . . . . . . . . . . . . . . . . . 183
9.2 Basic science of nc-actinide oxides. . . . . . . . . . . . . . . . . . . . . 184
9.3 Alternative monolith compaction and sintering methods. . . . . . . . . 184
9.3.1 Sintering of commercial nc-Y-ZrO2 by spark plasma sintering
(SPS), as substitute of nc-UO2 . . . . . . . . . . . . . . . . . . . 184
9.3.2 Centrifugal casting . . . . . . . . . . . . . . . . . . . . . . . . . 185
9.4 nc-UO2 in extreme conditions. . . . . . . . . . . . . . . . . . . . . . . . 186
Institute for Transuranium Elements (ITU)
194
List of Tables
195
List of Figures
199
Bibliography
214
xlii
List of Symbols and Abbreviations
α
Thermal Diffusivity (m · s−1 )
ΔE0 Threshold energy shift (eV)
m
monoclinic
Q
Charge (C)
λ
Thermal Conductivity (W · m−1 · K−1 )
Qdif f Activation energy of diffusion (eV)
ρ
Density (g · cm−3 )
R
Interatomic distance ((Å))
σ2
Debye-Waller factor ((Å2 ))
t
tetragonal
τ
Relaxation time (h)
VR
Rayleigh wave velocity (m/s−1 )
θ
Diffraction angle (°)
1H NMR Hydrogen Nuclear Magnetic Resonance
υ
Poisson modulus
%FIMA % Fissions per Initial Metal Atom
a
Knoop- long diagonal (mm)
a
b
Knoop- short diagonal (mm)
a.u. arbitrary units
B0
Compressibility modulus (GPa)
am
amorphous
c
cubic
An
Actinide
Cp
Heat capacity at constant pressure
atm. atmosphere
Cv
Heat capacity at constant volume
BM-EOS Birch-Murnaghan equation of state
CN Coordination Number
Lattice parameter
BU Burn-Up
d
Vickers- average diagonal (mm)
c
Di
Diffusion coefficient (m2 /s)
CV Cyclic Voltammetry
E
Potential (V)
DLS Dynamic Light Scattering
e
Lattice strain
DSC Differential Scanning Calorimeter
F
Faraday constant
DW Debye-Waller factor
F
Load (N)
E
f
fix parameters
EDX Energy-Dispersive X-ray spectroscopy
f cc face centered cubic
crystalline
Young’s modulus (GPa)
EELS Electron Energy Loss Spectroscopy
G0
Starting grain size (nm)
EOS Equation of state
GL
Limited grain size (nm)
EXAFS Extended X-ray Absorption Fine Structure
H
Hardness (GPa)
FP
Fission products
FT
Fourier Transform
HK Knoop Hardness number (-)
HV
Vickers Hardness number (-)
FTIR Fourier Transform Infrared spectroscopy
I
Intensity (A)
FWHM Full Width at Half Maximum
i
kB
Current density
(mA/cm2 )
Boltzmann constant
GB Grain boundary
(8.6173324 · 10−5 eV
1
KIc Fracture toughness (MPa · m 2 )
· K −1 )
Gen Generation
GOF Goodness of fit value
xliii
GWd/tM Gigawatt-days per ton of fissile metal atoms
RT
HAADF High Angle Annular Dark Field
SAED Selected Area Electron Diffraction
HBS High Burn-up Structure
SAM Scanning Acoustic Microscopy
HP High Pressure
SEM Scanning Electron Microscopy
HP-XRD High Pressure X-Ray Diffraction
SF
HRTEM High Resolution TEM
SPS Spark plasma sintering
HT-XRD High Temperaure X-Ray Diffraction
STEM Scanning Transmission Electron Microscopy
IR
TD theoretical density (%)
Infrared spectroscopy
Room Temperature
SIMFUEL or simulated nuclear fuel
ITU Institute for Transuranium Elements
TEM Transmission Electron Microscopy
LAF Laser Flash
TGA/DTA Thermogravimetry/Differential-Thermal
Analysis
LIBD Laser-Induced Breakdown Detection
ThA Thorium Acetate
LOCA Loss of Coolant Accident
ThAA Thorium AcetylAcetonate
LP
Low Pressure
TODS 3,6,9-Trioxadecanoic acid
LTE Linear Thermal Expansion
LTEC Linear Thermal Expansion Coefficient
LVDT Linear Variable Differential Transformer
LWR Light Water Reactor
M
Molarity (mol/L)
MAS-NMR Magic Angle Spinning Nuclear Magnetic Resonance
nc
Nanocrystalline
NIR Near InfraRed
NMR Nuclear Magnetic Resonance spectroscopy
NPs Nanoparticles
O/M Oxygen to metal ratio
OA Oleic Acid
OAM Oleylamine
ODE Octadecene
OM Optical Microscopy
OOA N-(cis-9-octadecenyl)oleamide
PCCI Pellet Clad Chemical Interaction
PCI Pellet Clad Interaction
PCMI Pellet Clad Mechanical Interaction
PCS Photon Correlation Spectroscopy
PTT previous Powder Thermal Treatment
PWR Pressurized Water Reactor
Rf
Goodness of fit (%)
RIA Reactivity Initiated Accident
rpm Revolutions per minute
xliv
TZP Tetragonal Zirconia Polycrystals
UAA Uranyl AcetylAcetonate
V-EOS Vinet equation of state
WL White-Line
XANES X-ray Absorption Near Edge Structure
XAS X-ray Absorption Spectroscopy
XRD X-Ray Diffraction
Y-ZrO2 4 mol% Y2 O3 ZrO2
Chapter 1
Introduction
1.1
Background and state of the art.
Today’s nuclear fuels are largely based on uranium dioxide (UO2 ). A high level of
proficiency has been reached, with fuels achieving moderate to high burn-up (BU)
in the reactor. In nuclear power technology, BU (also known as fuel utilisation) is a
measure of the amount of energy extracted from the primary nuclear fuel source. It
is defined as the fraction of fuel atoms that underwent fission in % fissions per initial
metal atom (%FIMA). But also as the actual energy released per mass of initial fuel in
gigawatt-days per ton of fissile metal atoms (GWd/tM).
To go beyond the today’s achievements a more radical approach may be needed,
which will enable the fuel to reach yet higher BUs. This is desirable for the reduction
of the amount of fresh fuel required and the mass of spent fuel inventories (radioactive
waste). To achieve these goals, improved fission gas retention capability of the fuel is
required as well as a solution to the pellet clad mechanical and chemical interaction
(PCMI and PCCI) failure risks problem is needed, which could intensify at high BUs
due to boosted cladding embrittlement.
The current nuclear electricity plants are based predominantly on light water reactors (LWR). The fuel is produced, after enrichment, by conversion of UF6 (uranium
hexafluoride) to UO2 . The product is a powder which is pressed and sintered at
high temperature to provide a solid fuel generally in the form of cylindrical pellets.
The pellets are stacked into zircalloy tubes known as cans or clads. The filled cans
sealed with arc-welded end plugs are known as rods or pins. The sealed zircalloy
(alloy of zirconium and tin) clad provides a tight encapsulation that serves as a
barrier between the fuel and the coolant (water), and avoids the escape of radioactive
fission-products. Between the pellet and the cladding there is initially a gap of
80-100 μm under cold conditions. It cannot be too large or it would cause the fuel to
operate at higher temperatures because of the larger separation to the coolant. But
this small space is fundamental to avoid or delay the possible fuel-cladding contact
because of pellet expansion during irradiation. The fuels rods are held together
with a fixed (usually square type) configuration by several spacer grids, which constitute altogether the fuel assemblies that are loaded into the core of the reactor (Fig. 1.1).
The fission energy is transformed to heat in the fuel pellet due to collision of
fission fragments with the surrounding fuel material and by gamma ray emission and
radioactive decay of the produced isotopes, which delivers a great amount of heat.
1
Chapter 1. Introduction
3
Figure 1.1: Light Water Reactor [The energy net, 2012] [U.S.NRC, 2012].
This heat is transferred to the coolant (water), which passes by the clad, generating
water vapour. This steam feeds conventional generators (steam-driven turbines) in the
primary (for BWR) or secondary (for PWR) loop which produce the electricity.
The fuel pellet inside the nuclear reactor is a material subjected to extreme
conditions which change its properties with time and irradiation dose. Each atom in
the fuel is displaced several times during its irradiation history but many return to
equivalent crystallographic positions. Damage and local defects like interstitials, loops
and vacancies are created. UO2 is a poor heat conductor, therefore the heat transfer
from the centre to the surface of the pellet is slow. A typical temperature profile of
a LWR pellet is shown in Fig. 1.2 [Konings et al., 2011]. Furthermore, accumulation
of solid fission products in the lattice and formation of gas bubbles make the pellet
thermal conductivity to decrease. The fission gases precipitate in bubbles and lead
eventually to compositional and microstructural changes, swelling of the fuel, as
well as to embrittlement and hardening of the cladding. Other effects occur in the
central sections of the fuel pellet (at higher temperature) and include grain growth,
porosity build-up and an augmented gas release [Kleykamp, 1979] [Stehle et al., 1975].
Fig. 1.3-left shows a fuel decorated with cracks after four reactor cycles (approximately
four years). On the right side of the figure, the evolution of the geometry of the pellets
inside a rod can be observed. Fuel cracks appear from the beginning of the irradiation
due to thermal stresses. The fuel pellets swell owing to the accumulation of fission
gas bubbles in the matrix and the segregation of low density fission-products phases
(metallic and ceramic precipitates). As a result of the swelling, the fuel approaches
the clad. Physical and/or chemical interaction can occur upon contact, which can
induce clad deterioration and rupture [Garzarolli et al., 1979]. These type of changes
can affect also the temperature profile of the fuel pellet (Fig. 1.2) by modification of
2
1.1. Background and state of the art.
the gap thermal transfer conditions, limiting the life time of the fuel (and BUs) inside
the reactor, if premature rod rupture occurs.
Figure 1.2: A typical temperature profile of a LWR fuel as a function of the fuel pin radius
[Konings et al., 2011].
A vast amount of work has been made in the last decades to characterise the
behaviour of high BU fuels and to deepen the knowledge of the underlying phenomena,
with the aim to increase the usage time of the fuel in the reactor [Watteau et al., 2001].
Besides that, in the last 20 years also a large increase of the research activities in
nanocrystalline (nc)-materials for different aims and applications has been ostensible
[Kulisch et al., 2009] [Mathur and Singh, 2009]. The question arises whether these
two apparently disconnected research areas would overlap and whether a link between
nc-materials and high BU nuclear fuel materials would exist. The answer to this
question is attempted below.
Figure 1.3: Macrograph of a fuel pellet after irradiation showing the typical radial cracks
(left). Pellet inside the pin illustrating the swelling with the irradiation time (right).
[Bailly et al., 1996].
Indeed, nuclear fuels approximately at the end of the third irradiation cycle
3
Chapter 1. Introduction
(about 40 GWd/tM) undergo a structure transformation which begins at the edge
of the fuel pellet and steadily progresses to its centre as the irradiation proceeds
[Matzke and Spino, 1997] [Spino and Papaioannou, 2000]. The original microstructure
transforms into a nc-porous matrix [Nogita and Une, 1994] through restructuring of
the accumulated irradiation defects. This is a sort of “self-healing” action where the
material gets cured from damage by reordering itself [Spino et al., 2012]. Fig. 1.4
shows two ceramographs of different fuel zones at increasing local BU and where the
mentioned change in the structure is clearly appreciated. The new nc-structure appearing (Fig. 1.4-right-micrograph) is called high burn-up structure (HBS). It is called also
rim-structure because in UO2 fuels it initiates at the rim or outer zones (r/R>0.98) of
the pellets (colder periphery of the pellet; Fig. 1.4-right). This happens because the rim
is the region which receives the highest dose (the most fissions) and therefore is exposed
to highest local increase of BU (∼70 GWd/tM in the third cycle, at temperatures
rarely exceeding 800°C [Sonoda et al., 2002]), and so the highest radiation damage, too.
! " $# $
"!$" $
P<4% (GAS PERMEABLE )
~P=15-20% (GAS TIGHT); CLOSED POROSITY
67 GWd/tM
~160 GWd/tM
r/ro=0.80
1 µm
r/ro=0.98
1 µm
Figure 1.4: Micrographs at different pellet radius areas [Spino and Papaioannou, 2008]. High
burn-up structure (HBS or rim-structure) transformation [The energy net, 2012].
Most of the properties observed in the HBS, resemble those seen in the nanomaterial’s structures. Likewise heavily cold worked metals which after severe plastic
deformation show grains in the nm-size range [Villegas and Shaw, 2009], the heavily
damaged high-BU fuel region at the rim of the pellets display a profound modification
of the microstructure on exceeding a critical dose. After this threshold, the original
nuclear fuel with large-grains (10-20 μm) suffers progressively grain subdivision
(low-angle sub-grain formation or low coordination number) and recrystallization
(high-angle sub-grain formation or high coordination number) changes (Fig. 1.5) at the
end of which a new structure (the HBS) with uniformly nm-sized grains (100-250 nm)
appears [Spino et al., 2012]. This transformation to a structure with nm-grains at the
edge (rim) of the pellet results in lattice contraction [Spino and Papaioannou, 2000].
Furthermore, formation of new 1 μm-sized pores embedded in the matrix (Fig. 1.5)
occurs, which entraps most of the created fission gas [Spino et al., 1996]. This porosity
can reach values above 20%.
At the beginning it was thought that the HBS could be responsible for cladding
failures due to additional in-pile volume increase (swelling), which, in addition to
4
1.1. Background and state of the art.
100 nm
$ #
Xe
#
%
52 GWd/tM – 500 °C
Figure 1.5: Coordination state change in the transformation to the HBS (or rim-structure).
the supposed brittle behaviour of the transformed material [Matzke, 1992], lead to
proposals of pellet-design changes to counteract the transformation [Swam, 1997]
[Tulenko and Wang, 2008]. Also, it was thought that the rim-structure could act
as a new source of gas release. In fact, one could think that the larger the grains
(e.g. 10-20 μm, as in the original fuel or the fuel with lower high-BUs), the longer
the pathways for the fission gases towards the grain boundaries and the exterior,
and consequently, the more generally improved fission gas retention behaviour in
comparison with the small grains of the HBS (0.2 μm grains). Indeed, there are still
investigation lines which defend this opinion.
However, other studies found that the percentage of gas liberated from the rim
of the fuel pellets, where the HBS appeared, was low in comparison with the gas
coming from the inner parts of the pellet where the original larger-grain structure
is still present [Mogensen et al., 1999]. This philosophy has been followed by other
publications, which demonstrates a generally beneficial evolution of the fuel properties,
as in particular the retention of the fission gases, after the structure transformation
[Rondinella and Wiss, 2010], [Spino et al., 2012]. Specifically, it has been observed
that the HBS does not develop an open pore structure with interconnected channels,
even at higher porosities [Noirot et al., 2008].
In fact, it has been seen that structures with large grains (10-20 μm) and with
1 μm pores and porosities below 4% (in the original fuel and the fuels with low
BUs; Fig. 1.4-left), are permeable to the flow of gases. In contrast, the rim-structure
with small grains (100-250 nm) and with 1 μm pores and 20% porosity (Fig. 1.4right), was suggested to remain gas tightly because of the formed closed porosity
[Spino et al., 2004] [Hiernaut et al., 2008]. Moreover the larged-grained structures are
found to retain large amount of dislocation loops and gas bubbles inside the grains,
which diminishes the mechanical properties (creep strain), increasing the risk of
5
Chapter 1. Introduction
Figure 1.6: SEM micrographs of a fuel pellet at high-BU from the outer radius or rim (HBS
in the first micrograph) to inner radial positions from [Manzel and Walker, 2002].
PCMI. In contrast, the small-grained structures with their high-angle sub-grain (high
coordination state; Fig. 1.5) facilitating the GBs sliding deformation mechanisms,
show improvement of the plasticity and creep strain, diminishing the PCMI-failure
risks [Chung and Davies, 1979] [Spino et al., 2008].
Besides that, the properties of the HBS indicate an enhanced radiation tolerance as
reported by [Spino et al., 2012]. This study coincided with important evidence in the
literature that nano-grained materials are more resilient to radiation damage than the
corresponding large-grained materials due to defect recombination at their multiple
grain boundaries has been reported by [Nita et al., 2005]. Also improvement of the
thermal conductivity and other radiation-defects depending properties was found due
to lattice-strain release after recrystallization [Ronchi et al., 2004], as well as fracture
toughness increase and crack-healing tendency were anticipated [Spino et al., 2003].
Moreover, in relation to safety issues, the latest experiments on the high BU LWR
fuels indicated no increase in the gas release and in the failure susceptibility during reactivity initiated accident (RIA) transients [Sasajima et al., 2010] [Fuketa et al., 2006].
Also diminution of the aqueous corrosion rate under simulated geologic repository conditions for fuels containing HBS was found out [Ekeroth et al., 2009] [Carbol et al., 2009].
Both facts confirmed the tightness of the structure.
So it has been demonstrated that the HBS has exceptional qualities even in
comparison with the original matrix (large-grain structure), with a number of improved
properties that are really advantageous for a fuel. Then, why not imitate this recrys6
1.1. Background and state of the art.
tallized material?. And why not imitate the structure appearing in the rim (HBS) and
introduce it in this form as a fresh fuel inside the reactor?. Why not synthesise a fuel
matrix like this HBS, which due to its apparent damage-resilience would withstand
longer times under irradiation?.
This is a radical step in nuclear fuel conception, hitherto not considered, since, as
indicated before, the general thinking of the industry (fuel providers and utilities) was
until now just the contrary one, i.e. trying to make larger and larger grains, under
the premise to improve only one aspect of the fuel performance, namely the fission-gas
release under steady state conditions, disregarding the implied worsening of the fuel
plasticity due to grain-size increase, and also its poorer behaviour under power-ramps.
7
&(*
&(''#)+'
"$%
"$%
Figure 1.7: A novel fuel microstructure: nc-UO2 [The energy net, 2012].
On the contrary, apart from its still unproven improved resistance against radiationdamage (e.g. reduced swelling), the principal virtues of nc-fuels in-pile compared to
conventional fuels will be the faster relaxation of PCI stresses through the higher
plasticity induced by grain-refinement, plus the possibility of retention of most fission
gases in formed closed pores. As a potential technological application, and as inspired
in the behaviour of HBS-material in pile, the nc-fuel could retain fission gases inside
the pores up to very high-BUs (>300 GWd/tM). Up to these BUs values, the porosity
could increase up to 30%, until incipient pore interconnection would first begin
[Konings et al., 2011].
The main aim here is thence to synthesise nc-UO2 powders for the manufacture
of bulk nc-fuel compounds for the characterization of their out-of-pile mechanical
properties and irradiation behaviour. The produced monolithic pieces would have a
volume of approximately 1 cm3 , with a uniform grain size between 100 and 250 nm to
mimic the rim-structure.
The first question which appears is how to obtain enough amount of nc-UO2 powder
for fabrication trials of bulk-pieces, when the known methods of nanoparticle synthesis
are generally tuned to yield just small amounts of material (mg range), primarily
7
Chapter 1. Introduction
dedicated to analytical or research uses [Rousseau et al., 2002] [Mennecart et al., 2004]
[Wu et al., 2006] [Rousseau et al., 2006] [Opel et al., 2007] [Rousseau et al., 2009].
The second important interrogate that arises then is how to obtain thereof dense
large monoliths with uniform grain size around 200 nm, when the achievement of bulk
nc-bodies is today one of the most demanding challenges in nanotechnology.
The traditional methods for the production of UO2 are based on the precipitation
of UV I salt from liquid solutions. Then the precipitated material is oxidised to U3 O8
by oxidative thermal treatment and afterwards the conversion to UO2 (UIV ) is reached
by a second heat treatment under reducing conditions (800°C under Ar/H2 ). All these
processes together provide a powder material which is further conditioned by different
physical-chemical/mechanical methods to give a compositionally stable (in air) and
free-flowing agglomerate, suitable to be compacted by standard powder metallurgy
techniques (basically uniaxial-bidirectional pressing). The standard characteristics
of commercial “ready-to-press“ UO2 -powders have a UO2.1 composition, agglomerate
particle size 20-40 μm and crystallite size 200-500 nm. After pressing to desired
geometry, final sintering of the compact (1600°C during 16 h) is necessary to get
the desired density, of 95 to 98% of the theoretical density (TDU O2 =10.96 g/cm3 ).
However, the final grain size obtained by this conventional material synthesis route is
in the range of 5-10 μm, which is far above the goal here (100-250 nm).
1.2
Goal of the thesis.
The main goal in the present work was to develop an accessible route to produce
defect-free nc-UO2 -based monolithic ceramic specimens with tailored grain/pore
microstructure. The target configuration consisted of a dense, uniform matrix with
100-250 nm sized grains with porosity levels of 10 to 20% to reproduce out-of-pile the
properties of the HBS material, using similar methods as utilized in the previously
studied case of nc-Y-ZrO2 [Santa-Cruz, 2009]. Once this goal was accomplished, a
study to determine their physical-chemical properties and their damage resistance in
comparison with micron-grained materials was performed.
The creation of the above novel fuel microstructure has been achieved in this work
by passing through very different steps. From the material synthesis to the fuel pellet
manufacture, many individual process stages, previously unknown or unexplored, had
to be specifically developed and/or optimized. Hence, regarding the initial powder,
considerable work was devoted to the development of two different chemical synthesis
routes leading to deflocculated nc-UO2 and nc-ThO2 precipitates. ThO2 is similar in
structure to UO2 but has the advantage of a single valency (i.e. IV ).
Although much information can be found about nano-chemistry and actinideschemistry, not very much information on the synthesis of nanoparticles with actinides
compounds is available. The objective of the few reported works is, in the majority
of cases, concerned with the issue of radionuclide release control during spent fuel
geological disposal, namely the ultimate dissolution/re-precipitation of actinides in a
in a fractured geological repository, by non-excludable contact of damaged spent fuels
with water [Rousseau et al., 2002], [O’Loughlin et al., 2003]. The target in these cases
is to examine the radiological hazards which could emerge from these situations and
to quantify the effect of radioactivity release (and potential environment contamina8
1.2. Goal of the thesis.
tion) on possible long-term permanence of spent fuels in contact with groundwater
[Mennecart et al., 2004], [Rousseau et al., 2006]. Also the study of the elementary
oxidation mechanisms occurring on an atomic scale on fuel/water contact during
spent fuel storage has been performed with actinide oxide colloids [Opel et al., 2007],
[Rousseau et al., 2009]. Other nanostructures based on uranium oxides have been
used for catalytic purposes [Wang et al., 2008]. In other cases, the possible study
of size-dependent physical and chemical properties has motivated the synthesis of
high-quality colloidial of UO2 [Wu et al., 2006].
Despite that, no publications of the above describe the production of nc-actinides
other than as in the very small quantities needed for research or analytical studies.
Although enough for these purposes, no monolith ceramic as desired in this work could
be achieved with such (small) amounts of material. For the mimicking of the HBS
nc-microstructure in whole UO2 -pellet between 0.5 and 1.0 g of nc-UO2 powder are
needed. Therefore, a method with a definitely higher material’s yield must be developed.
In the present work, two of the above reported methods for the synthesis the
nc-UO2 were chosen and developed as a source for the nc-powder needed to perform
the described monoliths. In Chap. 3 the first one is described. This is a controlled
precipitation method that uses an electrolytically reduced aqueous solution of uranyl
nitrate as precursor and dropped NaOH-solution as alkalinisation agent to trigger
the precipitation of the nc-material in the vicinity of the U4+ solubility line, which
was originally described in [Rousseau et al., 2002], [Rousseau et al., 2006]. The second
method, described in Chap. 4, is a thermal decomposition of an organic phase
containing uranyl acetylacetonate (UAA) as precursor, which is added to a mixture of
oleic acid and oleylamine which is then heated as a whole up to temperatures around
300°C to induce the precipitation of UO2 nanoparticles by thermal decomposition of
the UAA. This original procedure was described in [Wu et al., 2006]. To obtain larger
amounts of nc-UO2 as required, both methods were conveniently adjusted, developed
and scaled-up according to the aim needs. The material in the as-produced condition
was studied by TEM and XRD. Crystallization and grain-growth kinetics of the
synthesized powders as a function of the temperature and time, as well as structure
characterization at the different temperatures, follow in Chap. 5 and Chap. 6, for the
aqueous controlled precipitation and the organic precipitation, respectively. Tools such
as TGA/DTA, XRD, HT-XRD, TEM, NMR, IR and XANES/EXAFS were used for
this purpose. The results on thermally treated powders provided useful information for
the selection of ideal sintering conditions for the posterior synthesis nc-monoliths. In
Chap. 7 the consolidation of the green monoliths, as well as different thermal routines
for the drying and sintering steps, which represent a challenge for the achievement of
crack-free dense specimens, were explored. Optical, mechanical and thermophysical
characterization of the sintered bodies followed to verify their aptitude to meet nuclear
reactor fuel specifications. Characterization techniques as SEM, indentation, HP-XRD,
SAM, thermal diffusivity and melting point were used. Chap. 8 summarizes the
discussions of the different chapters in a final conclusion of the overall results. Finally
Chap. 9 concentrates different future recommendations for the project. Some of them
have been already initiated during the thesis and presented here, e.g., alternatives for
monoliths compaction, study of nc-UO2 magnetic properties and out-of-pile simulation
experiments.
9
Chapter 1. Introduction
10
Chapter 2
Analytical and characterization
techniques
2.1
Electrochemical analysis
The instrument used was a SP-50 voltammeter from BioLogic Science Instruments
(working ranges 2.8-10 V and 10 μA - 400 mA).
2.1.1
Cyclic Voltammetry (CV)
A three electrode system configuration was utilized. A working electrode (~1 mm thick
rod in spiral form, composition Pt/Ir 90/10% metal from Heraeus and Fisher type
with introduced area=1.885 cm2 Fig. 2.1a), an auxiliary or counting electrode (net,
composition Pt/Ir 90/10% metal from Heraeus and Fisher type with 0.12 mm net-wire
thickness, 38 mm in diameter and 50 mm in height Fig. 2.1a), and a reference electrode
(Ag/AgCl InLab® Reference saturated from Mettler Toledo). A 150 mL glass-reactor
built for these experiments was also used (Fig. 2.1b).
(a) Net, spiral, frit
(b) Reactor
Figure 2.1: Cyclic voltammetry experimental arrangement.
In a cyclic voltammetry (CV) analysis, the current density i (mA/cm2 ) is plotted
versus the applied voltage or potential E (V). Where i is the intensity or current at the
11
Chapter 2. Analytical and characterization techniques
working electrode I (A), divided by the area of the working electrode (spiral) introduced in the solution. The conductivity of the solution supported by the addition of an
electrolyte solution (NaCl, HCl). For comparison, the different cyclic voltammogram
scans should be performed with the same immersed area of the working electrode.
The scan of current density vs. voltage produces a peak for any component in the
solution that is reduced/oxidized (depending on the initial scan direction) throughout
the range of potentials scanned. The current increases as the potential reaches the
corresponding values for the reduction of the different species present in solution,
and that are redox active, inside the potential window. But then falls off as the
concentration of the system is depleted close to the electrode surface.
The redox reaction U O22+ + 4H + + 2e− ←→ U 4+ + 2H2 O occurs at the working
electrode (spiral). The potential was measured between the reference electrode and
the working electrode. The current applied by the potentiostat was measured between
the working electrode and the counter electrode (net).
2.1.2
Electrolysis
In the electrochemical reduction the potential is measured between the reference electrode (Ag/AgCl saturated) and the working electrode (net). The current applied by the
potentiostat is measured between the working electrode (net) and the counter electrode
(spiral). The expected cell reactions during electrochemical reduction of UV I are for
the cathode (or working electrode):
U O22+ + 4H + + 2e− ←→ U 4+ + 2H2 O
(2.1)
and for the anode (or counting electrode),
2H2 O ←→ 4H + + 4e− + O2
(2.2)
providing the global reaction,
2U O22+ + 4H + ←→ O2 + 2H2 O + 2U 4+
(2.3)
The intensity passing across the solution was plotted as a function of the time and
the real charge (Qreal ) passed across the solution was then calculated as:
Q = I ·t
(2.4)
where
I= current in amperes (A)
t = time in seconds (s)
+4
species, was
The theoretical charge (Qtheoretical ) required to reduce the UO2+
2 /U
calculated as,
Q = F · n(e− )
where
12
(2.5)
2.2. Spectroscopy
Q = Charge in coulombs (C)
F = Faraday constant = 96500 C · mol−1
n(e− ) = moles of electrons = 2 · n(e− )U O2+ (from Eq. 2.1)
2
where n(e− )U O2+ corresponds to the number of moles of U present in the initial
2
solution.
The conversion rate as a function of time was controlled by monitoring the charge
+4
passed across the solution and by the decrease of the intensity of the peak UO2+
2 /U ,
which is proportional to the presence of UV I in the liquid, in the different CV measurements done while running the experiment. The corresponding expressions are:
Conversion rate =
I
dC
=
f
lux
=
n(e− ) · F
dt
Conversion rate (%) =
Qreal
Qtheoretical
Conversion rate (%) =
· 100 (%)
(i0 − i)
· 100 (%)
i0
(2.6)
(2.7)
(2.8)
where
Qreal = Charge in coulombs (C) applied to the solution.
Qtheoretical = Charge in coulombs (C) theoretically necessary to be applied to reduce
the U-moles added to the solution.
+4
peak observed in the CV run before the
i0 = current intensity of the UO2+
2 /U
beginning of the electrochemical reduction.
+4
peak observed in the CV at each time during
i = current intensity of the UO2+
2 /U
the electrochemical reduction.
2.2
2.2.1
Spectroscopy
Ultraviolet-visible spectroscopy (UV-Vis)
The UV-Vis absorption spectres were recorded using a Lambda 9 UV-Vis/NIR
spectrophotometer (Perkin Elmer) in the wavelength range from 360-470 nm with a
scan speed of 15 nm/min (slit width 0.5 nm).
The ultraviolet-visible spectroscopy (UV-Vis) uses light in the range close to UV
and near infrared (NIR). The absorption in the UV range is directly dependent with
the solution color changes, and therefore with the presence amount of one or other ion.
13
Chapter 2. Analytical and characterization techniques
2.2.2
Dynamic Light Scattering (DLS)
Dynamic Light Scattering (DLS) (also known as Photon Correlation Spectroscopy
(PCS)) measures Brownian motion and relates this to the size of the particles. It does
this by illuminating the particles with a laser and analysing the intensity fluctuations
in the scattered light.
A Nano ZS system from Malvern with working ranges 0.3 nm to 5 μm, has been
used to measure the rate of the intensity fluctuation and then to calculate the size of
the particles. A quartz cell was used to performance the measurement.
2.2.3
X-ray Absorption Near Edge Structure (XANES) and
Extended X-ray Absorption Fine Structure (EXAFS)
Bulk-XAS data at the U-L3 and Th-L3 edges were collected at the INE Beamline at
the Ångströmquelle Karlsruhe (ANKA) [Brendebach et al., 2007] [Rothe et al., 2012].
The beamline is equipped with a Ge(422) double-crystal monochromator coupled to
collimating and focusing rhodium-coated mirrors was used. The monochromator angle
was calibrated in transmission mode for the U-L3 and Th-L3 edges by assigning the
energy of 17038 eV to the first inflection point of the K-edge absorption spectrum
of yttrium metal foil. For each X-ray absorption near-edge structure (XANES)
measurement, the spectra of the reference foil was systematically collected at the same
time. All measurements were recorded at room temperature in transmission mode
using argon filled ionization chambers at one bar pressure. The E0 values at the
absorption edge were taken at the first inflection point using the first zero-crossing
value of the second derivative. The energy of white-line (WL) maximum at the edge
was selected using the first zero-crossing of the first derivative. Several acquisitions
(four to six spectra depending on the edge) were performed on the same sample to
improve the signal-to-noise ratio. To determine the oxidation states of U in the studied
samples, XANES spectra at L3 edge of reference materials were collected during the
same experimental run using the same experimental arrangement. UO2 and ThO2
were used as reference for the IV -valence of U and Th, respectively. In addition, the
extended X-ray absorption fine structure (EXAFS) measurements of UO2 was analysed
to ensure that stoichiometric compounds were obtained. The valence of U and the
corresponding molar fractions of UIV , UV and UV I were determined according to a
linear combination of UO2 (pure UIV ), U4 O9 (mixture of UIV and UV ) and U3 O8
(mixture of UIV and UV I ). The energy position of the absorption edge of an U-L3
edge XANES spectrum is directly related to the chemical state of U. Therefore, the U
oxidation state can be estimated by comparison of an “unknown” spectrum with a set
of spectra of suitable reference compounds.
All EXAFS spectra oscillations were extracted from raw absorption
data with the ATHENA interface of the IFFEFIT software [Newville, 2001]
[Ravel and Newville, 2005]. Experimental EXAFS spectra were Fourier-transformed
using a Hanning window over the full k-range available at the respective edges. The
FT peaks of interest were selected and fitted in reciprocal space with the ARTEMIS
interface of the IFFEFIT software [Ravel and Newville, 2005]. Amplitude and phase
shifts functions were calculated using FEFF 8.40 [Rehr et al., 1998]. Spherical 7.5 Å
clusters of atoms built using the UO2 fluorite-type structure (space group Fm-3m)
were used for FEFF calculations. This symmetry can be described as a simple cubic
14
2.2. Spectroscopy
packing of anions with cations in the cubic (eight-coordinate) holes. Thus, the U
cations are surrounded by shells of 8 O anions, 12 U cations and 24 O anions. For each
shell, the coordination numbers were fixed to these theoretical values and were fitted
separately. Considering the negligible difference in the calculated amplitude and phase
shifts, cation-cation shells were modelled using one metallic backscattering element. In
addition, the multiple-scattering paths were also considered in the FEFF calculations.
The amplitude factor (S02 ) was set at 0.90 for the U shell. The shift in the threshold
energy (ΔE0 ) was varied as a global parameter.
The U in this study were derived from existing stocks of uranyl nitrate powder (for
the synthesis of nc-UO2 by the aqueous route Chap. 3) and from commercial UAA,
ThAA and ThA powder (for the organic route Chap. 4). Sample preparation involved
crushing of nanocrystalline UO2 , blending it with MgO as a support matrix, and
compaction of the mixture into a disk for X-ray absorption measurements. The disk
was mounted in a special holder, and double-sealing it by means of two polyethylene
bags. Sample integrity and homogeneity were checked prior to shipment using
X-ray radiography. UO2 and ThO2 μm size were used as reference samples for the
measurements. The reference UO2 was thermally treated at 1600°C under Ar/5%H2
for 6 hours to provide an oxygen/metal ratio (O/M) of 2.00.
2.2.4
Nuclear Magnetic Resonance spectroscopy (NMR)
Solid-state Nuclear Magnetic Resonance (NMR) is a very efficient probe of the local
environment in materials. This technique is based on the analysis of the nuclear spin.
To obtain high resolution spectra, the sample is spun at an angle of 54.74° with respect
to the static magnetic field. This technique is named magic angle spinning (MAS).
For the study of our uranium dioxides, 17 O is the only nucleus which can be detected.
As its natural abundance is of 0.038% an enrichment of the samples is required. A
synthesis of nc-UO2 by controlled precipitation following the method described in
Chap. 3 in 17 O 10% enriched aqueous phase was performed. To achieve that, 5 mL
of water enriched at 90% with 17 O was added to the initial UO2 (NO3 )2 -solution. The
total U concentration in solution was smaller (0.19 M) as the one used in a normal
process (0.5 M). The objective was just to have enough material (about 2 g of UO2
were obtained) for all the analyses needed, having the maximum concentration in 17 O.
During precipitation of the nc-UO2 by addition of NaOH 3 M solution, the experiment
solution passed from an enrichment of 17 O 11.84% to 17 O 8.74% because of the dilution.
The series of nc-UO2 enriched in 17 O were afterwards annealed at the following
temperatures: 200°C, 600°C, 650°C, 700°C, 800°C and 1200°C. The heating was done
under dry Ar/5%H2 for 15 minutes. As a reference, a standard UO2 (∼ μm crystal size)
sintered at 1600°C under Ar/5%H2 for 6 h and measured during the same campaign,
was used.
All the 17 O experiments were acquired on a 9.4 T Bruker spectrometer using a
1.3 mm probe-head. The 17 O rotor-synchronised Hahn-echo MAS-NMR spectra were
acquired at 55 kHz (typically operating temperature of 40°C). The 17 O peak of a H17
2 O
sample was used as reference and defined as 0 ppm. First and second pulse durations
were set to 3 μs (π/2) and 6 μs (π), respectively, with an echo delay of 2 rotor periods
(9.1 μs). As the longitudinal relaxation time (T1 ) is fast, a recycling delay of 100 ms
was used for all the samples.
15
Chapter 2. Analytical and characterization techniques
2.2.5
Infrared spectroscopy (IR)
Infrared spectroscopy (IR) gives information on the composition and chemical structure
of a component. In this case nc-UO2 samples were analysed. The nc-UO2 synthesized
were annealed at 200°C, 600°C and 1200°C. The heating was done under dry Ar/5%H2
for 15 min. As a reference, a standard UO2 (∼ μm crystal size) sintered at 1600°C
under Ar/5%H2 for 6 h and measured during the same campaign, was used. All the
samples were measured in an Alpha FT-IR Spectrometer from Brucker able to measure
in the spectral range from 375 to 7500 cm−1 .
2.3
2.3.1
Electron microscopy
Scanning Electron Microscopy (SEM)
From the initial samples a small piece was broken (fresh fracture) for microstructure
characterization using scanning electron microscopy (SEM), energy dispersive and
wave length dispersive X-ray analysis (EDX-WDX) and X-ray diffraction (XRD). Some
of the samples were sputtered with gold for SEM-EDX-WDX observations but good
images were obtained without sputtering because the conductivity of UO2 .
The SEM used was a Vega Tescan TS 5130-LSH, 200 eV-30 KeV, with a magnification range of 3-1000000 times and a resolution of 3 nm. The SEM was equipped
with an EDX-detector (10 mm2 , Si(Li), 110 eV-80 KeV, resolution <138 eV) and a
WDX-analyser (4 diffracting crystals = LiF, PET, TAP, LSM80, spectral resolution ≤
2 eV) of Oxford Instruments.
The scanning electron microscope (SEM) used was a Vega Tescan TS 5130-LSH,
200 eV-30 KeV, with a magnification range of 3-1000000 times and a resolution of
3 nm. The SEM was equipped with an EDX-detector (10 mm2 , Si(Li), 110 eV-80 KeV,
resolution <138 eV) and a WDX-analyser (4 diffracting crystals = LiF, PET, TAP,
LSM80, spectral resolution ≤ 2 eV) of Oxford Instruments.
2.3.2
Transmission Electron Microscopy (TEM)
The morphologies and dimensions of the samples were revealed by transmission electron
microscope (TEM). The TEM investigations were conducted with a specially modified
FEI Tecnai G2 F20 XT apparatus for the analyses of radioactive materials. This unique
design provides excellent capabilities for the analysis of radioactive specimens. The
TEM is operating at 200 kV and equipped with a Gatan GIF Triedem, an additional
Gatan slow scan camera and an EDAX EDS Genesis System. A beryllium window
is used to protect the EDS detector against alpha radiation. To avoid radioactive
contamination during the sample transfer, a glove box with controlled atmosphere was
mounted around the measuring unit (FEI CompuStage).
The specimens for TEM imaging were prepared by suspending the solid particles
in ethanol or hexane (depending on the sample), with the suspension being placed in
16
2.4. X-ray scattering
an ultrasonic bath and sonicated agitated for 15 min. A drop of the well dispersed
suspension was loaded on a carbon coated 200 mesh copper grid, which was dried
under ambient conditions, before the grid was placed on the sample holder of the
microscope. TEM techniques provide direct information on both size and shape of
the nanoparticles and at the same time the structure of the single particles can be
determined.
2.4
X-ray scattering
The average crystallite size, lattice parameter and micro-strain of the different powder
analysed, have been determined by the X-ray diffraction (XRD) Rietveld refinement of
the Bragg peaks with the HighScore Plus software [HSP-PAN, 2011], and used also to
characterize the microstructure of the material. This analysis is based on the change
of the profile parameters, compared to a standard sample. Those are depending on the
instrument settings used for data collection and on the profile function used for the
refinement [HSP-PAN, 2011]. A peak shape described by a Pseudo-Voigt function has
been used for the microstructural refinement. The shape and width of the diffraction
peak are a convolution of the instrumental broadening and the sample broadening. In
general, data were taken at steps of 0.0146° in 2θ (θ = diffraction angle) with counting
steps of 2 s, in the range 2θ = 10°-120°.
D=
180
λ
π (W − Wstd )0.5
(2.9)
where D is the crystallite size, λ is the wavelength of the radiation and W parameter
contains the information about the size broadening.
e=
[(U − Ustd ) − (W − Wstd )]0.5
1 180
· 4 · (2 · Ln2)0.5
100 π
(2.10)
where e is the micro-strain and U parameter contains the information about the
strain broadening.
2.4.1
Room Temperature X-Ray Diffraction (RT-XRD)
The XRD measurements were performed with a θ-2θ diffractometer D8 (Bruker AXS,
Karlsruhe) operating in the Bragg-Brentano mode, with a Ge monochomator and a
Cu-Kα1 source (λ=0.15406 nm). The calibration (alignment and zero position checks)
of the device was done with reference material LaB6 (lanthanum hexaboride). The
samples analysed were loaded on a flat specimen-holder of Si-911-crystal providing
low background, which was continuously rotated during the measurements for better
particle statistics.
2.4.2
High Temperaure X-Ray Diffraction (HT-XRD)
In situ HT-XRD patterns were acquired with a Bruker D8 powder diffractometer
mounted in a Bragg-Brentano configuration, with a curved Ge monochromator [111],
17
Chapter 2. Analytical and characterization techniques
a Cu X-ray tube (40 kV, 40 mA), and a Position Sensitive detector Braun covering an angular range of 6°(2θ) and an Anton Paar HTK2000 heating chamber. The
alignment of the machine is done with reference material MgO at different temperatures.
2.5
Thermogravimetry/Differential Thermal Analysis (TGA/DTA)
Thermogravimetric analysis for the determination of mass changes and decomposition
temperatures were carried out with a simultaneous thermogravimetry differential
thermal analysis (TGA-DTA) system (NETZSCH Simultaneous Analyzer STA 449
Jupiter). For the tests Al2 O3 crucibles were employed. For the correction of the
gas buoyancy effect, base lines were measured with empty crucibles using the same
experimental conditions as for the investigated samples.
2.6
Dilatometry
The sintering behaviour of green monoliths was determined by differential dilatometry
with a Bähr Thermoanalyse DIL-802 S. The length change of the monolith was
measured as a function of temperature relative to the length changes of a parallel
reference sample (polycrystalline Al2 O3 ) with similar dimensions.
2.7
2.7.1
Mechanical Characterization
Microindentation
The microindentations were performed with a Frank-Finotest hardness-tester according
to the standard methods for advanced ceramics, ASTM C1327 for Vickers indentation
hardness and ASTM C1326 for Knoop indentation hardness. The form of the these
typical indenters is shown in Fig. 7.24. Loads of 1.96 N, 4.90 N and 9.80 N were
applied for 15 seconds. For comparison an instrumented microindenter developed in
ITU, was also used. In this case, loads of 0.49 N, 0.98 N, 1.96 N, 4.90 N and 9.80 N
were applied also for 15 seconds. The acquisition of test data points was at room
temperature. At least 3 to 5 different indentations (at different locations throughout
the sample) were performed for each load applied and the average value taken for the
calculations. Minimum distances between indentations were respected following the
respective ASTM methods. Random representative areas of the material were always
taken for the tests.
The samples were embedded in hard epoxy-resin, followed by grinding and polishing
of the test surface. Special holders with two-sides plane-parallel geometry were used
to ensure the perpendicularity of the indenter to the sample and, surface and in
consequence, symmetrical indentations. Grinding of the samples was carried out with
SiC paper (600 to 1200 mesh), as well as a final polishing with diamond suspensions
was done, reducing progressively the particle size from 15 μm to 1 μm. A fine polishing
was needed to achieve a perfect flat mirror surface and to avoid the addition of errors in
18
2.8. Thermophysical characterization
the determination of the indentation lengths due to surface roughness and imperfections.
2.7.2
High Pressure X-Ray Diffraction (HP-XRD)
The compressibility study of the different nano-sized UO2 was performed by means of
in-situ X-ray diffraction (XRD). The samples were loaded in a Diacell-type membrane
diamond anvil cell with 500 μm culet size using pre-indented Re gaskets with 200 μm
diameter holes. Pressure was determined using the ruby scale [Piermarini et al., 1975]
and Cu equation of state (Cu-EOS). Silicone oil was used as pressure transmitting
medium. High pressure X-ray diffraction (HP-XRD) was performed using a modified
Bruker D8 x-ray diffractometer with focusing mirror optics installed on a molybdenum
rotating anode source (Mo Kα1 =0.70926 Å), coupled with a Bruker SMART Apex
II Charged-Coupled Device (CCD). The recorded diffraction images were integrated
using the ESRF FIT2D software [Rodríguez-Carvajal, 1993].
2.7.3
Scanning Acoustic Microscopy (SAM)
The scanning acoustic microscopy were performed in a collaboration with the group
of Prof. Laux as part of a collaboration with IES (Institut d’Electronique du Sud) at
University of Montpellier with an acoustic microscope in ITU developed (Fig. 2.2).
The device includes a translation stage, micrometric motors, echographic bench, and
acoustic focused sensors with spherical lens with an aperture angle of 50°. The samples
should have a thickness of about 1 mm. Afterwards the samples are embedded in
a resin and polished to obtain a smooth surface. The sample is introduced in an
aluminium basked and methanol coupling liquid is poured until the embedded sample
is completely submerged. After horizontal alignment with two adjusting screws the
acoustic sensor is lowered avoiding to trap any air bubble which could lead to false
readings. The sensor is further lowered until a few μm distance from the sample and
defocusing is started in order to get an acoustic image. The signal from the sensor is
converted to an optical signal to be displayed on a computer screen.
2.8
2.8.1
Thermophysical characterization
Thermal Diffusivity
The measurements of the thermal diffusivity are performed in a laser-flash device
(LAF I) [Ronchi et al., 1999] inside a lead-shielded glove box with remote manipulators.
The sample is heated up (Ar atmosphere of 10−2 mbar) in a high frequency furnace
to the measurement temperature. A laser pulse is applied to one of the surfaces of
the sample. At the opposite surface , the out-temperature perturbation is recorded by
a photo-diode pyrometer (0.05°K sensitivity) with an in ITU developed log-amplifier
with a rise-time of the order of 50 μs. The experimental set-up and the measurement
technique are explained in detail by [Staicu, 2007].
The thermogram is recorded by a 14 bit digitalizer (T = T (t) consisting of several
thousands of points) and is analysed by a realistic and accurate mathematical model
of the pulse propagation in the sample. The thermal diffusivity and heat losses are
19
Chapter 2. Analytical and characterization techniques
(a)
(b)
Figure 2.2: Overview of the acoustic microscope (in ITU developed) device showing acoustic
sensors, coupling liquid holder, sample platform and translation stages.
calculated by a numerical fitting method. Correct measurements of thermal diffusivity
can be obtained even with samples of small sizes and irregular contours, due to the
highly homogeneous probe laser-beam. The precision of the individual measurements
is better than 1%. Nevertheless, the accuracy of the measured thermal diffusivity
is lower than the precision of the method, being principally determined by sample
thickness variations.
2.8.2
Melting Point
Same conditions as described in [Cappia et al., 2013] were used. A schematic of the
laser heating experimental set-up can be also there seen and here reproduced (Fig. 2.3).
The sample is introduced in an autoclave under controlled atmosphere and heated by
a 4.5 kW cw Nd:YAG TRUMPF laser. The power in function of the time profile
is programmable with a resolution of 1 ms. The onset of melting is detected by the
appearance of vibrations in the signal of a probe Ar+ laser reflected by the sample
surface (reflected light signal technique) [Manara et al., 2008]. The cooling of the
sample occurs when the laser beam is switched off. Thermal arrests corresponding to
solidification can then be observed on the thermograms recorded by fast pyrometers.
These operate in the visible-near infrared range between 488 nm and 900 nm. The
reference pyrometer wavelength is here 655 nm. This was calibrated according to the
procedure reported in [Manara et al., 2008] [Böhler et al., 2012]. A dense sample of
at least several microns in thickness are needed in order that the measurement is not
influenced by the sample support. The normal spectral emissivity of urania has been
assumed to be equal to 0.83 [Manara et al., 2005] [Cappia et al., 2013]. In Fig. 2.4 a
picture of the sample melting point set-up, is shown.
20
2.8. Thermophysical characterization
Figure 2.3: Laser heating experimental set-up [Cappia et al., 2013].
Figure 2.4: Sample melting point setup. In the yellow area, the nc-UO2 pellet hold with three
screws is observable.
21
Chapter 2. Analytical and characterization techniques
22
Chapter 3
Synthesis of nc-UO2 by controlled
massive precipitation in Aqueous
phase
3.1
3.1.1
Introduction and principles.
U-stability: environmental studies.
The control of used and present uranium mines, spent nuclear fuels and waste
repositories installations is an ongoing subject. Related to the surveillance of these
sites, the understanding of the dissolution/re-precipitation and transport behaviour of
different radionuclides at different pH in aqueous media is essential to the avoidance of
the contamination of the groundwater [Ryan and Rai, 1983]. The behaviour in water
of U in its various forms, particularly as UO2 in crystalline and amorphous states,
needs to be understood. In the case of reducing conditions the disposal is facilitated
by immobilization of the soluble UV I species by its reduction and precipitation as
insoluble UIV in form of UO2 , and posterior removal after localization from the aqueous
media [Lovley and Phillips, 1992].
The increase in the solubility and mobility of UIV or UV I species due to
complexation with chloride [Hennig et al., 2005], carbonate [Suzuki et al., 2006] or
sulphate [Hennig et al., 2007] anions, constitutes also a subject of attention for
radiological issues. The possible of oxidative remobilization of the nanometer-sized
precipitates [Suzuki et al., 2002] [Ling et al., 2008] by accidental contact with atmospheric O2 [Zhong et al., 2005] or by radiolytical induced oxidation in water
[Mennecart et al., 2004], is also matter of study.
A variety of parameters influence the systems involving UO2 colloids. In particular, the precipitation/solubility of U colloids in aqueous media is affected by
two issues. The trend to oxidation from UIV to UV I , as well as the hydrolysis of
UIV at very low pH (pH∼1) by complexation of U 4+ into Um (OH)(4m−n)
in solution
n
4+
(4m−n)
+
(mU + nH2 O ←→ Um (OH)n
+ nH ) [Neck and Kim, 2001]. The presence of
the colloids in solution is also function of the degree of acidity of the media. Finally,
the colloids aggregation state (crystalline, amorphous), also plays a role in their
precipitation/solution trends [Opel et al., 2007] [Rai et al., 2003].
23
Chapter 3. Synthesis of nc-UO2 by controlled massive precipitation in Aqueous phase
3.1.2
U-redox chemistry pertinent to nc-UO2 synthesis.
The precipitation in aqueous media of uranium colloids species at different pHs has
been studied to gain a better understanding of these processes, with the objective
to examine the radiological hazards implied in the deep disposal of radioactive
waste [Rousseau et al., 2002]. The elementary mechanisms occurring on an atomic
scale during fuel oxidation storage have been also studied with actinide colloids
[Opel et al., 2007], [Rousseau et al., 2009].
The calculated equilibrium solubility lines of UIV and UV I species in aqueous solution as a function of pH have been reported by [Neck and Kim, 2001]
[Fanghänel, Th. and Neck, 2002].
A plot of these results as compiled by
[Gil et al., 2010] is shown in (Fig. 3.1). There are several orders of magnitude
difference between the solubility of UIV in presence of its crystalline dioxide phase,
UO2 (c), or in presence of the amorphous form of this phase (hydrated uraninite,
UO2 · xH2 O(am)). Also several orders of magnitude separate the two lasts with the
solubility line of UV I in the presence of the crystalline hydroxide phase schoepite,
UO2 (OH)2 (s) (Fig. 3.1) [Gil et al., 2010]. Also valuable experimental data of the
oxidation state of U in the precipitates and of the size of the corresponding colloids
and their agglomerates, along the solubility line have been reported at different pH
and low U-concentrations [Opel et al., 2007] [Rai et al., 2003] [Fujiwara et al., 2003]
[Fujiwara et al., 2005]. The data show precipitates sizes of UO2 ranging from 8-13 nm
at around pH=1 in the crystalline state, to 80-150 nm at pH>2.5 in the amorphous
state (Fig. 3.1). One can conclude that by provoking the precipitation close to
the UIV solubility line at lowest pH, the smallest and more crystalline form, of the
precipitates can be obtained, avoiding possibly the precipitation of any uranium
hydroxide compound.
According to the hitherto experience, the synthesis of nc-material using this
method results, however, in small quantities of material produced and large
quantities of waste. The concentrations of U per batch were of the order of
10−3 to 10−3 M [Rousseau et al., 2002] [Rousseau et al., 2006] [Opel et al., 2007]
[Rousseau et al., 2009]. A challenge to tackle in this work will be hence to study the
feasibility of this synthesis method for nc-UO2 species, but extrapolated to quantities
of product as high as 1 g per batch or higher so as to be able to produce dense
monoliths with such material.
In
the
publications
of
[Rousseau et al., 2002]
[Rousseau et al., 2006]
[Rousseau et al., 2009], two methodologies to obtain nano-precipitates were used.
Two pH ranges were studied, ≤4 and ≥4, with uranyl nitrate (UO2 (NO3 )2 ) solutions
dissolved in chloride media with U-concentrations of 0.005 M and 0.03 M, respectively. In both intervals, UO2+x precipitates with elementary size 20 nm (without
excluding agglomeration) and O/U ratio ∼ 2.19 were obtained [Suzuki et al., 2006]
[Rousseau et al., 2002]. In the first method, an aliquot of UV I solution was added
to the precipitation reactor where reducing conditions were applied by a galvanostat
(constant intensity) at a fixed pH. The dropped UV I was reduced electrochemically
to UIV at a fixed pH and UO2+x was so precipitated. In the second method used
by these authors, the UV I -solution was first reduced electrolytically to UIV (to avoid
precipitation of UV I compounds which begins at pH≥4) and thereafter it was slowly
dropped into the precipitation vessel under reducing conditions, which were kept
by application of constant potential. Simultaneously, the pH was held constant by
24
3.1. Introduction and principles.
Nanoscale uraninite precipitates (sulphate media)
[Gil et al., 2010], method 3, (pH≈4.5-5)
Nanoscale uraninite precipitates (sulphate media)
[Opel et al., 2007], LIBD, UO2 (c)
[Opel et al., 2007], LIBD, UO2·xH2O (am)
[Rousseau et al., 2002], method I, UO2.19
[Rousseau et al., 2002], method II, UO2.19
Thermodynamic predictions (solubility limits)
[Fanghänel, Th. and Neck, 2002] I=0.5 M
[Fanghänel, Th. and Neck, 2002] I=1 M
[Fanghänel, Th. and Neck, 2002] I=1 M
[Neck and Kim, 2001] I=0.5 M
Nanoscale uranitnite precipitates
Figure 3.1: Theoretical solubility limits of UIV and UV I species in aqueous solutions [Fanghänel, Th. and Neck, 2002] [Neck and Kim, 2001] and experimental determinations for U-sulphate [Gil et al., 2010] and U-chloride solutions [Rousseau et al., 2002]
[Opel et al., 2007]. Compounds shown beside each equilibrium line show the precipitated
solid phase when these conditions are exceeded.
balancing the acidity of the U solution with controlled NaOH additions. Precipitation
occurred thence instantaneously.
An intensive study of the range of U-concentration and acidity for nc-UO2+x
precipitation from electrolytically reduced uranyl nitrate (UO2 (NO3 )2 ) solutions is
hence endeavoured in the present work, using higher concentrations ranges, and
therefore lower pH ranges, following the solubility line of UIV . The use of higher
concentrations and their correspondingly lower precipitation pH range, was already
suggested but not tested by [Opel et al., 2007]. In their perchlorate system, these
authors proposed moving upwards the UIV -precipitation line towards lower pHs as a
means to obtain nano-UO2 precipitates in its crystalline form but upon diminishing
the size of the agglomerates. In the present chapter, the same kind of concept will be
applied.
3.1.3
nc-UO2 synthesis principles.
For the nc-UO2 synthesis by controlled precipitation in aqueous media, the starting
UO2 (NO3 )2 solution was reduced from UV I to UIV , before being precipitated by adding
NaOH to the system. An initial study of the electrochemical reduction by cyclic voltammetry (CV) and an optimization of the different parameters have been also performed.
A typical set-up used for the reduction and controlled precipitation, is shown in Fig. 3.2.
25
Chapter 3. Synthesis of nc-UO2 by controlled massive precipitation in Aqueous phase
It consisted of a glove-box to house the entire configuration under inert atmosphere
and as the first radioprotection barrier for the handling toxic materials. A sevennecked reactor was used where pH-electrode, reference electrode, counter electrode,
working electrode, Ar-flow inlet tube, NaOH dosing tube and out-gas neck, were placed.
#
$
0-
"% &$
0
#&$"
$!&$"
&"$
%%&)*&$&
0.1/02
#$,")!'!&$"
&,"$!&$"
$&
%'$$$
Figure 3.2: General set-up for reduction and controlled precipitation in a aqueous media
method.
A flow chart showing the different steps performed in the process are shown in
Fig. 3.3. The solution containing the U-salt was prepared and the pH was adjusted
by HCl addition. The pH was kept below 1 to avoid hydrolysis of the U4+ cation (see
Sec. 3.1.1) once the reduction of the UV I -solution began.
In a second step, the initial UV I -solution was electrochemically reduced at constant
potential to UIV , keeping the acidity of the solution below the precipitation pH for the
given initial U-concentration in the solution (UIV -solubility line Fig. 3.1). The state of
electrolysis of the solution was controlled by continuous CV-checks, at the time that
UV-vis absorption tests were performed.
After reduction of the solution, precipitation proceeded. Aliquots of NaOH were
added into the solution where a series of stepwise precipitations were carried out. In the
method reported by [Rousseau et al., 2009] the procedure was the other way around.
In that case [Rousseau et al., 2009] aliquots of U-solution (reduced or unreduced
depending on the method used) were added in a solution with higher pH where the
precipitation was immediately taking place. The quantities of material per day and
batch obtained were very small. By changing the procedure, and by increasing at
the same time the U-concentrations in the solution (i.e. with respect to the ones
26
3.2. Mother solution preparation.
used by [Rousseau et al., 2009] and [Gil et al., 2010]), an increase of the yield of the
precipitates was searched.
Black nc-UO2 -precipitates appeared so continuously until no more UIV -cation was
present in the solution. All reduction and precipitation experiments were conducted
under anoxic conditions in a glove-box under N2 atmosphere (oxygen < 0.5%).
Centrifugation of the blackened solution was then performed to collect the precipitates. Removal of the Na+ and Cl− species still present on the surface of the
wet nc-UO2 -precipitates was achieved by repeated washing with deionised water
and sonification. Centrifugation after each washing step was needed to separate the
precipitates from the water containing the dissolved Na+ and Cl− species washed.
In the course of the above experiments, the uranyl containing solutions changed
its colour from yellow-green, characteristic of the uranium nitrate hexahydrate salt, to
green dark colour, once the specie UV I was reduced to UIV . In both cases (oxidised
and reduced), the solution had intense colour but no turbidity was observed. Once the
first aliquots of NaOH were dropped into the reactor, the green coloured transparent
UIV -solution began to acquire turbidity because of the incipient UO2 crystals precipitated. This green-turbid colour changed progressively to black with the following
precipitation (see Fig. 3.3).
The morphology and structure of the obtained nc-UO2 were characterized by means
of Transmission Electron Microscope (TEM) and confirmed by X-Ray Diffraction
(RT-XRD).
&$'%&
$%→
$%
#
# # ##&
&
!
Figure 3.3: Controlled massive precipitation in aqueous phase steps.
3.2
Mother solution preparation.
The mother solution was prepared by dissolution of UO2 (NO3 )2 powder (CAS:
10102-06-4; yellow green crystals; Fig. 3.4) in deionised water by continuous stirring at
80°C to reach a solution concentration of 500 gU/L. This mixture at room temperature
(RT) was diluted in a NaCl 1 M solution to obtain final uranium concentrations in the
27
Chapter 3. Synthesis of nc-UO2 by controlled massive precipitation in Aqueous phase
range 0.02-0.06 M.
Figure 3.4: Uranyl Nitrate molecular structure.
Eventually, uranium concentrations of 0.5 M were used. Increasing the Uconcentration, diminishes the pH at which the UIV -oxide precipitates start to appear
following the UIV solubility line (Fig. 3.1). Therefore for higher U concentrated
solutions, the 1 M NaCl was completely substituted by 1 M HCl to guarantee an
initially sufficiently low pH to avoid any precipitation or hydrolysis of the UIV during
the electrolytic reduction. Deionised water and analytical grade reagents (HCl and
NaOH from Alfa Aesar) were used to prepare the different solutions.
3.3
UIV /UV I cyclic voltammetric and spectrophotometric study.
3.3.1
Cyclic voltammetric study of the mother solution.
3.3.1.1
Experimental arrangement.
The electrochemical reduction characteristics were studied by cyclic voltammetry (CV)
which is a voltamperometric technique. The study of the uranyl ion system under
the influence of different parameters as use of separated compartment for the anode,
different ion concentrations, acidic aqueous media and scan rates, were analysed. The
study was carried out in a glove-box under anoxic conditions (nitrogen atmosphere
with oxygen<0.5%) with a SP-50 voltammeter. A three electrode system configuration
was utilized. A working electrode (spiral), an auxiliary or counting electrode (net)
and a reference electrode (Ag/AgCl saturated). The three electrodes were immersed
in the prepared solution using a 150 mL glass-reactor built for these experiments.
CV-technique description and characteristics of the instrument, as well as the different
electrodes and reactor used, are detailed in Sec. 2.1.
The set-up used was similar to the one shown in Fig. 3.2 but with some minor
changes, which are reflected in Fig. 3.5. In the CV-studies, the net was used as counter
electrode. Otherwise in the reduction of the solution the net was used as a working
electrode. During the CV-studies, the dimensions of the working electrode must be
kept small in order to enhance its tendency to become polarized. However, during
+4
the reduction of the pair UO2+
2 /U , a bigger area of the working electrode is desired
to achieve higher reduction rates. Therefore the use of the net (with bigger surface
compared to the spiral) in the reduction as a working electrode, was preferred over
the spiral one. A separated compartment (12 mm diameter glass tube with frit on the
28
3.3. UIV /UV I cyclic voltammetric and spectrophotometric study.
bottom (see Fig. 3.5) was used in some of the CV-experiments to study its possible
influence (acceleration of the reduction) in the posterior reduction of the solution
(possible increase/diminution of reduction yield).
The solution contained the analyte UO2 (NO3 )2 and an excess of the supporting
electrolyte NaCl. The junction of the electrolyte, solvent and specific working electrode
material determined the range of the potential to be applied. In this case, the
U-analyte was redox active inside the experimental potential window (-0.4 V to +1.4 V
vs. Ag/AgCl saturated).
Figure 3.5: Cyclic voltammetry set-up.
Before beginning the CV analysis, the pH was measured with a pH glass electrode
(iEcotrode Plus Metrohm 3 M KCl) in combination with a Titrando 906 instrument
from Metrohm. Adjustment with HCl 1 M was made to achieve a solution with the
desired pH depending on the experiment. Introduction of inert Ar gas, as well as
stirring of the solution was made before beginning the CV runs during 15 min. The
objective was to achieve the effective removal of the possible O2 traces as well as a
good mixing of the solution. During the CV measurement, the Ar supply and the
stirrer agitation were stopped to avoid mechanical disturbance. For each CV study
performed, new initial solution was used and careful cleaning of the electrodes was
carried out. The Ar gas was passed through a deionised water bottle before entering
into the reactor to avoid the solution to dry.
The potential was scanned as said between -0.4 and +1.4 V vs. Ag/AgCl saturated
reference electrode, using different scan rates depending on the study. In this potential
range, the NaCl (or the HCl) solution itself exhibited so called cathodic and anodic
waves (peak at -0.4 for the reduction of the solvent and peak at +1.4 for the oxidation
29
Chapter 3. Synthesis of nc-UO2 by controlled massive precipitation in Aqueous phase
of the solvent Fig. 3.6).
Figure 3.6: Cyclic voltammogram 0.1 M U and pH 0.5. UO2 (NO3 )2 solution in NaCl 1 M
scanned between -0.4 and +1.4 V vs. Ag/AgCl saturated at a scan rate of 0.1 V/s.
A single cathodic peak (Epc ) was observed between -0.30 and -0.25 V vs. Ag/AgCl
+4
corresponding to the reduction reaction of UO2+
2 /U . The peak intensity is proVI
portional to the amount of U present in the solution. The coupled anodic peak
(Epa ) expected for a reversible two-electron transfer process at 0.12 V was not always
observed (theoretically Ep = Epc − Epa = 0.12 V).
Different experiments were conducted to optimize the conditions necessary to
+4
reduction peak, and to check the influence of the different
observe the UO2+
2 /U
parameters on the system. The use of a separate containment for the anode, different
analyte concentrations and scan rates, as well as different acidity levels of the solution,
were examined.
In first instance, the use of a glass tube with a frit on the bottom (Fig. 3.5) as
a separated compartment for the anode (introduced in the glass tube) during the
reduction step was tested. Having both electrodes in the same bath, as proposed by
[Rousseau et al., 2009] and [Gil et al., 2010], O2 was continuously created inside the
bath which caused species re-oxidation. The objective of the frit was to avoid as much
as possible the passage of O2 produced on the anode electrode, without influencing the
free pass of the electrolyte. In this form, the reduction reaction was expected to be
reinforced in front of the oxidation reaction.
Various porosity-grade (40, 100 and 160 μm) frits were studied but just the most
porous one brought a real advantage with respect to the not use of the frit. For less
porous frits, the reduction yield was slowed because the frit acted not only as a barrier
for O2 but also for the electrolyte. Opposite, with the use of more porous frits, the
U-reduction was speeded in comparison to the case where the both electrodes stayed
30
3.3. UIV /UV I cyclic voltammetric and spectrophotometric study.
nude in the same bath (no use of frit), as free pass of electrolyte was possible but
major pass of O2 was avoided. The time of the reduction reaction was thus notably
decreased.
Figure 3.7: Influence of the frit on the system. Cyclic voltammogram 0.02 M U and pH=3.
UO2 (NO3 )2 solution in NaCl 1 M scanned between -1.0 and +1.2 V vs. Ag/AgCl saturated
at a scan rate of 0.1 V/s.
Figure 3.8: Influence of the concentration on the system. Cyclic voltammogram 0.02 M,
0.04 M and 0.06 M U and pH∼3. UO2 (NO3 )2 solution in NaCl 1 M scanned between -1.0 and
+1.2 V vs. Ag/AgCl saturated at a scan rate of 0.1 V/s.
31
Figure 3.9: Influence of the acidity and scan rate on the system. Cyclic voltammogram 0.02 M U at different pH (1.1, 1.6, 1.8 and 2.2) and rates (0.01,
0.02, 0.05 and 0.1 V/s). UO2 (NO3 )2 solution in NaCl 1 M scanned between -1.0 and +1.2 V vs. Ag/AgCl saturated.
Chapter 3. Synthesis of nc-UO2 by controlled massive precipitation in Aqueous phase
32
3.3. UIV /UV I cyclic voltammetric and spectrophotometric study.
+4
No difficulty in the observation of the UO2+
cathodic peak was hence found
2 /U
when using the frit. In Fig. 3.7 two different experiments are represented using the
same initial solution, i.e. one with and one without the frit (anode and cathode in the
same bath). No difference in the CV plots was observed.
The redox potential in CV studies was scanned between -1.0 and +1.2 V vs.
Ag/AgCl (saturated) at different scan rates (0.01, 0.02, 0.05 and 0.1 V/s) and for
different acidity degrees in the aqueous media (pH 1.1, 1.6, 1.8 and 2.2 Fig. 3.9). The
+4
intensity of the UO2+
2 /U -peak increased with the scan rate making it more at every
pH, making the peak more visible.
+4
The influence of the analyte concentration on the UO2+
peak was also studied.
2 /U
Various experiments with different U-concentrations (0.02 M, 0.04 M and 0.06 M)
in acid conditions were performed and are shown in Fig. 3.8. On increasing the
+4
concentrations of U-analyte, an increase of the redox feature UO2+
was observed.
2 /U
3.3.1.2
Results and discussion.
Based on the CV study of the uranyl ion (analyte) redox reaction under variation of
different parameters, the conditions for the electrochemical reduction of these species
could be defined.
The U-analyte was redox active inside the experimental potential window -0.4 V to
+4
+1.4 V vs. Ag/AgCl saturated. The UO2+
cathodic peak was shown to appear
2 /U
in the range of -0.300 and -0.250 V vs. Ag/AgCl saturated. That is in agreement with
+4
the literature, where the potential necessary to reduce the pair UO2+
is cited as
2 /U
0.280 V [Mikeev, 1989]. Therefore a redox potential of -0.300 V (vs. Ag/AgCl saturated
electrode) was to be applied during the electrolysis, which corresponds to -0.101 V
relative to the standard hydrogen electrode (SHE) (-0.300 V/(Ag0 /AgCl/Cl− )=0.300+0.199=-0.101 V/H+ /H2 ).
The use of a separate containment for the anode electrode accelerated the
electrolytic reduction of the analyte but a glass-frit with high porosity (40 μm)
was necessary to ensure the free passage of the electrolyte. Therefore, the use of
the frit during the posterior step of electrochemical reduction was introduced as routine.
Increasing the concentration of U-analyte favoured the observation of the redox
+4
peak UO2+
for the CV-checks done along the electrolysis, so as to obtain the
2 /U
highest peak intensity.
+4
A better identification of the UO2+
was possible using high scan rates. In
2 /U
light of these test results, a scan speed as high as 0.1 V/s was afterwards always used
in the CV-checks done along the electrolysis.
33
Chapter 3. Synthesis of nc-UO2 by controlled massive precipitation in Aqueous phase
3.3.2
Electrochemical reduction of the mother solution.
3.3.2.1
Experimental arrangement.
The experimental arrangement used for the electrochemical reduction was in essence
that shown in the general illustration of the precipitation method in Fig. 3.2. The
general principles for the electrolysis are described in Sec. 2.1.2. Three electrodes
were so immersed in the prepared solution in a 150 mL glass reactor built for these
experiments. The solution containing the U-analyte (UO2 (NO3 )2 ) was prepared at
different concentrations between 0.02 until 0.5 M in U (depending on the experiment).
And an excess of the supporting electrolyte (1 M NaCl or 1 M HCl) was added here,
too. The experimental set-up of the reduction cell used is shown in Fig. 3.10, where
some modification can be appreciated with respect to one used for the CV-tests (see
Fig. 3.5). In the CV experiments, the net electrode was used as counter electrode,
but for the present case (reduction of the solution), the net was used as a working
+4
electrode (cathode). During the reduction of the pair UO2+
2 /U , a larger working
electrode area is desired to achieve higher reduction rates, for which the net electrode
(with larger surface that of the spiral electrode) was employed for that purpose. The
spiral was used as a counter electrode (anode).
Figure 3.10: Electrochemical reduction set-up.
To prevent the re-oxidation of the obtained UIV to UV I because the anodic (counting electrode or spiral) produces oxygen, the anode was introduced in a separated glass
tube of 12 mm in diameter, with a glass-frit (40 μm as determined in the CV study)
on its bottom. This is seen as a fundamental modification of the approach adopted by
[Rousseau et al., 2009] and [Gil et al., 2010] where cathode and anode were immersed
in the same bath. The frit allows the passage of the electrolyte but partially avoids
the passage of the oxygen to the solution, so that the entire process is more effective
34
3.3. UIV /UV I cyclic voltammetric and spectrophotometric study.
speeding the reduction process.
Continuous bubbling of the solution with inert gas (Ar) was applied to avoid any
traces of O2 which could pass through the frit. A humidification bottle was installed
between the argon supply and the reactor vessel, so that the Ar was pre-bubbled
and saturated with water before entering in the reactor. This ensures dry Ar gas is
saturated with water and the losses of liquid during the experiment are minimised.
The bubbling together with the stirring reinforced the homogenization of the mixture
(stock solution) during the whole experiment. Same as in the CV-tests, all reduction
and precipitation experiments were conducted under anoxic conditions in a glove-box
under N2 atmosphere (O2 <0.5%).
In a typical experiment, an aliquot of the uranyl (UV I ) nitrate stock-solution was
diluted in a 1 M NaCl solution to yield a final U-concentration of 0.1 M in a 75 mL
batch. Before beginning any electrochemical reduction step, the pH was measured
with a pH glass electrode (iEcotrode Plus Metrohm 3 M KCl) in combination with a
Titrando 906 measuring instrument from Metrohm. Adjustment with HCl 1 M was
pursued to maintain the solution with a pH<1 to avoid the hydrolysis (see Sec. 3.1.1)
of the already reduced U4+ , before the onset of the precipitation was induced by
controlled NaOH-alkalinisation.
The reduction of UV I -solution to UIV was performed under a constant potential
(-0.3 V vs. Ag/AgCl as determined in the CV study) and the current varied between
|-50| to |-5| A. Therefore the calculation of the needed time for the electrolysis was
approximated. The reduction was rapid at first but slowed as the ion concentration
decreased as would be expected from Ohm’s Law (V = I · R), i.e. at constant voltage,
the current is inversely proportional to the resistance.
The UV I -solution was proved to be electrochemically reduced to UIV almost
entirely. Continuous checks of the reduction status were carried out by CV-tests during
the electrolysis of the solution to verify the extent of reduction of the UV I cations
+4
amount (on observing the intensity diminution of the UO2+
cathodic peak). Thus,
2 /U
the reduction was temporarily halted and the typical experimental CV arrangement
was adopted in each check (Fig. 3.5). The spiral was disposed outside the glass-frit and
put inside the reactor bath in direct contact with the reducing solution. Ar flow and
stirrer agitation were stopped to avoid disturbances. Scan speed as high as 0.1 V/s
was used as determined in the CV-study.
During the reduction, the reactor was showing increasingly evidence of an already
reduced green UIV -solution, while inside the glass tube with the frit a yellow UV I solution was still observed, due to the continuous O2 production on the anodic side
(spiral).
3.3.2.2
Results and discussion.
Fig. 3.11 shows different CV plots recorded at different times during the reduction
+4
step. The plots show the decrease of the cathodic peak UO2+
with increasing
2 /U
electrochemical reduction time, in terms of the current of density (A/cm2 ) passing
between the two inert Pt electrodes at the corresponding potential. The electrochemical
resistance of the media increased with time because the ions concentration of the
35
Chapter 3. Synthesis of nc-UO2 by controlled massive precipitation in Aqueous phase
species to reduce diminished. The diffusion to the cathode of the ions, which are still
not reduced, became hence more difficult, explaining so the decreased cathodic current.
Figure 3.11: Cyclic voltammogram 0.1 M U and pH<1. UO2 (NO3 )2 solution in HCl 0.33 M
scanned between -0.4 and +1.4 V vs. Ag/AgCl (saturated) at a scan rate of 0.1 V/s. The
theoretical reduction rate of the ion UO2+
2 at each moment was calculated with Eq. 2.7.
The pH rose from 0.2 to 0.6 at the end of the electrochemical reduction. That
could be due to the acid consumption during the electrolytic reduction of the uranyl
ion (cathodic reaction; see Eq. 2.1). That could be relevant if a pH>1 was in the end
obtained because hydrolysis of UIV is expected.
3.3.3
UV-Vis spectrophotometry of the solution.
3.3.3.1
Experimental.
Different Aliquot samples were taken along the electrolysis for ultraviolet-visible
spectroscopy (UV-Vis) analysis, which were performed to monitor the valence state of
U before and during the controlled potential reduction of UO2 (NO3 )2 in HCl solution
(Fig. 3.12). The UV-Vis/NIR spectrophotometer used to record the UV-Vis absorption
spectres is described in Sec. 2.2.1. The tint of the solution was changing along the
reduction from an initial clear-yellow colour typical of UO2+
2 ion, to a dark-green colour
typical of U4+ at the end of the process (see Fig. 3.13 showing the progressive colour
change of the U-solution upon its reduction).
3.3.3.2
Results and discussion.
The absorption bands in the range from 375 to 500 nm, which are characteristic to
the absorption of uranyl (UV I ) ions, gradually decreased and finally disappeared with
36
3.3. UIV /UV I cyclic voltammetric and spectrophotometric study.
Figure 3.12: Change in visible absorption spectra for the reduction of 0.1 M U and initial
pH<1. UO2 (NO3 )2 solution in HCl 0.33 M. The theoretical reduction rate of the ion UO2+
2
at each moment was calculated with Eq. 2.7.
increasing the electrolysis reduction time. At the same time, the absorption bands
from 400 to 700 nm, which are consistent with absorption typical peaks for UIV (426,
492, 548 and 646 nm), appeared with stronger intensity as the time of electrochemical
reduction of the solution increased. That was in agreement with the intensity decrease
+4
of the UO2+
cathodic peak observed in the CV tests of the solution (Fig. 3.11)
2 /U
with the time of reduction. This result strongly supports the fact that UO2+
2 in the
acidic solution was almost fully reduced to UIV at the Pt electrode. The progress of
the electrochemical reduction, as analysed by spectrophotometry, is shown in Fig. 3.12.
+4
In Fig. 3.14, the intensity peak decrease by both cyclic voltammetry (e.g. UO2+
2 /U
cathodic peak, Fig. 3.11) and UV-spectrophotometry (e.g. UO2+
absorption peak
2
Figure 3.13: U-solution at different steps during electrochemical reduction
37
Chapter 3. Synthesis of nc-UO2 by controlled massive precipitation in Aqueous phase
at 412.43 nm, Fig. 3.12), are plotted as a function of the percentage of UO2 (NO3 )2
electrochemical conversion (analysis performed on the same aliquots of solution). Cor+4
respondence between both methods in the determination of the UO2+
conversion,
2 /U
is very satisfactory.
+4 cathodic peak, Fig. 3.11)
Figure 3.14: Intensity peak decrease by both CV (e.g. UO2+
2 /U
2+
and UV-spectrophotometry (e.g. UO2 absorption peak at 412.43 nm, Fig. 3.12) as a function
of the percentage of UO2 (NO3 )2 electrochemical conversion.
3.4
3.4.1
Precipitation and separation of the UO2nanocrystals.
Introduction remarks.
The precipitation from the electrochemically reduced UIV -solution (0.5 M U for the
highest concentration) was achieved by gradual alkalinisation of the solution following
as close as possible the theoretical solubility limit line of UIV species in aqueous
media Fig. 3.1. This was pursued to avoid significant agglomeration of the precipitates
(UO2 (c) or UO2 · xH2 O(am)), which was faired to occur if the system entered in
the region of frank supersaturation, as it could be induced by uncontrolled brusque
alkalinisation (pH-increase much beyond the equilibrium line).
Indeed, the theory of precipitation from supersaturated solutions and a number
of dedicated experimental works indicate that the size of the nuclei-precipitates is
inversely proportional to the supersaturation degree, while the number of nuclei is
directly proportional to it (homogeneous precipitation) [Lifshitz and Slyozov, 1961]
[Bristow et al., 2001] [Wu et al., 2008] [Maeda et al., 2009]. However, under consideration of kinetic aspects (e.g. coagulation rates), also considerable number of studies
exist indicating that the supersaturation degree is a key factor triggering the agglomeration of precipitates, with the evidence found that the larger the supersaturation
degree the larger the size of the agglomerates formed (including both homogeneous
and heterogeneous precipitation) [Yu et al., 2007] [Claassen and Sandenbergh, 2006]
38
3.4. Precipitation and separation of the UO2 -nanocrystals.
[Zumstein and Rousseau, 1989] [Packter, 1958] [Sarig et al., 1978].
The quantity of NaOH theoretically needed to reach a given pH can be calculated
as the sum of [OH − ]molsA + [OH − ]molsB , where the first term A indicates the
number of OH mols needed to increase the initial pH to the wished final pH, as given by:
[OH − ]molsA = [H + ]molsInitial − [H + ]molsEnd
(3.1)
where
[H + ]molsInitial = 10−pHInitial
and
[H + ]molsEnd = 10−pHEnd
and the second term B indicates the number of OH mols needed to precipitate the
species U+4 as UO2 , as given by the reaction:
U 4+ + 4OH − ↔ U O2 + 2H2 O
(3.2)
[OH − ]molsB = 4 · U 4+ mols
(3.3)
and where
This theoretically amount of NaOH needed to set a given pH was hence estimated
and was taken into account as indicative value for the subsequent precipitation step.
3.4.2
Experimental steps.
The precipitation was performed in the same reactor used for the electrolysis experiments. The arrangement used for this step is shown in Fig. 3.15. No potential was
applied during the precipitation but the atmosphere conditions were maintained in
the same way as in the electrochemical reduction step: i.e. the arrangement was
kept inside a glove-box under anoxic conditions (N2 atmosphere with O2 <0.5%) and
dynamic Ar gas flow (passed through a humidification bottle to saturate it with water
before entering in the reactor to avoid the dryness of the solution), was applied.
The pH at the beginning of the precipitation, was below 0.5. A series of stepwise
precipitations between pH<0.5 and 3 were then carried out by addition of 3 M NaOH
solution at a rate of 10-20 μl/min, as controlled by a dosage instrument (Titrando 906
from Metrohm). The slow alkalinisation was automatically stopped when the solution
reached the pH desired, and was re-started when the pH evolved backwards (through
precipitation, Eq. 3.3) and was again below the set pH.
Black nc-UO2 -precipitates appeared around pH∼1 and the solution began to look
turbid from this point onwards. The pH variation during the precipitation step was
39
Chapter 3. Synthesis of nc-UO2 by controlled massive precipitation in Aqueous phase
Figure 3.15: Precipitation of nc-UO2 set-up.
monitored continuously. An example of this variation with time for the case of the
highest U-concentration used in the experiments (0.5 M) is shown in (Fig. 3.16).
In the displayed case, a constant dosage rate of the alkalinising NaOH-solution of
approximately 1.2 ml/h was used. Small pH-drifts occurred because of the formation
of nc-UO2 crystals. In addition to this, on reaching the pH the value of 1, a main jump
or abrupt slope increase was observed in the pH vs. t curve (Fig. 3.16), which revealed
the main precipitation of UO2 crystals in the solution has already occurred, when the
pH surpassed this precipitation threshold.
The quantity of NaOH theoretically needed to reach the set pH was calculated as
previously indicated as the sum of [OH − ]molsA + [OH − ]molsB . The NaOH-solution
was slowly added at constant rate and the pH was monitored (Fig. 3.16). The NaOH
additions stopped automatically after approximately 30 h of precipitation on reaching
the pH the value 3. After this point, no further essential modifications of the pH
were registered during at least 3 days more (>100 h after initiation of the process),
indicating that the precipitation had been already almost completed when the pH
achieved the value 3.
Centrifugation (3500 rpm and 30 min) of the blackened solution was performed
to gather the precipitates. Na+ and Cl− species were present in the final solution
because of the initial additions of HCl to acidify solution and the posterior additions of
NaOH used to precipitate the UIV -species as oxide in the solution. The wet nc-UO2 precipitates hold these impurity species on its surface, which will precipitate as small
NaCl crystals once the final product dries. Therefore, the wet nc-UO2 -precipitates
were re-dispersed in deionised water and sonificated for diluting and washing out the
possible Na+ and Cl− species concentration present. Subsequent centrifugation, to
40
3.4. Precipitation and separation of the UO2 -nanocrystals.
Figure 3.16: Controlled nc-UO2 precipitation from a electrochemically reduced UIV -solution
0.5 M U in HCl 1M. pH monitoring vs. NaOH addition and time.
separate the nc-UO2 -precipitates from the water containing the dissolved Na+ and
Cl− species, was done. This washing-centrifugation step was performed 5 times using
a volume of 40 ml of deionised water pro washing operation and a partial charge
of 1.25 g nc-UO2 each tube (4 tubes were centrifuged in parallel). For the highest
U-concentrations of (0.5-0.6 M), around 10 g of nc-UO2 precipitates were obtained in
total from each precipitation batch.
3.4.3
Spectrophotometry of the solution.
The UV-spectrophotometer was used during the precipitation process to identify the
decrease in U concentration in the solution (see Fig. 3.17 where the absorption band at
647.04 nm typical from U+4 , has been monitored). With increasing of the pH (addition
of NaOH to the solution), increasing of nc-UO2 precipitates occurred and reduction of
the UIV in solution diminished. The change in the visible absorption spectra could not
be observed effectively till the end of the precipitation because of the turbidity of the
solution. A picture of the reduced green UIV -solution before to begin the precipitation
and the black final solution containing the nc-UO2 -precipitates, is shown in Fig. 3.18.
With the solubility constants for UO2 (c) and UO2 (am), and the stability constants
for UIV hydrolysis reported by [Guillaumont et al., 2003], a graph with the speciation
of all uranium entities present at different pH in the solution as well as the solubility
lines for UO2 (c) and UO2 · xH2 O (am) can be represented, as it was undertaken in
Fig. 3.19. The speciation curves add knowledge of what is happening in the solution
as the pH is increased in the precipitation step. The yellow line represents the piece of
solubility/precipitation line followed during precipitation. The yellow circles represent
the experimental precipitation points observed in the UV-absorption spectra (Fig. 3.17)
having in account the different intensities obtained. These experimental precipitation
point fall all on the theoretical precipitation line.
41
Chapter 3. Synthesis of nc-UO2 by controlled massive precipitation in Aqueous phase
Figure 3.17: Change in visible absorption spectra of the typical UIV band between 630 and
665 nm, of a controlled nc-UO2 precipitation from a electrochemically reduced UIV -solution
0.1 M U in HCl 1 M and pH<1 (left). Diminishing of intensity with increasing of the pH
because the precipitation of the U+4 in solution as nc-UO2 (right).
(b) ∼10 g of black nc-UO2 precipitates
(a) UIV -electrochemically reduced solution 0.5 M U in HCl 1M and pH<0.5.
Figure 3.18: U-solution before and after the precipitation.
1.00
0
2+
U(OH)2
-4
-6
0.60
U4+
-8
0.40
-10
U(OH)4
0.20
log[(U(IV)]
fraction
-2
U(OH)31+
0.80
-12
U(OH)3+
-14
0.00
-16
0
1
2
3
4
5
6
pH
Figure 3.19: Uranium Speciation at different acidic media and solubility lines for UO2 (c)
and UO2 · xH2 O (am) represented with the constants data by [Guillaumont et al., 2003].
Yellow circles represent experimental points. Yellow line represents the piece of solubility
line followed during precipitation.
42
3.5. Characterisation of the as-produced nanocrystals.
3.5
Characterisation of the as-produced nanocrystals.
The morphology and structure of the obtained nc-UO2 particles were characterized
by means of transmission electron microscope (TEM) and the structure confirmed by
X-ray diffraction (XRD).
3.5.1
Precipitates morphology and composition.
Qualitative composition analysis of the precipitates obtained was carried out by TEM.
The characteristics of the instrument used, as well as the preparation of the analysed
specimens are described in Sec. 2.3.2.
Fig. 3.21 shows the TEM image of nc-UO2 synthesised by the presently described
method. The average precipitate size was of 3.9(8) nm, as obtained from the size
distribution (Fig. 3.20). The particles showed agglomerates of 50 nm (Fig. 3.21a).
However, very often separated nanoparticles exist in suspension in the original solution,
but one sees agglomerates on the TEM grid, due to the preparation of the TEM sample.
Figure 3.20: Size distribution histogram from TEM measurements of nc-UO2 synthesized by
precipitation in aqueous media. Diameter average size of 3.9(8) nm diameter average size.
The collected black precipitates presented the typical fcc fluorite structure of UO2 .
The selected area electron diffraction (SAED) pattern (inset of Fig. 3.21c) revealed
the polycristallinity of the material with the fcc structure. The calculated interference
fringe spacing in the HRTEM image (Fig. 3.21c) was about 0.315 nm, which was in
agreement with the interplanar distance of the [111] plane in the fcc fluorite structure
(0.3153 nm for the UO2 standard 00-041-1422-ICCD).
3.5.2
Precipitates crystal structure.
The crystal structures and crystal size of the as synthesised nc-UO2 observed in
the TEM analysis were confirmed by XRD. The characteristics of the instrument
used are described in Sec. 2.4.1. The crystal structure of the nano-precipitates was
43
Chapter 3. Synthesis of nc-UO2 by controlled massive precipitation in Aqueous phase
22
(a) The scale bar is 50 nm.
(b) The scale bar is 5 nm.
(c) The scale bar is 5 nm. The
inset of the figure shows selected
area electron diffraction (SAED).
Figure 3.21: TEM micrographs of UO2 at low resolution, showing an assembly of nanocrystals,
and at high resolution, revealing lattice imaging of the nanocrystals.
determined by Rietveld refinement (Sec. 2.4) using bulk-UO2 as standard. The whole
diffraction pattern was taken in account. The agreement between the measured
and fitted diffraction lines profiles is shown in Fig. 3.22. The overall fit quality as
described by the measured R-values and the goodness of the fit (GOF) was, despite
broadness of the peaks (typical for nanocrystals), satisfactory (R(expected)/%=4.39,
R(profile)/%=4.32, GOF=1.51). A fcc fluorite structure (Fm-3m space group) with
a lattice parameter of 0.5417(1) nm (a=0.547 nm for the UO2 standard 00-041-1422ICCD) and 3.79 nm crystallite size in agreement with the average size observed by
TEM of 3.9(8) nm, was found. All diffraction peaks showed a small shift to the higher
2θ, which suggests either a slightly higher oxidation state relative to stoichiometric
UO2 , or a mechanical distortion (contraction) of the lattice due to surface stresses
induced by the small particle size [Boswell, 1951] [Qi et al., 2002] [Fukuhara, 2003]
[Park and Qian, 2010].
The Bragg diffraction peak positions and relative intensities for the refined XRD
pattern of as produced UO2 nanocrystals in comparison with standard diffraction patterns of UO2 , U4 O9 and U3 O8 , are also shown in Fig. 3.23. The peaks show to be
compatible with an oxide structure between those of UO2 and U4 O9 , both fcc-phases,
but with an oxidation degree closer to that of U4 O9 (systematic peaks shift towards
higher diffraction angles compared to UO2 , i.e., higher oxygen stoichiometry). The
figure shows also fully disagreement of the measured diffraction pattern with that of
the phase U3 O8 , which excludes hence such an extreme oxidation of the precipitation
product.
The interplanar distance of the [111] plane in the fcc fluorite structure was of
0.3147 nm for the XRD pattern Fig. 3.22 (0.3153 nm for the UO2 standard 00-0411422-ICCD). Calculated interference fringe spacing for single crystals in the HRTEM
image of 0.315 nm was obtained (Fig. 3.21c).
44
3.6. Results and discussion.
Figure 3.22: XRD pattern of nc-UO2 experimental data, fitted pattern, Bragg peak positions
and experimental-fitted difference.
Figure 3.23: Bragg diffraction peak positions and relative intensities for the refined XRD
pattern of nc-UO2 by aqueous route (green), standard UO2 (00-041-1422-ICCD - red)), U4 O9
(01-075-0944-ICCD - blue)) and U3 O8 (00-023-1460-ICCD - lila)), respectively ([ICCD, 2012]
database).
3.6
Results and discussion.
An intensive study of the range of U-concentration and acidity for nc-UO2+x precipitation from electrolytically reduced uranyl nitrate solutions was endeavoured, using
45
Chapter 3. Synthesis of nc-UO2 by controlled massive precipitation in Aqueous phase
higher concentration (10−1 M) ranges as the observed in literature (10−2 M), and
therefore lower pH ranges, following the solubility line of UIV .
The electrochemical reduction characteristics of the uranyl ion by cyclic voltammetry (CV). The study of the uranyl ion system under the influence of different parameters
as use of separated compartment for the anode, different ion concentrations, acidic
aqueous media and scan rates, were analysed. In light of this CV study, the conditions
for the electrochemical reduction of these species could be defined. Electrochemical
reduction was pursued following the later defined parameters. Continuously control
of the reducing solution by CV and UV-Vis spectrophotometry was done along the
electrolysis step. Correspondence between both methods in the determination of the
+4
UO2+
conversion, was satisfactory.
2 /U
Precipitation from the electrochemically reduced UIV -solution was achieved by
gradual alkalinisation of the solution following as close as possible the theoretical
solubility limit line of UIV species in aqueous media. nc-UO2+x precipitation was
achieved in the pH range of ∼1 to 3 and for U-concentrations as high as 0.5 M.
Washing-centrifugation steps of the blackened solution were performed to gather the
precipitates. As a result, 10 g of nc-UO2+x per batch have been obtained. This
represents not only an improvement of the method studied but a major achievement
in its use for the synthesis of meaningful quantities of such material.
The solid phase, as obtained by XRD, was found to crystallize with the typical UO2 -fcc fluorite structure (Fm-3m space group), with a lattice parameter
a=0.5417(1) nm and average crystallite size of 3.79 nm, also in agreement with
an average size observed by TEM of 3.9(8) nm and DLS of 3.7(1) nm. The
predominant diffractogram of the samples corresponded unmistakably to UO2 ,
though in a poorly crystallized form, or as finely aggregated nc-particles, which
caused peak broadening. This phase, which has also been described in the literature as amorphous-hydrated uraninite [Ryan and Rai, 1983] [Opel et al., 2007]
[Rai et al., 2003] [Fanghänel, Th. and Neck, 2002] and [Neck and Kim, 2001], was
however shown in the present XRD measurements to correspond to crystalline UO2
but in a rather oxidized state. The latter was manifested through a lattice contraction
of about 0.9% of the precipitated phase (a=0.5417(1) nm) with respect to the values
of stoichiometric UO2 (a=0.547 nm). An effect which could be also caused by surface
stresses induced by the small particle size, as frequently observed in nanoparticles.
Further studies will be then undertaken in chapters hereafter to clarify this influence.
Since the corresponding water content and/or oxidation degree of this phase was
hitherto not identified, it was generically described here as UO2+x , in correspondence with similar description e.g. in [Rousseau et al., 2002] [Rousseau et al., 2006]
[Rousseau et al., 2009]. Further analysis of this phase will be found in Chap. 5. To
study the composition of the precipitates and their propensity propensity to thermal
growth in the unconsolidated state, i.e. on just experiencing stochastic physical
contact, further analysis of the precipitated was performed by applying the thermal
analytical and X-ray scattering techniques like TG/DTA, HT-XRD and RT-XRD,
spectroscopic techniques as XAS, NMR and IR and characterization techniques like
TEM. The results are detailed and discussed in Chap. 5. The use of the method here
described, was to avoid the use of foreign organics (dispersing agents, antiflocculants)
in the preparation, which could disturb afterwards in the production of pellets of this
material (Chap. 7).
46
3.6. Results and discussion.
47
Chapter 3. Synthesis of nc-UO2 by controlled massive precipitation in Aqueous phase
48
Chapter 4
Synthesis of nc-UO2 and nc-ThO2
by a precursor thermal
decomposition in Organic phase
4.1
Introduction and principles.
The synthesis of monodisperse nanocrystals (nc) demands a short nucleation step
followed by a slower controlled growth of the formed nuclei [Murray et al., 1993]. Two
different approaches can be pursued to achieve this synthesis.
One approach is the fast addition of the reactive agents into the reactor which
contains the coordinating solvent at a temperature high enough to decompose them.
The fast addition increases the precursor concentration over the nucleation point and
after a short period of nucleation, the concentration of the species in solution falls
under the critical concentration for the nucleation. So far the precursor addition rate
does not go beyond the consumption rate of the reagents, no new nuclei appear and
the precursor surplus just enlarges the size of the particles [Burda et al., 2005]. The
final size of the particles depends on the duration between the primary nucleation
step and the incubation time needed for the beginning of the particles’ growth. The
subsequent growth step is alike for all the particles, and therefore it does not influence
the final distribution size. Therefore, a way to maintain a homogeneous final size
distribution, is to induce a short nucleation step in comparison to the growth step
[Murray et al., 1993] [Peng and Peng, 2001] [Qu et al., 2001] [Burda et al., 2005].
The second way to perform the synthesis (and approach used here in the synthesis
of the nc-UO2 ) is to mix all the reactive components at the beginning in the reactor at a
temperature below which any reaction occurs, but high enough to allow a good mixing
[Murray et al., 2000] [Wang et al., 2003] [Murray et al., 1993] [Peng and Peng, 2001]
[Qu et al., 2001] [Burda et al., 2005]. Once a good mixture is achieved, the temperature is raised with a determinate rate to provoke the necessary supersaturation and
subsequent nucleation. As in the first synthesis approach, no new nuclei will appear
provided that the temperature is kept below or equal to the value where the reagents
start to react more rapidly (to form new nuclei) than the consumption rate of materials
to enlarge the present nuclei. Again in this case, the size distribution depends on the
time between the nucleation begins and the particles growth initiation. The changes
in size and shape of the crystals are achieved by playing with the composition and
concentration, as well as temperature and the time of reaction [Burda et al., 2005].
49
Chapter 4. Synthesis of nc-UO2 and nc-ThO2 by a precursor thermal decomposition in Organic phase
Surfactants inside the reactor bind on the synthesized crystals forming an organic
capping layer that protects and stabilizes the crystals against flocculation or excessive
growth. Larger molecules surfactants which provide greater steric hindrance, as well
as surfactants that cap stronger to the surface of the crystals, diminish the reagents
incorporation rate in the nuclei and as a consequence their final size. Particles growth
can be stopped (before the finishing of the reagents) by fast cooling of the reactor
[Murray et al., 2000] [Wang et al., 2003] [Murray et al., 1993] [Peng and Peng, 2001]
[Qu et al., 2001] [Burda et al., 2005].
To collect the particles a precipitation is induced by addition of a non-solvent
which is characterized to be partially miscible with the media of the reaction but has
no interaction with the capping agents. The dispersion is destabilized and the solution
becomes turbid due to flocculation of the crystals. Centrifugation accelerates the
process and crystals are collected on the bottom of the centrifuge tubes. Afterwards
the liquid is decanted and the crystals collected. The material obtained is formed
by the nc-material and the organic capping layer which permits its re-dispersion
in an organic solvent [Murray et al., 2000] [Wang et al., 2003] [Murray et al., 1993]
[Peng and Peng, 2001] [Qu et al., 2001] [Burda et al., 2005].
The organic solution phase decomposition route has been widely used for the
synthesis of metal-oxide nanocrystals. In this project the synthesis of nc-UO2 in
organic media was developed following the second approach above described and the
method reported by [Wu et al., 2006] where uranyl acetylacetonate (UAA Fig. 4.1a) is
used as precursor in a mixture of long chain solvents as oleic acid (OA), oleylamine
(OAM) and octadecene (ODE) which are stable at high temperatures where this kind
of metal-oxide nanocrystals are normally formed [Willis et al., 2007].
(a) UAA
(b) ThAA
(c) ThAc
Figure 4.1: Precursor molecular structures used in the organic synthesis.
The decomposition of the UAA precursor and the amine (OAM) is followed by a
reduction of UV I (UAA) to UIV (UO2 ) at higher temperatures. OAM might act as
reducing agent [Wu, 2008]. A condensation reaction between OA and OAM occurs
ending in the formation of N-(cis-9-octadecenyl)oleamide (OOA Fig. 4.2-left) and
water, and is almost terminated before the beginning of the nucleation, as reported by
[Wu et al., 2006]. OOA is described there as tuner of the reaction intermediate steps
to form the UO2 nanoparticles, where free UO2 units and clusters have interaction
−
with the amide (R-NH+
3 ) and the carboxylic (R-COO ) groups (see Fig. 4.2-right)
[Wu, 2008].
50
4.1. Introduction and principles.
29
Figure 4.2: Oleic Acid (OA), Oleylamine (OAM) and N-(cis-9-octadecenyl)oleamide (OOA)
obtained after the condensation reaction together with water [Wu et al., 2006] (left). Intermediate steps of the nc-UO2 synthesis where free UO2 units and clusters interact with the
formed OOA (right) [Wu, 2008].
However, no OOA but just an oleate was found bonded through chelating bidentate
interaction on the surface of the nc-UO2 [Wu et al., 2006]. A strong attraction appears
between the oleate and the metal group making a very compact monolayer around the
nanocrystals inhibiting their growth and protecting them against agglomeration (see
Fig. 4.3).
Figure 4.3: Oleate as capping ligand bonded through chelating bidentate interaction on the
surface of the nc-UO2 .
51
Chapter 4. Synthesis of nc-UO2 and nc-ThO2 by a precursor thermal decomposition in Organic phase
4.2
Experimental.
In the present work the precursor uranyl (UV I )-acetylacetonate (UAA) for UO2
nanocrystals and thorium (ThIV )-acetylacetonate (ThAA) or thorium (ThIV )-acetate
(ThA) for ThO2 nanocrystals (see Fig. 4.1), were dissolved in a solution of oleic
acid (OA Fig. 4.2) and 1-octadecene (ODE) at 110°C under continuously stirring.
Oleylamine (OAM Fig. 4.2) was added to the mixture and was heated at an average
rate of 20°C/min until 310 to 350°C was reached (depending on the experiment).
Afterwards the growth solution was aged for 1-6 h (depending on the experiment) and
cooled to room temperature.
The experimental set-up involved a heater, a small-round vessel, a cooler and a
continuous Ar flow. A scheme as representation of the set-up is shown in Fig. 4.4.
The solution preparation as well as the reaction steps were conducted under anoxic
conditions in a glove-box under N2 atmosphere (O2 <0.5%). Posterior washing of the
oxide-crystals, as well as centrifuging was performed. As a final product, nc-precipitates
of UO2 and ThO2 redispersible in organic solvents were obtained. A picture of the
different steps is shown in Fig. 4.5.
N Glove-Box
2
Water cooling
Ar
Thermocouple
nc-UO Synthesis Reactor
2
Stirrer
Heating mantle
4
5
6
7
3
2
1
11
1
4
8
3
9
2
5
6
7
8
Stirring plate
9
1
1
Figure 4.4: Arrangement for the organic thermal decomposition method.
Reduction of surfactant quantities with respect to the metal content in comparison
with [Wu et al., 2006] was made. Posterior scale-up of the method from initial
quantities of about 0.1 g of nc-UO2 as reported by [Wu et al., 2006], to quantities of
about 2 g of nc-UO2 achieved here, was done. The same method was also extrapolated
for the synthesis of nc-ThO2 .
52
4.2. Experimental.
#&"!
'
#""!
%""!$&! '
Figure 4.5: Steps in the thermal Decomposition of UAA in organic media.
4.2.1
Solution preparation.
4.2.1.1
UO2 nanocrystals preparation.
In this method UAA (UO2 (CH3 COCHCOCH3 )2 CAS: 18039-69-5 yellow orange
crystals from Ibilabs based on depleted uranium 235 U 0.3-0.4% - 238 U 99.6% Fig. 4.1a)
was used as a precursor. Indeed, 4 g of UAA were dissolved in a solution of 15 mL
OA (9-Octadecenoic acid CAS: 112-80-1 99% from Sigma Aldrich) and 27 mL ODE
(Octadecene-1 CAS: 112-88-9 90% from Sigma Aldrich) inside a 100 mL three-necked
glass reactor under continuous stirring. The three necks of the vessel were occupied
by an Ar flow, a condenser and a temperature sensor connected to a temperature
controller. The reactor was placed on a heating mantle and the solution was slowly
heated up to 150°C and maintained at this temperature during 20 min. Afterwards the
solution was left to cool to room temperature and 21 mL OAM (1-Amino-9-octadecene,
CAS: 112-90-3, 70%, Sigma Aldrich) were added to the mixture. The solution was then
slowly at heated 100°C under continuous stirring during 15 min. During this heating
the solution passed from an initial turbid yellow state to a good mixed, transparent
orange state (see Fig. 4.6).
(a)
(b)
Figure 4.6: (a) UAA + ODE + OA at RT (before applying any temperature). Turbid yellow
solution. (b) UAA + ODE + OA + OAM at RT (after stirring at 100°C). Transparent orange
solution.
53
Chapter 4. Synthesis of nc-UO2 and nc-ThO2 by a precursor thermal decomposition in Organic phase
As solvents ODE, OA and OAM were introduced in the reactor. The long chained
alcohol (OA) was used as surfactant, and as reducing agent a long chained amine
(OAM). The boiling points for the OA, OAM and ODE are 360, 364 and 315°C
respectively.
4.2.1.2
ThO2 nanocrystals preparation.
In this case ThAA (Th(CH3 COCHCOCH3 )4 CAS: 17499-48-8 from Ibilabs colorless
crystals Fig. 4.1b) or ThA (Th(C2 H3 O2 )4 CAS: 13075-28-0 from Ibilabs colorless
crystals Fig. 4.1c) were used as precursors. The steps followed for the preparation of
nc-ThO2 were similar to those used for the synthesis of nc-UO2 . In this case 0.60 g
of thorium acetylacetonate (ThAA) or thorium acetate (ThA) were dissolved in a
solution of 3 mL OA and 4 mL ODE inside a 50 mL three-necked glass reactor under
continuous stirring. The three necks of the vessel were as before occupied by an Ar
flow, a condenser and a temperature sensor connected to a temperature-controller. The
reactor was placed on a heating mantle and the solution was slowly heated up to 150°C
and maintained at this temperature during 20 min. Afterwards the solution was left
to cool to room temperature and 4 mL OAM were added to the mixture. The solution
was then slowly heated at 100°C (temperature high enough to allow a good mixing but
not high enough to provoke the reaction) under continuous stirring during 15 min. The
solution passed from an initial turbid-white to a good mixed transparent white solution.
4.2.2
Reaction step.
4.2.2.1
UO2 nanocrystals production.
Once the OAM was also mixed in the solution, everything was heated with an
average rate of 25°C/min until 300°C. The mixture was so progressively changing its
colour from transparent orange-brown at 100°C to turbid dark brown at 190°C, to
brown-black at 200°C, until finally turning to completely black at 250°C (see Fig. 4.7).
Small explosions inside the reaction vessel occurred at that temperature. Once the
temperature plateau at 300°C was reached, the solution was aged at this temperature
for 60 min. During this ageing time, small explosions continued inside the vessel.
The solution preparation as well as the reaction steps, were conducted under
anoxic conditions in a glove-box under N2 atmosphere (O2 <0.5%). Furthermore,
a continuous Ar gas flow was supplied inside the reactor vessel in order to keep
an inert atmosphere. Even so, a lot of water and oxygen molecules are already
inside the experimental system (UAA contains two water molecules and two oxygen atoms). The small explosions observed up to 250°C could be due to an effect of
oxygen reacting with the solvents during thermal decomposition, at these temperatures.
The UAA and the OAM were thermally decomposed and subsequent reduction
of the UV I (UAA) to UIV (UO2 ) occurred using OAM as a reducing agent, as
suggested by [Wu, 2008]. As a final material, nc-UO2 were obtained. The surfactant
bonded to the nanocrystals forming a lipophylic surface on them. This capping would
avoid the agglomeration of the nanocrystals and would allow the post-collection of the
crystals in an organic solvent. Finally the solution was left to cool to room temperature.
54
4.3. Precipitation and separation of the nanocrystals.
Figure 4.7: U-solution during the reaction step at different temperatures (160, 190 and 250°C).
4.2.2.2
ThO2 nanocrystals production.
Once the OAM was added to the mixture, everything was heated at 25°C/min up to
300°C. In the experiments where higher temperatures were achieved (330°C), ODE
was substituted because its boiling point at 315°C, and just OA and OAM were used
as solvents for the reaction. The mixture progressively changed its colour from turbid
white at 100°C to yellow transparent at 200°C, and to orange transparent during the
ageing time at 300°C and to pale yellow transparent at the end of the ageing (see
Fig. 4.7). No explosions occurred during any of the ThO2 -experiments. Different
ageing times between 1 to 5 h were tested.
Figure 4.8: Th-solution during the reaction step at different temperatures.
4.3
4.3.1
Precipitation and separation of the nanocrystals.
UO2 nanocrystals recovery.
The particles coated and stabilized with a non-polar layer, were therefore soluble
in highly non-polar solvents such as ODE or toluene. The precipitation of the
nanocrystals was induced by adding a non-solvent, a mixture of hexane/acetone (1/4)
to the aged solution. The mixture was sufficiently apolar as to selectively precipitate
the relatively non-polar particles without precipitating out the ODE and excess OAM
and OA (which are taken by the hexane fraction). Pure acetone would be too polar
to be directly miscible with ODE. Instead, the use of a mixture with a moderately
non-polar solvent such as hexane permits their addition being miscible in the solution
without forming a secondary immiscible liquid layer.
55
Chapter 4. Synthesis of nc-UO2 and nc-ThO2 by a precursor thermal decomposition in Organic phase
Figure 4.9: Typical final UO2 solution after the reaction step and before precipitation.
Once the mixture of hexane/acetone was introduced, the dispersion was destabilized
and the solution became turbid due to the flocculation of the black nc-UO2 precipitates.
The separation was forced by centrifuging the new mixture at 3500 rpm (EBA 20
centrifuge from Hettich) for 10 min. The particles accumulated at the bottom of the
centrifuging tubes and the supernatant liquid containing the remaining organics (ODE,
OA and OAM) was taken away. New hexane/acetone was introduced in the tubes
and the centrifuging step repeated. This procedure was reiterated until the extracting
liquid was clear (see Fig. 4.10). After cleaning the nanocrystals several times with
the mixture hexane/acetone, the black nc-UO2 were re-dispersed in an organic solvent
such as hexane or toluene.
2
Figure 4.10: Precipitation, cleaning and recollection in an organic solvent (hexane) of the
nanocrystals of UO2 .
4.3.2
ThO2 nanocrystals recovery.
The ThO2 nanocrystals where obtained in the same way, but more repeated washing
and centrifuging steps were needed to obtain white ThO2 precipitates at the end of the
separation white ThO2 precipitates. The hexane/acetone (1/4) mixture was introduced
in the pale yellow reaction solution, which became white turbid. Then the crystals began
to flocculate (see Fig. 4.11) and after centrifuging a pale-orange gel appeared on the
bottom on the tubes. After several washing steps, however, white ThO2 crystals were
finally obtained. The ThO2 where redispersed in an organic solvent (hexane or toluene).
56
4.4. Characterisation of the as produced nanocrystals.
Figure 4.11: Precipitation, cleaning and recollection in an organic solvent (toluene) of the
nanocrystals of ThO2 .
4.4
Characterisation of the as produced nanocrystals.
The morphology and structure of the obtained nc-UO2 particles were characterized by
means of transmission electron microscope (TEM), dynamic light scattering (DLS),
and the structure confirmed by X-ray diffraction (XRD).
4.4.1
Precipitates morphology and composition.
The morphologies and dimensions of the samples were revealed by TEM. The characteristics of the instrument used, as well as the preparation of the analysed specimens
are described in Sec. 2.3.2. The organic route led to high-quality monodispersed UO2
nanocrystals and ThO2 rod-shaped nanocrystals.
4.4.1.1
UO2 nanocrystals morphology.
In Fig. 4.13, the TEM image of synthesised nc-UO2 by thermal decomposition in
organic phase is shown. The average precipitate size was of 4.9(3) nm, as obtained
from the size distribution (Fig. 4.12).
The collected black precipitates presented the typical fcc fluorite structure of UO2
and were polycrystalline, as shown by the rings of the SAED in Fig. 4.13c. The
selected area electron diffraction (SAED) pattern (inset of Fig. 4.13c) revealed the
polycristallinity of the material with the fcc structure. The calculated interference
fringe spacing in the HRTEM image (Fig. 4.14) was about 0.315 nm, which was in
agreement with the interplanar distance of the [111] plane in the fcc fluorite structure
(0.3153 nm for the UO2 standard 00-041-1422-ICCD).
Dynamic light scattering (DLS) measurements in hexane medium during 80 s of
the dispersed sample of nc-UO2 obtained by thermal decomposition in organic phase,
yielded an hydrodynamic average size of 3.7(1) nm with a polydispersity index (PI) of
0.139. Characteristics of the instrument are shown in Sec. 2.2.2. The size distribution
histogram is shown in Fig. 4.15). The DLS size values correspond well with the values
observed by TEM.
57
Chapter 4. Synthesis of nc-UO2 and nc-ThO2 by a precursor thermal decomposition in Organic phase
Figure 4.12: Size distribution histogram from TEM measurements of UO2 nanoparticles
synthesized by thermal decomposition of UAA in organic media. Diameter average size of
4.9(3) nm.
(a) The scale bar is 50 nm.
(b) The scale bar is 20 nm.
(c) The scale bar is 5 nm. The inset of the figure shows selected area
electron diffraction (SAED).
Figure 4.13: TEM micrographs of UO2 at low resolution, showing an assembly of nanocrystals,
and at high resolution, revealing lattice imaging of the nanocrystals.
4.4.1.2
ThO2 nanocrystals morphology.
In Fig. 4.13 the TEM image of synthesised nc-ThO2 by thermal decomposition in
organic phase is shown. Single crystalline 1±0.5 nm in diameter ThO2 -nanorods
resulted upon precipitation. There is still not full understanding for the reason of the
obtained shape. The precipitate material obtained was quite different in geometry
from the one obtained from the UAA precursor, which was instead almost perfectly
spherical in shape. Different ageing temperatures (290-330°C) and times (1-6 hours),
as well as different precursors (ThAA and ThA) were tested, but the results gained
were always ThO2 -nanorods.
The collected white precipitates presented the typical fcc fluorite structure of ThO2
and were polycrystalline, as shown by the rings of the selected area electron diffraction
(SAED) pattern (inset Fig. 4.16c) and the HRTEM image (inset Fig. 4.17) showing
58
4.4. Characterisation of the as produced nanocrystals.
Figure 4.14: TEM micrograph of UO2 at high resolution, revealing lattice imaging of the
nanocrystals and interplanar distances.
Figure 4.15: Size distribution histogram from DLS test of UO2 nanoparticles synthesized by
thermal decomposition of UAA in organic media. Hydrodynamic average size of 3.7(1) nm.
lattice spacings of an individual nanocrystal. The calculated interference fringe spacing
in the HRTEM image (inset Fig. 4.17) was about 0.322 nm, which was in agreement
with the interplanar distance of the [111] plane in the fcc fluorite structure (0.3232 nm
for the ThO2 standard 00-042-1462-ICCD).
(a) HAADF STEM micrograph.
The scale bar is 20 nm.
(b) The scale bar is 10 nm.
(c) The scale bar is 20 nm. The
inset of the figure shows selected
area electron diffraction (SAED).
Figure 4.16: STEM and TEM micrographs of ThO2 nanorods.
59
Chapter 4. Synthesis of nc-UO2 and nc-ThO2 by a precursor thermal decomposition in Organic phase
(a) The scale bar is 5 nm.
(b) High-resolution TEM image
inset in the figure showing lattice spacings of an individual
nanocrystal.
Figure 4.17: TEM micrographs of ThO2 nanorods at high resolution, revealing the lattice
imaging.
4.4.2
Precipitates crystal structure.
The crystal structures and crystal size of the as-synthesised nc-UO2 particles observed
in the TEM analysis were confirmed by X-ray powder diffraction (XRD). The characteristics of the instrument used are described in Sec. 2.4.1.
4.4.2.1
UO2 nanocrystal structure.
The crystal structure of the nano-precipitates was determined by Rietveld refinement
(Sec. 2.4) using bulk-UO2 as standard. The whole diffraction pattern was taken in
account. The XRD pattern of the UO2 -nanocrystalline sample (Fig. 4.18) exhibited
well defined peaks (considering typical nanoparticle XRD broadness) that could be
indexed to the Bragg reflections corresponding to the standard fcc fluorite structure
(Fm-3m space group) of UO2 (a=0.547 nm for the UO2 standard 00-041-1422-ICCD).
The lattice parameter was a=0.5431(0) nm, with an average crystallite size of 5.52 nm,
in agreement with the average size observed by TEM of 4.9(3) nm. The overall fit
quality as described by the measured R-values and the goodness of the fit (GOF) was
satisfactory (R(expected)/%=4.44, R(profile)/%=4.34, GOF=1.53). All diffraction
peaks showed a small shift to the higher 2θ, which suggests either a slightly higher
oxidation state relative to stoichiometric UO2 , or a mechanical distortion (contraction)
of the lattice due to surface stresses induced by the small particle size [Boswell, 1951]
[Qi et al., 2002] [Fukuhara, 2003] [Park and Qian, 2010].
The Bragg diffraction peak positions and the relative intensities of the refined
XRD pattern obtained for the as-produced UO2 -type nanocrystals is shown in
Fig. 4.19. A comparison of the corresponding Bragg reflections with those of standard
UO2 , U4 O9 and U3 O8 , is also shown in Fig. 4.19. The Bragg reflections of the
synthesized nanocrystals are quite distinguishable from those of the phase U3 O8
and fully compatible with those of the phases UO2 and U4 O9 , though more closer
to the last one. All peaks showed a small shift to the right (higher diffraction
angles (2θ) compared to those of the stoichiometric reference phase. This suggest
60
4.4. Characterisation of the as produced nanocrystals.
Figure 4.18: XRD pattern of nc-UO2 (organic route) experimental data, fitted pattern, Bragg
peak positions and experimental-fitted diference.
a possible higher oxidation state (perhaps even to U4 O9 that has the same fcc structure).
Figure 4.19: Bragg diffraction peak positions and relative intensities for the refined XRD
pattern of nc-UO2 by organic route (green), standard UO2 (00-041-1422-ICCD - red), U4 O9
(01-075-0944-ICCD - blue) and U3 O8 (00-023-1460-ICCD - lila), respectively ([ICCD, 2012]
database).
61
Chapter 4. Synthesis of nc-UO2 and nc-ThO2 by a precursor thermal decomposition in Organic phase
The interplanar distance of the [111] plane in the cubic fluorite structure was
of 0.3140 nm (0.3153 nm for the UO2 standard 00-041-1422-ICCD). Calculated
interference fringe spacing for single crystals in the HRTEM image of 0.315 nm was
obtained (Fig. 4.14).
4.4.2.2
ThO2 nanocrystal structure.
The coincidence with the fcc-ThO2 structure was confirmed. The very broad peaks,
e.g. specially the first one which covered the width of the two first peaks for standard
ThO2 (e.g. [111] and [200], see Fig. 4.20), are a consequence of the extremely small
size of the crystallites.
The XRD pattern of the nc-ThO2 sample (Fig. 4.20) exhibited broad, but well
defined peaks that could be indexed to the Bragg reflections corresponding to the
standard fcc fluorite structure (Fm-3m space group) of ThO2 (a=0.560 nm for the
ThO2 standard 00-042-1462-ICCD). The lattice constant was a=0.5579(1) nm, with
an average crystallite size of 1.42 nm, as obtained by Rietveld refinement (Sec. 2.4)
using bulk-UO2 as standard. The whole diffraction pattern was taken in account.
The overall fit quality as described by the measured R-values and the goodness of
the fit (GOF) was, despite broadness of the peaks, satisfactory (R(expected)/%=2.30,
R(profile)/%=4.04, GOF=3.08).
Figure 4.20: XRD pattern of nc-ThO2 experimental data, fitted pattern, Bragg peak positions
and experimental-fitted diference. Inside picture shows ThO2 nanorods powder as-produced.
Moreover, this structural assignment is consistent with the HRTEM. The interplanar distance of the [111] plane in the cubic fluorite structure was of 0.3269 nm for
the XRD pattern (0.3232 nm for the ThO2 standard 00-042-1462-ICCD). Calculated
interference fringe spacing for single crystals in the HRTEM image of 0.322 nm was
62
4.5. Results and discussion.
obtained (Fig. 4.17b).
4.5
Results and discussion.
An organic route to synthesize UO2 nanoparticles published by [Wu et al., 2006], was
here used. Reduction of surfactant quantities with respect to the metal content, as
well as scale up of the method from 0.1 g of nc-UO2 as reported by [Wu et al., 2006]
to 2.3 g of nc-UO2 , was achieved. The same method was extrapolated for the
synthesis of nc-ThO2 . Thermal decomposition of UAA, ThAA and ThA precursors in
organic media using OAM and OA as reducing and capping agents led to high-quality
monodispersed UO2 nanocrystals and ThO2 rod-shaped nanocrystals. These ThO2
nanorods have been obtained. The reason for the rod-shape is unknown. More studies
changing the OAM/OA ratio, decomposition and incubation temperatures and time
should be done to be able to obtain nc-ThO2 sphere shaped. Batch sizes of 0.3 g
ThO2 nanorods were obtained by this means, i.e. much lower production yield than
in the case of UO2 nanoparticles. Different conditions for the heating rate, ageing
time, ageing temperature and initial precursors (ThAA and ThA) were explored for
the UO2 and ThO2 cases. However, similar results were always found, in terms of the
structure and geometry (round-shaped for nc-UO2 and long shaped for nc-ThO2 ) of
the precipitates.
The structure and morphology of the obtained product, was characterized by means
of TEM, HR-TEM and XRD. Perfectly crystallized solid phases, as studied by XRD,
with the typical UO2 -fcc fluorite structure (Fm-3m space group), with an average
crystallite size (spheres diameter) of 5.52 nm and a lattice parameter of 0.5431(0) nm
were found, also in agreement with the average size observed by TEM of 4.9(3) nm.
Typical ThO2 -fcc fluorite structure (Fm-3m space group), with a crystallite size (rods
diameter) of 1.42 nm and a lattice parameter of 0.5579(1) nm, was found for the
ThO2 nanorods. In both cases, the precipitated nanoparticles were well protected
against flocculation, since no aggregation has been observed on the TEM images.
The diffractogram of the samples corresponded unmistakably to UO2 and ThO2 ,
respectively.
To verify the composition of the precipitates and their propensity to thermal
growth in the unconsolidated state, i.e. on just experiencing stochastic physical
contact, further analysis of the precipitated material was performed by applying
the thermal analytical and X-ray scattering techniques like TG/DTA, HT-XRD and
RT-XRD, spectroscopic techniques as XAS, and characterization techniques like TEM.
The results are detailed and discussed in Chap. 6.
63
Chapter 4. Synthesis of nc-UO2 and nc-ThO2 by a precursor thermal decomposition in Organic phase
64
Chapter 5
Crystallization and Grain Growth in
f(T) for nc-UO2 by Aqueous route
5.1
Generalities.
In this chapter the evolution of the grain size and the crystal structure as a function
of temperature under inert and reducing atmosphere of nc-UO2 precipitated from
aqueous phase (see Chap. 3), have been investigated. The focusing parameters studied
have been the oxidation degree (O/U ratio), the possible water content on the material,
as well as lattice imperfections. Thermogravimetric analysis (TGA) of the samples
provides the starting point for these investigations, enabling the identification of
mass losses at given temperatures. The structure of the material as a function of
temperature under inert and reducing atmosphere, has been identified mainly by
X-Ray Diffraction (XRD) and high temperature X-Ray Diffraction (HT-XRD), but
also by advanced methods including X-ray Absorption Near Edge Structure (XANES),
Extended X-ray Absorption Fine Structure (EXAFS), Magic Angle Spinning Nuclear
Magnetic Resonance spectroscopy (MAS-NMR) and Infrared spectroscopy (IR). All of
these methods provide complementary information, but are also sensitive to different
length scales. With XRD it is only possible to determine structural information on
samples with sufficient long range periodicity, and very poorly ordered or indeed
amorphous phases will not be detected at all. XANES, provides information on the
oxidation state of the cation in favourable circumstances. EXAFS is a local probe
detecting the cations, but samples only the order and bond lengths in the nearest and
next nearest shells. MAS-NMR focuses on the oxygen, and samples doped in 17 O had
to be prepared. Finally, IR spectroscopy, bring information on the chemical structure
of the oxide system.
5.2
Thermal evolution and mass changes as probed
by TGA/DTA.
Thermogravimetry analysis (TGA) and differential thermal analyses (DTA) were
employed under Ar/5%H2 gas at a heating rate of 5°C/min to determine the thermal
decomposition temperature and the water content of the product. The description of
the instrument is provided in Sec. 2.5.
Mass loss and crystallization for the nc-UO2 was monitored by the TGA and
65
Chapter 5. Crystallization and Grain Growth in f(T) for nc-UO2 by Aqueous route
DTA signal and is shown in Fig. 5.1. Upon heating, an almost invisible endotherm
with a maxima around 155°C occurs. This is accompanied by a slight weight loss
of about 2.3 wt% until 207°C, which are most likely attributed to water desorption.
Unfortunately, we were not in a position to identify the desorption products, as
the integration of a mass spectrometer in a glove-box environment for this purpose
presented too many technical difficulties (particularly subsequent maintenance) to
be overcome. The mass loss continues with a further 3% until 600°C, which can be
related to crystallization (perfectionism of the UO2 fcc-structure). This coincides
with the exothermic peak in the DTA at 280°C which reflects this heat realise due to
the crystallization, on further reaction to desorb water. However, there is no reason
to believe that the weight loss did not include as well some loss of oxygen due to
material’s reduction. A deeper analysis on the lattice parameter and crystal growth
under inert and reducing atmosphere has been in the following sections performed to
confirm the latest.
Figure 5.1: TGA and DTA signal for nc-UO2 until 1200°C under Ar/5%H2 .
5.3
Lattice parameter and crystal growth in neutral
atmosphere.
The crystal growth, lattice parameter of the nc-UO2 , has been investigated under inert
conditions (static He atmosphere) using in situ HT-XRD. The effect of temperature
on the crystallite size, which is a fundamental parameter in the sintering process
has been analysed. The in situ HT-XRD patterns were acquired with an instrument
described in 2.4.2. The temperature range explored was 30 to 1200°C at a heating rate
of 5°C/min under a static He atmosphere.
The evolution with temperature of the nc-UO2 XRD pattern is shown in Fig. 5.2
(results presented in [Jovani-Abril et al., 2011]). The observed reflections are assigned
to UO2 -fcc phase structure and to Pt phase corresponding to the heater plate, plus an
impurity peak at around 2θ = 26°. The pattern is similar to the one reported at room
66
5.3. Lattice parameter and crystal growth in neutral atmosphere.
temperature (RT) by [Rousseau et al., 2009]. They reported the impurity peak as Na
polyuranate, coming from precipitation of U(VI) with NaOH. The effect of temperature
on the peaks can be observed more clearly in Fig. 5.2-right, which displays the evolution
of two main peaks (111) and (200) of the UO2 structure. A shift in the peak position to
lower angles is there observed, possibly related to a thermal lattice parameter expansion.
Figure 5.2: In situ HT-XRD patterns of nc-UO2 under He (left). The typical UO2 and Pt
(from the heating plate) Bragg peak positions are also marked. The arrow on down-right
side of the graph shows a residual impurity which disappears with temperature. Evolution of (111) and (200) peaks of UO2 cubic structure as a function of temperature (right)
[Jovani-Abril et al., 2011].
An effect of the temperature is seen in the width of the peaks which decreases with
increasing temperature while the intensity of the peaks increases. Since the contribution
of instrumental broadening is independent of the temperature, the broadening at lower
temperatures is mainly related to the crystallite size and strain present in the material,
as well as increase of the structural order. Both contributions, crystal size (proportional
to cos−1 θ Eq. 5.1) and strain (proportional to tanθ Eq. 5.2), have different angular
dependences, and are so separable. A study of those influences has been in the following
performed.
Kλ
βcosθ
(5.1)
β
4 · tanθ
(5.2)
D=
e=
where D is the average crystallite size, K is a constant (0.87-1) that depends
upon the particle shape and the Miller-indexes (hkl), λ is the wavelength of the radiation, β is the full peak width at half maximum, θ is the Bragg angle and e is the strain.
67
Chapter 5. Crystallization and Grain Growth in f(T) for nc-UO2 by Aqueous route
5.3.1
Grain growth as a function of temperature under neutral
atmosphere.
The effect of temperature on the crystallite size, which is a fundamental parameter in
the sintering process has been here analysed. The crystallite size of the nc-UO2 has
been determined by the XRD Rietveld refinement (see Sec. 2.4) of the Bragg peaks,
and used also to characterize the microstructure of the material.
From these results it is possible to generate a universal representation of the
crystallite size as a function of temperature (XRD measurements done at temperature
with the HT-XRD instrument under static He atmosphere) and reported in Fig. 5.3.
Even though, this information is taken as universal, slight deviations from it may
occur, in particular due to dwell times and temperature ramps, but more importantly
due to the atmosphere of static He during thermal treatment.
Figure 5.3: Evolution of the nc-UO2 crystallite size in function of the temperature
[Jovani-Abril et al., 2011].
At room temperature, the size of the crystallite was about 4 nm after precipitation
Sec. 3.5.1, which is in agreement with previous study by [Rousseau et al., 2009]. The
crystallite size change with temperature shows two domains separated at 700°C (see
Fig. 5.3). Below that temperature, there was a weak influence on the crystallite size
which evolved from 2 to 7 nm (measured in situ at temperature). Above 700°C, the size
of the crystallite increased quasi linearly but drastically with temperature, reaching a
size about 73 nm at 1200°C.
5.3.2
Lattice parameter and linear thermal expansion coefficient as a function of temperature.
The crystal growth of the sample under inert conditions (static He atmosphere) using
in situ HT-XRD, have been already described. In addition, the variation of the lattice
parameter versus crystal size and temperature, as well as data on the linear thermal
expansion, have been reported and compared to bulk material UO2 . The crystal
structure of the precipitates have been, as the crystallite size, determined by Rietveld
68
5.3. Lattice parameter and crystal growth in neutral atmosphere.
refinement, taking into account the whole 2θ range.
In Fig. 5.4a the lattice parameter obtained as a function of temperature (XRDs
measured at temperature and under static He atmosphere) and its derivative (Fig. 5.4b),
have been also determined by the XRD Rietveld refinement of the Bragg peaks, and
represented together with the nc-UO2 size evolution to observe its dependence. Also
calculated lattice evolution of non-stoichiometric standard UO2+x for different O/U
ratios due to only thermal expansion, have been represented for comparison. The
lattice parameter of a non stoichiometric UO2+x is linked to the oxygen content by the
relations of [Lynds et al., 1963]. Also the lattice parameter was corrected in function
of temperature with the [Fink, 2000] relations reflected in Eq. 5.3.
2 ≤ O/U ≤ 2.125
a(nm) = 0.54705 − 0.0094 · O/U
2.1725 ≤ O/U ≤ 2.250 a(nm) = 0.54423 + 0.0029 · (9 − 4 · O/U )
(5.3)
The main change in the lattice parameter occurs between RT and 600°C and
for crystal sizes below 6 nm. The lattice parameter suffers a strong expansion
increasing steeply from 0.5417(1) nm to 0.5492(1) nm at 300°C, and then decreases
to 0.5485(0) nm. Above 600°C, a linear evolution of the the lattice parameter with
temperature is observed.
(a)
(b)
Figure 5.4: a.) Lattice constant and crystallite size variation (curves only as a guide to eye)
of nc-UO2 in function of temperature, from in situ HT-XRD measurements under static He
atmosphere in comparison with lattice evolution in function of temperatures of standard UO2
for different O/U ratios obtained by the relations of [Lynds et al., 1963], due to only thermal
expansion. b.) Relative crystallite size and lattice parameter vs. temperature (curves only as
a guide to eye).
From, the lattice parameter curve in function of temperature, the extrapolated
linear trend up to 600°C is shown by the straight dotted line and described by the
following equation a(nm) = 0.54439 − 0.00007 · T , obtaining a value of the lattice
parameter at 20°C of 0.5445 nm, closer to the lattice of UO2 bulk at RT.
69
Chapter 5. Crystallization and Grain Growth in f(T) for nc-UO2 by Aqueous route
Relating the lattice parameter found in this study with the [Lynds et al., 1963]
relations, a stoichiometry of about UO2.18 up to 600°C to around UO2.17 up to 900°C
has been found, which is similar to the one reported by [Rousseau et al., 2009]. So the
nanocrystallites stabilize at O/U 2.17-2.18 at temperatures above 600°C, or in other
words, at particles sizes higher than 6 nm. A XPS data showing a contribution of
U(VI) and U(IV) in the precipitated particles was reported by [Rousseau et al., 2009].
Based on the lattice parameter determined by XRD, they concluded hence that the
stoichiometry was UO2.19 , thus describing the system as nc-UO2+x and is very similar
to our conclusion, too. However, remark that Eq. 5.3 and other equivalent relations are
valid for bulk compounds; their applicability to nanocrystals may be still open to proof.
Fig. 5.5 displays the linear thermal expansion (LTE) and the thermal expansion
coefficient (LTEC) of nc-UO2 as a function of the temperature. The LTE at temperature
T was calculated using the relation:
LT E =
(aT − a0 ) × 100
a0
(5.4)
where aT is the lattice parameter at temperature T and a0 is the lattice parameter
at 20°C. The LTEC was calculated by differentiating the thermal expansion curve aT
versus T with respect to the temperature T :
LT EC =
δaT
1
×
a0
δT
(5.5)
The LTE of the nc-UO2 is in general higher than the one for bulk-UO2 [Martin, 1988]
for all the interval of temperatures, with a jump at 300°C and a posterior stabilization
above 600°C as one could already predict from the lattice parameter representation in
function of temperature (see Fig. 5.4a).
The LTEC is initially higher for nc-UO2 than for bulk-UO2 for temperatures
below 400°C and tends to stabilize above 600°C with a value of 12 · 10−6 °C−1 in
agreement with the value for the LTEC of bulk-UO2 . The oscillatory trends observable
for LTEC in nc-UO2 at T <900°C can be attribute to transitory oxidation-reduction
effects. At T ≥600°C it is clear that the oxygen content of the material stabilizes (at
O/U 2.17-2.18) (Fig. 5.4a), at the time that the lattice expansion coefficient meets
the value of the reference bulk phase (large grain) (Fig. 5.5). For crystal sizes >6 nm
the nanocrystalline material meets the thermal-expansion behaviour (i.e. thermal
expansion coefficient) of bulk (large-grained) UO2 . This behaviour was already
observed in the representation of the relative lattice parameter (see Fig. 5.4b), and
it shows once more that the ab-normal nano-effects in the material are only to be
expected for particle sizes below few tens of nanometer.
If Fig. 5.6 the patterns comparison of nc-UO2 as-produced (a = 0.5417(1) nm),
nc-UO2 at 1200°C (a = 0.5521(0) nm) and nc-UO2 at RT after thermal treatment at
1200°C (a = 0.5473(0) nm) measured in situ in the HT-XRD instrument under static
He atmosphere, is shown.
There is not explanation for the value seen for the nc-UO2 measured at 1200°C
under static He atmosphere: an O/U ratio close to UO2.17 (see Fig. 5.4a) and the a
70
5.3. Lattice parameter and crystal growth in neutral atmosphere.
Figure 5.5: Linear thermal expansion (LTE) and linear thermal expansion coefficient (LTEC)
of the nc-UO2 (curves only as a guide to eye) in comparison with data of bulk-UO2 from
[Martin, 1988].
Figure 5.6: Patterns comparison of nc-UO2 as-produced, nc-UO2 at 1200°C and nc-UO2 at
RT after thermal treatment at 1200°C measured in situ in the HT-XRD instrument under
static He atmosphere.
lattice parameter of a = 0.5521(0) nm. In contrast, the same thermal treated sample
measured after cooling at RT, shows a value of 0.5473(0) nm (UO2.00 ) very similar
from the typical for bulk-UO2 (0.547 nm). The peaks of the nc-UO2 at RT after the
thermal treatment at 1200°C recover the typical position for standard UO2 (see Fig. 5.6).
So, a recovering of the crystal structure has been achieved with temperature under
71
Chapter 5. Crystallization and Grain Growth in f(T) for nc-UO2 by Aqueous route
static He atmosphere from the initial lattice parameter value of 0.5417(1) nm from
the nc-UO2 as-produced to 0.5473(0) nm after thermal treatment at 1200°C. It might
be related to the static He atmosphere, which resulted in a thermodynamic equilibria
between H2 , H2 O and O2 in the gas phase, favouring H2 during the cool down, thus
this might be the cause.
5.3.3
Lattice strain evolution as a function of temperature.
The mean strain, e, in the material was determined by Rietveld refinement using
the software [HSP-PAN, 2011] and used to characterize the deformation state of the
material. The analysis of the strain by Rietveld refinement method is based on the
change of the profile parameters, compared to a standard sample. Those are depending
on the instrument settings used for data collection and on the profile function used for
the refinement [HSP-PAN, 2011].
The crystallite size change with temperature, already shown in Sec. 5.3.1, was
characterized for two steps separated at 700°C. Below that temperature, there was a
weak influence on the crystallite size which evolved from 2 to 7 nm (measured in situ
at temperature). Above 700°C, the size of the crystallite increased quasi linearly but
drastically with temperature, reaching a size of about 73 nm at 1200°C. In the evolution
of the lattice strain release with temperature, two steps can be observed (Fig. 5.7).
The first step is visible at T <300°C where the strain is at its maximum, which could
be related to the dehydration step (water molecules attached to the nanocrystals and
to the related binding-strength) visible in the TGA/DTA (Fig. 5.1). The second
step is visible in the range 300-700°C where the strain decreases, which could be
related to additional loss of water and oxygen loss (O/U stabilization) and structure
consolidation. Up to 700°C, the internal strain vanishes and the crystallite-size starts
to grow. It is interesting to note that the complete release of the strain in the nc-UO2
coincides with the onset of the starting of the crystallite growth. So the crystallite
growth seems to be limited by the presence of the lattice strain. From RT until 700°C
the thermal energy is totally used to remove the strain and up to that temperature no
strain is remaining and the energy is used for the growing of the nanocrystals.
5.4
Lattice parameter and crystal growth under reducing conditions.
The local structure has been investigated for the nc-UO2 as-produced and after
thermal treatment under reduction conditions (Ar/5%H2 ), by X-Ray Diffraction
(XRD), MAS-NMR, IR and X-ray Absorption Spectroscopy (XAS), and compared to
bulk-UO2 as a reference. A combination of X-ray Absorption Near Edge Structure
(XANES) and Extended X-ray Absorption Fine Structure (EXAFS) was used.
72
5.4. Lattice parameter and crystal growth under reducing conditions.
Figure 5.7: Crystallite size and strain of nc-UO2 in function of temperature. Measurements
done at temperature under static He atmosphere (curves only as a guide to eye).
5.4.1
Crystal size and lattice parameter evolution as a function
of temperature as probed by XRD.
As it has been seen from the HT-XRD, the lattice constant (and crystal size) of the
material in the cooled state (at RT) after reach different maximum temperatures is
needed (see Fig. 5.6). This allows separation of the thermal expansion contribution
in the high-temperature values to obtain cleaner curves for thermal expansion vs.
temperature and lattice dimension vs. crystal size.
At the outset of this study, a higher concerning about the control of the O/U ratio,
which is not simple, appeared. The structural investigations presented in the following,
attempt to eliminate this issue as the samples were heated in Ar/5%H2 to ensure that
the O/U = 2.00. The impact of the heat treatment on the microstructure of nc-UO2 at
different annealing temperatures was then studied under reducing conditions (dynamic
Ar/5%H2 atmosphere). As-produced or RT, 600°C and 1200°C. The corresponding
XRD data are given in Fig. 5.8. A heating rate of 5°C · min−1 under dry Ar/5%H2 and
annealing for 15 minutes were used. At 600°C the major mass loss has already occurred
and no water traces should be present in the material as it has been observed in the
TGA/DTA (Fig. 5.1). As a reference, a standard UO2.0 (μm crystal size) sintered
at 1600°C under Ar/5%H2 for 6 hours and measured during the same measuring
campaign, was also used.
The measurements indicated a well crystallized single cubic phase with a fluorite
structure (Fm-3m). No evidence for orthorhombic or other phase was found. From
the Rietveld refinement of the measured diffractograms, the lattice parameters as well
as the size of the particles were deduced. Reduction of the nc-UO2+x towards nc-UO2
after annealing at 600°C and 1200°C was expected because the high sensitivity of the
lattice parameter, a, to changes in the oxidation state of U in the hyperstoichiometric
range, O/M >2. Samples treated at increasing temperature (RT, 600°C and 1200°C)
73
Chapter 5. Crystallization and Grain Growth in f(T) for nc-UO2 by Aqueous route
with a short isothermal hold of 15 min, exhibit an increase in the lattice constant of
1.02%. Progressing crystallization of the nc-UO2 leaded to periodic ordering of its
atom and the lattice parameter changed from 0.5417(1) nm at RT, to 0.5431(0) nm
and 0.5472(0) nm at 600°C and 1200°C, respectively. The crystal-size increased from
3.79 nm ( 4 nm) as-prepared, to 9.3 nm ( 9 nm) and 82.16 nm ( 82 nm) following
treatments at 600°C and 1200°C, respectively (Fig. 5.8).
Figure 5.8: XRD patterns of reference UO2 and aqueous route nc-UO2 (as-produced, after
thermal treatment under Ar/5%H2 at 600°C and 1200°C)
A comparison of the crystal size and lattice parameter for the samples treated at
600°C and 1200°C under dynamic Ar/5%H2 atmosphere (measurement after cooling)
with those under static He atmosphere measured at temperature (see Fig. 5.4a), is
provided in Table 5.1. No difference in the crystallite size was obtained at 600°C under
either atmosphere. But a notable change is observed at 1200°C, where a crystallite size
of 73.39 nm under He has been observed and a size of 82.16 nm under Ar/5%H2 . Major
differences have been seen in the lattice parameters as a function of the atmosphere
used without ignoring the fact that the values under He were measured at temperature.
These difference in the lattice disappeared once the sample measured at temperature
is measured after cooling, as it has been seen in Fig. 5.6. In the evolution of the lattice
strain, e, a release was again observed with increasing temperatures. After annealing
at 600°C under Ar/5%H2 , just the half of the strain was present being totally released
at 1200°C, as it also happen under He atmosphere.
Fig. 5.9 shows TEM images of the nc-UO2 (about 4 nm size) particles as-produced
and after being thermal treated at 1200°C (about 120 nm size) under Ar/5%H2 . The
TEM size observed after treatment is in good agreement with the average value of
82.2 nm obtained of the Rietveld refinement (Fig. 5.8).
74
5.4. Lattice parameter and crystal growth under reducing conditions.
Table 5.1: Crystal size and lattice parameter for aqueous route nc-UO2 treated at 600°C and
1200°C under two different atmosphere (Ar/5%H2 and He atmosphere)
Ar/5%H2 atm.a
He atm.b
cryst. size lattice param. strain
(nm)
(nm)
(%)
cryst. size
(nm)
lattice param. strain
(nm)
(%)
nc-UO2 RT
3.79
0.5417(1)
0.792
1.99
0.5420(10)
1.149
nc-UO2 600°C
9.30
0.5431(0)
0.391
5.36
0.5483(5)
0.861
nc-UO2 1200°C
82.16
0.5472(0)
0.026
73.39
0.5521(0)
0.004
a.) Measurement after cooling. b.) Measurement at temperature (HTXRD meas.).
(a) nc-UO2 as-produced.
(b) nc-UO2 after 15 min at 1200°C.
Figure 5.9: TEM images for the nc-UO2 as-produced and after thermal treatment under
Ar/5%H2 .
5.4.2
O/M ratio as a function of temperature as probed by
XANES.
XANES was used to determine the oxidation state of U cations and the corresponding
molar fractions and the O/U ratios were derived. The normalized XANES spectra and
the first derivate at the U-L3 absorption edge of three different heated nanocrystalline
UO2 samples (nc-UO2 at RT, 600°C and 1200°C) are shown in Fig. 5.10, together with
the reference spectra of UIV O2 . The experimental features are specified in Sec. 2.2.3.
The associated energies of the inflection point at absortion edge and of the white-line
(WL), as well as the energy shift (ΔE) and the estimated oxidation states derived from
this study, are given in Table 5.2.
A simple observation of the XANES spectra at the U-L3 edge immediately shows a
trend with increasing temperature and as x decreases (UO2+x ). The peak of the WL
shifts slightly to lower energies and increases in intensity, and the within the XANES
regions increase. The amplitude decrease with the increasing temperature of thermal
treatment showing a higher structural order of these samples.
For the samples as-produced (RT) and at 600°C, there is a significant difference
of shape compared to the UIV O2 reference, i.e. presence of a shoulder on the high
75
Chapter 5. Crystallization and Grain Growth in f(T) for nc-UO2 by Aqueous route
energy side of the edge. This feature usually indicates the presence of UV I . According
to [Conradson et al., 2005a], a shoulder appears on the high energy side of the main
peak, ongoing from AnIV to AnV and AnV I (An = Actinides = Th, Pa, U, Np, Pu,
Am, Cm). This is also in agreement with the observed decrease of WL amplitude with
the increasing temperature. The shoulder decreases with temperature meaning that
there is less UV I or that the UIV bulk is more visible as it size increases. A clear shift
(further for the RT sample) of the absorption edge and WL-peak to higher energies,
as well as a broader WL is observed. However the spectra for the UIV O2 reference and
the annealed sample at 1200°C, are remarkably similar, indicating that the electronic
structure of the 82 nm UO2 is essentially that of the bulk UIV O2 at that temperature.
Figure 5.10: Normalized absorption XANES spectra and the first derivate at the U-L3 edge
of the three different heated nc-UO2 samples from Aqueous route (nc-UO2 at RT, 600°C and
1200°C), together with the reference spectra of bulk UIV O2 .
Detailed analysis of the U-L3 XANES spectra and of their first derivate for the RT
sample, show that the energy of the WL shifts 1.8 eV (Table 5.2) to higher energies
in comparison with the reference UO2 (UIV ) spectrum. A shoulder on the right
side of the edge for RT, is observable. It could be expected the sample is the most
cluster like (smaller in size), but in addition the composition is not fully ascribed
to UO2 . The shoulder could be a proof of the presence of UV I . Additionally to the
hyper-stoichiometry, the presence of UV I suggests that water molecules and/or OH
groups would be also present in the RT sample. In those nc-material, the surface is
76
5.4. Lattice parameter and crystal growth under reducing conditions.
superior to the bulk. If there is any adsorbed water molecule, the valence of U is
increased and the XANES spectra is significantly different to the bulk. Molar fractions
of 55% of UIV and 45% of UV I corresponding to a ratio O/M of 2.45 (VU = 4.9)
(Table 5.2), have been deduced for the RT sample according to a linear combination
of UO2 and U3 O8 , as explained in Sec. 2.2.3.
In the 600°C treated sample, the shift of the WL (1.4 eV respecting the UIV O2
reference; Table 5.2), as well as the shoulder (in this case less defined) are toward to
the left in comparison to the RT sample. It indicates a minor presence of UV and UV I
species but still not strictly UIV . An O/M ratio of 2.30 (VU = 4.6) was found for the
sample treated at that temperature, with a molar fraction of 70% of UIV and 30% of
UV I (Table 5.2).
Concerning the 1200°C treated sample, XANES analysis shows no doubt that the
sample has a fluorite structure. No spectrum shift is observed and there is mainly UIV ,
and probably some UV , as there is a slight shift of the inflexion point. An O/M ratio
of 2.025 (VU = 4.05) was in this case found corresponding to a molar fraction of 95% of
UIV and 5% of UV and in agreement with the lattice parameter of 0.5472 nm obtained
at 1200°C by XRD. Also the U-L3 XANES data for the reference UO2 and nc-UO2
treated at 1200°C samples in Fig. 5.10 are very similar to the UO2 data reported
by [Conradson et al., 2005b], [Conradson et al., 2005a]. In particular, a shoulder is
identified at about 17.185 eV, which would indicate that U is stabilized in valence (IV)
for the nc-UO2 at 1200°C treated.
This result is most noteworthy, as this detailed study of bulk UO2+x by
[Conradson et al., 2005a] showed that the energies of these features did not change
in energy as a function of stoichiometry. The results presented in Fig 5.10 clearly
indicate that the 4 nm UO2 particle even after 600°C anneal (9 nm), does not have
the electronic structure of bulk UO2 . At this temperature, a reduction to UIV would
also be expected. XANES reflects the unoccupied electronic structure. In a molecule,
these are well defined energy levels, while in a solid they are bands of a particular
symmetry. One can understand the size effect if one considers this 4 nm UO2 crystals
as a cube with a side length of 4 nm, which is the same of around 7 UO2 -unit cells
(lattice parameter a = 0.547 nm). This cube contains a bulk cube of around 3 nm
length (5 UO2 -unit cells). Thus there are 391 unit cells in total inside the 4 nm
crystal, with 241 (62%) on the surface and 150 in the interior, which one restrains
from calling “bulk”. For the thermal treated samples the percentage of unit cells in
the surface would be 32% at 600°C (9 nm) and 4% at 1200°C (82 nm). This is a crude
representation of the problem, but shows that the material is more like a large cluster
in transition from a large molecule to that of the true bulk. Thus it is not surprising
that the XANES depicts an electronic structure of the nc-UO2 material unique from
the bulk material.
77
78
5.431(0)
5.472(0)
nc-UO2 9 nm 600°C
nc-UO2 82 nm 1200°C
17169.6
17170.7
17171.8
17168.7
(eV )
17174.9
17176.3
17176.7
17174.9
(eV )
0.0
1.4
1.8
-
(eV )
ΔEb
4.05
4.60
4.90
4.00
(VU )
U valency
U
95
70
55
c
(%)
100
IV
5
-
-
-
c
U (%)
V
molar fraction
U
-
-
30
c
(%)
45
VI
2.025
2.300
2.450
2.000
O/M
a.) by XRD (see Fig. 5.8). b.) (ΔE = WLsample - WLref. ). c.) According to a linear combination of UO2 (pure UIV ), U4 O9 (mixture of UIV and UV ) and U3 O8
(mixture of UIV and UV I ). d.) under Ar/5%H2 .
5.417(1)
5.472(0)
nc-UO2 4 nm RT
Samples:
UO2
Reference:
(Å)
a
lattice param. inflection point energy WL
Table 5.2: Results from the analysis of the UO2+x XANES data at the U-L3 edge.
Chapter 5. Crystallization and Grain Growth in f(T) for nc-UO2 by Aqueous route
5.4. Lattice parameter and crystal growth under reducing conditions.
5.4.3
Order and disorder probed by local methods, as DebyeWaller EXAFS, NMR and FTIR, as a function of crystal
size.
5.4.3.1
Local structures as probed by Debye-Waller EXAFS distances.
The k3 -weighted EXAFS spectra and the corresponding Fourier transforms (FT) at
the U-L3 edge for the experimental data of UO2 nanocrystals at different temperatures
annealed, and UIV O2 -bulk reference, are shown in Fig. 5.11. The experimental features
are specified in Sec. 2.2.3. The fitted k3 -weighted EXAFS spectra and their associated
Fourier transforms are presented in Fig. 5.13. Also the structural parameters derived
from analysis of the EXAFS data, as the coordination number (CN ), interatomic
distance (R), Debye-Waller (DW) factor (σ 2 ) and shift of the threshold energy (ΔE0 ),
are provided in Table 5.3.
Table 5.3: Results from the analysis of the aqueous method synthesised nc-UO2+x EXAFS
data at the U-L3 edge.
U-O1
CN
Reference UIV O2
k-range = 1-15 Å−1
R-range = 0-8 Å
f
8
U-U1
R
(Å)
σ2
(Å2 )
2.34 0.008
(1)
CN
f
12
U-O2
R
(Å)
σ2
(Å2 )
3.85 0.005
(1)
CN
f
24
σ2
(Å2 )
Rf
(%)
4.49 0.009
(1)
2.1
R
(Å)
Samples nc-UO2
4 nm RT
k-range = 3-8 Å−1
R-range = 1-3 Å
f
8
9 nm 600°C
k-range = 3-9 Å−1
R-range = 1-4.5 Å
f
8
82 nm 1200°C
k-range = 3-12 Å−1
R-range = 1-6 Å
f
8
2.26 0.027
(2)
2.27 0.026
(2)
2.34 0.008
(1)
f
12
f
12
-
-
3.82 0.014
(3)
3.85 0.005
(1)
-
-
-
4.7
-
-
-
4.1
f
24
4.50 0.010
(1)
2.9
Coordination number (CN ), interatomic distance (R), Debye-Waller (DW) factor (σ 2 ), fix parameters
(f ), goodness of fit (Rf ).
In the k3 -weighted spectra (Fig. 5.11a), the oscillations and their amplitude
increases with thermal treatment. The 4 nm as-precipitated sample was very difficult
to fit with a pure fluorite structure, as the fit were non stable and the data noisy. The
oscillations are very quickly dampened and a small k-range = 3-8 Å−1 could be treated.
The intensity of the FT was very low limiting the interpretation of the coordination
shell to U-O1 . The FT at the U-L3 edge for the experimental data of nc-UO2 at
different temperatures annealed and UIV O2 bulk reference, are shown in Fig. 5.11b.
Probably several U-O distances are present in the first shell, not only corresponding
to fluorite distances as the values were very low. Observing the EXAFS results in
Table 5.3, the data are heavily dampened at RT where a large value for the DW factor
has been found (σ 2 = 0.027 Å2 ), meaning a significant static disorder (the atoms are
randomly displaced from their positions) for the nc-UO2 as-produced. Shorter distance
79
Chapter 5. Crystallization and Grain Growth in f(T) for nc-UO2 by Aqueous route
(a) Experimental k3 -weighted spectra.
(b) Experimental Fourier Transform.
Figure 5.11: a.) k3 -weighted spectra and b.) Fourier Transform at the U-L3 edge for the
experimental data of nc-UO2 (aqueous route) at different temperatures annealed and UIV O2
bulk reference.
80
5.4. Lattice parameter and crystal growth under reducing conditions.
(2.26 Å) for the oxygen shell (U-O bond length) is clearly observable for the nc-UO2 at
RT which does not correspond to any U-oxide. According to the shape of the first FT
peak, it looked like there were two or three U-O distances instead of one. This is consistent with the observed lattice contraction (0.5417 nm) from XRD at RT (see Table 5.2).
The 9 nm sample (600°C anneal) shows an intermediate ordering with oscillations
clearly identified and extending to k = 9 Å−1 . The intensity of the FT was also low for
this annealed sample, limiting the fitting and interpretation of the coordination shell
to U-O1 and U-U1 together with UO2 fluorite structure. Still a large value for the DW
factor (σ 2 = 0.026 Å2 ) has been found (Table 5.3). Shorter distance (2.27 Å) is also
present for the oxygen shell (U-O bond length) in comparison with the reference-UIV O2
(2.34 Å). However the U-U1 bond length (3.82 Å) is closer to that of the bulk-UIV O2
(3.85 Å), suggesting that the U-U1 lattice is more ordered than the O anion sublattice.
The U-U1 lengths were consistent with the less lattice contraction (0.5431 nm), in
comparison with the nc-UO2 as-produced, as probed by XRD at 600°C anneal (see
Table 5.2).
Ultimately, at 1200°C and 82 nm, EXAFS oscillations are similar, if not entirely
matching, those of the bulk-UIV O2 indicating same fcc-structure consolidation and
substantial particle growth, both observed in XRD measurements (see Fig. 5.12). Both
shells were well fitted with Fm-3m structure for this sample (see Fig. 5.13) and very
similar distances to reference UIV O2 structure can be observed according to the FT
(k-range treated = 3-12 Å−1 ). That is in agreement with the similarity for the XRD
data for the annealed sample at 1200°C and the bulk-UIV O2 (see Fig. 5.8). Also
consistent with the XANES (see Fig. 5.10) showing no different oscillation from the
fluorite structure.
Figure 5.12: Comparison between experimental data from nc-UO2 annealead at 1200°C and
UIV O2 reference of (left) k3 -weighted spectra and (right) Fourier Transform at the U-L3 edge.
In Fig. 5.14 the U-O1 and U-U1 bond distances have been represented in function of
the annealing temperature and finale size of the nc-UO2 sample. Both bond distances,
U-O1 and U-U1 , stay shorter and it is just first for the 82 nm and 1200°C annealed
particles when they recover the typical distances of the reference UIV O2 (2.34 Å and
3.85 Å for U-O1 and U-U1 , respectively) .
81
Chapter 5. Crystallization and Grain Growth in f(T) for nc-UO2 by Aqueous route
Figure 5.13: Experimental () and fitted data (−) for the nc-UO2 annealead at 1200°C of
(left) k3 -weighted spectra and (right) Fourier Transform at the U-L3 edge.
Figure 5.14: U-O1 and U-U1 bond distances in function of the annealing temperature (under
reducing conditions) and finale size of the nc-UO2 sample (curves only as a guide to eye).
5.4.3.2
Local structure and valence state as probed by MAS NMR.
The Hahn-echo 17 O MAS spectra acquired for various annealing times (600°C, 650°C,
700°C, 800°C and 1200°C) are presented in Fig. 5.15 and some fits in Fig. 5.16 and
Fig. 5.17. The experimental features are specified in Sec. 2.2.4. The spectrum of the
200°C annealed sample was acquired at 10 kHz (as a 1.3 mm probe was not available
at this time) therefore its analysis has to be done apart from the whole series and has
been not here represented. In fact, as these compounds are paramagnetic the 17 O shift
depends on the spinning speed which induces a slight heat of the sample. Nevertheless,
another study on bulk-UIV O2 (done in ITU to be published) shows that the variation
in the peak position is not very important between 10 kHz and 55 kHz (∼10 ppm,
small compared with the peak broadening). Thus, the shift of 1075 ppm (200°C) can
be compared with that extracted for these series (Fig. 5.18). At the contrary, the
broadening of the peak cannot be compared with that of the others heat treatment as
the Full Width at Half Maximum (FWHM) will decrease with spinning speed due to
the removing of paramagnetic shift anisotropy.
For the next temperature of 600°C, a broad peak of 2478 ppm has been identified
82
5.4. Lattice parameter and crystal growth under reducing conditions.
Figure 5.15: Stack of the
17 O
MAS-NMR for nc-UO2 annealed at five different temperatures.
at 962 ppm (Fig. 5.16a). By increasing the temperature of only 50°C (at 650°C;
Fig. 5.16b), the MAS spectrum of the sample exhibits two peaks at 932 and 723 ppm.
On the static spectrum acquired with more scans a third peak (not here represented)
can be identified at nearly 960 ppm. The position of this peak can be relatively
compared with that of the spinning spectrum while the FWHM cannot. At 700°C
(Fig. 5.17a), there are still three peaks and the peaks at 732 and 738 ppm are now
sharpest. For the two last heat treatments, 800°C (Fig. 5.17b) and 1200°C (Fig. 5.17c),
only two peaks with very closed shifts are identified.
Two trends are observed in the plots of the shifts and the FWHM as a function of
temperature presented in Fig. 5.18. Under 700°C, the shift and the FWHM decrease
abruptly while above this temperature they are relatively constant. It can be noticed
that the shift extracted from the spectrum acquired at 200°C is very different from
that of the whole series. Due to the broadness of the peak, the presence of more
than one species cannot be excluded. A similar trend was observed by XRD for the
evolution of the lattice parameter as a function of temperature (Fig. 5.4). In fact,
it increase steeply under 700°C, then there is only a week evolution. Therefore, it
seems that under this temperature there are important changes on long and short range.
Three different oxygen environments can be identified. The first one corresponds
to oxygens having a chemical shift of nearly 900 ppm (named peak C, green peak).
These peaks have been identified up to 650°C. At 650°C, even if the peak is sharpest,
the shift is very similar to that of the 600°C sample and therefore the 17 O will be
considered as the same type of species. Due to the broadness of the peak, it is tempting
to attribute this one to 17 O in a disordered environment. But, XRD has shown that
83
Chapter 5. Crystallization and Grain Growth in f(T) for nc-UO2 by Aqueous route
*
5000
4000
3000
*
2000
17O
1000
0
-1000 -2000 -3000 -4000
Chemical Shift (ppm)
(a) 600°C
5000 4000 3000 2000 1000 0 -1000 -2000 -3000 -4000 -5000
17O Chemical Shift (ppm)
(b) 650°C
*
2000
*
1000
0
17O Chemical Shift (ppm)
-1000
-2000
(c) 700°C
Figure 5.16: Characteristic fits for the spectra of the samples annealed at 600°C, 650°C and
700°C (∗ = spinning sidebands; peak A = black; peak B = blue; peak C = green)
84
5.4. Lattice parameter and crystal growth under reducing conditions.
*
*
2000
1000
0
17O Chemical Shift (ppm)
-1000
-2000
(a) 700°C
*
900
*
800
17O
700
600
Chemical Shift (ppm)
500
400
(b) 800°C
800
780
760
17O
740
720
700
Chemical Shift (ppm)
680
660
640
(c) 1200°C
Figure 5.17: Characteristic fits for the spectra of the samples annealed at 700°C, 800°C and
1200°C (∗ = spinning sidebands; peak A = black; peak B = blue; peak C = green).
85
Chapter 5. Crystallization and Grain Growth in f(T) for nc-UO2 by Aqueous route
for this range of temperature the size of the UO2 is around 10 nm (Fig. 5.8 under
Ar/5%H2 ). Moreover, previous experiments done on zeolites [Zhang et al., 1999] have
shown that there is an increase of the linewidth of the quadrupolar nucleus (in that case
27
Al) with decreasing size of nanoparticles. Indeed, according to [Casabella, 1964] for
well-crystallized samples the NMR linewidth is greatly influenced by the quadrupolar
coupling constant which is due to the local electric field gradients in the sample. The
strong surface energy existing on the surface of the small particles will lead to more
strain in the lattice, consequently causes the broadening of the main peak of the
quadrupolar line. Thus, it can be proposed that this type of oxygen correspond to the
17
O in nanocrystals UO2 . Nevertheless, due to the broadness of the peak, presence of
other 17 O species cannot be excluded.
Figure 5.18: Evolution of the 17 O shift (left) and of the full width at half maximum (right)
as a function of crystallite size for various temperatures.
The two second types of species appear clearly from 650°C (Fig. 5.18). There is
one sharp and one broad (they will be named peaks A and B respectively thereafter).
These peaks were fitted using a Lorentzian for A (black peak on Fig. 5.16 and Fig. 5.17)
and a Gaussian for B (blue peak on Fig. 5.16 and Fig. 5.17) and could be respectively
attributed to 17 O in a crystalline phase and in a more disordered one. It can be
added that these two peaks are also observed at 1200°C meaning that even for this
temperature it is not stoichiometric UO2 contrary to that suggested by XRD (Fig. 5.8).
With increasing temperature (increasing of crystallite size), the FWHM of the two
peaks decrease (Fig. 5.17). As previously explained, this is the signature of such
crystallite size evolution. Moreover, the shift of peak A reached a minimal value of
717 ppm at 1200°C. This one is close of the 717 ppm found for UIV O2 -bulk. Its FWHM
is of 5 ppm and corresponds to that of the crystallite having a size about 80 nm. This
86
5.4. Lattice parameter and crystal growth under reducing conditions.
value is still slightly bigger than the 3 ppm found for UIV O2 -bulk. Hence, with the
shift of peak A one can say that the environment around the oxygens corresponding to
the biggest crystallite size (80 nm) is very close to that of UIV O2 -bulk. Based on the
FWHM, one can say that to observe the signal of crystalline UO2 a size above 80 nm
should be reached. This confirms that nc-UO2 are obtained and this is consistent with
the lattice parameter observation of 0.5472 nm (Fig. 5.8).
5.4.3.3
Local structure and valence state as probed by FTIR.
Several samples at the key temperatures were analyzed under the Fourier Transform
Infrared (FTIR) spectrometer (Alpha FT-IR Spectrometer from Brucker; Sec. 2.2.5).
The infrared (IR) spectra recorded for nc-UO2 as-produced (RT), at 200°C, 600°C and
1200°C under Ar/5%H2 annealed, as well as UIV O2 reference spectra, are shown in
Fig. 5.19.
In the case of nc-UO2 as-produced (RT), four peaks in the range 400-4000 cm−1
were observed. The absorption band for the U-O vibration in UO2 shows up below
400 cm−1 which is out of the detection limit of the equipment. The peak at 1625 cm−1
can be assigned to the bending vibration of H-O-H bonds of the coordinated water
[Fujita et al., 1956], [Sailaja et al., 2002]. This peak disappears already at 200°C. That
would be in agreement with the TGA (Sec. 5.2), were nearly no loss of weight was
observable after 600°C (see Fig. 5.1). Something similar occurs to the broad absorption
peak at 3400 cm−1 , which can be ascribed to the asymmetric and symmetric stretching
vibrations of the H-O-H bonds of coordinated water. However, this peak reduces for
the 200°C and is nearly disappeared at 600°C annealed sample. So at 600°C all the OH
would be theoretically gone taking into account the peaks at 1625 cm−1 and 3400 cm−1 .
However, the peak at 880 cm−1 corresponding also to OH groups, stay still present
at 600°C, totally disappearing at 1200°C (Fig. 5.19). The same occurred for the peak
at 638 cm−1 corresponding to more oxidised species (UO2+x ) [Kim et al., 2009]. That
could be an artefact due to the small size still present at 600°C (9 nm) (see Table 5.1).
At 1200°C the IR spectra looks like the one for the UIV O2 reference and grains are
about 82 nm (Table 5.1).
That is also in agreement with the results obtained by XANES where a different
electronic structure at 600°C was observed, meanwhile at 1200°C a similar structure
to bulk-UIV O2 was found (see Table 5.2). Also EXAFS is characterized for a poor
ordering at 600°C but entirely matching with the bulk-UIV O2 oscillation pairs at
1200°C (see Table 5.3). In the NMR analysis all the additional oxygen sites disappeared
once at 1200°C anneal but one which could be due to a surface effect.
87
Figure 5.19: Infrared spectra recorded for nc-UO2 as-produced (RT), at 200°C, 600°C and 1200°C under Ar/5%H2 annealed. Reference spectra for UO2 is
also represented. Inside amplification of the infrared spectra showing the disappearing of the peaks at 1625 cm−1 and 3400 cm−1 with increasing annealing
temperatures.
Chapter 5. Crystallization and Grain Growth in f(T) for nc-UO2 by Aqueous route
88
5.5. nc-UO2 long-isothermal grain growth as probed by XRD under neutral and reducing conditions.
5.5
nc-UO2 long-isothermal grain growth as probed
by XRD under neutral and reducing conditions.
The as-produced nanocrystals presented a certain disorder and lattice strain which
disappeared with the anneal of the samples, evolving to ordered crystalline structures
as temperature increased. This has been proved for shorter time heat treatments
under inert and reducing atmospheres (Table 5.1). Normally, ceramic heat treatments
to obtain high dense monoliths finish up with grain sizes above 200 nm. Hence,
isothermal grain growth kinetics at a given temperature is an essential component to
determine the final grain size, and in consequence to evaluate the performance of such
an innovative nuclear fuel after prolonged insertion at high temperatures. Although
nuclear fuel operates at about 500°C at the periphery it can reach 1200°C at the
fuel pellet centre. For that reason, it is fundamental to examine the behaviour of
nano-fuel microstructure as a function of the time in a possibly wide temperature range,
to ensure lack of disproportionate grain growth even at the highest temperature in play.
A study of the thermal growth of those nanocrystals over the whole range of initial
microstructures from amorphous to fully nanocrystalline was performed. Based on
Fig. 5.3, the critical temperatures 500°C, 700°C, 900°C and 1200°C were selected.
Isothermal grain growth data at these temperatures was determined from in-situ
HT-XRD measurements under static He atmosphere and annealing times from 0 to
50 h with a heating rate of 5°C/min. The data are shown in Fig. 5.20. Independent
sample treatments in separate furnaces under dynamic Ar/5%H2 for dwelling times of
50 h, 100 h and 200 h, were also performed. For each isothermal dwell temperature
one new sample was chosen. Comparison of the size and lattice parameter obtained for
the both routes, are shown in Table 5.5.
Figure 5.20: Isothermal grain growth of nc-UO2 under He static atmosphere. For each isothermal dwell temperature one new sample was used. Measurement was done in situ in the HTXRD device at temperature. All the curves have been fit using the Eq. 5.6. For the one at
1200°C a fit using the Eq. 5.7 was also done.
The in situ HT-XRD determination of the crystallite size was done under static He
atmosphere. The experimental installation did not permit the use of Ar/5%H2 gas in
89
Chapter 5. Crystallization and Grain Growth in f(T) for nc-UO2 by Aqueous route
the HT-XRD chamber, which would have been necessary to preserve the O/U ratio of
the sample at a value around 2. The measurements were taken at temperature. The
crystallite size was determined according to inverse of the width of the first diffraction
peak [111], which was monitored during 50 h while the sample was kept at constant
temperature. From these measurements information on crystal growth as a function
of temperature and time was obtained (Fig. 5.20). Posterior XRD-measurement on
consideration of the whole diffractogram after 50 h dwell time at temperature and
once the sample was cooled down, was also done (Table 5.5). This final measurement
provided data on crystal size without thermal broadening, but characteristic of the O/U
final ratio that was obtained under He atmosphere. The measurement of the ex-situ
annealed samples was done under a dynamic Ar/5%H2 atmosphere which ensured a
final stoichiometry UO2.0 (UIV ). The measurement was always done after-cooling.
Fig. 5.21 shows how grain growth takes place in the first hours of isothermal hold
for the temperatures at 500°C, 700°C and 900°C until a stable average grain size below 100 nm is established at the applied temperature, at which time crystal growth
ceases. This kind of self-limited grain growth was reported by [Rupp et al., 2006] and
is described by the following relaxation function:
−t
G − G0 = (GL − G0 ) · (1 − e τ )
(5.6)
where G is the average grain size, G0 is the initial grain size, GL is the limited grain
size (when the grains stop to grow) and τ is the relaxation time (time needed to reach
the GL ). The values of GL and τ obtained from the fitting described by the relaxation
function Eq. 5.6, are presented in Table 5.4.
Figure 5.21: Isothermal grain growth of nc-UO2 under He static atmosphere. For each isothermal dwell temperature one new sample was used. Measurement was done in situ in the
HT-XRD device. All the curves have been fit using the Eq. 5.6.
The diffusion coefficient, Di , have been so calculated by substitution of the values G0 ,
GL and τ above determined, in the corresponding approximation by [Rupp et al., 2006]
(Eq. 5.7). Afterwards, the activation energy of diffusion, Qdif f , has been obtained
as a function of isothermal dwell temperature using the Arrhenius law dependence
90
5.5. nc-UO2 long-isothermal grain growth as probed by XRD under neutral and reducing conditions.
[Löffler and Johnson, 2000]:
Di =
Q
(GL − G0 )2
− dif f
= const · e kB T
4·τ
(5.7)
where kB is the Boltzmann constant (kB = 8.6173324 · 10−5 eV · K −1 ). The
different parameters obtained for the fitting at each temperature, are shown in
Table 5.4.
Table 5.4: Parameters obtained from the fits following the relaxation equation Eq. 5.6 for the
samples annealed under He static atmosphere during 50 h.
T (°C)
nc-UO2 500°C
G0 (nm) GL (nm)
5.41
τ (h) Di (m2 /s)
15.51
R2
9.65
7.34e−22
0.72
−20
0.87
nc-UO2 700°C
5.41
48.21
4.10
3.10e
nc-UO2 900°C
5.41
91.99
0.90
5.80e−19
0.90
−19
0.66
nc-UO2 1200°C
5.41
363.55
18.13
4.91e
Starting grain size (G0 ), limited grain size (GL ), relaxation time (τ ), diffusion coefficient (Di ) and
(R2 ) correlation coefficient obtained from the fitting.
The determined kinetics parameters depend on the temperature. The Di values
increase with temperature, meanwhile the relaxation time (obtained from the fitting
with Eq. 5.6) diminishes with it (Fig. 5.22). Differently, for the sample annealed at
1200°C a much higher relaxation time (see Table 5.4) has been obtained, not following
the decreasing trend with temperature observed for the rest of the dwell temperatures
examined (Fig. 5.22). For this sample the grains seem to continue to grow following the
generalized grain growth equation (Eq. 5.8) as already observed by [Rupp et al., 2006]
for temperatures above 1100°C and expressed as:
Gn − Gn0 = kn · t
(5.8)
Qdif f
where n is the growth exponent and kn is a rate constant (kn = k0 · e− RT with k0 =
constant, Qdif f = activation energy of diffusion, R= gas constant and T = absolute
temperature).
For the nc-UO2 annealed at 1200°C a grain growth exponent n of 2.36 was obtained
with a correlation coefficient of 0.77 using the Eq. 5.8. The fitting curve is shown
in blue colour in Fig. 5.20. A final grain size of about 350 nm after 50 h is also
under this mechanism obtained. This is in agreement with the range of values of
traditional grain growth mechanisms (n =2-4), and in particular the parabolic grain
growth mechanism (n =2.362) [Rupp et al., 2006]. The fitting line shown in pink
colour, with a correlation coefficient of 0.66, corresponds to the relaxation function
above described (Eq. 5.6), which better fits the grain growth kinetics at the lower
temperatures examined (T≤900°C).
From Fig. 5.23 an activation energy of diffusion of 0.93 eV with a correlation
coefficient of 0.90 was determined for the temperature range 500-1200°C (considering
91
Chapter 5. Crystallization and Grain Growth in f(T) for nc-UO2 by Aqueous route
Figure 5.22: Grain growth relaxation time as a function of dwell temperature for the nc-UO2
samples annealed under He static atmosphere during 50 h. Fit obtained excluding the value
at 1200°C.
the fits following the relaxation equation Eq. 5.6). Taking away the value of Di for the
temperature of 1200°C (considering that the curve follows the generalized grain growth
equation Eq. 5.8 instead of relaxation equation Eq. 5.6 as at lower temperatures),
an activation energy of 1.25 eV with a correlation coefficient of 0.99 was obtained
(Fig. 5.23). These low activation energies, including or not the Di at 1200°C, could
be related predominantly to grain boundary (surface and interface) diffusion, as the
volume diffusion contribution appears at higher activation energies, namely above 4 eV
[Sabioni et al., 1998].
Figure 5.23: Diffusion coefficient Di (m2 /s) as a function of temperature for the nc-UO2 samples annealed under He static atmosphere during 50 h. Fit obtained excluding the value at
1200°C.
Comparing values measured after cooling under He atmosphere and under Ar/5%H2
atmosphere (see Table 5.5), a noticeable difference in the size of the crystals is seen for
same dwelling times of 50 h being bigger for the samples heated under He environment.
92
5.6. Results and discussion.
This difference increased with the dwell temperature. Something interesting is that
even under inert atmosphere (He), the lattice parameter increases quicker than
under a reducing atmosphere (Ar/5%H2 ) until 700°C. However, at 900°C the lattice
parameter under Ar/5%H2 is already the typical for bulk UO2 , while for treatments
under He atmosphere that value (0.5472 nm) is reached at 1200°C. This suggests
that in treatments under He environment the samples remain possibly longer time
hyperstoichiometric.
Table 5.5: Crystal size and lattice parameter for samples treated at different temperatures,
times and under different atmosphere.
500°C
nc-UO2
50 h He
a
50 h Ar/5%H2
b
700°C
900°C
1200°C
size
(nm)
lattice
(nm)
size
(nm)
lattice
(nm)
size
(nm)
lattice
(nm)
size
(nm)
lattice
(nm)
18
0.5457
64
0.5462
128
0.5468
322
0.5472
6
0.5426
13
0.5442
49
0.5472
85
0.5472
100 h Ar/5%H2
b
6
0.5428
13
0.5456
49
0.5472
-
-
200 h Ar/5%H2
b
-
-
14
0.5456
49
0.5472
150
0.5472
All the measurements were done after cooling. a.) He static atmosphere. b.) Ar/5%H2 dynamic
atmosphere.
Generally, if UO2 is hyperstoichiometric the self-diffusion coefficients increase
steeply. The cation mobility raises due to the increase in cation vacancy concentration
[Kutty et al., 2004]. In the same way, in the hyperstoichiometric range, there is a
strong increase of the mass-flow, the grain-boundary motion and the grain (or crystal)
growth. As example, the large-grain UO2 pellets are produced ordinarily using slightly
oxidising atmosphere (NIKUSI process [Maier et al., 1982]). This could explain the
boosted crystal growth observed at 900°C and 1200°C under He atmosphere, in comparison with a nc-UO2 sample treated Ar/5%H2 atmosphere at the same temperature
and time (50 h).
In Fig. 5.24, the Arrhenius diagram comparing the cation self-diffusion in UO2
fluorite-structure from large-grain reported by [Matzke, 1987] and nano-grain from this
study (samples annealed under He static atmosphere during 50 h), has been plotted.
Tm is the melting temperature (TmU O2 = 3140°K). Between 20 orders of magnitude
difference at 500°C (lattice parameter =0.5457 nm; average grain size =18 nm) and
5 at 1200°C (lattice parameter =0.5472 nm; average grain size=322 nm) have been
found for the diffusion coefficients between bulk-UO2 [Matzke, 1987] and nc-UO2 of
this study (Table 5.5). Differences in the diffusivity in the grain boundaries between
micro- and nano-grain have been already seen in other fluorite-structured metal oxides
[Martin, 2007]. In fact, the differences in the diffusion coefficients between bulk- and
nc-UO2 are compatible with an enhancement of the diffusion processes either by grain
size-effects or by oxidation (O/U>2) effects.
5.6
Results and discussion.
The synthesis of nc-UO2 with controlled oxidation state and crystal size is essential
because the chemical and physical properties depends of its adjustment just as for
93
Chapter 5. Crystallization and Grain Growth in f(T) for nc-UO2 by Aqueous route
Figure 5.24: Arrhenius diagram comparing the cation self-diffusion in UO2 fluorite-structure
from large-grain ([Matzke, 1987]) and nano-grain of this study (samples annealed under He
static atmosphere during 50 h). Tm is the melting point temperature (TmU O2 =3140 °K).
other nanomaterials. To verify the composition of the precipitates and their propensity
to thermal growth in the unconsolidated state, on just experiencing stochastic physical
contact between particles, further analysis of the precipitated material annealed at
different temperatures was then performed [Burda et al., 2005]. The evolution of the
grain size and the crystal structure, which are fundamental parameters in the sintering
process, as a function of temperature under inert and reducing atmosphere of nc-UO2
precipitated from aqueous phase (see Chap. 3), was here investigated. Analysis of the
precipitated material was performed by applying the thermal analytical and X-ray scattering techniques like TGA/DTA, XRD, HT-XRD, spectroscopic techniques as XAS,
NMR and IR, as well as characterization techniques like TEM. The target parameters
studied have been the oxidation degree (O/U ratio), the possible water content on the
material, as well as the lattice imperfections as a function of the annealing temperature.
TGA and DTA were employed under inert atmosphere (Fig. 5.1). The weight
loss observed was most likely attributed to water desorption and to crystallization
(completion of the UO2 fcc-structure). However, there was no reason to believe that
the weight loss did not include as well some loss of oxygen due to reduction of the
material. A deeper analysis on the lattice parameter and crystal growth under inert
and reducing atmospheres was then performed to confirm the latest.
The evolution of the crystallite size, the lattice parameter, and the strain were
determined from ambient temperature up to 1200°C under inert atmosphere using the
in situ HT-XRD (Fig. 5.2). Below 700°C, a weak effect on the crystallite size occurred
and it remained below 7 nm, while a strong expansion of the lattice parameter was
measured (Fig. 5.4). A value of 0.5521 nm in the lattice parameter for the nc-UO2
at 1200°C annealed and measured in situ in the HT-XRD instrument under static He
atmosphere, was observed. The same thermal treated sample measured after cooling at
RT, showed a value of 0.5473 nm (UO2.00 ) very similar from the typical for bulk-UO2
(0.547 nm) (Fig. 5.6). A recovering of the UO2 typical crystal structure was achieved
94
5.6. Results and discussion.
with temperature under static He atmosphere from the initial lattice parameter value
of 0.5417 nm from the nc-UO2 as-produced to 0.5473 nm after thermal treatment
at 1200°C (measurements done after cooling). It might be related to the static He
atmosphere, which resulted in a thermodynamic equilibria between H2 , H2 O and O2 in
the gas phase, favouring H2 during the cool down, thus this might be the cause.
The change in the lattice parameter with the crystallite size has been oft published
[Boswell, 1951], [Fukuhara, 2003], [Boswell, 1951], [Qi et al., 2002], [Fukuhara, 2003],
[Park and Qian, 2010], [Qi et al., 2002]. This effect is associated to the band structure and therefore to the physical properties changes occurring as the dimension
of the system diminishes [Jovani-Abril et al., 2011]. Both, lattice expansion and
contraction with the decreasing of the crystallite size have been in the literature observed. The first one has been seen mainly for transition metal oxides
as α-Fe2 O3 [Ayyub et al., 1995], CeO2−x [Spanier et al., 2001] [Wu et al., 2004]
[Deshpande et al., 2005] NiO [Fiévet et al., 1979], TiO2 rutile [Li et al., 2004], and
MgO [Cimino et al., 1968]. On the other side, lattice contraction at small crystallite size
is mainly assigned to metals or metalloid systems like Au, Pt [Solliard and Flueli, 1985],
[Vermaak and Kuhlmann-Wilsdorf, 1968], Cu [Wasserman and Vermaak, 1972], Pd,
Sn, and Bi [Sun et al., 1999]. But also exceptions can be found in literature. A
lattice expansion with Ni particle size decrease, despite being a metal, has been
observed [Wei et al., 2007], while for the oxide TiO2 anatase [Li et al., 2005], a lattice
contraction with size decrease was noticed as the one found for the here synthesized
nc-UO2 [Jovani-Abril et al., 2011].
The LTEC (Fig. 5.5) was initially higher for nc-UO2 than for bulk-UO2 for temperatures below 400°C and tended to stabilize (at O/U 2.17-2.18) above 600°C (crystal
sizes >6 nm), when the nanocrystalline material met the thermal-expansion behaviour
(i.e. thermal expansion coefficient) of bulk (large-grained) UO2 . That showed once
more that the ab-normal nano-effects in the material was only to be expected for
particle sizes below few tens of nanometer. The oscillatory trends observable for LTEC
in nc-UO2 at T <900°C could be attributed to transitory oxidation-reduction effects.
The LTEC in nc-materials is one of the physical properties related to the ncinterfaces and it is subjected to anharmonic crystal lattice vibrations [Kittel, 1996].
The nc-materials are formed of a crystal core and an interface. The LTEC is enhanced
relative to the coarse grained polycrystalline counterparts, due to the high density
of interfaces [Sui and Lu, 1995]. Also the LTCE of the interface is related to an
interfacial excess volume as demonstrated by theoretical calculations [Wagner, 1992].
This could cause this increase on reducing its grain size [Jovani-Abril et al., 2011].
In the study by [Klam et al., 1987] on the thermal expansion of Cu with different
size samples, the single crystal samples presented a smaller expansion coefficient
than the smaller-grained ones, theoretically due to the large anharmonic atomic
vibrations in the grain boundaries. The same was found in other studies with Nb films
[Banerjee et al., 2003] and nc-Fe [Zhao et al., 2001], larger lattice expansion was found
for smaller-grained samples. However the contrary can also be found in literature.
In the study with Zn nanowires by [Wang et al., 2007] larger lattice expansion coefficient was found for the bulk samples than the small-grained ones due to surface defects.
In the evolution of the lattice strain release with temperature, two steps were
observed (Fig. 5.7). At T <300°C which could be related to the dehydration step
95
Chapter 5. Crystallization and Grain Growth in f(T) for nc-UO2 by Aqueous route
(water molecules attached to the nanocrystals and to the related binding-strength) also
visible in the TGA/DTA. Between 300-700°C where the strain decreased, which could
be related to additional loss of water and oxygen loss (O/U stabilization) and structure
consolidation. The strain decreased then with temperature and was completely released
at 700°C. Above this temperature, the sintering of the nanocrystallites began and
reached a size of about 70 nm at 1200°C.
So, the morphology of the thermal treated nc-UO2 differed then in form (Fig. 5.9),
size and oxidation (Fig. 5.4) state from that of the original synthesized 4 nm nc-UO2 .
A deeper study of the structure of the material as a function of temperature under
reducing atmosphere was then also studied and compared to the reference bulk-UO2 .
The lattice constant of the material in the cooled state after reach different maximum
temperatures (600°C and 1200°C) was here measured. This allowed separation of
the thermal expansion contribution in the high-temperature values to obtain cleaner
curves for thermal expansion vs. temperature and lattice dimension vs. crystal
size. The structure was identified mainly by XRD, but also by advanced methods
including XANES, EXAFS, MAS-NMR, and IR. The nc-UO2 XRD peaks under
Ar/5%H2 thermal treated, became sharper with the increase of the temperature
indicating more crystalline UO2 , i.e., larger particle size (Fig. 5.8). A comparison of the
crystal size and lattice parameter for the samples treated at 600°C and 1200°C under
dynamic Ar/5%H2 atmosphere (measurement after cooling) with those under static He
atmosphere measured at temperature (see Fig. 5.4a), was provided in Table 5.1. No
difference in the crystallite size was obtained at 600°C under either atmosphere. But a
little change was observed at 1200°C, where a crystallite size of 73.39 nm under He was
seen and a size of 82.16 nm under Ar/5%H2 (by TEM corroborated Fig. 5.9). Major
differences were observed in the lattice parameters as a function of the atmosphere
used without ignoring the fact that the values under He were measured at temperature.
These differences in the lattice disappeared once the sample measured at temperature
was measured after cooling, as it was seen in Fig. 5.6. Both samples treated at 1200°C
under He (0.5473 nm Fig. 5.6) or under Ar/H2 (0.5472 nm Fig. 5.8) had a lattice
parameter similar to the 0.5472 nm of bulk-UO2 .
In the lattice strain evolution the same tendency was seen under He atmosphere
(Fig. 5.7) and under Ar/5%H2 atmosphere (Table. 5.1). The complete release of the
strain in the nc-UO2 coincided with the onset of the starting of the crystallite growth.
So the crystallite growth seemed to be limited by the presence of the lattice strain.
From RT until 600-700°C the thermal energy was totally used to remove the strain
and up to that temperature no strain was remaining and the energy was used for the
growing of the nanocrystals. It has been already seen that an applied mechanical stress
on crystals [Sherwood, 2001], or lattice-strains originated from defects produced during
crystal formation [Wei et al., 2008], [Dong et al., 1997], would inhibit the crystal
growth. If so, from the technological point of view, it would be preferable to produce
nanocrystals with highest inner strain as possible (less perfect crystals), to delay as
much as possible the thermal growth.
XANES was used to determine the oxidation of U cations and the corresponding
molar fractions. From these, the O/U ratios were ultimately derived. The XANES
spectra at the U-L3 edge (Fig. 5.10) showed a trend with increasing temperature and
as x decreased (UO2+x ). The samples studied were nc-UO2 as produced and after
thermal treatment at 600°C and 1200°C under Ar/5%H2 . The peak of the WL shifted
96
5.6. Results and discussion.
slightly to lower energies and increased in intensity, and the oscillations within the
XANES regions increased. The amplitude decreased with the increasing temperature
of thermal treatment showing a higher structural order of these samples. For the
as-produced (RT) and at 600°C samples, there was a significant difference of shape
compared to the UIV O2 reference, i.e. presence of a shoulder on the high energy side of
the edge. This was in agreement with the observed decrease of WL amplitude with the
increasing temperature. The shoulder decreased with temperature meaning that there
was less UV I or that the UIV bulk was more visible as it size increased. A clear shift
(further for the RT sample) of the absorption edge and WL-peak to higher energies, as
well as a broader WL was observed. However the spectra for the UIV O2 reference and
the annealed sample at 1200°C, were remarkably similar, indicating that the electronic
structure of the 82 nm UO2 was essentially that of the bulk UIV O2 at that temperature.
It could be expected the RT-sample was the most cluster like (smaller in size), but
in addition the composition was not fully ascribed to UO2 . The shoulder could be a
proof of the presence of UV I . Additionally to the hyper-stoichiometry, the presence of
UV I suggested that water molecules and/or OH groups would be also present in the
RT sample. In those nc-material, the surface was superior to the bulk. If there was
any adsorbed water molecule, the valence of U was increased and the XANES spectra
was significantly different to the bulk. A ratio O/M of 2.45 (VU = 4.9) was deduced
for the RT sample (Table 5.2). In the 600°C treated sample, the shift of the WL, as
well as the shoulder (in this case less defined) were toward to the left in comparison
to the RT sample. It indicated a minor presence of UV and UV I species but still not
strictly UIV . An O/M ratio of 2.30 (VU = 4.6) was in this case found (Table 5.2).
Concerning the 1200°C treated sample, XANES analysis showed no doubt that the
sample had a fluorite structure. No spectrum shift was observed and there was mainly
UIV , and probably some UV , as there was a slight shift of the inflexion point. An O/M
ratio of 2.025 (VU = 4.05) was in here found (Table 5.2) in agreement with the lattice
parameter of 0.5472 nm obtained at 1200°C by XRD. Also the U-L3 XANES data
for the reference UO2 and nc-UO2 treated at 1200°C samples in Fig. 5.10 were very
similar to the UO2 data reported by [Conradson et al., 2005b], [Conradson et al., 2005a]
In the accurate XAS study of the UO2+x system by [Conradson et al., 2005b],
[Conradson et al., 2005a], it is shown that the U-L3 absorption edge energy is very
insensitive to the hyperstoichiometry, x, and is not a simple way to determine the
oxidation state. In this study they point out that the energy of the peak increases
by 0.5 eV, as x reaches 0.2. Also a possible effect on the white line due to the
size of nc-UO2 samples could be present in the obtained results. This effect cannot
be quantified without a dedicated study with nano materials with the exact same
stoichiometry but with different size. That was, at this moment not possible with
the synthesized nc-UO2 where just one-size samples where synthesized and different
particle sizes were obtained by treatment at temperature. Under this treatment,
not just a change in size occurred, but also a change in valence, even under inert
atmosphere (Table 5.1). So, in principle, because of this size effect, determining the
O/M from the shift is dubious. However, as this size effect was not easily to quantify,
it was assumed to use the shift. Anyway, for the RT and 600°C nc-UO2 samples, it is
clear that there is UV I contribution not only from the shift but also from the shoulder
(which is indicative of the uranyl). For the 1200°C sample, it is unlikely that a size
effect occur as 80 nm is already large.
97
Chapter 5. Crystallization and Grain Growth in f(T) for nc-UO2 by Aqueous route
In the k3 -weighted EXAFS spectra (Fig. 5.11a), the oscillations and their amplitude
increased with thermal treatment. The 4 nm as-precipitated sample was very difficult
to fit with a pure fluorite structure, as the fit were non stable and the data noisy
(treated k-range = 3-8 Å−1 ). The intensity of the FT (Fig. 5.11b) was very low limiting
the interpretation of the coordination shell to U-O1 . Observing the EXAFS results
in Table 5.3, the data were heavily dampened at RT where a large value for the DW
factor was found, meaning a significant static disorder for the nc-UO2 as-produced.
Shorter distance for the oxygen shell (U-O bond length) was clearly observable for the
nc-UO2 at RT which did not correspond to any U-oxide. According to the shape of
the first FT peak, it looked like there were two or three U-O distances instead of one.
This was consistent with the observed lattice contraction (0.5417 nm) from XRD at
RT (see Table 5.2).
The 9 nm sample (600°C anneal) showed an intermediate ordering with oscillations
clearly identified and extending to k = 9 Å−1 . The intensity of the FT was also low
for this annealed sample, limiting the fitting and interpretation of the coordination
shell to U-O1 and U-U1 together with UO2 fluorite structure. Still a large value for the
DW factor was found (Table 5.3). Shorter distance was also present for the oxygen
shell (U-O bond length) in comparison with the reference-UIV O2 . However the U-U1
bond length was closer to that of the bulk-UIV O2 , suggesting that the U-U1 lattice
was more ordered than the O anion sublattice. The U-U1 lengths were consistent with
the less lattice contraction (0.5431 nm), in comparison with the nc-UO2 as-produced,
as probed by XRD at 600°C anneal.
Ultimately, at 1200°C and 82 nm, EXAFS oscillations were similar, if not entirely
matching, those of the bulk-UIV O2 indicating same fcc-structure consolidation and
substantial particle growth, both observed in XRD measurements (Fig. 5.12). Both
shells were well fitted with Fm-3m structure for this sample (Fig. 5.13) and very similar
distances to reference UIV O2 structure could be observed according to the FT (k-range
treated = 3-12 Å−1 ). That was in agreement with the similarity for the XRD data for
the annealed sample at 1200°C and the bulk-UIV O2 (Fig. 5.8). Also consistent with
the XANES (see Fig. 5.10) showing no different oscillation from the fluorite structure.
The Hahn-echo 17 O MAS spectra acquired for various annealing times (600°C,
650°C, 700°C, 800°C and 1200°C) were presented in Fig. 5.15 and some fits in
Fig. 5.16 and Fig. 5.17. Two trends were observed in the plots of the shifts and
the FWHM as a function of temperature presented in Fig. 5.18. Under 700°C, the
shift and the FWHM decreased abruptly while above this temperature they were
relatively constant. It can be noticed that the shift extracted from the spectrum
acquired at 200°C was very different from that of the whole series. Due to the
broadness of the peak, the presence of more than one species cannot be excluded, as
already assumed in the EXAFS study. A similar trend was observed by XRD for the
evolution of the lattice parameter as a function of temperature (Fig. 5.4). In fact, it
increased steeply under 700°C, then there was only a week evolution. Therefore, it
seemed that under this temperature there is important changes on long and short range.
Three different oxygen environments could be identified. The first one corresponds
to oxygens having a chemical shift of nearly 900 ppm (named peak C, green peak).
These peaks have been identified up to 650°C. Due to the broadness of the peak, it
was tempting to attribute this one to 17 O in a disordered environment. But, XRD
98
5.6. Results and discussion.
has shown that for this range of temperature the size of the UO2 was around 10 nm
(Fig. 5.8 under Ar/5%H2 ). The strong surface energy existing on the surface of
the small particles will lead to more strain in the lattice, consequently caused the
broadening of the main peak of the quadrupolar line. Thus, it could be proposed
that this type of oxygen corresponded to the 17 O in nc-UO2 . Nevertheless, due to the
broadness of the peak, presence of other 17 O species could not be excluded.
The two second types of species appeared clearly from 650°C (Fig. 5.18). There
was one sharp and one broad (named peaks A and B respectively). These peaks could
be respectively attributed to 17 O in a crystalline phase and in a more disordered phase.
With increasing temperature (increasing of crystallite size), the FWHM of the two
peaks decreased (Fig. 5.17). As previously explained, this was the signature of such
crystallite size evolution. Moreover, the shift of peak A reached a minimal value of
717 ppm at 1200°C. This one was close of the 717 ppm found for UIV O2 -bulk. Its
FWHM was of 5 ppm and corresponded to that of the crystallite having a size about
80 nm. This value was still slightly bigger than the 3 ppm found for UIV O2 -bulk.
Hence, with the shift of peak A one could say that the environment around the
oxygens corresponding to the biggest crystallite size (80 nm) was very close to that of
UIV O2 -bulk. Based on the FWHM, one can say that to observe the signal of crystalline
UO2 a size above 80 nm should be reached. This confirmed that nc-UO2 were obtained
being consistent with the lattice parameter observed of 0.5472 nm, as well as the O/M
ratio obtained in the XANES analysis (Table 5.2).
Several samples at the key annealing temperatures were analyzed under the FTIR
spectrometer. The IR spectra recorded for nc-UO2 as-produced (RT), at 200°C,
600°C and 1200°C under Ar/5%H2 annealed, as well as UIV O2 reference spectra, were
shown in Fig. 5.19. In the case of nc-UO2 as-produced (RT), four peaks in the range
400-4000 cm−1 could be observed. They could be assigned to the bending vibration of
H-O-H of the coordinated water, and to a possible more oxidised state (UO2+x ). All of
them diminished with annealing. The peaks assigned to the H-O-H of the coordinated
water, totally disappeared at 600°C. That was in agreement with the TGA, were
nearly no weight of loss was observable after 600°C (see Fig. 5.1). However two of
the peaks finally disappeared at 1200°C. That could be an artefact due to the small
size still present at 600°C (10 nm) (see Table 5.1). Hence, at 1200°C the IR spectra looked like the one for the UIV O2 reference and grains were about 80 nm (Table 5.1).
That was also in agreement with the results obtained by XANES where a different
electronic structure at 600°C was seen, meanwhile at 1200°C a similar structure to
bulk-UIV O2 was found (see Table 5.2). Also EXAFS was characterized for a poor
ordering at 600°C but entirely matching with the bulk-UIV O2 oscillation pairs at
1200°C (see Table 5.3).
Isothermal evolution of the synthesized nc-UO2 was then performed. Isothermal
grain growth at a given temperature is an essential component to evaluate the grain
growth kinetics, and in consequence the performance of such an innovative nuclear
fuel. Differences in the grain growth behaviour between the micro- and nano-grain
form of the same material, have been already reported [Moelle and Fecht, 1995]
[Natter et al., 2000] [Natter et al., 2001] [Rupp et al., 2006]. In the first case the
material follows the general growth equation, but in the nano-grain case, the grain
grows until a critical time when the grain growth remains constant as described by
99
Chapter 5. Crystallization and Grain Growth in f(T) for nc-UO2 by Aqueous route
the relaxation function Eq. 5.6. However, when the nano-grain material is treated
above a determined temperature (1100°C [Rupp et al., 2006]), the grain growth follows
again the general growth equation (Eq. 5.8). This is in agreement with the results
here observed. For the temperatures of 500°C, 700°C and 900°C and a static and
inert atmosphere of He, the grain growth took place in the first hours of isothermal
hold until a stable average grain size was established at the applied temperature, at
which time crystal growth ceased (Fig. 5.21). For the isotherm at 1200°C and a static
atmosphere of He, the material had a continuous growth not reaching a constant grain
value in the first 50 h (Fig. 5.20).
From Fig. 5.23 an activation energy of diffusion of 0.93 eV to 1.25 eV was obtained.
Diffusion can occur along the grain boundary, or it can occur intragranularly (volume
diffusion), or because of grain defects. The grain boundary diffusion is always faster
than the volume diffusion, meanwhile the volume diffusion occurs within a single
grain and is only important at higher temperatures. In this case of nc-UO2 , the low
activation energies obtained could be related predominantly to grain boundary (surface
and interface) diffusion as volume diffusion contribution exhibits for higher activation
energies (above 4 eV [Sabioni et al., 1998]).
A lattice of about 0.5472 nm was already found for the samples treated at 900°C
after 50 h dwell time under Ar/H2 obtaining a final size about 50 nm (Table 5.5).
Therefore a temperature of 1200°C (and in consequence a final crystallite size of
80 nm) would be, in principle, not necessary to reach the typical lattice parameter of
the reference large-grained UO2 (a=0.5472 nm), as above commented.
An average grain size of 322 nm was measured after cooling for the heat treatment
at 1200°C after 50 h dwell under He (Table 5.5). Taking that into account, it appears
that a temperature below 1200°C would be necessary in the sintering process of of the
monoliths, to avoid extreme growth of the particles (>200 nm). Nevertheless for the
nc-UO2 samples annealed at 1200°C during 50 h under Ar/H2 dynamic atmosphere,
a final grain size of 85 nm was measured after cooling. Even after 200 h dwell time
at this temperature under reducing atmosphere, a final grain size of 150 nm was seen
(quite far from the 322 nm observed under He atmosphere after 50 h). This difference
could be due to the initial oxidation state of the nc-UO2 samples and their evolution
under a static He atmosphere.
As mentioned previously, an hyperstoichiometric UO2 would present a stronger
increase of the self-diffusion coefficients and in the same way raise the mass-flow, the
grain-boundary motion and the grain (or crystal) growth will occur. In Fig. 5.24,
the Arrhenius diagram comparing the cation self-diffusion in UO2 fluorite-structure
from large-grain reported by [Matzke, 1987] and nano-grain from this study (samples
annealed under He static atmosphere during 50 h), has been plotted. Between 20 orders
of magnitude at 500°C (lattice parameter =0.5457 nm; average grain size =18 nm)
and 5 orders of magnitude at 1200°C (lattice parameter =0.5472 nm; average grain
size =322 nm) have been found for the diffusion coefficients between bulk-UO2
[Matzke, 1987] and nc-UO2 of this study (Table 5.5). Differences in the diffusivity in
the grain boundaries between micro- and nano-grain have been seen already in other
fluorite structure metal oxides [Martin, 2007]. In fact the differences in the diffusion
coefficient between bulk- and nc-UO2 are compatible with an enhancement of the
diffusion processes either by a diminishing of the grain size or by O/U>2 effects.
100
5.6. Results and discussion.
101
Chapter 5. Crystallization and Grain Growth in f(T) for nc-UO2 by Aqueous route
102
Chapter 6
Crystallization and Grain Growth
in f(T) for nc-UO2 by Organic route
6.1
Generalities.
In this chapter the evolution of the grain size and the crystal structure evolution as a
function of temperature under inert and reducing atmosphere of nc-UO2 precipitated
from organic phase (see Chap. 4), have been investigated. Thermogravimetric analysis
(TGA) of the samples provides the starting point for these investigations, enabling the
identification of mass losses at given temperatures. The structure of the material as a
function of temperature has been identified mainly by XRD and HT-XRD, but also by
advanced methods including XANES and EXAFS.
6.2
Thermal evolution and mass changes as probed
by TGA/DTA.
Thermogravimetry analysis (TGA) and differential thermal analyses (DTA) were
employed under Ar/5%H2 gas at a heating rate of 5°C/min to determine the thermal
decomposition temperature and the water and organic content of the product (see
Fig. 6.1). The description of the instrument is shown in Sec. 2.5.
Upon heating under Ar/5%H2 , a mass loss of 1 wt% is observed until 150°C together
with a slight endothermic peak. This loss of weight is likely due to outgassing of residual
water coming from the precursor. A second weight loss of about 3.5 wt% appears until
280°C, accompanied by an exothermic peak at 240°C. A new mass loss appears until
485°C which could be due to the residual carbon from the precursor. Between 485 and
1200°C there is no weigh loss (1 wt%) accompanied with wide exotherm probable due
to the heat release because crystallization.
6.3
Lattice parameter and crystal growth in neutral
atmosphere.
The crystal growth, lattice parameter of the nc-UO2 from organic route (5.52 nm size
and lattice parameter a = 0.5430(1) nm; see Sec. 4.4), has been investigated under inert
103
Chapter 6. Crystallization and Grain Growth in f(T) for nc-UO2 by Organic route
Figure 6.1: TGA and DTA signal for nc-UO2 under Ar/5%H2 atmosphere.
conditions (static He atmosphere) using in situ HT-XRD. The effect of temperature
on the crystallite size, which is a fundamental parameter in the sintering process has
been analysed. As it has been seen in Fig. 6.1, no organics loss was observed after
500°C. However, to avoid any possible decomposition of the nc-UO2 organic layer in
the static atmosphere of the HT-XRD chamber, a pretreatment under O2 was applied
(500°C during 1 h), followed by 2 h under Ar/5%H2 to reverse the possible oxidation
of the particles. After thermal pre-treatment, a size of 37 nm and lattice parameter
0.5462(0) nm, were determined. The in situ HT-XRD patterns were acquired with an
instrument described in 2.4.2. The temperature range explored was 30 to 1100°C.
The evolution with temperature of the nc-UO2 XRD pattern is shown in Fig. 6.2.
The observed reflections are assigned to UO2 -fcc phase structure and to Pt phase corresponding to the heater plate. The effect of temperature on the peaks can be observed
more clearly in Fig. 6.2-right, which displays the evolution of two main peaks (the (111)
and (200) reflections) of the UO2 structure. In Fig. 6.2, one observes a shift in the
peak position to lower angles, possibly related to a thermal lattice parameter expansion.
An effect of the temperature is seen in the width of the peaks which decreases with
increasing temperature while the intensity of the peaks increases. This width change
was observed even below 700°C which was the highest pre-treatment temperature.
This effect could be due to the longer times (about 10 h) at temperature used in the
HT-XRD which induce to a perfectionism of the UO2 fcc-structure (higher crystallization). Since the contribution of instrumental broadening is independent of the
temperature, the broadening at lower temperatures is mainly related to the crystallite
size and strain present in the material, as well as increase of the structural order. Both
contributions, crystal size (proportional to cos−1 θ; Eq. 5.1) and strain (proportional to
tanθ; Eq. 5.2), have different angular dependences, and are so separable. A study of
those influences has been performed in the following.
104
6.3. Lattice parameter and crystal growth in neutral atmosphere.
Figure 6.2: In situ HT-XRD patterns of nc-UO2 under He (left). The typical UO2 and Pt
(heating plate) Bragg peak positions are also marked. The (right) picture shows just the
evolution of (111) and (200) peaks of UO2 cubic structure as a function of temperature.
6.3.1
Grain growth as a function of temperature under neutral
atmosphere.
The crystallite size of the nc-UO2 has been determined by XRD Rietveld refinement
(see Sec. 2.4) of the Bragg peaks (Fig. 6.2), and used also to characterize the microstructure of the material. From these results it is possible to generate a universal
representation of the crystallite size as a function of temperature (XRDs measured at
temperature and under static He atmosphere) and reported in Fig. 6.3. Even though,
this information is taken as universal, slight deviations may occur, in particular due
to dwell times and temperature ramps, but more importantly due to the atmosphere
of static He during thermal treatment. Notable crystal size variations were observed
above 700°C as this was the temperature already reached during the pre-treatment of
the material. The crystallite size change with temperature shows a slow growth up to
700°C, and an intense growth from 37 to 150 nm at 1100°C (see Fig. 6.3).
Fig. 6.4 shows TEM images of the nc-UO2 particles as-produced, after the prethermal treatment under O2 (500°C) and Ar/H2 (700°C) and at 1000°C. The size
change corresponds to the one measured by XRD.
6.3.2
Lattice parameter and linear thermal expansion coefficient as a function of temperature.
The crystal growth of the sample under inert conditions (static He atmosphere) using
in situ HT-XRD, have been already described. In addition, the variation of the lattice
parameter versus crystal size and temperature, as well as data on the linear thermal
expansion, are now reported and compared to bulk material UO2 . The crystal structure
105
Chapter 6. Crystallization and Grain Growth in f(T) for nc-UO2 by Organic route
Figure 6.3: Evolution of the nc-UO2 crystallite size in function of the temperature.
(a) 4 nm as-produced
(b) 34 nm at 700°C
(c) 91 nm at 1000°C
Figure 6.4: TEM images for the nc-UO2 .
of the precipitates was, as the crystallite size, determined by Rietveld refinement,
taking into account the whole 2θ range.
In Fig. 6.5a the lattice parameter obtained as a function of temperature (XRDs measured at temperature and under static He atmosphere) and its derivative (Fig. 6.5b),
have been also determined by the XRD Rietveld refinement of the Bragg peaks, and
represented together with the nc-UO2 size evolution to observe its dependence. Also
the calculated lattice evolution of non-stoichiometric standard UO2+x for different
O/U ratios due to only thermal expansion, have been represented for comparison. The
lattice parameter of a non stoichiometric UO2+x is linked to the oxygen content by the
relations of [Lynds et al., 1963]. Also the lattice parameter was corrected as a function
of temperature with the [Fink, 2000] relations already reflected in Eq. 5.3.
An expansion in the lattice parameter from 0.5462(0) nm at RT (after being pretreatment) to 0.5482(0) nm at 300°C, has been determined. Above this temperature,
a linear evolution of the the lattice parameter with temperature is observed. Relating
the lattice parameter found in this study with the [Lynds et al., 1963] relations, a
stoichiometry of UO2.04 up to 300°C to UO2.00 up to 750°C, has been determined. The
106
6.3. Lattice parameter and crystal growth in neutral atmosphere.
(a)
(b)
Figure 6.5: a.) Lattice constant and crystallite size variation of nc-UO2 in function of temperature (curves only as a guide to eye), from in situ HT-XRD measurements under static He
atmosphere in comparison with lattice evolution in function of temperatures of standard UO2
for different O/U ratios obtained by the relations of [Lynds et al., 1963], due to only thermal
expansion. b.) Relative crystallite size and lattice parameter vs. temperature (curves only as
a guide to eye).
nanocrystallites stabilize at O/U 2.0 at temperatures above 750°C, or in other words,
at particles sizes >44 nm.
Fig. 6.6 displays the linear thermal expansion (LTE) and the linear thermal
expansion coefficient (LTEC) of nc-UO2 as a function of the temperature. The LTE
at temperature T was calculated using the relation 5.4. The LTEC was calculated by
differentiating the thermal expansion curve aT versus T with respect to the temperature
T (see Eq. 5.5).
The LTE of the nc-UO2 is just slightly higher than the one for UO2 bulk
[Martin, 1988] for all the interval of temperatures, as one could already predict from
the lattice parameter representation in function of temperature (see Fig. 6.5a). The
LTEC is initially higher for nc-UO2 than for bulk-UO2 for temperatures below 400°C
and tends to stabilize above this temperature with a value of 12 · 10−6 °C−1 in
agreement with the value for the LTEC of bulk-UO2 . The oscillatory trends observable
for LTEC in nc-UO2 can be attribute to transitory oxidation-reduction effects.
If Fig. 6.7 the patterns comparison of nc-UO2 at RT (previously treated at
500°C during 1 h and 700°C during 2 h under O2 and Ar/5%H2 , respectively)
(a = 0.5462(0) nm), nc-UO2 at 1100°C (a = 0.5534(0) nm) and nc-UO2 at RT after
thermal treatment at 1100°C (a = 0.5472(0) nm) (all measured in situ in the HT-XRD
instrument under static He atmosphere), is shown.
At 1100°C under static He atm, an O/U ratio of 2.0 (see Fig. 5.4a) and a lattice
pararameter of a = 0.5534(0) nm (measured at temperature), have been observed.
The same thermally treated sample measured after cooling at RT, shows a value of
107
Chapter 6. Crystallization and Grain Growth in f(T) for nc-UO2 by Organic route
Figure 6.6: Linear thermal expansion (LTE) and linear thermal expansion coefficient (LTEC)
of the nc-UO2 in comparison with data of bulk-UO2 from [Martin, 1988] (curves only as a
guide to eye).
0.5472(0) nm very similar from the typical for bulk-UO2 (0.547 nm). The peaks of the
nc-UO2 at RT after the thermal treatment at 1100°C recover the typical position for
standard UO2 (see Fig. 6.7).
So, a recovery of the crystal structure has been achieved with temperature under
static He atmosphere from the initial lattice parameter value of a = 0.5462(0) nm from
the nc-UO2 (pre-thermal treated at 700°C) to 0.5472(1) nm after thermal treatment at
1200°C.
6.3.3
Lattice strain evolution as a function of temperature.
The mean strain e in the material was determined by Rietveld refinement using the
software [HSP-PAN, 2011] and used to characterize the deformation state of the
material. The crystallite size change with temperature, already shown in Sec. 6.3.1,
was characterized for a quasi linearly crystal growth above the 750°C. A size of about
150 nm at 1100°C was reached.
In the evolution of the lattice strain e release with temperature, (Fig. 6.8), a first
increase of the strain at 200°C is observed. Afterwards a slow and progressive decrease
occurs up to 700°C with a rapid drop occurs until 1000°C when the strain of the
material is totally released and a high increase in the crystallite size begins (from
88 nm at 1000°C to 150 nm at 1100°C).
6.4
Lattice parameter and crystal growth under reducing conditions.
The local structure has been investigated for the nc-UO2 as-produced and after thermal
treatment under reduction conditions (Ar/5%H2 ), by X-Ray Diffraction (XRD) and
108
6.4. Lattice parameter and crystal growth under reducing conditions.
Figure 6.7: Patterns comparison of nc-UO2 pre-thermal treated, nc-UO2 at 1100°C and ncUO2 at RT after thermal treatment at 1100°C (measured in situ in the HT-XRD instrument
under static He atmosphere)
X-ray Absorption Spectroscopy (XAS), and compared to bulk-UO2 as a reference. A
combination of X-ray Absorption Near Edge Structure (XANES) and Extended X-ray
Absorption Fine Structure (EXAFS) was used.
6.4.1
Crystal size and lattice parameter evolution as a function
of temperature as probed by XRD.
As it has been seen from the HTXRD, the lattice constant (and crystal size) of the
material in the cooled state (at RT) after reach different maximum temperatures is
needed (see Fig 6.7). This allows separation of the thermal expansion contribution
in the high-temperature values to obtain cleaner curves for thermal expansion vs.
temperature and lattice dimension vs. crystal size. Also no pre-treatment was make
on the samples used here.
At the outset of this study, a high concern about the control of the O/U ratio,
which is not simple, appeared. The structural investigations presented in the following,
attempt to eliminate this issue as the samples were heated in Ar/5%H2 to ensure that
the O/U = 2.00. The impact of the heat treatment on the microstructure of nc-UO2 at
different annealing temperatures was then studied under reducing conditions (dynamic
Ar/5%H2 atmosphere). As-produced or room temperature (RT) (5.52 nm 5 nm),
600°C (5.78 nm 6 nm) and 1200°C (12.19 nm 12 nm). The corresponding XRD
data are given in Fig. 6.9. A heating rate of 5°C · min−1 under dry Ar/5%H2 and
annealing for 15 minutes were used. At 500°C under Ar/5%H2 the major mass loss has
already occurred, as has been observed in the TGA/DTA (Fig. 6.1). So no organics
traces should be present at 600°C in the material. As a reference, a standard UO2.0
(μm crystal size) sintered at 1600°C under Ar/5%H2 for 6 hours and measured during
109
Chapter 6. Crystallization and Grain Growth in f(T) for nc-UO2 by Organic route
Figure 6.8: Crystallite size and strain of nc-UO2 in function of temperature. Measurements
done at temperature under static He atmosphere (curves only as a guide to eye).
the same measuring campaign, was also used.
The measurements indicated a well crystallized single cubic phase with a fluorite
structure (Fm-3m). No evidence for orthorhombic or other phase was found. From
the Rietveld refinement of the measured diffractograms, the lattice parameters as well
as the size of the particles were deduced. Reduction of the nc-UO2+x towards nc-UO2
after annealing at 600°C and 1200°C, was expected because the high sensitivity of the
lattice parameter (a) to changes in the oxidation state of U in the hyperstoichiometric
range, O/M > 2. Samples treated at increasing temperature (RT, 600°C and 1200°C)
with a short isothermal hold of 15 min, exhibit an increase in the lattice constant
of 0.55%. Progressing crystallization of the nc-UO2 leads to periodic ordering of its
atom and the lattice parameter, which was shifted to higher angles, changed from
0.5430(1) nm at RT, to 0.5432 nm and 0.5461 nm at 600°C and 1200°C, respectively.
The crystal-size increased from 5.5 nm as-prepared, to 5.8 nm and 12.2 nm following
treatments at 600°C and 1200°C, respectively (Fig. 6.9).
A notable difference on the crystal size and lattice parameter for samples treated
at 1200°C under dynamic Ar/5%H2 atmosphere (measurement after cooling), with
those at 1100°C under static He atmosphere measured at temperature (see Fig. 6.5a)
is noted. The one under Ar/5%H2 had a crystallite size around 12 nm, while the
one under He atm reached a size of 150 nm. Major differences have been seen in the
lattice parameters as a function of the atmosphere used without ignoring the fact that
the values under He were measured at temperature. These differences in the lattice
observed in the samples treated under He, disappeared once the sample measured at
temperature is measured after cooling, as it has been seen in Fig. 6.7. In the evolution
of the lattice strain (e), a release was observed with increasing temperatures. After
annealing at 600°C under Ar/5%H2 , just little strain was released (from 0.702 to
0.664%), totally disappearing at 1200°C (0.004%), as it also happen under He atm
after 1100°C.
110
6.4. Lattice parameter and crystal growth under reducing conditions.
Figure 6.9: XRD patterns of reference UO2 and organic UO2 (as-produced, after thermal
treatment under Ar/5%H2 at 600°C and 1200°C).
6.4.2
O/M ratio as a function of temperature as probed by
XANES.
XANES was used to determine the oxidation of U cations and the corresponding
molar fractions. From these, the O/U ratios were ultimately derived. The normalized
XANES spectra and the first derivate at the U-L3 absorption edge of the three different
heated nanocrystalline UO2 samples (nc-UO2 at RT, 600°C and 1200°C) are shown in
Fig. 6.10, together with the reference spectra of UIV O2 . The associated energies of the
inflection point at absorption edge and of the white-line (WL), as well as the energy
shift (ΔE) and the estimated oxidation states derived from this study, are given in
Table 6.1
A simple observation of the XANES spectra at the U-L3 edge immediately shows a
trend with increasing temperature and as x decreases (UO2+x ). The peak of the WL
shifts slightly to lower energies and increases in intensity, and the oscillations within
the XANES regions slightly increase. The amplitude decrease with the increasing
temperature of thermal treatment shows a relative higher structural order of these
samples (Fig. 6.10).
For the three samples as-produced (RT), 600°C, and even at 1200°C, there is a
significant difference of shape compared to the UIV O2 reference, i.e. presence of a
shoulder on the high energy side of the edge. This feature usually indicates the presence
of UV I . According to [Conradson et al., 2005a], a shoulder appears on the high energy
side of the main peak, ongoing from AnIV to AnV and AnV I (An = Actinides = Th,
Pa, U, Np, Pu, Am, Cm). This is also in agreement with the observed decrease of WL
amplitude with the increasing temperature. The shoulder decreases with temperature
meaning that there is less UV I or that the UIV bulk is more visible as it size increases.
111
Chapter 6. Crystallization and Grain Growth in f(T) for nc-UO2 by Organic route
Figure 6.10: Normalized absorption XANES spectra and the first derivate at the U-L3 edge
of the three different heated nc-UO2 samples from Organic route (nc-UO2 at RT, 600°C and
1200°C), together with the reference spectra of bulk UIV O2 .
A small shift of the absorption edge to higher energies (further for the RT and 600°C
samples), as well as a broader WL is observed for the three nc-UO2 samples.
Detailed analysis of the U-L3 XANES spectra and of their first derivate for the RT
sample, show that the energy of the WL shifts 1.9 eV (Table 6.1) to higher energies
in comparison with the reference UO2 (UIV ) spectrum. A shoulder on the right side
of the edge for RT, is observable. It could be expected the sample is the most cluster
like (smaller in size), but in addition the composition is not fully ascribed to UO2 .
The shoulder could be a proof of the presence of UV I . As explained in Sec. 2.2.3,
molar fractions of 30% of UV and 70% of UV I corresponding to a ratio O/M of
2.85 (VU = 5.7) (Table 6.1), have been deduced according to a linear combination
of UO2 (pure UIV ), U4 O9 (mixture of UIV and UV ) and U3 O8 (mixture of UIV and UV I ).
In the 600°C and 1200°C treated samples, the shift of the WL (1.6 eV and 0.8 eV
respectively; Table 6.1), as well as the shoulder (less defined) are toward to the left in
comparison to the RT sample. It indicates a minor presence of UV and UV I species but
not strictly UIV . Even the sample at 1200°C has not still full fluorite structure, which
was also observed in the XRD measurements (5.461 nm; Fig. 6.9). An O/M ratio of
2.425 (VU = 4.85) was found for the sample treated at 600°C, with a molar fraction of
112
6.4. Lattice parameter and crystal growth under reducing conditions.
40% of UIV , 35% of UV and 25% of UV I (Table 5.2). Concerning the 1200°C treated
sample an O/M ratio of 2.2 (VU = 4.40) was in this case found corresponding to a
molar fraction of 60% of UIV and 40% of UV .
The results presented in Fig. 6.10 clearly indicate that the 5 nm UO2 particle even
after 600°C anneal (6 nm) and 1200°C anneal (12 nm), does not have the electronic
structure of bulk UO2 . At these temperatures, a reduction to UIV would also be
expected. XANES reflects the unoccupied electronic structure. In a molecule, these
are well defined energy levels, while in a solid they are bands of a particular symmetry.
One can understand the size effect if one considers this 5 nm UO2 crystals as a cube
with a side length of 5 nm, which is the same of around ∼ 9 UO2 -unit cells (lattice
parameter a = 0.547 nm). This cube contains a bulk cube of around 4 nm length
(7 unit cells). Thus there are 764 unit cells in total inside the 5 nm crystal, with 400
(52%) on the surface and 364 in the interior, which one restrains from calling “bulk”.
For the thermal treated samples the percentage of unit cells in the surface would be
45% at 600°C (6 nm) and 25% at 1200°C (12 nm). This is a crude representation of
the problem, but shows that the material is more like a large cluster in transition from
a large molecule to that of the true bulk. Thus it is not surprising that the XANES
depicts an electronic structure of the nc-UO2 material unique from the bulk material.
113
114
d
d
5.461(0)
5.432(0)
5.431(0)
5.472(0)
17170.1
17171.2
17171.7
17168.7
(eV )
17175.7
17176.5
17176.7
17174.9
(eV )
0.8
1.6
1.9
-
(eV )
ΔEb
4.40
4.85
5.70
4.00
(VU )
U valency
60
40
-
100
UIV (%)c
40
35
30
-
UV (%)c
molar fraction
-
25
70
-
UV I (%)c
2.200
2.425
2.850
2.000
O/M
a.) by XRD (see Fig. 6.9). b.) (ΔE = WLsample - WLref. ). c.) According to a linear combination of UO2 (pure UIV ), U4 O9 (mixture of UIV and UV ) and U3 O8
(mixture of UIV and UV I ). d.) under Ar/5%H2 .
nc-UO2 12 nm 1200°C
nc-UO2 6 nm 600°C
nc-UO2 5 nm RT
Samples:
UO2
Reference:
(Å)a
lattice param. inflection point energy WL
Table 6.1: Results from the analysis of the UO2+x XANES data at the U-L3 edge.
Chapter 6. Crystallization and Grain Growth in f(T) for nc-UO2 by Organic route
6.5. Results and discussion.
6.4.3
Order and disorder probed by local methods, as DebyeWaller EXAFS, as a function of crystal size.
The k3 -weighted EXAFS spectra and the corresponding Fourier transforms (FT) at
the U-L3 edge for the experimental data of UO2 nanocrystals at different temperatures
annealed, and UIV O2 -bulk reference, are shown in Fig. 6.11. Experimental features are
specified in Sec. 2.2.3.
In the k3 -weighted spectra (Fig. 6.11a), the oscillations and their amplitude
increases with thermal treatment. The nc-UO2 synthesized by organic route samples
as-produced and annealed, presented a high disorder. The 5 nm as-precipitated sample
was very difficult to fit with a pure fluorite structure, as the fit were non stable and the
data noisy. The oscillations are very quickly dampened. The intensity of the FT was
also very low. The FT at the U-L3 edge for the experimental data of UO2 nanocrystals
at different temperatures annealed and UIV O2 bulk reference, are shown in Fig. 6.11b.
According to the shape of the first FT peak, it looked like there were two or three
U-O distances instead of one. This is consistent with the observed lattice contraction
(0.5431 nm) from XRD at RT (see Table 6.1). Also samples treated at 600°C and
1200°C presented a high degree of disorder, as it was already predicted from the
XANES analysis (Table 6.1). Therefore a good fit could not be achieved considering
only bulk-UIV O2 , meaning that another unidentified phase or massive disorder must
be taken into account.
6.5
Results and discussion.
The evolution of the grain size and the crystal structure, which are fundamental
parameters in the sintering process, as a function of temperature under inert and
reducing atmosphere of nc-UO2 precipitated from organic phase (see Chap. 4), was
investigated here. Analysis of the precipitated material was performed by applying the
thermal analytical and X-ray scattering techniques like TG/DTA, XRD and HT-XRD,
spectroscopic techniques as XANES and IR, as well as characterization techniques like
TEM. The target parameters studied have been the oxidation degree (O/U ratio),
the possible organic content on the material, as well as the lattice imperfections as a
function of the annealing temperature.
TGA and DTA were employed under inert atmosphere (Fig. 6.1). The weight loss
observed was attribute to residual water from the precursor, but mainly to organic
volatilisation and crystallization (completion of the UO2 fcc-structure). However,
there was no reason to believe that the weight loss did not include as well some loss of
oxygen due to material’s reduction. A deeper analysis on the lattice parameter and
crystal growth under inert and reducing atmospheres was then performed to confirm
the later.
The evolution of the crystallite size, the lattice parameter, and the strain were
determined from ambient temperature up to 1100°C under inert atmosphere using the
in situ HT-XRD (Fig. 6.2). As was seen in TG/DTA (Fig. 6.1), no organics presence
was observed after 500°C. However, to avoid any possible decomposition of the nc-UO2
organic layer in the static atmosphere of the HT-XRD chamber, a pretreatment under
O2 was applied (500°C during 1 h), as well, as 2 h under Ar/5%H2 to reverse the
115
Chapter 6. Crystallization and Grain Growth in f(T) for nc-UO2 by Organic route
(a) Experimental k3 -weighted spectra.
(b) Experimental Fourier Transform.
Figure 6.11: a.) k3 -weighted spectra and b.) Fourier Transform at the U-L3 edge for the
experimental data of nc-UO2 (organic route) at different temperatures annealed and UIV O2
bulk reference.
possible oxidation of the particles. After thermal pre-treatment, a size of 37 nm and
lattice parameter 0.5462(0) nm, were determined. An effect of the temperature was
seen in the width of the peaks which decreased with increasing temperature while
the intensity of the peaks increased. This width change was observed even below
700°C which was the highest pre-treatment temperature. This effect could be due to
the longer times (about 10 h) at temperature used in the HT-XRD which induces
116
6.5. Results and discussion.
a perfectionism of the UO2 fcc-structure (higher crystallization). The crystallite
size change with temperature showed a small growth up to 700°C, an an intense
growth from 37 to 150 nm at 1100°C (see Fig. 6.3). However, slightly changes were
already observable below 700°C for the lattice parameter. An expansion in the lattice
parameter from 0.5462(0) nm at RT (after pre-treatment) to 0.5482(0) nm at 300°C
(O/U 2.04), was determined. Above this temperature, a linear evolution of the the
lattice parameter with temperature was observed. The nanocrystallites stabilized at
O/U 2.0 at temperatures above 750°C, or in other words, at particles sizes >44 nm. A
value of 0.5534 nm for the lattice parameter for the nc-UO2 at 1100°C annealed and
measured in situ in the HT-XRD instrument under static He atmosphere, was observed.
The same thermal treated sample measured after cooling at RT, showed a value of
0.5472 nm (UO2.00 ) very similar from the typical for bulk-UO2 (0.547 nm) (Fig. 6.7).
A recovering of the UO2 typical crystal structure was achieved with temperature under
static He atmosphere from the initial lattice parameter value of 0.5462 nm from the
pre-treated nc-UO2 to 0.5473 nm after thermal treatment at 1100°C (measurements
done after cooling).
The LTEC (Fig. 6.5a) was initially higher for nc-UO2 than for bulk-UO2 for
temperatures below 400°C and tends to stabilize above this temperature with a value
of 12 · 10−6 °C−1 in agreement with the value for the LTEC of bulk-UO2 . The
oscillatory trends observable for LTEC in nc-UO2 might be attribute to transitory
oxidation-reduction effects.
In the evolution of the lattice strain e release with temperature, (Fig. 6.8), a slowly
and progressively decrease occurred up to 700°C with a rapid strain drop until 1000°C
when the strain of the material is totally released and a high increase in the crystallite
size began (from 88 nm at 1000°C to 150 nm at 1100°C). So the crystallite growth
seemed to be limited by the presence of the lattice strain.
So, the morphology of the thermal treated nc-UO2 differed then in form, size and
oxidation state from that of the original synthesized 5 nm nc-UO2 . Furthermore, a
shift in the lattice parameters was observed as a function of temperature, indicating
a lattice expansion with temperature (lattice contraction with decreasing size) that
extended beyond that caused by thermal effects. The origin of this size-dependent
lattice expansion in the nc-UO2 may be either the reduction of the material during
thermal treatment (particle-size increase also with temperature) or the relaxation of
bonding-forces at the crystal surface, which needs elucidation.
A deeper study of the structure of the material as a function of temperature under
reducing atmosphere was then also studied and compared to the reference bulk-UO2 .
The lattice constant of the material in the cooled state after reaching different
temperatures was measured here. This allowed separation of the thermal expansion
contribution in the high-temperature values to obtain cleaner curves for thermal
expansion vs. temperature and lattice dimension vs. crystal size. The structure was
identified mainly by XRD, but also by advanced methods including XANES, EXAFS,
and Raman spectroscopy.
The nc-UO2 XRD peaks under Ar/5%H2 thermal treated, became sharper with
the increase of the temperature indicating more crystalline UO2 , i.e., larger particle
size (Fig. 6.9). A notable change in the crystallite size was observed at 1100°C, with
117
Chapter 6. Crystallization and Grain Growth in f(T) for nc-UO2 by Organic route
a size of 150 nm under He was found in contrast to 12 nm under Ar/5%H2 . However
that could be due to the pre-thermal treatment (before the HT-XRD measurement
under He) made under O2 and Ar/H2 which ended already in a size of about 37 nm
at 700°C. Also differences in the lattice parameters as a function of the atmosphere,
were observed. 0.5472 nm at 1100°C under He (Fig. 6.7) and 0.5461 nm at 1200°C
under Ar/H2 , were measured. This difference was probably due also to the pre-thermal
treatment done to the first samples where a higher consolidation of the fcc fluorite
structure was achieved due to the longer times at temperature. A lattice parameter of
0.5462 nm was reached after 2 h under Ar/H2 at 700°C, and 0.5472 after 1100°C under
He (about 10 h at temperature).
In the evolution of the lattice strain (e) under Ar/5%H2 , a release was observed with
increasing temperatures. After annealing at 600°C under Ar/5%H2 , just little strain
was released (from 0.702 to 0.664%), and totally disappeared at 1200°C (0.004%), as
was also observed under He atm after 1100°C.
XANES was used to determine the oxidation of U cations and the corresponding
molar fractions. The O/U ratios were ultimately derived. The XANES spectra at the
U-L3 edge (Fig. 6.10) showed a trend with increasing temperature and as x decreased
(UO2+x ). The peak of the WL shifted slightly to lower energies and increased in
intensity, and the oscillations within the XANES regions slightly increased. The
amplitude decreased with the increasing temperature of thermal treatment showing
a relative higher structural order of these samples. However, for the three samples
studied (as-produced (RT), 600°C and 1200°C), there was a significant difference of
shape compared to the UIV O2 reference, i.e. presence of a shoulder on the high energy
side of the edge. This was in agreement with the observed decrease of WL amplitude
with the increasing temperature. The shoulder decreased with temperature meaning
that there was less UV I or that the UIV bulk was more visible as it size increased.
A clear shift (further for the RT sample) of the absorption edge and WL-peak to
higher energies, as well as a broader WL was observed. Not even the spectra for the
UIV O2 reference and the annealed sample at 1200°C, were similar, indicating that the
electronic structure of the 12 nm UO2 was still not UIV O2 .
In the accurate XAS study of the UO2+x system by [Conradson et al., 2005b],
[Conradson et al., 2005a], it is shown that the U-L3 absorption edge energy is relatively
insensitive to the hyperstoichiometry, x, and is not a simple way to determine the
oxidation state. In this study they point out that the energy of the peak increases by
0.5 eV, as x reaches 0.2. Also a possible effect on the WL due to the size of nc-UO2
samples could be present in the obtained results. This effect could not be quantified
without a dedicated study with nano materials with exactly the same stoichiometry
but with different size. That was, at this moment not possible with the synthesized
nc-UO2 where just one-size samples where synthesized and different particle sizes were
obtained by treatment at temperature. Under this treatment, not just a change in size
occurred, but also a change in valence, even under inert atmosphere (Fig. 6.9). So, in
principle, because of this size effect, determining the O/M from the shift is not straight
forward but it was the only option at that time.
Another route to study this effect, could be the use of a nano-material with a
unique valence state i.e. thorium dioxide (ThO2 ). From the synthesized nc-ThO2
(Sec. 4.4.1.2), different sizes could be obtained under thermal treatment without
118
6.5. Results and discussion.
changing the valence of the material. ThO2 can only exist in one oxidation state,
ThIV , and is eliminated all discussion on the influence of the O/M ratio on the results
obtained. Any changes in the XANES, would be just due to the size of the particles.
In this work, a study of the as-produced nc-ThO2 (Chap. 4) was also done. Just one
size nanoparticles (about 1 nm) was analysed because of the small quantity of material
available at the time of the XAS study. The normalized XANES spectra and the first
derivate at the Th-L3 absorption edge of nc-ThO2 at RT together with the reference
spectra of ThIV O2 are shown in Fig. 6.12. The associated energies of the inflection point
at absorption edge and of the WL, as well as the energy shift (ΔE) and the estimated
oxidation states derived from this study, are given in Table 6.2. In the XANES spectra
at the Th-L3 edge, the peak of the WL corresponding to nc-ThO2 at RT (as-produced)
had an identical position and amplitude as the one for the reference spectra of ThIV O2 bulk. Corroboration by XRD was also obtained (lattice constant of a=0.5579(1) nm)
vs. a=0.560 nm for the ThO2 standard).
This identical behaviour suggested that the displacements observed for nc-UO2
were not due to the size of the particles, rather the valence. Slightly less intensity
for the peak of the WL was observed, as well as less oscillations for the nc-ThO2 . So
for this point, one could think there might be a small size effect on the interatomic
distance and ordering. The size effect observed for the nc-ThO2 as-produced was less
than that observed for nc-UO2 (as produced, 600°C and 1200°C) with bulk-UIV O2 .
So even if there might be a small size effect, the valence might be the major cause for
the differences observed with bulk-UIV O2 , also confirmed by the lattice contraction by
XRD (0.5432 nm and 0.5461 nm at 600°C and 1200°C, respectively). Having that into
account, determining the O/M from the XANES shift would be justified.
Table 6.2: Results from the analysis of the ThO2 at the Th-L3 .
lattice param. inflection point energy WL
(Å)a
(eV )
(eV )
ΔEb U valency
(eV )
(VU )
molar fraction
ThIV (%)c
O/M
Reference:
ThO2
5.599(0)
16295.6
16300.1
-
4.00
100
2.000
5.579(1)
16295.6
16300.1
-0.3
4.00
100
2.000
Sample:
nc-ThO2 1 nm RT
a.) by XRD. b.) (ΔE = WLsample - WLref. ).
In the k3 -weighted EXAFS spectra of the UO2 samples (Fig. 6.11), the oscillations and their amplitude slightly increased with thermal treatment. The 5 nm
as-precipitated sample was very difficult to fit with a pure fluorite structure, as the
fit were non stable and the data noisy. The intensity of the FT (Fig. 6.11) was also
very low. According to the shape of the first FT peak, it looked like there were two
or three U-O distances instead of one. This is consistent with the observed lattice
contraction (0.5431 nm) from XRD at RT (Table 6.1). Also samples treated at 600°C
and 1200°C presented a high degree of disorder, as it was already predicted from the
XANES analysis (Table 6.1). Therefore a good fit could not be achieved considering
only bulk-UIV O2 , meaning that another phase or considered disorder must be taken
into account.
119
Chapter 6. Crystallization and Grain Growth in f(T) for nc-UO2 by Organic route
Figure 6.12: Normalized absorption XANES spectra and the first derivate at the Th-L3 edge
of nc-ThO2 at RT together with the reference spectra of bulk ThIV O2 .
120
Chapter 7
nc-UO2 monolith consolidation and
characterization
7.1
Introduction and principles.
The fabrication of dense ceramic parts with submicrometer grains and perfect microstructures is one of the most challenging objectives in modern ceramic technologies.
According to novel findings, a microstructure with submicrometer grains in materials
offers clear advantages over the traditional large-grain microstructure for applications
under conditions of severe mechanical stress as those valid for nuclear fuel ceramic
pellets in the core of a nuclear reactor (LWR). For the study and verification of such
possible exceptional properties in nuclear fuel pellets the fabrication of fully dense
nanostructurated ceramics and their thorough testing are hence required.
In the manufacture of the LWR-fuel pellets a standard density of 90-95% must
be achieved to satisfy design requirements. The traditional way to obtain such dense
ceramic bodies is conventional uniaxial pressing of the powdered raw material (e.g.
using a hydraulic press), followed by high-temperature sintering. In the prior pressing
step a green density of 45-55% is normally achieved. To reach the 90-95% density a
posterior thermal treatment is normally carried out, where the pellet is submitted to
1600 °C during a time of up to 18 h. This procedure could not be followed in the
synthesis of pellets with the nc-material because the grain size would dramatically
grow whereas the objective is to produce a pellet with grain size between 100-200 nm
as it appears in the rim (HBS) structure.
Therefore several routes for the consolidation and densification (sintering) into
green bodies were tested. Nanocrystalline uranium oxide ceramics of high homogeneity
and nearly theoretical density were prepared. The starting 4-5 nm UO2 material was
synthesized by two different methods. Controlled precipitation in aqueous media (see
Chap. 3) and thermal decomposition in organic media (see Chap. 4). After consolidation of the green bodies, controlled sintering followed. The structure and properties
of the final nc-UO2 -monolithic ceramic was determined by optical, mechanical and
thermophysical techniques.
121
Chapter 7. nc-UO2 monolith consolidation and characterization
7.2
Compaction methods
Different alternative routes for consolidation of powder into green bodies have been
tested and are briefly presented in the following sections.
7.2.1
Conventional uniaxial pressing
In conventional uniaxial pressing an axial force of up to several kN is applied onto a
column of loose (as poured) powder contained in a steel-die (usually of circular section
with diameter ≤ 1 cm) to form a pellet. The nc-UO2 powder was first crushed by
hand in a mortar for 15 min before compaction into pellets was made at different
pressing forces (between 9 and 23 kN). A hard hydraulic press (PW 10 ES-Servo
electro-hydraulic bi-directional press) and a steel-die with diameter of 6.5 mm were
used for this purpose (Fig. 7.1). Before the pressing the nc-UO2 monoliths, a specimen
just Zn-stearate was pressed to lubricate the die-walls. No Zn-stearate was added to
the nc-UO2 . The Zn-stearate is normally used as lubrication of the die-walls to avoid
the breaking of the pellet during compaction.
Figure 7.1: Hydraulic press (ITU) and nc-UO2 green pressed pellet.
Monoliths between 6.24-6.33 mm in diameter and height between 1.58-3.70 mm
were obtained. Their green (geometrical) densities were calculated by weighing
and measuring the geometry of the pressed pellets. The theoretical densities (TD)
were calculated in percentage of the bulk-UO2 (large-grain or micron-size-grain)
(TDU O2 =10.96 g/cm3 ). A maximal green density of 55% TD was achieved at 23 kN
(see Fig. 7.2).
122
7.2. Compaction methods
Figure 7.2: Green density and theoretical density (TD) of the nc-UO2 pressed pellets vs.
applied force.
7.2.2
Float-packing
The uniform packing of particles within green bodies of non-sintered or non-thermally
treated is a critical precondition for the preparation of dense, defect-free ceramics
with superior optical and mechanical properties. To reach nc-UO2 green pellets with
higher homogeneity than the pellets obtained by the traditional pressing (Sec. 7.2.1),
a controlled consolidation and drying by float-packing, according to the published
study of [Godlinski et al., 2002], was tested for the nc-UO2 material from the aqueous
precipitation process. For this purpose nc-UO2 powder from the aqueous method
(Chap. 3) was dispersed in bi-distilled water (solution densities ∼1 g nc-UO2 /cm3 ),
using a high power ultrasound device (HD 3200 SONOPLUS Ultrasound-Homogenizer
from Bandelin Fig. 7.3a) for 10 min with the aim to break the possible agglomerates
in the solution.
The suspension was poured into moulds and the specimens were slowly dried over a
period of 8 weeks. At the beginning a random distribution of stabilized nc-UO2 particles in suspension, was present. With time, sedimentation of bigger and agglomerated
particles initiated with the formation of a first layer with the bigger particles at the
bottom of the mould meanwhile the small particles stayed in suspension. As water is
continuous evaporating the concentration of small particles in suspension increases and
their movement is limited up to a point where the compact is formed. Packing of the
smallest nc-UO2 keep on until no water is present in the mould and a thick uniform
layer of fine particles is formed over the first layer of larger particles formed at the
beginning of the precipitation. The process led to homogeneous green compacts that
despite the low drying rates used exhibited cracks in some of the bodies formed. A
scheme of the process followed in this work, as from [Godlinski et al., 2002], is shown
in Fig. 7.3b.
123
Chapter 7. nc-UO2 monolith consolidation and characterization
(a)
(b)
Figure 7.3: a.) Dispersion of nc-UO2 in water with homogenizer. b.) Representation of the
float-packing process taken from [Godlinski et al., 2002].
7.3
Characterization of the nc-UO2 monoliths.
The structure and morphology of the obtained products by the previous consolidation
processes were characterized by means of optical microscopy (OM), X-ray diffraction
(XRD) and scanning electron microscopy (SEM).
7.3.1
Green Specimens.
7.3.1.1
Conventional pressed pellets of nc-UO2 from aqueous route.
With/without thermally pre-treated powder.
The nc-UO2 material from the aqueous precipitation route was pressed with and
without thermal pre-conditioning. The pre-treatment of the powder at specific
temperature was an attempt to avoid possible cracks due to the evaporation of
the possible trapped water in the material during the sintering step. The nc-UO2
powder was calcined at 400°C under Ar/5%H2 atmosphere with heating and cooling rates of 200°C/h, while the holding-time at maximum temperature was 1.5 h
(Fig. 7.10). After calcination the powder was crushed in an agate mortar to break
the possible agglomerates and was further comminuted by hand for 15 min to further
diminish and homogenize the particle size. A picture of a green pellet obtained by
pressing from this powder is shown in Fig. 7.4. A stable structure and a smooth
surface was observed. A typical microstructure of this kind of pellet is shown in Fig. 7.5.
Figure 7.4: Green pellet of nc-UO2 from aqueous route obtained by conventional uniaxial
pressing.
124
7.3. Characterization of the nc-UO2 monoliths.
Figure 7.5: Typical microstructure of conventional pressed nc-UO2 green pellet.
Figure 7.6: Schematic calcination steps for nc-UO2 powders from aqueous and organic routes.
7.3.1.2
Float packing consolidation of nc-UO2 from aqueous route in pellet
form.
A picture of a green pellet of nc-UO2 from aqueous route, consolidated by float packing
as described in Sec. 7.2.2 is shown in Fig. 7.7. A smoother surface was observed in
these kind of pellets. The microstructure appeared much more homogeneous than in
the pellets consolidated by pressing (Sec. 7.3.1.1).
7.3.1.3
Conventional pressed pellet of nc-UO2 from organic route. Thermally pre-treated powder.
The nc-UO2 from organic route was pressed after thermal pre-conditioning. The
treatment at temperature of the powder was aimed to make it free from possible
adsorbed organic compounds from the preparation process, which could provoke cracks
during their pyrolysis in the sintering step when the porosity of the ceramic becomes
125
Chapter 7. nc-UO2 monolith consolidation and characterization
Figure 7.7: Green pellet of nc-UO2 from aqueous route obtained by float packing consolidation.
closed. The nc-UO2 powder was calcined in two steps in an oven (Linn tube furnace).
The first heating was made at 500°C under O2 during 1 h to burn the organics. At
this temperature the organics are presumable gone as the thermogravimetric graph
has shown (Fig. 6.1). The second heating was made at 700°C 2 h under Ar/5%H2 to
reduce again the possible oxidated UO2 -material layer created in the first calcination
step. Heating and cooling rates of 200°C/h were used (Fig. 7.6). After calcination the
powder was crushed in an agate mortar (see Fig. 7.8) to break the agglomerates. The
powder was ground by hand for 15 min to further reduce and homogenize the particle
size. The powder was then pressed to pellet form under the conditions described
in Sec. 7.2.1. A picture of a green pellet of nc-UO2 from organic route obtained by
this method is shown in Fig. 7.9. A tough structure and a smooth surface were observed.
Figure 7.8: Mortar with thermally treated nc-UO2 powder from organic route.
Figure 7.9: Green pellet of nc-UO2 from organic route obtained by conventional uniaxial
pressing.
7.3.2
Sintered of the nc-UO2 green bodies.
The pellets were sintered in an oven (metal furnace from Degussa (ALD) VSL 10/18)
following different thermal profiles but always reaching lower plateau temperature than
126
7.3. Characterization of the nc-UO2 monoliths.
the micron-size powder in the sintering of traditional micro grain-UO2 pellets. For the
latter, a treatment at 1600°C during a time of up to 18 h under Ar/5%H2 is applied to
guarantee a high density of the final sintered pellet. These high temperatures and long
times would increase tremendously the size of the nanocrystalline material. Therefore
milder conditions were tested.
The nc-UO2 green pellets from aqueous and organic routes prepared by conventional
uniaxial pressing (Sec. 7.2.1) were heated for 1 h at 600°C and sintered at 1200°C during
4 h. Heating and cooling rates of 200°C/h, as well as reducing dynamic Ar/5%H2
atmosphere (Fig. 7.10) were employed. Some pictures of nc-UO2 pressed pellets of
powders from the aqueous and organic routes are shown in Fig. 7.11 and Fig. 7.12,
respectively. The pellets sintered presented a strong appearance although fine cracks
were visually observable in some cases. Sintering densities between 75.5-90.5% of the
theoretical density (TDU O2 =10.96 g/cm3 ), were obtained.
Figure 7.10: Schematic program for two-step sintering under Ar/5%H2 atmosphere.
For the nc-UO2 green pellets from float-packing (Sec. 7.2.2), a mild thermal
treatment was used to achieve densification of the samples. In this case, no powder
thermal pre-treatment was done because firmly consolidated green monoliths were
already formed from the fluid by this process. Therefore a solely calcination and
sintering program was applied. The monoliths were heated in various steps at different
rates: namely from 20°C to 300°C with a rate of 15°C/h, then from 300°C to 600°C
with a rate of 30°C/h and finally from 600°C to 1200°C with a rate of 150°C/h. The
two first steps with slow heating rates were designed to smoothly release the residual
water. During the last step with fast heating rate and plateau at 1200°C for 4 hours,
final sintering was achieved. Cooling down from high temperature to room temperature
was done in a unique step at rate 150°C/h (Fig. 7.13). Ar/5%H2 atmosphere was
used in this step. This oven heating profile with the first two slow steps had the aim
to let the water still present in the monoliths to slowly evaporate, but also to avoid
possible cracks which might occur by internal overpressure if faster heating ramps were
applied. The heating profile used for the conventional pressed pellets (see Fig. 7.10) was
also here tested, but the final macrostructure of the samples was of much poorer quality.
Complementary dilatometry (characteristics in Sec. 2.6) experiments were per127
Chapter 7. nc-UO2 monolith consolidation and characterization
Figure 7.11: Aqueous route nc-UO2 sintered pellet.
Figure 7.12: Organic route nc-UO2 sintered pellet.
formed to compare the shrinkage of the fabricated nc-UO2 pellet with that of bulk-UO2
[Lahiri et al., 2006] produced by a standard fabrication process (large grain). The
resulting relative linear shrinkage for the two kinds of materials as a function of temperature is represented in Fig. 7.14. The experiment was carried out using a heating
rate of 0.5°C/min up to 1100°C for nc-UO2 (1°C/min up to 1700°C for bulk-UO2
[Lahiri et al., 2006]). In the picture it is seen that the shrinkage profile as a function of
temperature for the nc-UO2 material is shifted by 587°C towards lower temperatures
compared to that of standard bulk UO2 . This describes the overwhelming sintering
activity, triggered by the specific area, of the nanocrystalline oxide.
The dilatometry curves show that the nc-UO2 starts indicating remarkable shrinkage already at very low temperatures as low as 200°C, with the maximum sintering
rate being shown at around 740°C. Two sintering steps are observable. At first step up
to 720°C with a weight lose of 12.3%. A second step up to 955°C with a weight lose of
9.1%(total weight lose of 21.4%). These maximum and final sintering temperatures are
clearly much lower than those observed for the bulk-UO2 , which shows the sintering
onset at temperatures about 900°C and the maximum sintering rate at about 1200°C.
The total weight lose was here of 16.5%. Also the temperature range from onset to
completion of the densification occurred at much more lower temperatures for the
nc-UO2 (200-955°C), compared to the bulk-UO2 [Lahiri et al., 2006] (900-1540°C).
128
7.3. Characterization of the nc-UO2 monoliths.
Figure 7.13: Schematic heating program for slow calcination and sintering under Ar/5%H2
atmosphere.
Figure 7.14: Relative linear shrinkage and its derivative of the nc-UO2 ceramic as a function
of temperature. Comparison with bulk-UO2 taken from [Lahiri et al., 2006].
129
Chapter 7. nc-UO2 monolith consolidation and characterization
Likewise the sintering activation energy for nc-UO2 pellet by conventional compaction method performed (Sec. 7.2.1) and sintered in oven under Ar/5%H2 , has been
determined using the dilatometer data presented in Fig. 7.14. The Young and Cutler
non-isothermal method [Young and Cutler, 1970] was applied according to Eq. 7.1,
where n is a constant characteristic for the shrinkage mechanism, Q is the apparent
activation energy for densification, ΔL/L0 is the shrinkage, R is a constant of value
8.314472 JK −1 mol−1 , while T in that case is a function of time T (t). The Arrhenius
plots obtained for the nc-UO2 and bulk-UO2 are presented in Fig. 7.15.
−nQ
ΔL/L0
= const · e RT
T
(7.1)
Taking in Eq. 7.1 the value n = 1/3 as characteristic for the sintering step
dominated by grain boundary diffusion, the sintering activation energy was determined
as Q = 171 ± 7 kJ/mol for the nc-UO2 monolith (Q = 287 kJ/mol for bulk-UO2
[Lahiri et al., 2006]). The characteristic temperature ranges where the densification
mechanisms were activated differed considerably between nc-UO2 and the reference
bulk-UO2 . This critical temperature range is 720-740°C for nc-UO2 , as compared with
that of 950-1200°C for bulk-UO2 (Fig. 7.15).
Figure 7.15: Arrhenius plot of the initial densification stages for a nc-UO2 by conventional
compaction pressed and sintered in oven under Ar/5%H2 .
The grain boundary diffusion (n = 1/3) is the the mostly accepted diffusion
mechanism for the initial stage of densification. However, other diffusional mechanisms
may be also active during this initial sintering stage, as n = 1/2 which takes into
account the volume diffusion for the sintering activation. The energy value for this
coefficient for the nc-UO2 monolith was determined as Q = 114 ± 5 kJ/mol.
130
7.3. Characterization of the nc-UO2 monoliths.
7.3.3
Macro and microstructural characterization of the ncUO2 monoliths.
Characterization of macrostructures by optical microscopy (OM), and microstructures
by fresh-fracture observation by scanning electron microscopy (SEM), for the different
samples at different magnifications are in Table 7.1 summarized and images in the
following presented. The instrument used for SEM, as well as the preparation of the
samples, are described in Sec. 2.3.1. A fcc fluorite structure (Fm-3m space group) with
a lattice parameter of 0.5470(0) nm has been found for all nc-UO2 monoliths.
Figure 7.16: Aqueous-Pressed. Macrostructure of conventional-pressed and sintered (1200°C)
pellet from the aqueous route nc-UO2 -powder. The scale bar is 100 μm.
Figure 7.17: Aqueous-Pressed-PTT. Macrostructure of conventional-pressed and sintered
(1200°C) pellet from the aqueous route nc-UO2 -powder. Previous thermal treatment for
dehydration of the nc-UO2 powder before pressing, was done. The scale bar is 100 μm.
The macrostructure-view for the four different nc-UO2 microstructures indicates that aqueous-route-powder monoliths produced by float packing consolidation
(Aqueous-Float Packing - Fig. 7.19) show better structure uniformity. The conventionalpressed monoliths from organic-route-powder (Organic-Pressed-PTT - Fig. 7.22; where
PTT means previous Powder Thermal Treatment), show the best performance from
the point of view of sintering cracks, as well as a strong structure. Looking at
the quality, the conventional-pressed monoliths of pre-dehydrated powder from the
aqueous route (Aqueous-Pressed-PTT - Fig. 7.17) present few cracks in the pellet
rim, but also a strong structure. In the case of the conventional-pressed monoliths
of the aqueous-route-powder without dehydrating pre-treatment (Aqueous-Pressed
- Fig. 7.16), many of macrocracks across the whole sample are present. Similar
theoretical densities were observed, being higher (about 90%) for the Aqueous-Float
Packing and the Organic-Pressed-PTT (Table 7.1) pellets.
131
Chapter 7. nc-UO2 monolith consolidation and characterization
(a) The scale bar is 50 μm.
(b) The scale bar is 5 μm.
(c) The scale bar is 1 μm.
Figure 7.18: Aqueous-Pressed-PTT. Fresh-fracture microstructure of conventional-pressed and
sintered (1200°C) pellet from the aqueous route nc-UO2 -powder. Previous thermal treatment
for dehydration of the powder before pressing, was done.
Figure 7.19: Aqueous-Float Packing. Macrostructure of float packed consolidated and sintered
(1200°C) pellet from the aqueous route nc-UO2 -powder. The scale bar is 100 μm.
(a) The scale bar is 50 μm.
(b) The scale bar is 2 μm.
(c) The scale bar is 500 nm.
Figure 7.20: Aqueous-Float Packing. Fresh-fracture microstructure of float packed consolidated and sintered (900°C) pellet from the aqueous route nc-UO2 -powder.
132
7.3. Characterization of the nc-UO2 monoliths.
(a) The scale bar is 5 μm.
(b) The scale bar is 2 μm.
(c) The scale bar is 1 μm.
Figure 7.21: Aqueous-Float Packing. Fresh-fracture microstructure of float packed consolidated and sintered (1200°C) pellet from the aqueous route nc-UO2 -powder.
Figure 7.22: Organic-Pressed-PTT. Macrostructure of conventional pressed and sintered
(1200°C) pellet from the organic route nc-UO2 -powder. Previous thermal treatment for burning of the capping organics before pressing, was done. The scale bar is 100 μm.
(a) The scale bar is 5 μm.
(b) The scale bar is 2 μm.
(c) The scale bar is 1 μm.
Figure 7.23: Organic-Pressed-PTT. Fresh-fracture microstructure of of conventional pressed
and sintered (1200°C) pellet from the organic route nc-UO2 -powder. Previous thermal treatment for burning of the capping organics before pressing, was done.
133
134
400°C-1.5h
500°C-1h + 700°C-2h
Powder thermal
pre-treatmenta
Sinteringc
profile
conventional (23 kN) 1200°C-4h Fig. 7.10
conventional (23 kN) 1200°C-4h Fig. 7.10
float packing
900°C-4h Fig. 7.13
float packing
1200°C-4h Fig. 7.13
conventional (23 kN) 1200°C-4h Fig. 7.10
Compactionb
type
81
87
90
91
TD(%)d
Fig. 7.16
Fig. 7.17
Fig. 7.19
Fig. 7.22
Macrostructure
OM
Fig.
Fig.
Fig.
Fig.
7.18
7.20
7.21
7.23
Microstructure
SEM
212(47) nm
197(25) nm
202(34) nm
Grain Sizee
(nm)
a.) Powder thermal pre-treatment profile in Fig. 7.6. b.) Conventional uniaxial pressing (Sec. 7.2.1), float packing (Sec. 7.2.2). c.) Different profiles were used
independently of the final temperature. Sintering under Ar/5%H2 . d.) TDU O2 =10.96 g/cm3 . e.) SEM pictures average grain size. f.) Powder from the aqueous route
(Chap. 3). g.) Powder from the organic route (Chap. 4). h.) Previous powder thermal treatment (PTT).
Aqueousf -Pressed
Aqueousf -Pressed-PTTh
Aqueousf -Float Packing
Aqueousf -Float Packing
Organicg -Pressed-PTTh
nc-UO2 monoliths
Table 7.1: Characterization of macro- and microstructures of the different types of nc-UO2 monoliths.
Chapter 7. nc-UO2 monolith consolidation and characterization
7.3. Characterization of the nc-UO2 monoliths.
All macrostructures, with exception of the Aqueous-Float Packing (Fig. 7.19),
show non-homogeneous densification (residual porosity between densified areas). The
Aqueous-Pressed-PTT (Fig. 7.17) pellet presents also a good quality in comparison to
rest, from the point of view of the densification. This kind of pellet shows the lowest
proportion of residual porosity and largest size of the dense areas (>300 μm). The
structure homogeneity of the pellet Aqueous-Float Packing (Fig. 7.19) could help to
elucidate the origin of the highly dense areas surrounded by residual porosity seen
in the pressed pellets. As the Aqueous-Float Packing pellet was compacted without
help of external pressure, we can exclude in this case the existence of pressure-induced
green-density heterogeneities.
Nevertheless, the optical microscopy can only say something about the supra-micron
range. It is also important to understand the highly dense and more porous regions
with the study of the microstructure by SEM to see which kind of structure stays
behind. Looking at the grain-structure of the fresh fracture by SEM, all samples show
grains about 200 nm (100 nm to 250 nm are the typical values observed for the HBS;
see Chap. 1) in the dense areas (Table 7.1). The dense areas are not single grains as it
can be observed in the SEM images. The temperature was too low for that.
The SEM images from the Aqueous-Pressed-PTT pellet (Fig. 7.18), show a pretty
homogeneous grain structure in contrast with the large inhomogeneities showed in
its OM images (Fig. 7.17). The grains are acceptably small (average grain size
of 212(47) nm) throughout the whole sample section. There is no indication of
exaggerated grain growth, as a priori suggested from the OM-pictures (large dense
islands). However, the grains do not look well joined. Micro-porosity and somewhat
loose grains, separated by tiny cracks, are visible. It may be possible that the islands
in the OM micrograph arose from the compaction or sintering preparation. Perhaps
pull-out may have been an issue.
For the Aqueous-Float Packing pellet, two different sintering temperatures were
analysed. In the fresh fracture SEM images of the pellets sintered at low temperature
of 900°C (Fig. 7.20), not well defined grains are observable. The sinter of the crystals is
still under development. For the nc-UO2 pellet under the same method of preparation
(Aqueous-Float Packing) and sintered at 1200°C (Fig. 7.21), the fresh fracture SEM
pictures show an striking tendency to form apparently closed pores. The pores,
probably steaming from still removal of water and others, are smaller than in the
typical HBS, but closed likewise in this zone in irradiated pellets. An average grain
size of 197(25) nm was here determined.
The fresh-fracture micostructure images from the Organic-Pressed-PTT pellet
(Fig. 7.23), show an homogeneous grain structure. Micro-porosity as well as not well
joined grains are here also observable. Grain sizes in the 200 nm range were here found
(average grain size of 202(34) nm).
7.3.4
Results and discussion.
Nanocrystalline uranium oxide ceramics with nearly full density have been prepared.
The starting 4-5 nm UO2 material was synthesized by the two different methods. A
controlled precipitation in aqueous media (see Chap. 3) and a thermal decomposition
in organic media (see Chap. 4). All materials had narrow particle-size distribution.
135
Chapter 7. nc-UO2 monolith consolidation and characterization
Different alternative routes for consolidation (e.g. conventional uniaxial pressing, float
packing) into green bodies have been tried (Sec. 7.2). Afterwards the green bodies
were sintered at temperatures between 900°C and 1200°C (Sec. 7.3.2).
Complementary dilatometry experiments were performed to compare the shrinkage
of the fabricated nc-UO2 pellet with that of bulk-UO2 produced by a standard
fabrication process (large grain). The temperature range from onset to completion of
the densification occurred at much more lower temperatures (Fig. 7.14) for the nc-UO2
(200-955°C, with a maximum sintering rate at 740°C), compared to the bulk-UO2
[Lahiri et al., 2006] (900-1540°C, with a maximum sintering at 1200°C). The reason
of that might be the higher surface present in the nc-UO2 compared with the bulkUO2 material, rendering the sintering to become more effective (at lower temperatures).
Likewise the sintering activation energy for nc-UO2 pellet by conventional compaction method performed (Sec. 7.2.1) and sintered in oven under Ar/5%H2 , has been
determined using the dilatometer data presented. The sintering activation energy
was determined as Q = 171 ± 7 kJ/mol for the nc-UO2 monolith (Q = 287 kJ/mol
for bulk-UO2 [Lahiri et al., 2006]). The grain boundary diffusion (n = 1/3), used for
the calculation, is the mostly accepted diffusion mechanism for the initial stage of
densification. However, other diffusional mechanisms may be also active during this
initial sintering stage, as n = 1/2 which takes into account the volume diffusion for the
sintering activation. The energy value for this coefficient for the nc-UO2 monolith was
determined as Q = 114 ± 5 kJ/mol.
Characterization of macrostructures by OM, and microstructures by the freshfracture observation by SEM, for different samples at different magnifications, was
performed. In the Aqueous-Pressed monoliths (Fig. 7.16), many of macrocracks
across the whole sample were present. The case of Aqueous-Pressed-PTT monoliths
(Fig. 7.17) presented few cracks in the pellet rim. The risk to create fractures during
the sintering of compacted nano-powders because of the rapid closure of the channels
and the hindered gas-exhaust, is very common. This tends to occur for green bulks
produced from uniaxial pressing of dried particles. However, no macrocracks have been
observed on the Organic-Pressed-PTT monoliths (Fig. 7.22). All macrostructures, with
exception of the Aqueous-Float Packing pellet (Fig. 7.19), showed non-homogeneous
densification (residual porosity between densified areas). The Aqueous-Pressed-PTT
pellet (Fig. 7.17) presented also a good quality in comparison to rest, from the point
of view of the densification.
The highly dense areas surrounded by residual porosity seen in the conventional
pressed pellets after sintering (see Aqueous-Pressed-PTT -(Fig. 7.17) and OrganicPressed-PTT -Fig. 7.22), independently of the material used, look similar to the
microstructure heterogeneities shown by [Yongvanich et al., 2010]. In that publication
a preparation using a similar route (dry pressing and pressureless sintering of calcined
nanopowders from precipitation process), was performed. The dense islands seem to
arise from the initial steps of the process (e.g. nanopowder conditioning, drying/precalcination). It could be that if the raw material is not well dispersed, the agglomerates
could affect the sintering or pre-sintering steps.
Looking at the fresh-fracture surfaces, the microstructure of the Aqueous-Float
Packing pellet sintered at 1200°C under Ar/5%H2 (Fig. 7.21), was the closest approxi136
7.4. Mechanical properties of nc-UO2 .
mation to the HBS material until now obtained. But also the microstrucutres observed
conventional-pressed pellets, Aqueous-Pressed-PTT (Fig. 7.18) and Organic-PressedPTT (Fig. 7.23), could be a suitable option.
The average grain size in the different pellet samples was in the 170-250 nm range.
Here a major success of this work was achieved. Also a striking tendency to form
closed nanopores from still removal of water or organics (depending on the sample)
with size <200 nm, was observable. The pores-size was smaller than the one observed
for the HBS (∼1 μm), but likewise in this zone in irradiated pellets, closed. Nanopores
can inhibit grain-growth (or pore-drag). Pore-drag is mainly effective for pores with
dimension comparable or smaller than the grain size (boundary control). So, an
increasing of the pore size should be achieved. However, because of the closed pores,
the chances that in such a material under irradiation the fission-gas gets swept and
stored into them, are high. That should be proved in-pile experiments.
7.4
Mechanical properties of nc-UO2.
The mechanical response of final sintered pieces of nc-UO2 ceramics, was studied via
indentation. The expected behaviour was an increase of the mechanical properties of
the nc-structure in comparison to larger grain sized monoliths of same composition
due to grain size effects, as well as due to the better densification of the nc-pellets.
The porosity in the material has an enormous influence in its mechanical properties
due the zero participation of the voids to the load-bearing capacity of the material.
The estimation of the mechanical properties of a material as e.g. Young’s modulus
(E) is achievable by different prediction models. These empirical, mechanistic and
microstructure-geometry dependent models, are based on supposed ideal structures.
Hence, real experimental data obtained from close to ideal and well characterised
microstructures are fundamental to validate the assumed suppositions. Mechanical
properties as Vickers Hardness (HV ), Knoop Hardness (HK ) and Young’s modulus (E)
were measured and calculated from Vickers and Knoop indentation for sintered nc-UO2
pellets obtained by different methods (Aqueous-Pressed, Aqueous-Float Packing and
Organic-Pressed). Micro- and macro-structure characterization of these pellets have
been described in Sec. 7.3.3. Also scanning acoustic microscopy (SAM) has been used
in some of the samples for the estimation and comparison of the Young’s E-modulus
obtained by indentation. Finally a study by in-situ high pressure X-ray diffraction
(HP-XRD) has been performed for the study of a possible bulk modulus dependence
of the crystal size dependence in nc-UO2 .
7.4.1
Hardness and Young’s modulus of nc-UO2 monoliths as
probed by Vickers and Knoop indentation.
The microindentations were performed as described in Sec. 2.7.1. The evaluation of
the indentations was made by optical microscopy. Representative pictures for each
load applied of the indentation prints on different nc-UO2 pellets (Aqueous-Pressed,
Aqueous-Float Packing and Organic-Pressed), are shown in Fig. 7.25 and Fig. 7.26
for the Vickers case, and Fig. 7.27 for the Knoop case. Vickers Hardness (HV ) and
Knoop Hardness (HK ) (dimensionless) numbers were calculated by Eq. 7.2 and Eq. 7.3,
137
Chapter 7. nc-UO2 monolith consolidation and characterization
respectively.
Figure 7.24: Typical Vickers (left) and Knoop (right) indentations.
50 μm
(a) 9.8 N
50 μm
(b) 4.9 N
50 μm
50 μm
(c) 1.96 N
(d) 0.98 N
20 μm
(e) 0.49 N.
Figure 7.25: Vickers indentations at different loads for the nc-UO2 Aqueous-Pressed pellet
(Fig. 7.17). Indentations performed with the instrumented indentor.
F
d2
with F (load in N ) and d (average diagonal in mm).
HV = 0.102 · 1.8544 ·
HK = 0.102 · 14.229 ·
F
a2
(7.2)
(7.3)
with F (load in N ) and a (long diagonal in mm).
The calculated values for HV (-) and HK (-) numbers at 9.8 N load, are shown in
Table 7.2. Also the average HV (-) as a function of the different loads used for each
kind of monolith, has been represented in Fig. 7.28.
The indentation tests have been used to evaluate the Young’s modulus or E-modulus
(E) of materials based on the demonstration of [Lawn and Howes, 1981]. The extent
of the elastic recovery during unloading after indentation is proportional to the H
E K
ratio of the material, where H is the corresponding Knoop hardness.
For the asymmetric Knoop pyramid indenter (see Fig. 7.24), where a = long
diagonal, b = short diagonal and a = 7.11 · b, the relation 7.4 has been verified (with
b
= ratio of the remaining imprint diagonals and α = constant) [Marshall et al., 1982].
a
b
b
−α·
=
a
a
138
H
E
(7.4)
K
7.4. Mechanical properties of nc-UO2 .
50 μm
50 μm
50 μm
(a) Aqu.-Press. 9.8 N
(b) Aqu.-Press. 4.9 N
(c) Aqu.-Press. 1.96 N
50 μm
50 μm
50 μm
(d) Aqu.-F.Pack. 9.8 N (e) Aqu.-F.Pack. 4.9 N (f) Aqu.-F.Pack. 1.96 N
50 μm
50 μm
20 μm
(g) Org.-Press. 9.8 N
(h) Org.-Press. 4.9 N
(i) Org.-Press. 1.96 N
Figure 7.26: Vickers indentations at different loads for three kind of nc-UO2 pellets (Table 7.1): Aqueous-Pressed (Fig. 7.17), Aqueous-Float Packing (Fig 7.19) and Organic-Pressed
(Fig 7.22). Indentations performed with the manual mictroindentor.
50 μm
(a) Aqueous-Pressed (Macrostruct. Fig. 7.17)
50 μm
(b) Aqueous-Float Packing (Macrostruct. Fig. 7.19)
50 μm
(c) Organic-Pressed (Macrostruct. Fig. 7.22)
Figure 7.27: Micrographs of Knoop indented nc-UO2 pellets.
139
Chapter 7. nc-UO2 monolith consolidation and characterization
Figure 7.28: Average HV (-) obtained for the different loads used for each kind of monolith.
With a calibration curve available for a wide range of well characterised materials,
the HEV ratio of a given brittle material can be estimated via its measured ab = ratio
with an error <10% [Marshall et al., 1982].
For this study, the calibration curve ab vs. H
(Eq. 7.5) was used as determined
E K
by [Marshall et al., 1982] and [Pujol et al., 2004] as:
b
= 0.143 − 0.497 ·
a
H
E
(7.5)
K
an indentation load
Average ab ratios of the nc-samples were determined using
H
of 9.8 N for the Knoop indentation. The corresponding E
value was derived by
K
the calibration curve determined by [Pujol et al., 2004] (Eq. 7.5). The representation
of the curve with the values of H
for the different nc-UO2 monoliths obtained is
E K
shown in Fig. 7.29 together with other reference materials.
Finally, E was from the Eq. 7.6 calculated, taking into account the HV values
determined by Vickers indentation likewise at 9.8 N load. The HV in GP a was
determined by the Eq. 7.7 [Spino et al., 2003].
HV
E = H E
(7.6)
K
where HV is the hardness given in GP a units, F is the indentation load in N (9.8 N),
and d is the average Vickers imprint diagonal in mm.
HV = 0.0018544 ·
140
F
(GP a)
d2
(7.7)
7.4. Mechanical properties of nc-UO2 .
Pujol et al., 2004:
1. S.Steel 316L
2. W-alloy
10. BL-7 glass
14. Polyethylene
13. Nylon
Marshall et al., 1982:
3. ZnO
4. ZnS
5. Hardened steel
6. MgF2
7. ZrO2
8. Al2O3
9. Si3N4
11. Glass ceramic
12. Soda-lime glass
b
H
a vs.
E K determined by [Pujol et al., 2004] (Eq. 7.5).
H
E K for the different nc-UO2 monoliths obtained by the
Figure 7.29: Calibration curve
Representation of values for
calibration curve together with other reference materials from [Marshall et al., 1982] and
[Pujol et al., 2004].
Obtained parameters for Vickers and Knoop indentation of the different pellets, are
detailed in Table 7.2.
7.4.2
Young’s modulus as probed by scanning acoustic microscopy (SAM).
The high-frequency acoustic microscopy is a non-destructive and non-invasive method,
very sensible to structural defects. It can reveal cracks at and underneath the
surface, therefore is more more powerful than optical microscopy to appreciate
cracks. These cracks affect the values of Young’s modulus (E) and naturally thermal
conductivity too, in the same way as porosity and other structure-obstacles do
(property deterioration). The characteristics of the acoustic microscope used, as well
as the preparation of the setup, are described in Sec. 2.7.3. The results here obtained
are just an approximation to compare and support the E measurements by indentation.
For embedded samples, just one surface was available. Therefore no echographic
analysis could be applied. However the measurement of the Rayleigh wave velocity (VR )
could be achieved just with one surface, and the E-modulus could be then only with
the VR and using the relations described by [Laux et al., 2012] determined. Measurements with a VR of 2300(30) m/s−1 were carried out on a sample from the float-packing
consolidation method and powder of the aqueous-synthesis (Aqueous-Float Packing;
mactrostructure in Fig. 7.19). A Poissson’s ratio (υ) about 0.3 for the UO2 was assumed. With this value and based on calibration laws performed on standard UO2
making the assumption of lenticular pores [Laux et al., 2012], it lead to a porosity of
10(2)% (∼ 90(2)% density) for the nc-UO2 sample. A Young’s modulus of to 155(5) GPa
141
Chapter 7. nc-UO2 monolith consolidation and characterization
Table 7.2: Obtained average parameters for Vickers and Knoop indentation for the different
nc-UO2 pellets.
HK a,c
b d
a
(-)
(-)
(-)
(GPa)
(GPa)
0.123(3)
0.041
5.4(5)
132(12)
Aqueous-Pressed (manual)
502(22) 466(28) 0.123(3)
Macrostr. Fig. 7.17
Aqueous-Float Packing (manual) 659(41) 579(15) 0.122(2)
Macrostr. Fig. 7.19
0.041
4.9(2)
121(5)
0.043
6.5(4)
150(9)
Organic-Pressed (manual)
Macrostr. Fig. 7.22
0.035
5.8(6)
166(17)
HV a,b
nc-UO2 Monoliths
(-)
Aqueous-Pressed (instrumented)
Macrostr. Fig. 7.17
547(52)
595(61) 545(65) 0.126(5)
H
e
E K
HV f
E
g
a.) For 9.8 N load. b.) From Eq. 7.2. c.) From Eq. 7.3. d.) Ratio of the remaining imprint diagonals
of the Knoop-pyramid indenter. e.) From the calibrated curve Eq. 7.5 [Pujol et al., 2004]. f.) From
Eq. 7.7. g.) From Eq. 7.6.
was determined using the following equation:
E = ρVT2
3VL2 − 4VT2
VL2 − VT2
(7.8)
where the transverse velocity (VT ) and the longitudinal (VL ) could be calculated by
the relations described in [Laux et al., 2012]. An acoustical image of a nc-UO2 sample
from Aqueous-Float Packing is shown in Fig. 7.30. No sub-surface microcracks were
observable in the area studied. Vickers and Knoop indentations previous done on some
parts of the surface are visible on the figure.
Figure 7.30: Acoustical image of a nc-UO2 sample from Aqueous-Float Packing.
7.4.3
Bulk and Young’s modulus of nc-UO2 as a function of
the crystal size by high pressure XRD.
A decrease of the Young’s modulus (E) for the nc-UO2 ∼150 GPa for the nc-UO2
(from aqueous-float packing Table 7.2) vs. 220 GPa for standard UO2 pellets have been
observed as probed by indentation. The interest of a high pressure XRD (HP-XRD)
measurement is to elucidate if the decrease of Young’s modulus (E) observed in the
nc-UO2 monoliths could have a dependence on the particle size. The Young modulus
142
7.4. Mechanical properties of nc-UO2 .
has two components (see Eq. 7.9). The compressibility of the lattice or compressibility
modulus B0 and the Poisson’s ratio. The structural defects, porosity and cracks make
the value of B0 to decrease, but also the crystallite size can induce a variation in the
B0 [Wang et al., 2001], [He et al., 2005].
E = 3B0 (1 − 2υ)
(7.9)
The crystal size dependence of the bulk modulus of nc-UO2 have been investigated
by means of in-situ high pressure X-ray diffraction (HP-XRD). Characteristics of the
device are shown in Sec. 2.7.2. Three different nc-UO2 sizes (4(0.5) nm, 6(0.5) nm and
34(0.5) nm), obtained by heating the as-produced nc-UO2 under Ar/5%H2 and measured by high resolution TEM (see Fig. 7.31), have been studied. The XRD at ambient
conditions showed that the three nc-UO2 samples crystallised with a cubic structure
(Fm-3m space group No. 225) and a cell parameter of a0 =5.46 Å, which is in good
agreement with the literature values [Idiri et al., 2004], [Zvoriste-Walters et al., 2013].
(a) 4 nm (scale bar of 10 nm)
(b) 6 nm (scale bar of 10 nm)
(c) 34 nm (scale bar of 10 nm)
Figure 7.31: TEM micrographs of UO2 at high resolution for the three different sizes
[Zvoriste-Walters et al., 2013].
The variation of the unit cell volumes with increasing pressure was measured with
the aim to study the compressibility behaviour of nc-UO2 as a function of the size.
Some of the high pressure X-ray diffraction (HP-XRD) patterns measured in-situ
for the three nc-UO2 sizes are shown in Fig. 7.32 and where already published in
[Zvoriste-Walters et al., 2013]. The nc-UO2 was compressed up to 23 GPa (for the
nc-UO2 4 nm sample), 21 GPa (6 nm), and 34 GPa (34 nm). The P (V ) compression
data for the three nc-UO2 sizes are shown in Fig. 7.33 [Zvoriste-Walters et al., 2013].
One expected problem was that the Bragg peaks of the nanomaterial were too wide
(short order range), which could mask the peak shift on applying pressure. But even
using an x-ray source in house, the three UO2 -sized samples showed a strong scattering
activity (Fig. 7.32).
143
Chapter 7. nc-UO2 monolith consolidation and characterization
Figure 7.32:
In-situ HP-XRD pattern of nc-UO2 for the three different sizes
[Zvoriste-Walters et al., 2013].
144
122(5)
148(7)
168(4)
198(4) 6.5(6)a
207(2), 4.5(4)b
B0
8(2)
9(3)
20(2)
101(6)
146(5)
182(2)
B0
18(2)
12(1)
14(1)
B00
113
144
175
–
B0
HP
HP
LP
B00
F(f)
BM, P(V)
13
12
15
B00
B00
8(2)
9(2)
17(1)
B0
122(5)
148(7)
171(4)
198(4), 6.6(6)a
LP
V
106(5)
148(4)
186(2)
B0
HP
14(1)
11(1)
11(1)
B00
Low pressure range (LP ); high pressure range (HP ); pressure-volume data fitted with the BM-EOS (BM, P (V )) with P = 3/2 · B0 · f (1 + 2f )5/2 · [1 + 3/2(B0 − 4)f ]
and f = [(V /V0 )−2/3 − 1]/2 [Birch, 1947]; normalised pressure vs. Eurelian finite strain plot (F (f )) with F = P/[3f (1 + 2f )5/2 ] and f = [(V /V0 )−2/3 − 1]/2; Vinet EOS
(V ) with P = 3B0 (1 − fV )/fV2 · exp[3/2(B0 − 1)(1 − fV )] and fV = (V /V0 )1/3 [Vinet et al., 1989]. a). [Pujol et al., 2004] b). [Idiri et al., 2004]
4 nm
6 nm
34 nm
Bulk
Sample
Table 7.3: Calculated bulk moduli (B0 ) and their first pressure derivative (B0 ) for the three nc-UO2 samples using different EOS, as well as bulk moduli
values for UO2 -bulk [Zvoriste-Walters et al., 2013].
7.4. Mechanical properties of nc-UO2 .
145
Chapter 7. nc-UO2 monolith consolidation and characterization
The experimental data were fitted to different equations of state an the bulk
modulus (B0 ) and its pressure derivative (B0 ) were determined. The data for the
three samples with the least-squares fit of the 3rd order Birch-Murnaghan equation of
state (BM-EOS) are shown in Fig. 7.33. The 3rd order BM-EOS is one of the most
used in material science and geophysics [Birch, 1947]. For clarity and due to the good
agreement in pressure measurement for the Cu equation of state (Cu-EOS) as internal
standard and the ruby scale [Piermarini et al., 1975], the x axis is defined just from
the pressures from the ruby scale. The bulk moduli obtained are reflected in Table 7.3
[Zvoriste-Walters et al., 2013]. Bulk moduli values for UO2 -bulk [Pujol et al., 2004]
and [Idiri et al., 2004] are also detailed. Because of the low pressure range in which
silicone oil has a quasi-hydrostatic sample environment [Meresse et al., 2000], only the
experimental data up to 10 GPa (were silicon used to solidify) was used (inset Fig. 7.33).
Another representation of the finite strain BM-EOS in terms of the normalised
pressure and the Eulerian finite strain which is more sensitive to experimental uncertainties [Birch, 1978], was also done. The compression data obtained with this method
are shown in Fig. 7.34 and the bulk moduli obtained are detailed in Table 7.3. As an
alternative approach to the BM-EOS, the Vinet EOS [Vinet et al., 1989] was also used
in order to determine the bulk moduli for the three nc-UO2 samples. The bulk moduli
obtained with this equation are reflected in Table 7.3.
Figure 7.33: Relative volumes vs. pressure. The lines represent the least-square fit of
the 3rd order BM-EOS to the experimental data. Insert Fig.: compression data from the
three nc-UO2 samples plotted in the low pressure (LP) range (LP up to around 10 GPa)
[Zvoriste-Walters et al., 2013].
146
7.4. Mechanical properties of nc-UO2 .
Figure 7.34: Normalised pressure as a function of the Eulerian strain for the three nc-UO2
samples. The solid lines represent a linear fit to the experimental data. In the F (f ) linear plot
the bulk modulus is obtained from the intercept on the F axis and the B0 from the gradient
F = B0 + (3B0 (B0 − 4)f )/2 [Zvoriste-Walters et al., 2013].
Figure 7.35: The bulk modulus plotted as a function of three crystal size samples (4 nm,
6 nm and 34 nm). A size approximation for the micro-sized bulk modulus UO2 from
[Pujol et al., 2004] to 200 nm has been done [Zvoriste-Walters et al., 2013].
7.4.4
Results and discussion.
Mechanical properties as Vickers Hardness (HV ), Knoop Hardness (HK ) and Young’s
modulus (E) were determined for sintered nc-UO2 pellets obtained by different
methods (Aqueous-Pressed, Aqueous-Float Packing and Organic-Pressed). Micro- and
macro-structure characterization of these pellets have been described in Sec. 7.3.3.
Also scanning acoustic microscopy (SAM) has been used in some of the samples for the
estimation and comparison of the Young’s E-modulus obtained by indentation. Finally
147
Chapter 7. nc-UO2 monolith consolidation and characterization
a study by in-situ high pressure X-ray diffraction (HP-XRD) has been performed for
the study of a possible bulk modulus dependence of the crystal size dependence in
nc-UO2 .
In the indentation study, an increase in hardness (HV ) of the nc-UO2 material for
the Organic-Pressed pellet, and more pronounced for the Aqueous-Float Packing pellet,
have been obtained (Table 7.2) in comparison with bulk-UO2 (HV(U O2 ) = 5.72 GP a).
A tendency of decreased
values for the different nc-UO2 pellets in ab , and therefore
increased values in H
, has been observed in comparison with the typical values for
E
K
= 0.026). As a consequence (see Eq. 7.6), and
unradiated standard-UO2 ( H
E K(U O2 )
despite as formerly said that the HV values of the nc-UO2 material appeared increased
with respect to standard-UO2 , rather low values for E (Table. 7.2) for all nc-UO2
monoliths have been observed in comparison with standard-UO2 (EU O2 = 220 GP a).
The smaller E-modulus was seen for the Aqueous-Float Packing sample (150(9) GPa),
which was about 30% lower than for bulk-UO2 .
This difference observed with respect to bulk-UO2 pellets, could be influenced by
microstructure imperfections (nanocavities at triple-grain junctions, pores, cracks,
etc.). That could be possible in the case of Aqueous-Pressed pellet, as it has been seen
in the macrostructure images (Fig. 7.17). However, the drop is still too large to be
attributed only to the presence of cavities. It would be equivalent to 30% porosity, not
agreeing with the apparent density of about 90% measured at least for the nc-UO2
Aqueous-Float-Packing pellet and the Organic-Pressed pellet (Table 7.1). Therefore,
it is believed that the effect observed is predominantly due to the presence of the
nanostructure, as trends of this type (i.e. increase of HV values and decrease of
E-modulus values) have been confirmed repeatedly in nanostructured materials.
The grain size observed on the fresh fracture pictures was about 200 nm for all the
different kind of pellets (Table 7.1). Hence, the difference of 30-40 GPa observed
between the E-modulus from the Aqueous-Pressed pellet and the Organic-Pressed and
Aqueous-Float Packing monoliths could be due to a better colloidal compaction of the
last ones (higher E values) and apparently indicating a better structural quality.
In contrast, the same type of tendency observed in the nc-UO2 specimens, i.e. with
increase of HV values and decrease of the E-modulus values, has been found before in
irradiated standard-UO2 fuel at high burn-ups (see Fig. 7.36 and Fig. 7.37). In this case
also the E-modulus decrease could not be fully attributed to a porosity increase and
was to contradict the effect of the fission products dissolution, which causes in reality
an increase of the material’s stiffness. Since with the increase of burn-up the irradiated
nuclear fuels transforms into a nano-recrystallized structure [Spino et al., 2012], the
effects of HV -increase and E-modulus decrease in the present work observed, were
attributed to the nanostructure. Just in the case of the Aqueous-Pressed pellet, an
HV -decrease is observed which could be due, as above mentioned, to the structural
imperfections.
In agreement with the above, measured reduction of the E-modulus in the nc-UO2
samples is perfectly matching the results of acoustic and Knoop indentation tests
in irradiated fuels with burn-up 80 GWd/tM (see Fig. 7.37), for which a fully
developed nanostructure (HBS) has been found in post-irradiation examinations
[Spino et al., 2012]. In contrast, the increase of hardness (HV ) matches well the values
of irradiated fuels and seems to respond to the Hall-Petch effect, which describes the
148
7.4. Mechanical properties of nc-UO2 .
↓
nc-UO2
Figure 7.36: Differences in the HV vs.
H
E K
behaviour of irradiated and non-irradiated UO2 .
increase of the strength of the material according to the inverse of the square root of
its grain size.
The acoustic microscope was also tested on the nc-UO2 sample from aqueous-float
packing. The estimated results for the E-modulus (155(5) GPa) were found to be
in agreement with those obtained by indentation (150(9) GPa Table. 7.2) where the
measurements of compressibility indicated also that the nc-UO2 sample exhibited an
E-modulus below that of standard UO2 (220 GPa).
Finally, the crystal size dependence of the bulk modulus of nc-UO2 have been
investigated by means of in-situ HP-XRD and the different B0 and B0 values were summarized in Table 7.3. Three different nc-UO2 sizes (4 nm, 6 nm and 34 nm), obtained by
heating the as-produced nc-UO2 under Ar/5%H2 , were studied up to 27) GPa. The fits
for the experimental data were done in a low pressure range (LP) up to around 10 GPa
(where solidification of the silicone oil occurs [Meresse et al., 2000]) and a high pressure
range (HP) (up to the maximum pressure achieved in this run of experiments). The
three fitting procedures used (3rd order BM-EOS (P (V ) and F (f ) plots) and V -EOS)
suggested a size dependence of the bulk modulus which drastically decrease with the
particle size. The best fit to all the compression data was obtained with the V-EOS (see
Table 7.3) and its bulk moduli were represented in Fig. 7.35 as a function of the particle
size. The B0 values with this fit obtained were of B0 (4nm)=122(5), B0 (4nm)=8(2),
B0 (6nm)=148(7), B0 (6nm)=9(2) and B0 (34nm)=186(1), B0 (34nm)=11(1). A size
approximation for the micro-sized bulk modulus UO2 from [Pujol et al., 2004] to
200 nm has been done [Zvoriste-Walters et al., 2013]. A decrease in the bulk moduli
of about 60%, 25% and 14% (for the 4 nm, 6 nm and 34 nm samples, respectively)
have been identified in comparison with the reported standard bulk-UO2 . Similar bulk
moduli values were obtained from the F (f ) and P (V ). The small difference observed
between them (smaller values for the normalized pressure F (f )) might be because of
its expected more sensitivity to the experimental uncertainties [Birch, 1978].
149
Chapter 7. nc-UO2 monolith consolidation and characterization
Knoop Hardness
Irradiated fuels tests
(microacoustic)
±
nc-UO2
Figure 7.37: E values from microacoustic tests and Knoop indentation from irradiated fuels
[Baron et al., 2005] and nc-UO2 (this work).
Different works can be found in literature indicating contrary conclusions about
the variation of the compressibility modulus or bulk-modulus (B0 ) with the crystallite size. Some of these studies indicate no variation of B0 with the size of
the particles in materials such as Fe, CuO [Chen et al., 2001], [Wang et al., 2002].
Some others indicate an upward variation respecting their respective bulk materials
[Tolbert and Alivisatos, 1995] and [Qadri et al., 1996], for materials such as CdSe, CdS
and PbS. And most of them indicate an downward variation respecting their respective
bulk materials, for materials such as CeO2 , SnO2 [Wang et al., 2001], [He et al., 2005].
A difference of only 7% and only for grains <3 nm have been observed for nc-Ni by
[Zhao et al., 2006], [Zhang et al., 2007] because a higher compressibility of the surface
shell. Meanwhile a large large variation of bulk modulus with the crystallite size (from
150 GPa at 5 nm to 240 GPa at 70 nm) has been seen for nc-Al2 O3 [Chen et al., 2002].
In other studies, a complex two-phase structure (core-surface shell system) in nanocrystals has been described, making difficult the determination of an only bulk modulus
value under pressure [Palosz et al., 2004]. Also the influence of the crystallite size
on the pressure inducing phase transition, has been for different materials reported.
An increase of the transition pressure in nanocrystals in comparison to the bulk has
been shown in [Qadri et al., 1996], [Tolbert et al., 1996] [He et al., 2005]. Also, phase
transitions at much lower pressures relative to the bulk has been observed for other
nano systems [Olsen et al., 1999], [Rekhi et al., 2001].
Elastic moduli of a material is commonly dependent of microscopic interatomic
interactions. Particularly, the bulk modulus is directly dependent on the valence
electron density [Haines et al., 2001], [Brazhkin et al., 2002]. As a consequence, the
150
7.5. Thermophysical properties of nc-UO2 monoliths.
variation of the valence electron shells by modifying the surface to volume ratio (change
in crystal size), has also a variation in the bulk modulus values. For lots of materials a
value of 4 for B0 has been found using the third order Eulerian finite strain equation,
in agreement with other works where the interatomic potentials for fixed structures
was studied. Most of these materials where NaCl-type and the upper limit for B0 was
depending on the size of the attractive potential relative to the repulsive one. Values
for B0 about 6 for neutral solids or incompressible materials, or about 8 for ionic or
soft solids, like NaCl, were observed [Hofmeister, 1993]. Taking that in account, the
value of 20 for the B0 obtained for the 34 nm sample with the BM-EOS fit would
not have physical meaning. However, for some materials with values of B0 of 7 to 23,
just the V-EOS was valid, giving B0 values nearer to physically realistic potentials
[Hofmeister, 1993].
Also different observations could be done in the compression of the nc-UO2 . In
the curves of the 4 and 6 nm samples, two minor discontinuities appear shifted one
relative to the other towards bigger strains with decreasing particle’s size (see Fig. 7.33
and Fig. 7.34). The better fit was obtained for the 34 nm which had a more linear
compression curve. In this sample just a small discontinuity can be seen in the
pressure range 6.66 to 13.07 GPa (f =10.2e−3 -17.2e−3 ). The discontinuity at around
10 GPa in all the compression data might be due to the influence of non-hydrostatic
stress in the sample chamber. The discontinuity at higher pressures is similar to the
one observed for other materials as for AuIn2 and Cd0.8 Hg0.2 because of electronic
topological transitions [Godwal et al., 2010]. More studies should be done for nc-UO2
to clarify these deviations. Also some differences have been seen for the B0 and B0
values between the 34 nm UO2 sample in comparison with the 4 and 6 nm ones.
Higher values in B0 at LP than at HP have been seen for the smaller size samples. But
smaller values for at LP than at HP have been seen for the 34 nm UO2 sample. Also
the B0 , given by the slope of the curves, changes different for the 34 nm sample. That
could be due to the minor number of experimental points taken at LP for this sample.
A good agreement was found between the values obtained with the BM-EOS and the
V-EOS, but lower values for B0 have been seen with the last one for the 34 nm UO2
sample. These differences identified between the smaller-size samples and the bigger
one, could be due to critical particle size which could characterize the material with
different properties [Zvoriste-Walters et al., 2013].
7.5
Thermophysical properties of nc-UO2 monoliths.
The determination of elastic properties of UO2 is relevant particularly to reactortransients where a pellet cladding mechanical interaction (PCMI) and possibly cladding
failure is willing to occur. The level of stress in the UO2 -pellets can be then elucidated
by means of the elastic properties and thermal expansion.
However, worsening of the thermophysical properties due to the nano-size of the
particles could be a possible disadvantage for licensing purposes. Temperature diminution when melting point depression occurs, and thermal conductivity decrease, have
been observed for nanosized-grains respect to large-grains (10 μm). The latter is due to
the increase of grain boundaries and therefore increase of thermal boundary resistance
151
Chapter 7. nc-UO2 monolith consolidation and characterization
(Kapitza resistance) [Spino et al., 2012].
7.5.1
Thermal Diffusivity in nc-UO2 monoliths.
The nc-UO2 with grain size about 200 nm (217(47) nm determined by SEM) sample
(0.65 mm3 in diameter) was heated up to the temperature of measurement in a high
frequency furnace under Ar-atmosphere of 10−2 mbar. Several test points within the
temperature range 527°K to 1438°K (254°C to 1165°C) were taken. Experimental
characteristics are described in Sec. 2.8.1.
Fig. 7.38 shows the thermal diffusivity in function of temperature curves for nc-UO2
(∼200 nm) considering 90% density (determined by SAM in Sec. 7.4.2), as determined
by the laser-flash device (LAF I) (Sec. 2.8.1). Backward measurements with decreasing
temperature show quasi no modification. This indicates that the microstructure of
the specimens remained unaltered during the high temperature measurements (i.e.,
at T ≤ Tsintering =1200°C). The data obtained for the nc-UO2 monolith have been
extrapolated to 95% density to make the comparison with the 95% density bulk-UO2
from [Fink, 2000].
Figure 7.38: Thermal diffusivity of nc-UO2 (200 nm - 90% density) specimen upon temperature, extrapolated at 95% density for comparison with bulk-UO2 (large-grain) (95% density)
from [Fink, 2000]; red symbols: measurements at rising temperature, blue symbols: measurements at falling temperature levels.
7.5.2
Melting Point Depression in nc-UO2 monoliths.
The sub-second laser heating coupled with pyrometry has been already
in ITU proved with success in multiple occasions for bulk refractory oxides
[Ronchi and Hiernaut, 1996]
[Manara et al., 2005]
[Manara et al., 2008]
[Böhler et al., 2012] [Manara et al., 2012]. However first tests with nano actinide
oxides have been just in [Cappia et al., 2013] tested. Determination of the melting
point depression for the nc-UO2 monolith in function of the size was done by observing
the break point on the upward slope and was compared with the one for bulk-UO2
152
7.5. Thermophysical properties of nc-UO2 monoliths.
(large-grain). Characteristics of the melting point setup used are described in Sec. 2.8.2.
nc-UO2 samples 3 mm thick and 5 mm in diameter were used in the measurement.
Two different nano-grain sizes were tested (about 10(0.5) nm determined by TEM and
217(47) nm determined by SEM). The laser penetration depth was of a few micrometers, and according to the power some tens micrometers of material could be melt.
The grain growth was tried to be limited using a fast ramp. A post SEM determination in the region close the molten surface was done for the 10 nm pellet (Fig. 7.41, 7.42).
In Fig. 7.39 the measurement done for the 10 nm-UO2 (a=0.5438 nm) at 600 bar
He, is shown. A melting point depression of about 150°K with respect to the normal
value of bulk-UO2 (large-grain) (3140°K), was found.
Figure 7.39: Melting point measurement for 10 nm-UO2 sample.
In Fig. 7.40 the measurement done for the 200 nm-UO2 (a=0.5470 nm) at 600 bar
He, is shown. The melting point was observed at a similar temperature as for bulk-UO2
(3140°K).
Figure 7.40: Melting point measurement for ∼200 nm-UO2 sample.
153
Chapter 7. nc-UO2 monolith consolidation and characterization
In Fig. 7.41, the SEM images of the fresh fracture of melted nc-UO2 samples, are
shown. Thee grain growth was dramatically at these higher temperatures. Three
differentiated grain size areas were clearly observable (Fig. 7.41b). First area, from
the melted surface until ∼40 μm depth (Fig. 7.42a, 7.42b, 7.42c) with columnar
growth (typical from melting). Second area, from the melted surface until ∼115 μm
depth (Fig. 7.42d, 7.42e, 7.42f) with non columnar growth. These first and second
areas corresponded to the molten and refrozen zone. Third area appeared above the
115 μm from surface and corresponded to the unmolten zone (Fig. 7.42g, 7.42h, 7.42i).
However here a grain-growth was also observed with an average size of 241(70) nm,
due to the higher temperatures reached at that distance from the surface.
(a) The scale bar is 200 μm.
(b) The scale bar is 50 μm.
Figure 7.41: SEM images of the fresh fracture of surface-melted nc-UO2 sample. Three
different size areas (from surface to 40 μm depth, 40 μm to 115 μm and 115 μm to the
opposite surface) are distinguishable.
7.5.3
Results and discussion.
The thermal diffusivity for nc-UO2 (∼200 nm and a 90% density), was determined
between 254°C to 1165°C. Extrapolation to 95% density was done and same thermal
diffusivity as standard bulk-UO2 pellet with 95% density was found. Some studies
confirmed already that the effect of the grain size in the thermal conductivity is not
that accused up to a determined size, as initially though.
Determination of the melting point by laser-heating and pyrometric temperature
detection has been performed for compacted nc-UO2 with two different nano-grain sizes
(about 10 nm and 200 nm) and their variation with respect to bulk-UO2 (large-grain),
assessed. A melting point depression of about 150°K with respect to the normal value
of bulk-UO2 was found for the 10 nm-size nc-UO2 sample (Fig. 7.39). This reduction
would be a priori due to the nano-size grains. That has been already reported by
[Lai et al., 1996], [Lai et al., 1998], [Guisbiers, 2012]. However, the measured lattice
constant of the sample before melting (a=0.5438 nm) was below the value of bulk-UO2
(a=0.547 nm) and indicated in reality a hyperstoichiometric oxide, which would
also cause a melting point decrease. To corroborate the measured tendency with
the grain-size reduction, a strictly stoichiometric nc-UO2 sample would be needed.
154
7.5. Thermophysical properties of nc-UO2 monoliths.
(a) The scale bar is 50 μm.
(b) The scale bar is 20 μm.
(c) The scale bar is 5 μm.
(d) The scale bar is 20 μm.
(e) The scale bar is 5 μm.
(f) The scale bar is 2 μm.
(g) The scale bar is 20 μm.
(h) The scale bar is 2 μm.
(i) The scale bar is 1 μm.
Figure 7.42: SEM images of the three different size regions formed after surface melting of the
nc-UO2 sample. (First line of images): surface-40 μm, molten zone and columnar growth.
(Second line): 40 μm-115 μm, molten zone and non columnar growth. (Third line): 115 μmopposite surface, unmolten zone, grain growth (241(70) nm)
155
Chapter 7. nc-UO2 monolith consolidation and characterization
However, an identical melting point as for bulk-UO2 , was found for the 200 nm-sample
(Fig. 7.40) for which a stoichiometry of O/M=2.00 was confirmed from the lattice
constant measurement before melting.
7.6
Results and discussion.
Conversion of nanoparticle systems into dense nanostructured monoliths has been
achieved. The purpose was the synthesizing UO2 -nuclear fuels mimicking the HBS of
LWR-fuels (nanostructured), for which improved properties are expected compared to
standard fuel [Spino et al., 2012]. Monoliths with the two kind of nc-UO2 obtained by
the precipitation in aqueous media (Chap. 3) and in organic media (Chap. 4), were
performed.
Different alternative routes for consolidation (e.g. conventional uniaxial pressing,
float packing, etc.) into green bodies (Fig. 7.4) have been tried (Sec. 7.2). Afterwards
the green bodies were sintered at temperatures between 900°C and 1200°C under Ar/H2
atmosphere. The optimum sintering conditions were deduced from the long-isothermal
crystallite growth studies under He and Ar/H2 atmosphere (Table. 5.5). This ensured
lack of disproportionate grain growth risks even at the highest temperature used of
1200°C. The nc-UO2 material from the aqueous precipitation route was pressed with
and without thermal pre-conditioning. The pre-treatment of the powder at specific
temperature was an attempt to avoid possible cracks due to the evaporation of the possible trapped water in the material during the sintering step. The nc-UO2 from organic
route was pressed after thermal pre-conditioning. The treatment at temperature of the
powder was aimed to make it free from possible adsorbed organic compounds from the
preparation process, which could provoke cracks during their pyrolysis in the sintering
step when the porosity of the ceramic becomes closed. The pellets were after sintered in
an oven following different thermal profiles but always reaching lower plateau temperature than the micron-size powder in the sintering of traditional micro grain-UO2 pellets.
For the nc-UO2 green pellets from float-packing, a mild thermal treatment was used
to achieve densification of the samples. In this case, no powder thermal pre-treatment
was done because firmly consolidated green monoliths were already formed from the
fluid by this process. Therefore a solely calcination and sintering program was applied.
The slow steps took in this last oven profile had the aim to let the water still present in
the monoliths to slowly evaporate, but also to avoid possible cracks which might occur
by internal overpressure if faster heating ramps were applied. The pellets sintered
presented a strong appearance although fine cracks were visually observable in some
cases (Fig. 7.11 and 7.12). Sintering densities between 75.5-90.5% of the theoretical
density (TDU O2 =10.96 g/cm3 ), were obtained (Table. 7.1). An average grain size of
∼200 nm, replicating the HBS, was obtained for all the different sintered nc-UO2 pellets.
Additional dilatometry experiments were performed to compare the shrinkage
of the fabricated nc-UO2 pellet with that of bulk-UO2 (large-grain) produced by a
standard fabrication process. The temperature range from onset to completion of the
densification occurred at much more lower temperatures (Fig. 7.14) for the nc-UO2
(200-955°C, with a maximum sintering rate at 740°C), compared to the bulk-UO2
[Lahiri et al., 2006] (900-1540°C, with a maximum sintering rate at 1200°C). The
reason of that might be the higher surface present in the nc-UO2 compared with
the bulk-UO2 material, rendering the sintering to become more effective (at lower
156
7.6. Results and discussion.
temperatures). The sintering activation energy was determined as Q = 171 ± 7 kJ/mol
assuming surface diffusion and Q = 114 ± 5 kJ/mol assuming volume diffusion for
the nc-UO2 monolith, compared to Q = 287 kJ/mol determined for bulk-UO2 in
the literature [Lahiri et al., 2006]). Both diffusion mechanisms showed low values
of the sintering activation energies as typical for nanopowders. That means a clear
technological advantage in the fabrication of nc-UO2 monoliths due to its high
densification capacity at low temperatures. Furthermore, the nc-UO2 offered the
possibility of adjusting the grain size at will by varying sintering temperatures and
times. Maintaining an acceptably low temperature range, will diminish the costs and
simplify the manufacturing technology.
Characterization of macrostructures by optical microscopy (OM), and microstructures by fresh-fracture observation by SEM, for different samples at different
magnifications, was performed. Not well defined grains were observable in the freshfracture SEM images of the pellets sintered at low temperature of 900°C (Fig. 7.20).
The sinter of the crystals was still under development, therefore sintering temperatures
of 1200°C were used afterwards. Macrocracks across different samples were observed.
In the conventional-pressed monoliths from aqueous-route-powder and not dehydrating
pre-treatment (Aqueous-Pressed - Fig. 7.16), many of macrocracks across the whole
sample were present. The case of the conventional-pressed monoliths of pre-dehydrated
powder from aqueous-route (Aqueous-Pressed-PTT - Fig. 7.17) presented few cracks in
the pellet rim. No macrocracks have been observed on the conventional-pressed monoliths from organic-route and powder pre-thermal treatment (Organic-Pressed-PTT
- Fig. 7.22) and the aqueous-route-powder sample by float-packing (Aqueous-Float
Packing - Fig. 7.19). All macrostructures, with exception of the last one (Aqueous-Float
Packing - Fig. 7.19), showed non-homogeneous densification (residual porosity between
densified areas). Also the Aqueous-Pressed-PTT (Fig. 7.17) showed a good quality
in comparison to the rest, from the point of view of the densification. However,
improvements in the performance of the monoliths would be necessary to avoid the
problem of cracks in the sintered pellets (and therefore the diminishing material’s
properties).
Looking at the fresh fracture surfaces, the microstructure of the Aqueous-Float
Packing pellet and sintered at 1200°C, was the closest approximation to the HBS
material obtained until now. The average grain size for the different monoliths was
in the 170 nm to 250 nm range. So a success was found out meeting one goal: high
density and low grain size (Table 7.1).
Mechanical properties as Vickers Hardness (HV ), Knoop Hardness (HK ) and
Young’s modulus (E) were determined for sintered nc-UO2 pellets. An increase in
hardness (HV ) and low values for E-modulus (up to 30%) were in general seen for the
different nc-UO2 monoliths (Table 7.2) in comparison with bulk-UO2 . Also scanning
acoustic microscopy (SAM) was used for the estimation and comparison of the Young’s
E-modulus obtained by indentation. The results by SAM (E=150 GPa) matched the
ones derived from microindentation (E=155 GPa).
This difference observed with respect to bulk-UO2 pellets (220 GPa), could be
influenced by microstructure imperfections (nanocavities at triple-grain junctions,
pores, cracks, etc.). However, the drop was still too large to be attributed only to the
presence of cavities. The same type of tendency observed in the nc-UO2 specimens, i.e.
157
Chapter 7. nc-UO2 monolith consolidation and characterization
with increase of HV values and decrease of the E-modulus values, has been found before
in irradiated standard-UO2 fuel at high burn-ups. In this case also the E-modulus
decrease could not be fully attributed to a porosity increase and was to contradict
the effect of the fission products dissolution, which causes in reality an increase of the
material’s stiffness. Thus, since with the increase of burn-up the irradiated nuclear
fuels transform into a nano-recrystallized structure [Spino et al., 2012], the effects
of HV -increase and E-modulus decrease, likewise the particularities here found, was
attributed to the nanostructure.
Taking the value of Young’s modulus obtained by Knoop indentation (E=150 GPa)
as an indicative of the lattice compressibility, and assuming a Poisson’s ration of 0.31, a
compressibility modulus B0 =131.6 GPa (Eq. 7.9). This indicates a more compressible
lattice, i.e, a larger lattice-volume decrease with pressure, compared to bulk-UO2
(B0 =198 GPa [Pujol et al., 2004]). So the compressibility of nc-UO2 was in fact to
be larger than that of standard-UO2 . As the product between compressibility and
thermal expansion is constant in the Grüneisen relation (γ = αKT V /Cv = αKS V /Cp ,
where α=thermal expansion, KS =adiabatic bulk-modulus, KT =isothermal bulkmodulus, Cv =heat capacity at constant volume, Cp =heat capacity at constant
pressure, V =molar volume and γ=Grüneisen constant) [Grüneisen, 1912],a larger
compressibility (i.e. lower bulk modulus) will imply larger thermal expansion, as
well as a lower compressibility (i.e. higher bulk modulus) will imply lower thermal
expansion. A size-dependency of the physical-chemical properties of nc-UO2 was
confirmed. The thermal expansion increased with the size-decrease (see Fig. 5.5 and
Fig. 6.6), at the time that the bulk modulus decreased. This is compatible with
the Grüneisen relationship and the bulk modulus measurements as probed after by
HP-XRD. However, verification of the trend in Cp is still lacking, which is indeed
needed to complete the Grüneisen-relationship analysis.
A totally opposite behaviour was seen for UO2 -SF (SIMFUEL or simulated
nuclear fuel) where a lower thermal (less compressibility) expansion and a higher
bulk modulus, than for standard bulk-UO2 , were found. This increase in the bond
strength of the fuel with the BU, would traduced in a higher rigidity of the lattice
against temperature variations [Pujol et al., 2004]. However, measured reduction of
the E-modulus in the nc-UO2 samples was perfectly matching the results of acoustic
and Knoop indentation tests in irradiated fuels with burn-up 80 GWd/tM, for which a
fully developed nanostructure (HBS) has been found in post-irradiation examinations
[Spino et al., 2012].
In-situ high pressure x-ray diffraction (HP-XRD) has been performed for the study
of a possible bulk modulus dependence of the crystal size dependence in nc-UO2 .
Three different nc-UO2 sizes (4 nm, 6 nm and 34 nm) were studied up to 27 GPa. The
different B0 and B0 values obtained are summarized in Table 7.3. The bulk modulus
of UO2 suffered an extreme decrease in the nano-size particle range. For the 4 nm
nc-UO2 a B0 of around 40% lower than the one for bulk-UO2 [Pujol et al., 2004], has
been observed. The Vinet equation of state showed the best fit to all the compression
data. Discontinuities were identified in the plot of normalized pressure vs. finite
strain. A shift to higher strains with decreasing particle’s size was observable which
could indicate the presence of different electronic properties for the smaller particle’s
sizes of UO2 [Zvoriste-Walters et al., 2013]. This confirmed the dependence of the
bulk modulus with the crystallite size. However, studies with bigger particle sizes as
158
7.6. Results and discussion.
the ones here studied (>34 nm) would be necessary to guarantee that the tendency
observed in the monoliths (decrease of E-modulus), is due to the size of the grains and
not just because of imperfections and porosity possibly present in the samples.
The results of thermal diffusivity tests of the compacted nc-UO2 -material showed
similar behaviour as that of standard nuclear grade UO2 (bulk). The thermal diffusivity for sintered nc-UO2 (∼200 nm, 90% density), was determined between 254°C
to 1165°C. Extrapolation to 95% density was done and same thermal diffusivity as
standard bulk-UO2 pellet [Fink, 2000] with 95% density was found. Some studies
confirmed already that the effect of the grain size in the thermal conductivity is not
that accused up to a determined size, as initially though. In this published study
[Raghavan et al., 1998], almost no effect in the thermal conductivity has been seen
between a grain size from 70 nm to 400 nm, but because the porosity of the monoliths.
Regarding the feared worsening of the thermal conductivity of the HBS material
due to grain-size effect (Kapitza resistance), it has been here shown that no thermal
properties deterioration has to be expected for the 200 nm-UO2 pellet material
mimicking the HBS.
Determination of the melting point by laser-heating and pyrometric temperature
detection has been performed for compacted nc-UO2 with two different nano-grain
sizes (about 10 nm and 200 nm) and their variation with respect to bulk-UO2
(large-grain), assessed. A melting point depression of about 150°K with respect
to the normal value of bulk-UO2 was found for the 10 nm-size nc-UO2 sample
(Fig. 7.39). This reduction would be a priori due to the nano-size grains. That
has been already reported by [Lai et al., 1996], [Lai et al., 1998], [Guisbiers, 2012].
However, the measured lattice constant of the sample before melting (a=0.5438 nm)
was below the value of bulk-UO2 (a=0.547 nm) and indicated in reality a hyperstoichiometric oxide, which would also cause a melting point decrease. To corroborate
the measured tendency with the grain-size reduction, a strictly stoichiometric nc-UO2
sample would be needed. However, an identical melting point as for bulk-UO2 , was
found for the 200 nm-sample (Fig. 7.40) for which a stoichiometry of O/M=2.00
was confirmed from the lattice constant measurement before melting. This is an
important technological result for the use of nc-UO2 ceramics as nuclear fuel. Indeed,
a lower melting point would suppose a problem for the licensing of the monoliths as
a fuel for the reactor. Fortunately the possibility of a lower melting point disappears
for the 200 nm-UO2 samples, as it would occur for the HBS material in the reactor, too.
159
Chapter 7. nc-UO2 monolith consolidation and characterization
160
Chapter 8
Overall Discussion and Conclusions
The final goal of this work was to develop an accessible route to perform scale
defect-free nc-UO2 -based monolithic ceramic specimens with tailored grain/pore
microstructure. The creation of the latest novel microstructure has been achieved by
passing through very different study steps. From the material synthesis to the fuel
pellet manufacture, many individual process stages, previously unknown or unexplored,
had to be specifically developed and optimized.
8.1
Synthesis of nc-UO2 and nc-ThO2.
Hence, regarding the initial nc-powder needed to perform the described monoliths,
considerable work was devoted to the development of two different chemical synthesis
routes leading to deflocculated nc-UO2 and nc-ThO2 precipitates. A controlled
precipitation method that uses an electrolytically reduced aqueous solution of uranyl
nitrate as precursor and dropped NaOH-solution as alkalinisation agent to trigger the
precipitation of the nc-UO2 is described in Chap. 3. In Chap. 4 another method based
in a thermal decomposition to induce the precipitation of the nc-UO2 in an organic
phase using UAA as precursor, was reported. The same method was also extrapolated
for the synthesis of nc-ThO2 using in this case ThAA or ThA as precursors. To obtain
larger amounts of nc-UO2 as required, both methods were adapted, developed and
scaled-up according to the aim needs. The material in the as-produced condition was
studied by TEM and XRD.
For the method described in Chap. 3, an intensive study of the range of Uconcentration and acidity for nc-UO2+x precipitation from electrolytically reduced
uranyl nitrate solutions was endeavoured, using higher concentration (10−1 M) ranges
as the observed in literature (10−2 M), and therefore lower pH ranges, following the
solubility line of UIV . In light of this study, the conditions for the electrochemical
reduction of these species could be defined. Precipitation from the electrochemically
reduced UIV -solution was achieved by gradual alkalinisation of the solution following
as close as possible the theoretical solubility limit line of UIV species in aqueous
media. As a final result, 10 g of nc-UO2+x per batch were obtained. The solid
phase, as studied by XRD, was found to crystallize with the typical UO2 -fcc fluorite
structure (Fm-3m space group), with a lattice parameter a=0.5417(1) nm and average
crystallite size of 3.79 nm, also in agreement with an average size observed by TEM
of 3.9(8) nm (Fig. 3.21). The predominant diffractogram of the samples corresponded
unmistakably to UO2 , but in a slightly oxidized state. The latter was manifested
161
Chapter 8. Overall Discussion and Conclusions
through a lattice contraction of about 0.9% of the precipitated phase (a=0.5417(1) nm)
with respect to the values of stoichiometric UO2 (a=0.547 nm), an effect which could
be also caused by surface stresses induced by the small particle size, as frequently
observed in nanoparticles. Further studies were undertaken in Chap. 5 to clarify this
influence. Since the corresponding water content and/or oxidation degree of this phase
was hitherto not identified, it was generically described here as UO2+x , in correspondence with similar description e.g. in [Rousseau et al., 2002] [Rousseau et al., 2006]
[Rousseau et al., 2009]. Further analysis of this phase is found in Chap. 5.
For the method described in Chap. 4, thermal decomposition of UAA, ThAA
and ThA precursors in organic media using OAM and OA as reducing and capping
agents led to high-quality monodispersed UO2 nanocrystals and ThO2 rod-shaped
nanocrystals. Reduction of surfactant quantities with respect to the metal content, as
well as scale up of the method from 0.1 g of nc-UO2 as reported by [Wu et al., 2006] to
2.3 g of nc-UO2 , was achieved. The same method was extrapolated for the synthesis
of nc-ThO2 and ThO2 nanorods have been obtained. The reason for the rod-shape
is unknown. due to hitherto unknown reasons. Batch sizes of 0.3 g ThO2 nanorods
were obtained by this means, i.e. much lower production yield than in the case of
UO2 nanoparticles. Different conditions for the heating rate, ageing time, ageing
temperature and initial precursors (ThAA and ThA) were explored for the UO2 and
ThO2 cases. However, similar results were always found, in terms of the structure and
geometry (round-shaped for nc-UO2 and rod-shaped for nc-ThO2 ) of the precipitates.
Perfectly crystallized solid phases, as studied by XRD, with the typical UO2 -fcc fluorite
structure (Fm-3m space group), with an average crystallite size (spheres diameter) of
5.52 nm and a lattice parameter of 0.5431(0) nm were found for the UO2 case, also in
agreement with the average size observed by TEM (4.9(3) nm) (Fig. 4.13 and 4.15)
and DLS (3.7(1) nm). Typical ThO2 -fcc fluorite structure (Fm-3m space group), with
a crystallite size (rods diameter) of 1.42 nm and a lattice parameter of 0.5579(1) nm,
was found for the ThO2 nanorods (Fig. 4.16 and 4.17). In both cases, the precipitated
nanoparticles were well protected against flocculation, since no aggregation has been
observed on the TEM images.
Regarding the advantages and disadvantages of the two types of nanoparticles
synthesis methods (in aqueous or in organic media) in this work, different aspects can
be considered. In terms of production yields, 2.3 g nc-UO2 per batch were obtained
by thermal decomposition of UAA in organic phase (Chap. 4). This is considered
a real improvement vis a vis the original results by this method (0.1 g/UO2 per
batch) obtained in literature [Wu et al., 2006]. Nevertheless this material output was
considerably lower compared with that achieved with the precipitation method in
aqueous media (10 g UO2 per batch) described in Chap. 3.
Another advantage of the aqueous controlled precipitation respect the organic
thermal decomposition, could be also the avoidance of organics in the system which on
larger scale can be a safety factor, as well as economic. These foreign organics capping
nanoparticles could have detrimental effects during the sintering of the compacted
pellets and the properties obtained afterwards. With the increase of temperature, these
organics, convert to volatile gases on burning, would be released from the material,
leading to impurities, and to possible internal fractures and to reduction of the final
material strength.
162
8.2. Crystallization and Grain Growth in f(T) for nc-UO2 .
A disadvantage of the aqueous method is the more difficult dispersability of the raw
material, which could affect the microstructure uniformity and could induce possible
abnormal grain growth during the pre-sintering and sintering steps, if a memory effect
of the agglomerates shape is retained during these stages. The thermal decomposition
in organic media had the peculiarity that nanoparticles with very narrow (monomodal)
size distribution are obtained, which for some applications (e.g. markers in solution,
etc) would be very convenient. However, it must be proved by tests whether this
characteristic of the powder would represent a real advantage (or perhaps otherwise a
disadvantage) for producing sintered pellets, since in the production of bulk materials
by powder technology, practice shows that maximum green compact densities and
maximum sintered densities are obtained using multi-modal powder size distributions.
ThO2 -nanofibers or nanorods instead of spherical nanoparticles were rendered by
the method of thermal decomposition of ThAA (or ThA). More studies should be done
to obtain similar spherical shaped nanoparticles, as obtained with UO2 .
Finally, in terms of possible improvements of both type of methods tested in
Chap. 3 and Chap. 4, various possibilities could be considered. The first would
be to try to change the precipitation media in the organic method. This would
have the aim to lower the precipitation temperature, trying to avoid the use of the
cracking agent oleylamine (OAM), which induces the decomposition of the precursor
metal-acetylacetonate (UAA). In this case, this expensive and only limitedly available
precursor could be replaced by a more accessible U-salt. The use of oleic acid as
dispersing agent, which helps to keep small the size of the precipitated nanoparticles
by acting on the surface tension, will still be needed.
Another possible improvement of the organic method to be analysed would
be the possible change of the precipitation media, with the aim of reducing the
acceleration needed for solid separation by centrifugation, which would imply a
technical simplification. Also, the addition of certain amount of acetone to the
organic media could be analysed, to enhance the particle’s precipitation, which
could eliminate the use of centrifugation in particle’s separation and the use of filters. In all these, however, care is to be taken that particle’s aggregation is not induced.
With regard to the aqueous precipitation method, the possibility of eliminating the
electrolytic reduction step could be analysed, by just inducing the precipitation in the
U+6 state instead of in the U+4 state reducing the material in the posterior thermal
treatments. Here it is to be considered that possibly the precipitation in the U+6
state might not lead to incipient nanosized precipitates but to larger particles. Also
the possibility of obtaining abnormal particle (or grain) growth during the powder
conditioning (reduction) and sintering treatments need to be analysed.
8.2
Crystallization and Grain Growth in f(T) for
nc-UO2.
To study the composition of the precipitates obtained by the both methods described
in Chap. 3 and Chap. 4 and their propensity to thermal growth in the unconsolidated
state, further analysis of the precipitated material annealed at different temperatures
163
Chapter 8. Overall Discussion and Conclusions
was performed by applying the thermal analytical and X-ray scattering techniques like
TGA/DTA, XRD and HT-XRD, spectroscopic techniques such as XAS, NMR and IR
and characterization techniques like TEM. The results were detailed and discussed in
Chap. 5 and Chap. 6.
TGA and DTA were employed under inert atmosphere. The weight loss observed
for the material synthesized in aqueous media (Fig. 5.1) was most likely attributed to
water desorption and to crystallization (completion of the UO2 fcc-structure). The
weight loss observed for material synthesized in organic media, was attribute to residual
water from the precursor, but mainly to organic volatilisation and crystallization.
However, in both cases there was no reason to believe that the weight loss did not
include as well some loss of oxygen due to reduction of the material. A deeper analysis
on the lattice parameter and crystal growth under inert and reducing atmospheres was
then performed to confirm the latter.
The evolution of the crystallite size, the lattice parameter, and the strain were
determined from ambient temperature up to 1200°C under inert atmosphere. For the
aqueous precipitated nc a weak effect on the crystallite size occurred below 700°C and
it remained below 7 nm (Fig. 5.2), while a strong expansion of the lattice parameter
was measured (Fig. 5.4). Above 700°C, the size of the crystallite increased quasi
linearly but drastically with temperature, reaching a size about 73 nm at 1200°C. A
recovery of the UO2 typical crystal structure was achieved with temperature under
static He atmosphere from the initial lattice parameter value of 0.5417 nm from the
nc-UO2 as-produced to 0.5473 nm after thermal treatment at 1200°C (measurements
done after cooling). For the organic precipitated nc, a pre-thermal treatment was
done to avoid any possible decomposition of the nc-UO2 organic layer in the static
atmosphere of the HT-XRD chamber. The crystallite size change with temperature
showed a small growth up to 700°C, an intense growth from 37 to 150 nm at 1100°C
(see Fig. 6.3). The nanocrystallites stabilized at O/U 2.0 at temperatures above 750°C
(particles sizes >44 nm).
The linear thermal expansion coefficient (LTEC) was initially higher for nc-UO2
from the aqueous method than for bulk-UO2 for temperatures below 400°C and
tended to stabilize (at O/U 2.17-2.18) above 600°C (crystal sizes >6 nm), when the
nanocrystalline material met the thermal-expansion behaviour (i.e. thermal expansion
coefficient) of bulk (large-grained) UO2 (Fig. 5.5). This showed once more that the
ab-normal nano-effects in the material was only observed for particle sizes below a few
tens of a nanometer. Similar behaviour was observed for the nc-UO2 from the organic
method.
The strain decreased with temperature and was completely released at 700°C for
the aqueous method material (Fig. 5.7). Above this temperature, the sintering of the
nanocrystallites began and reached a size of about 73 nm at 1200°C. In the organic
case, the strain was totally released at 1000°C when a high increase in the crystallite
size began (from 88 nm at 1000°C to 150 nm at 1100°C). So the crystallite growth
seemed to be limited by the presence of the lattice strain.
164
8.3. Structure and oxygen-stoichiometry studies by XRD, XANES, EXAFS, NMR AND FTIR.
8.3
Structure and oxygen-stoichiometry studies by
XRD, XANES, EXAFS, NMR AND FTIR.
The evolution of the crystallite size, the lattice parameter, and the strain under
reducing atmosphere was also studied and compared to the reference bulk-UIV O2 .
The lattice constant of the material in the cooled state after reach different maximum
temperatures (600°C and 1200°C) was measured. This allowed separation of the
thermal expansion contribution in the high-temperature values to obtain cleaner curves
for thermal expansion vs. temperature and lattice dimension vs. crystal size. No
big differences in size, lattice and strain, were observed between inert and reducing
atmospheres (measurement after cooling) for the material obtained with the aqueous
method (Table 5.1). However, a notable change in the crystallite size was observed for
the material obtained with the organic method at 1100°C, with a size of 150 nm under
He and a size of 12 nm under Ar/5%H2 . Also differences in the lattice parameters as a
function of the atmosphere in the organic case, were observed. A value of 0.5472 nm
at 1100°C under He (Fig. 6.7) and 0.5461 nm at 1200°C under Ar/H2 , were measured.
However these difference were probably due to the pre-thermal treatment (before the
HT-XRD measurement under He) done under O2 and Ar/H2 which ended already in a
size of about 37 nm and a lattice parameter of of 0.5462 nm at 700°C. In the evolution
of the lattice strain (e), a release was observed with increasing temperatures. After annealing at 600°C under Ar/5%H2 , just little strain was released (from 0.702 to 0.664%),
and totally disappeared at 1200°C (0.004%), as was also observed under He atm
after 1100°C. Comparing the aqueous and organic produced material under reducing
atmosphere (without pre-thermal treatment), no big change was observed until 600°C
anneal, but at 1200°C. A size of 82 nm for the aqueous method material vs. 12 nm
for the organic method at the last temperature under Ar/5%H2 , were measured. That
could be ascribed to the organic layer protecting the organic precipitated nanoparticles.
XANES was used to determine the oxidation state of U cations and the corresponding molar fractions and the O/U ratios were derived. The XANES spectra at the U-L3
edge for the aqueous method material (Fig. 5.10) and for the organic method material
(Fig. 6.10), showed similar trend with increasing temperature and as the stoichiometry
shift (x) decreased (UO2+x ). The samples studied were nc-UO2 as produced and after
thermal treatment at 600°C and 1200°C under Ar/5%H2 . The peak of the WL shifted
slightly to lower energies and increased in intensity, and the oscillations within the
XANES regions increased. The amplitude decreased with the increasing temperature
of thermal treatment showing a higher structural order of these samples. For the
as-produced (RT) and at 600°C samples, there was a significant difference of shape
compared to the UIV O2 reference, i.e. presence of a shoulder on the high energy side
of the edge. This was in agreement with the observed decrease of WL amplitude
with the increasing temperature. The shoulder decreased with temperature meaning
that there was less UV I or that the UIV bulk was more visible as it size increased. A
clear shift (further for the RT sample) of the absorption edge and WL-peak to higher
energies, as well as a broader WL was observed. In the aqueous method material the
spectra for the UIV O2 reference and the annealed sample at 1200°C, were remarkably
similar, indicating that the electronic structure of the 82 nm UO2 was essentially that
of the bulk UIV O2 at that temperature. However, for the organic method material, the
spectra for the annealed sample at 1200°C was still following the same tendency as the
other samples at RT and 600°C, indicating that the electronic structure of the 12 nm
UO2 was still not UIV O2 .
165
Chapter 8. Overall Discussion and Conclusions
These effects on the WL could be due to the size of nc-UO2 samples, but also
to the stoichiometry shift of the synthesised material. To quantify these effects a
dedicated study with UO2 nano materials with exactly same stoichiometry, possibly
at the exact stoichiometry (UIV ), but with different crystal sizes, would have been
necessary. That was, at this moment not possible with the synthesized nc-UO2 where
just one-size samples where synthesized and different particle sizes were obtained by
thermal treatment. Under this treatment, not just a change in size occurred, but also
a change in valence, even under inert atmosphere (Fig. 6.9). So, in principle, because
of this size effect, determining the O/M from the shift is dubious but it was the only
option at that time. Anyway, for the RT, 600°C samples (aqueous route) and for
the RT, 600°C and 1200°C samples (organic route), it was clear that there was UV I
contribution not only from the shift but also from the shoulder (which was indicative
of the uranyl).
A beautiful way to study the size effect, could be the use of a nano-material with
a unique valence state i.e. thorium dioxide (ThO2 ). From the synthesized nc-ThO2
(Sec. 4.4.1.2), different sizes could be obtained under thermal treatment without
changing the valence of the material. ThO2 can only exist in one oxidation state,
ThIV , and is eliminated all discussion on the influence of the O/M ratio on the results obtained. Any changes in the XANES, would be just do to the size of the particles.
In Chap. 6, a study of the as-produced nc-ThO2 (Chap. 4) was also done. In the
XANES spectra (Fig. 6.12) at the Th-L3 edge, the peak of the WL corresponding
to nc-ThO2 at RT (as-produced) had an identical position and amplitude as the one
for the reference spectra of ThIV O2 -bulk. Corroboration by XRD was also obtained
(lattice constant of a=0.5579(1) nm) vs. a=0.560 nm for the ThO2 standard). This
identical behaviour suggested that the displacements observed for nc-UO2 were not
due to the size of the particles, rather the valence. Slightly less intensity for the peak
of the WL was observed, as well as less oscillations for the nc-ThO2 . So for this point,
one could think there might be a small size effect on the interatomic distance and
ordering. The size effect observed for the nc-ThO2 as-produced was less than that
observed for nc-UO2 (as produced, 600°C and 1200°C) with bulk-UIV O2 . So even if
there might be a small size effect, the valence might be the major cause for the differences observed with bulk-UIV O2 , also confirmed by the lattice contraction by XRD.
Having that in account, determining the O/M from the XANES shift would be justified.
In the k3 -weighted EXAFS spectra for the aqueous method particles (Fig. 5.11a),
the oscillations and their amplitude increased with thermal treatment. The 4 nm
as-precipitated sample was very difficult to fit with a pure fluorite structure, as the
fit were non stable and the data noisy. A significant static disorder was found and
a shorter distance for the oxygen shell (U-O bond length) was clearly observable for
the nc-UO2 at RT which did not correspond to any U-oxide. The intensity of the FT
was very low limiting the interpretation of the coordination shell to U-O1 . Observing
the EXAFS results in Table 5.3, the data were heavily dampened at RT where a large
value for the DW factor was found, meaning a significant static disorder for the nc-UO2
as-produced. Shorter distance for the oxygen shell (U-O bond length) was clearly
observable for the nc-UO2 at RT which did not correspond to any U-oxide. According
to the shape of the first FT peak, it looked like there were two or three U-O distances
instead of one. This was consistent with the observed lattice contraction (0.5417 nm)
166
8.3. Structure and oxygen-stoichiometry studies by XRD, XANES, EXAFS, NMR AND FTIR.
from XRD at RT (see Table 5.2).
The 9 nm sample (600°C anneal) showed an intermediate ordering with oscillations
clearly identified and extending to k = 9 Å−1 . The intensity of the FT was also low
for this annealed sample, limiting the fitting and interpretation of the coordination
shell to U-O1 and U-U1 together with UO2 fluorite structure. Still a large value for the
DW factor was found (Table 5.3). Shorter distance was also present for the oxygen
shell (U-O bond length) in comparison with the reference-UIV O2 . However the U-U1
bond length was closer to that of the bulk-UIV O2 , suggesting that the U-U1 lattice
was more ordered than the O anion sublattice. The U-U1 lengths were consistent with
the less lattice contraction (0.5431 nm), in comparison with the nc-UO2 as-produced,
as probed by XRD at 600°C anneal.
Ultimately, at 1200°C and 82 nm, EXAFS oscillations were similar, if not entirely
matching, those of the bulk-UIV O2 indicating same fcc-structure consolidation and
substantial particle growth, both observed in XRD measurements (Fig. 5.12). Both
shells were well fitted with Fm-3m structure for this sample (Fig. 5.13) and very similar
distances to reference UIV O2 structure could be observed according to the FT (k-range
treated = 3-12 Å−1 ). That was in agreement with the similarity for the XRD data for
the annealed sample at 1200°C and the bulk-UIV O2 (Fig. 5.8). Also consistent with
the XANES (see Fig. 5.10) showing no different oscillation from the fluorite structure.
In the k3 -weighted EXAFS spectra for the organic particles (Fig. 6.11), the
oscillations and their amplitude slightly increased with thermal treatment, also. The
5 nm as-precipitated sample was very difficult to fit with a pure fluorite structure,
as the fit were non stable and the data noisy. Nevertheless, also the samples treated
at 600°C and 1200°C presented a high degree disorder, as it was already predicted
from the XANES analysis (Table 6.1). Therefore a good fit could not be achieved
considering only bulk-UIV O2 , meaning that another unidentified phase must be taken
into account.
NMR Hahn-echo 17 O MAS spectra could be acquired for samples prepared by the
aqueous method after annealing at different temperatures (Fig. 5.15) under reducing
atmosphere (Ar/5%H2 ). Three different oxygen environments could be identified
(Fig. 5.18) from the fitting of the chemical-shift signatures of these samples, i.e.,
the records of the 17 O-resonance-frequency peak displacement with respect to that
of a reference specimen, expressed in relative units (ppm). In the present case, the
17
O-resonance of a 17 O-doped H2 O sample was taken as reference, and defined as
0 ppm. The first identification corresponded to oxygen species having a chemical
shift of nearly 900 ppm and was found for samples annealed up to 650°C. The two
other types of oxygen species identified appeared clearly in the temperature range
650°C-1200°C. These new species, i.e., one showing a sharp and the other a broad
17
O-peak, could be respectively attributed to 17 O in a well crystalline environment
and in a more disordered one; the last due to the larger peak broadening. Both peaks
diminished strongly their chemical shifts and half-maximum widths in the temperature
range 650°C-800°C, to converge rapidly at temperatures above 800°C to values near
those of the sample annealed at 1200°C, i.e., respectively, 717 ppm (chemical shift) and
5 ppm (FWHM), which due to very small peak broadening (FWHM) indicated a very
well crystallized environment. This last was still slightly bigger than the 3 ppm found
for UIV O2 -bulk. Despite this, the chemical shift (717 ppm) was the same as that found
167
Chapter 8. Overall Discussion and Conclusions
for UIV O2 -bulk. Hence, one can say that the environment around the oxygen lattice
positions in the case of the sample with the biggest crystallite size (∼80 nm) was very
close to that of UIV O2 -bulk. Based on the FWHM, one can say that to observe the
signal of crystalline UO2 a crystallite size above 80 nm should be reached. This is
in line with the observation by XRD of an UO2 -fcc structure with lattice parameter
0.5472 nm in this case (Fig. 5.8).
Several samples from the aqueous method at key annealing temperatures were also
analysed under the FTIR spectrometer (Fig. 5.19). In the case of nc-UO2 as-produced
(RT), four peaks in the range 400-4000 cm−1 could be observed. They could be assigned to the bending vibration of H-O-H of the coordinated water, and to a possible
more oxidised state (UO2+x ). All these peaks diminished in intensity with annealing
temperature. The peaks assigned to the H-O-H of the coordinated water, totally disappeared at 600°C. That was in agreement with the TGA, were nearly no weight of
loss was observable after 600°C (see Fig. 5.1). However two of the peaks finally disappeared at 1200°C. That could be an artefact due to the small size still present at
600°C (10 nm). Hence, at 1200°C the IR spectra looked like the one for the UIV O2
reference and grains were about 80 nm. That was also in agreement with the results
above commented by XANES where a different electronic structure at 600°C was seen,
meanwhile at 1200°C a similar structure to bulk-UIV O2 was found (see Table 5.2). Also
EXAFS was characterized for a poor ordering at 600°C but entirely matching with the
bulk-UIV O2 oscillation pairs at 1200°C (see Table 5.3).
Isothermal grain-growth study of the synthesized nc-UO2 was then performed.
For the annealing temperatures of 500°C, 700°C and 900°C and a static and inert
atmosphere of He, the grain growth took place in the first hours of isothermal
hold until a stable average crystal size was established at the applied temperature,
at which time grain growth ceased (Fig. 5.21). For the isotherm at 1200°C and
a static atmosphere of He, the material had a continuous growth not reaching a
constant grain value in the first 50 h (Fig. 5.20). An activation energy of diffusion
of 0.93 eV to 1.25 eV was obtained (Fig. 5.23). Diffusion can occur along the grain
boundary, or it can occur intragranularly (volume diffusion), or because of grain
defects. The grain boundary diffusion is always faster than the volume diffusion,
meanwhile the volume diffusion occurs within a single grain and is only important
at higher temperatures. In this case of nc-UO2 , the low activation energies obtained
could be then related predominantly to grain boundary (surface and interface) diffusion.
A lattice of about 0.5472 nm was already found for the samples treated at 900°C
after 50 h dwell time under Ar/H2 obtaining a final size about 50 nm (Table 5.5).
Therefore a temperature of 1200°C (and in consequence a final crystallite size of
80 nm) would be, in principle, not necessary to reach the typical lattice parameter of
the reference large-grained UO2 (a=0.5472 nm), as above commented.
An average crystal size of 322 nm was measured after cooling for the heat treatment
at 1200°C after 50 h dwell time under He (Table 5.5). Taking that into account, it
appears that a temperature below 1200°C would be necessary in the sintering process
of the monoliths to avoid extreme growth of the particles (>200 nm). Nevertheless for
the nc-UO2 samples annealed at 1200°C during 50 h under Ar/H2 dynamic atmosphere,
a final crystal size of 85 nm was measured after cooling. Even after 200 h dwell time
at this temperature under reducing atmosphere, a final crystal size of 150 nm was
seen (quite far from the 322 nm observed under He atmosphere after 50 h). This
168
8.4. nc-UO2 monolith consolidation and characterization.
difference could be due to the initial oxidation state of the nc-UO2 samples and
their evolution under a static He atmosphere. An hyperstoichiometric UO2 would
present a stronger increase of the self-diffusion coefficients and in the same way raise
the mass-flow, for which enhanced grain-boundary motion and grain (or crystal)
growth will occur Fig. 5.24. Differences in the diffusivity in the grain boundaries
between micro- and nano-grain have been seen already in other fluorite structure
metal oxides [Martin, 2007]. In fact the differences in the diffusion coefficient between
bulk-large-grain-UO2 and nc-UO2 are compatible with an enhancement of the diffusion
processes either by a diminishing of the grain size or by O/U>2 effects.
8.4
nc-UO2 monolith consolidation and characterization.
Conversion of nanoparticle systems into dense nanostructured monoliths has been
achieved. The purpose was the synthesizing UO2 -nuclear fuels mimicking the high
burn-up structure (HBS) of LWR-fuels (nanostructured), for which improved properties
are expected compared to standard fuel [Spino et al., 2012]. Monoliths with the two
kind of nc-UO2 obtained by the precipitation in aqueous media (Chap. 3) and in
organic media (Chap. 4), were produced.
Different alternative routes for consolidation (e.g. conventional uniaxial pressing, float packing, etc.) into green bodies (Fig. 7.4) have been tested (Sec. 7.2).
Afterwards the green bodies were sintered at temperatures between 900°C and
1200°C under Ar/H2 atmosphere. The optimum sintering conditions were deduced
from the long-isothermal crystallite growth studies under He and Ar/H2 atmosphere
(Table. 5.5). This ensured lack of disproportionate grain growth risks even at the
highest temperature used of 1200°C. Also thermal pre-conditioning of the powder
before pressing was in some cases done to avoid cracks during the sintering step due to
the presence of water or organics (depending on the case) in the material. Therefore
the organics presence did not have a detrimental effect during the sintering of the
compacted pellet when the porosity of the ceramic becomes closed. The pellets sintered
presented a strong appearance although fine cracks were visually observable in some
cases (Fig. 7.11 and 7.12). Sintering densities between 75.5-90.5% of the theoretical
density (TDU O2 =10.96 g/cm3 ), were obtained (Table. 7.1). An average grain size of
∼200 nm, replicating the HBS, was obtained for all the different sintered nc-UO2 pellets.
Complementary dilatometry experiments were performed to compare the shrinkage
of the fabricated nc-UO2 pellet with that of bulk-UO2 (large grain) produced by
a standard fabrication process. Enhanced sinter activities of the nanocrystalline
materials compared to microcrystalline UO2 were found at lower temperatures. The
temperature range from onset to completion of the densification occurred at much
more lower temperatures (Fig. 7.14) for the nc-UO2 (200-955°C, with a maximum
sintering rate at 740°C), compared to the bulk-UO2 [Lahiri et al., 2006] (900-1540°C,
with a maximum sintering rate at 1200°C). The reason of that might be the higher
surface present in the nc-UO2 compared with the bulk-UO2 material, rendering the
sintering to become more effective (at lower temperatures). The sintering activation
energy was determined as Q = 171 ± 7 kJ/mol assuming surface diffusion and
Q = 114 ± 5 kJ/mol assuming volume diffusion for the nc-UO2 monolith, compared to
169
Chapter 8. Overall Discussion and Conclusions
Q = 287 kJ/mol determined for bulk-UO2 in the literature [Lahiri et al., 2006]). Both
diffusion mechanisms showed low values of the sintering activation energies as typical
for nanopowders. The obtained sinter activities at much lower temperatures that the
typical temperatures used in the sintering of standard UO2 monoliths would represent
an important technological advantage by energy saving.
Characterization of macrostructures by optical microscopy (OM), and microstructures by fresh-fracture observation by SEM, for different samples at different
magnifications, was performed. Not well defined grains were observable in the freshfracture SEM images of the pellets sintered at low temperature of 900°C (Fig. 7.20).
The sinter of the crystals was still under development, therefore sintering temperatures
of 1200°C were used afterwards. Macrocracks across different samples were observed,
but not for the monoliths from nc-UO2 synthesized by the organic-route with powder
thermal pre-treatment (Organic-Pressed-PTT - Fig. 7.22), and not for the monoliths
from the float-packing consolidation method and powder of the aqueous-synthesis
(Aqueous-Float Packing - Fig. 7.19). All macrostructures, with exception of the
last one (Aqueous-Float Packing - Fig. 7.19), showed non-homogeneous densification
(residual porosity between densified areas). Also the conventional pressed sample of
pre-dehydrated powder from aqueous route (Aqueous-Pressed-PTT - Fig. 7.17) showed
a good quality in comparison to the rest, from the point of view of the densification.
However, improvements in the performance of the monoliths would be necessary to
avoid the problem of cracks in the sintered pellets (and therefore the diminishing
material’s properties).
Looking at the fresh fracture surfaces, the microstructure of the aqueous-routepowder pellet produced by float packing consolidation ((Aqueous-Float Packing)) and
sintering at 1200°C, was the closest approximation to the HBS material obtained until
now (Fig. 7.21b). The average grain size for the different monoliths was in the 170 nm
to 250 nm range. Here a major success of this work was achieved.
Mechanical properties as Vickers Hardness (HV ), Knoop Hardness (HK ) and
Young’s modulus (E) were determined for sintered nc-UO2 pellets. An increase in
hardness (HV ) and low values for E-modulus (up to 30%) were in general seen for the
different nc-UO2 monoliths (Table 7.2) in comparison with bulk-UO2 . Also scanning
acoustic microscopy (SAM) was used for the estimation and comparison of the Young’s
E-modulus obtained by indentation. The results by SAM (E=150 GPa) matched
the ones derived from microindentation (E=155 GPa). This difference observed
with respect to bulk-UO2 pellets (220 GPa), could be influenced by microstructure
imperfections (nanocavities at triple-grain junctions, pores, cracks, etc.). However, the
drop was still too large to be attributed only to the presence of cavities. The same type
of tendency observed in the nc-UO2 specimens, i.e. with increase of HV values and
decrease of the E-modulus values, has been found before in irradiated standard-UO2
fuel at high burn-ups. In this case also the E-modulus decrease could not be fully
attributed to a porosity increase and was to contradict the effect of the fission products
dissolution, which causes in reality an increase of the material’s stiffness. Since with
the increase of BU the irradiated nuclear fuels transform into a nano-recrystallized
structure [Spino et al., 2012], the effects of (partial) HV -increase (fission products
dissolution causes as well hardening) and additional E-modulus decrease (beside that
caused by porosity) like the effects observed in the present work could be attributed in
high BU fuels due to the nanostructure.
170
8.4. nc-UO2 monolith consolidation and characterization.
The confirmation of the size-dependent physical-chemical properties of nc-UO2
has been successfully accomplished. So the compressibility of nc-UO2 was proved
in fact to be larger than that of standard-UO2 . A size-dependence of the thermal
expansion properties of nc-UO2 was also confirmed. The thermal expansion was shown
to increase with the size-decrease (see Fig. 5.5 and Fig. 6.6), at the time that the bulk
modulus decreased. This is compatible with the Grüneisen relationship showing a
constant product between the thermal conductivity and the bulk modulus. However,
verification of the trend in the specific heat (Cp) is still lacking, which is indeed
neeeded to complete the Grüneisen-relationship analysis.
Regarding the material’s compressibility, in-situ high pressure X-ray diffraction
(HP-XRD) has been performed for the study of the bulk modulus dependence on the
crystal size in nc-UO2 . Three different nc-UO2 sizes (4 nm, 6 nm and 34 nm) were
studied up to a pressure of 27 GPa and the corresponding compressibility constants B0
and B0 determined are summarized in Table 7.3. The bulk modulus of UO2 suffered an
extreme decrease in the nano-size particle range. For the 4 nm-size nc-UO2 -particles, a
bulk modulus (B0 ) around 40% lower than the one measured for bulk-UO2 (micron-size
grains) [Pujol et al., 2004], has been observed. The Vinet equation of state showed
the best fit to all the compression data. Discontinuities were identified in the plot of
normalized pressure vs. finite strain. A shift to higher strains with decreasing particle’s
size was observable which could indicate the presence of different electronic properties
for the smaller particle’s sizes of UO2 [Zvoriste-Walters et al., 2013]. This confirmed
the dependence of the bulk modulus with the crystallite size. However, studies with
bigger particle sizes as the ones here studied (>34 nm) would be necessary to guarantee
that the tendency observed in the monoliths (decrease of E-modulus), is due to the
size of the grains and not just because of imperfections and porosity possibly present
in the samples.
The results of thermal diffusivity tests of the compacted nc-UO2 -material showed
similar behaviour as that of standard, nuclear grade UO2 (bulk). The thermal
diffusivity for sintered nc-UO2 (∼200 nm, 90% density), was determined between
254°C to 1165°C. Extrapolation to 95% density was done and same thermal diffusivity
as standard bulk-UO2 pellet [Fink, 2000] with 95% density was found. Regarding
the feared worsening of the thermal conductivity of the HBS material due to grainsize effect (Kapitza resistance), it has been here shown that no thermal properties
deterioration has to be expected for the 200 nm-UO2 pellet material mimicking the HBS.
Determination of the melting point by laser-heating and pyrometric temperature
detection has been performed for compacted nc-UO2 with two different nano-grain sizes
(about 10 nm and 200 nm) and their variation with respect to bulk-UO2 (large-grain),
assessed. A melting point depression of about 150°K with respect to the normal
value of bulk-UO2 was found for the 10 nm-size nc-UO2 sample (Fig. 7.39). This
reduction would be a priori due to the nano-size grains. However, the measured
lattice constant of the sample before melting (a=0.5438 nm) was below the value of
bulk-UO2 (a=0.547 nm) and indicated in reality a hyperstoichiometric oxide, which
would also cause a melting point decrease. To corroborate the measured tendency with
the grain-size reduction, a strictly stoichiometric nc-UO2 sample would be needed.
However, an identical melting point as for bulk-UO2 , was found for the 200 nm-sample
(Fig. 7.40) for which a stoichiometry of O/M=2.00 was confirmed from the lattice
171
Chapter 8. Overall Discussion and Conclusions
constant measurement before melting. This result is important for the use of nc-UO2
ceramics as nuclear fuel. Indeed, a lower melting point would pose a problem for the
licensing of the monoliths as a fuel for the reactor. Fortunately the possibility of a lower
melting point disappears for the 200 nm-UO2 samples, as it would occur for the HBS
material in the reactor, too. Again this is an important technological result of this work.
So, postulated nano-effects such as diminution of the thermal conductivity and the
melting point could be here excluded as weak points for the use of nc-UO2 as a nuclear
fuel. These effects might be relevant for very low crystal/grain sizes (∼10 nm) but they
disappear for grain sizes of ∼ 200 nm, where, conveniently, the sought advantageous
properties of the nano-structure (super-plasticity, low swelling under Xe-bombardment
[Spino et al., 2012], self-limiting grain growth, etc.), still remain. This anticipates the
lack of property loss of the developed nc-UO2 monoliths for technical applications in
this size range.
172
Chapter 9
Future Recommendations
9.1
9.1.1
Synthesis of the nanoparticles.
Synthesis of ThO2 nanoparticles to study a unique valence system.
The major problem found by the study of the UO2 system was the presence of two
variables, namely the size of the particles and the U-valence. Studies on the ThO2
system would facilitate steadfast conclusions due to its unique valence (IV). The organic
route has been already tested but more data is needed. Also, not nanoparticles rather
nanorods were obtained. Synthesis by the aqueous method of ThO2 nanoparticles would
be another option. In this case, no electroreduction steps would be needed.
9.1.2
Synthesis of PuO2 nanoparticles and
able damage in the nc-UO2 .
238
Pu doping to en-
Preliminary test with 239 Pu have been performed using the aqueous route method.
This system has the inconvenience of its multiple valences (III, IV and V) but luckily
the IV valence state is the most stable. Further (U, 238 Pu)O2 nanoparticles would
permit damage studies and simulate what occurs in the reactor.
9.1.3
Synthesis of nanoparticles of different controlled sizes.
The pressing and sintering of pellets from monosized UO2 nanoparticles with respectively different sizes. Ultimately to compare their mechanical properties in dependence
on the patricle’s size. This could be achieved by precipitating the particles in small
pH intervals for the aqueous route and to collect separately the particles obtained at
each interval. For the organic route, parameters playing a role in the growth of the
nanoparticles are heating rates, ageing temperature and time, precursor concentration,
surfactants ratio, types of solvent, etc.
9.1.4
Use of ThO2 nanorods as reinforcement in the the ncmonoliths to increase strength.
The ThO2 nanofibers were obtained by the organic route (Fig. 4.16) and they could
have a potential use to induce material reinforcement, i.e. to increase the strength
173
Chapter 9. Future Recommendations
of the sintered nc-bulk, for instance by producing mixtures of nc-UO2 and nc-ThO2
(nano compounds) [Wan et al., 2006a], [Wan et al., 2006b], [Mazaheri et al., 2010],
[Mazaheri et al., 2011]. SiC (or Mo) nanorods (or nanofibers) for nc-UO2 bulk reinforcement, would substantially increase its thermal conductivity [Patzke et al., 2002],
which would improve its operating safety.
9.2
Basic science of nc-actinide oxides.
First tests to determine magnetic properties of nc-samples were performed with the
Actinides Research department in ITU. The main conclusion was the observation
of a remaining signature of the magnetic order similar to the single crystal even
at the lowest size (about 31°K), further a clear decrease of the susceptibility with
decreasing size was observed (see Fig. 9.1 and Fig. 9.2). This can be explained by a
reduction of the magnetic moment on U. New test are are planned. This is an untested
domain, and is relevant as computational methods are today based in nanoscale clusters.
Figure 9.1: Magnetic susceptibility at 70 KOe for nano materials and 10 KOe for single crystal.
9.3
Alternative monolith compaction and sintering
methods.
9.3.1
Sintering of commercial nc-Y-ZrO2 by spark plasma sintering (SPS), as substitute of nc-UO2 .
During this thesis another sintering process, spark plasma sintering (SPS), was
tested. Using alternating current, the device applies a pressing force at high temperatures (but much lower that the 1600°C used in a conventional sintering process)
for a shorter period of time. nc-UO2 compaction by SPS was not possible as the
device was not implanted in a radiological facility. Instead commercial partially
stabilized nc-Y2 O3 -doped tetragonal zirconia (4 mol% Y2 O3 ZrO2 or nc-Y-ZrO2 )
was utilized. This material was used already in a previous work performed at ITU
174
9.3. Alternative monolith compaction and sintering methods.
Figure 9.2: Effective magnetic moment extracted from the Curie Weiss law Model (CW ) for
the different size of nano materials.
[Santa-Cruz, 2009]). Nc-Y-ZrO2 was used then to simulate the HBS-material due to
its similarities (mechanical strength, slow creep and radiation resistance) of nc-Y-ZrO2
with UO2 [Spino et al., 2012]. However, possible discrepancies in the behaviour of
the respective nano-phases (nc-Y-ZrO2 vs. nc-UO2 ) due to differences in the crystal
structure (tetragonal vs. cubic) and reduction/oxidation behaviour (hypostoichiometric
nc-Y-ZrO2−x vs. hyperstoichiometric UO2+x ), were not contemplated.
Tests were performed at different temperatures. Increasing densities (measured by
Archimedes principle) with increasing sintering temperatures were obtained (Table 9.1).
The sintered pellets were about 19.80 mm in diameter and 4.78 mm high. A picture
of a nc-Y-ZrO2 pellet after SPS preparations is shown in Fig. 9.3. The black colour of
the pellet is due to the SPS graphite matrix.
Table 9.1: Densities obtained for the nc-Y-ZrO2 samples after SPS treatment at different
temperatures.
T (°C)
green density (g/cm3 ) TD (%)a
nc-Y-ZrO2 1250 °C
5.7146
93.68
nc-Y-ZrO2 1300 °C
5.7735
94.65
nc-Y-ZrO2 1400 °C
5.9960
98.30
Heating rates of 100°C/min under vacuum, applied pressure of 16 kN (50 Mpa) and dwellings of 5 min.
a.) TDY −ZrO2 =6.1 g/cm3 .
An examination of the macrostructure and microstructure of SPS produced pellets
is shown in Fig. 9.4. The particles remeinded about 100 nm showing that this method
bodes well for the future. SPS has two great advantages, namely lower temperatures
and short time both of these inhibit grain growth.
175
Chapter 9. Future Recommendations
Figure 9.3: Spark Plasma Sintering pellet of nc-Y-ZrO2 .
(a) The scale bar is 2 μm.
(b) The scale bar is 1 μm.
(c) The scale bar is 500 nm.
Figure 9.4: Microstructure of fresh fracture of nc-Y-ZrO2 pellet by SPS.
9.3.2
Centrifugal casting
A centrifugal casting of an electrostatically stabilized colloidal nc-UO2 precipitates
solution could be another option for green compaction. The material in solution is
then introduced in a tube and after being submitted under forces of 480.000 g, it
stacks at the bottom of the tube as a pellet. The objective, is to obtain a high green
density that would allow lower sintering temperatures. An ultracentrifuge (SORVALL®
TH-660 Swinging Bucket Ultraspeed Centrifuge Rotor from Thermo Scientific), is
already disposable in ITU to test this method further.
9.4
nc-UO2 in extreme conditions.
The licensing of nuclear fuel is made on basis of its safety performance not just only
under normal operation conditions, but also when a temperature rise occurs in the
fuel. This could be caused in a Loss of Coolant Accident (LOCA) or in a Reactivity
Initiated accident (RIA). Under such extreme conditions fuel fragmentation could
occur. During this thesis, one attempt was made to mimic such an accident in an out
of pile experiment using nc-Y-ZrO2 as a sample instead of nc-UO2 . This test was made
in a facility at ITU known as POLARIS, which permits very rapid laser heating of the
sample. The ZrO2 pellets used were sintered by SPS (see Sec. 9.3.1). The black colour
of the pellet is due to the SPS graphite matrix.
The picture in Fig. 9.5 shows the pellet (produced by SPS) before and after the laser
shot on the surface. The white area corresponds to the laser heated area. The temper176
9.4. nc-UO2 in extreme conditions.
1541 ºC
1897 ºC
2161 ºC
Figure 9.5: Spark Plasma Sintering pellet of nc-Y-ZrO2 (left). Optical microscopy of the fresh
fracture for the thermal treated sample. The temperature gradients measured on the sample
surfaced are also indicated (right).
atures reached at the different areas are also shown. The duration of the test was about
20 minutes. Fresh fracture of the sample is shown in Fig. 9.6, while SEM measurements
are presented in Fig. 9.7 which shows the evolution of the grain size on a fracture surface.
LASER
2161 ºC
1897 ºC
1541 ºC
LASER
Figure 9.6: Fresh fracture of the thermal treated sample. Thermal distribution measured in
the POLARIS facility. The temperatures were measured on the surface.
The initial material tested in POLARIS was pore free and its surface was flat. The
laser treatment showed that a local swelling occurred through formation of porosity
(see Fig. 9.7). This experiment was not perfectly well controlled, but it is likely that
the observed swelling was due to CO or CO2 gas generated when the carbon impurity
in the material reacted with oxygen from the atmosphere, which caused pore formation,
in a process similar to the production of foamed glass. A particularly interesting result
of the test is that the formed pores were closed and astonishingly similar to those of
the HBS-zone in high burn-up fuels. Chances appear therefore that during such kind
of postulated fuel melting accident, at least part of the fission gas could be trapped
in potentially forming closed pores, as it occurs in the HBS material at low temperatures. Although these experiments are preliminary they suggest a promising novel
method to test the gas retention capability of the nc-UO2 fuel under accident conditions.
Finally, another important method to understand the resistance of nc-materials to
irradiation can be provided by ion beam irradiation tests. This can be done at facilities
like the ANL (Argonne National Laboratory) IVEM-Tandem facility in Chicago, where
177
Chapter 9. Future Recommendations
(a) The scale bar is 1 mm.
(b) The scale bar is 1 mm.
(c) The scale bar is 100 μm.
(d) The scale bar is 20 μm.
(e) The scale bar is 10 μm.
(f) The scale bar is 5 μm.
Figure 9.7: Micro- and macro-structure of nc-Y-ZrO2 bulk specimens subjected to POLARIS
heating experiments to simulate a Large LOCA event.
irradiation with inert gas ions (He or Xe) with on-line TEM observation provides a
very useful way to implant the gas atoms and to evaluate how they behave in the
matrix, e.g. dissolution therein, formation of bubbles, transport of bubbles along grain
boundaries, etc.
Concluding Remarks.
Successful consolidation of the synthesized nanocrystalline UO2 nanopowders into
dense pellets mimicking of the High Burn-up Structure (HBS) as ideal system has
been achieved. From the different synthesized nc-UO2 powders (4-5 nm size) to the
nc-UO2 compacted monoliths with 200 nm average grain size and about 90% density
were achieved. Stability of the structure after ageing and self limiting grain growth
kinetics up to temperatures of 1200°C, were shown. The out-of-pile mechanical
properties of sintered pellets (in terms of hardness and elastic modulus) were confirmed
to closely resemble those of the HBS-material in-pile. Beneficial properties found,
like stability of the structure, enhanced mechanical properties and self-limiting grain
growth, strongly encourage the performance of irradiation tests to verify the in-reactor
behaviour. As determined previously in out-of-pile tests of monoliths of the brother
system of nanocrystalline nc-Y-ZrO2 [Spino et al., 2012], a strong reduction of the
gas bubble swelling, long term thermal stability of the pore-grain configuration, and
striking superplastic behaviour and accelerated creep, would be expected as well for the
developed nc-UO2 . Confirmation of anomalies in the physical properties of the material
for grain sizes in the absolute nanorange (<30 nm), consistent with observations in
178
9.4. nc-UO2 in extreme conditions.
other nc-systems was also achieved. These pernicious nano-effects, as diminution of
the thermal conductivity and the melting point, which could be a weak point for the
use of nc-UO2 as a fuel, were found, however, to become relevant only at very low
crystal/grain sizes (<30 nm) and to disappear for grain sizes of ∼ 200 nm, where,
suitably, the other searched beneficial properties of this nanostructure super-plasticity,
low gas-bubble swelling, self-limiting grain growth, etc., remain. This anticipates the
lack of property loss of the developed nc-UO2 monoliths for technical applications in
this size range. This has been a very rewarding work, with a number of breakthroughs
achieved. Much has been learned, but more needs to be done to determine the true
potential of this intriguing material.
179
180
Institute for Transuranium
Elements (ITU)
“The mission of ITU is to provide the scientific foundation for the protection of
the European citizen against risks associated with the handling and storage of highly
radioactive material. ITU’s prime objectives are to serve as a reference centre for
basic actinide research, to contribute to an effective safety and safeguards system
for the nuclear fuel cycle, and to study technological and medical applications of
radionuclides/actinides.”
“ITU works very closely with national and international bodies in the nuclear field,
both within the EU and beyond, as well as with the nuclear industry. In addition
to playing a key role in EU policy on nuclear waste management and the safety of
nuclear installations, ITU is also heavily involved in efforts to combat illicit trafficking
of nuclear materials, and in developing and operating advanced detection tools to
uncover clandestine nuclear activities. ITU provides the expertise and access to the
necessary special handling facilities for the study of the actinide elements, which is of
relevance for the issues related to nuclear power generation and the radioactive waste
treatment and disposal, but also for the advancement of science in general. Another
key role is in the study and production of radionuclides used in the treatment of cancer.”
Laboratories in ITU (left) and typical glove-box of N2 atmosphere (oxygen<0.5%) (right).
“The JRC-ITU is comprised of seven scientific and one support departments, based
in Karlsruhe (Germany, 330 staff) and Ispra (Italy, 70 staff). In total the Institute has
a multidisciplinary team of more than 400 academic, technical and support staff. Its
specialists have access to an extensive range of advanced facilities, many unavailable
elsewhere in Europe. The Institute itself has more than 45 years of experience in the
nuclear field. To foster the transfer of knowledge, the Institute encourages outside
181
scientists to join its work through secondment and grants. Within the Commission,
ITU provides vital support to policy makers, particularly in the areas of environment
and energy. It also works in the fields of EU enlargement and external relations,
addressing safety and security concerns with nuclear installations in Central and
Eastern Europe. In the safeguards and non-proliferation area, it works closely with the
Commission Directorate General Energy and Transport, operating on site laboratories
in Sellafield (UK) and La Hague (France). In the field of nuclear inspection, it
supports the International Atomic Energy Agency (IAEA), and the External Relations
Directorate General.” [JRC-ITU, 2013]
Contamination measuring monitors (left) and personal dosimetry (right).
182
List of Tables
5.1
5.2
5.3
5.4
5.5
Crystal size and lattice parameter for aqueous route nc-UO2 treated at 600°C and 1200°C
under two different atmosphere (Ar/5%H2 and He atmosphere) . . . . . . . . . . . . .
Results from the analysis of the UO2+x XANES data at the U-L3 edge. . . . . . . . .
Results from the analysis of the aqueous method synthesised nc-UO2+x EXAFS data at
the U-L3 edge. . . . . . . . . . . . . . . . . . . . . . . . . . . . . . . . . . . . . . . . .
Parameters obtained from the fits following the relaxation equation Eq. 5.6 for the
samples annealed under He static atmosphere during 50 h. . . . . . . . . . . . . . . . .
Crystal size and lattice parameter for samples treated at different temperatures, times
and under different atmosphere. . . . . . . . . . . . . . . . . . . . . . . . . . . . . . . .
. 83
. 86
. 88
. 101
. 103
6.1
6.2
Results from the analysis of the UO2+x XANES data at the U-L3 edge. . . . . . . . . . 123
Results from the analysis of the ThO2 at the Th-L3 . . . . . . . . . . . . . . . . . . . . . 128
7.1
7.2
Characterization of macro- and microstructures of the different types of nc-UO2 monoliths.144
Obtained average parameters for Vickers and Knoop indentation for the different nc-UO2
pellets. . . . . . . . . . . . . . . . . . . . . . . . . . . . . . . . . . . . . . . . . . . . . . . 153
Calculated bulk moduli (B0 ) and their first pressure derivative (B0 ) for the three
nc-UO2 samples using different EOS, as well as bulk moduli values for UO2 -bulk
[Zvoriste-Walters et al., 2013]. . . . . . . . . . . . . . . . . . . . . . . . . . . . . . . . . . 156
7.3
9.1
Densities obtained for the nc-Y-ZrO2 samples after SPS treatment at different temperatures. . . . . . . . . . . . . . . . . . . . . . . . . . . . . . . . . . . . . . . . . . . . . . . 186
183
184
List of Figures
1.1
1.2
1.3
1.4
1.5
1.6
1.7
2.1
2.2
2.3
2.4
3.1
3.2
3.3
3.4
3.5
3.6
3.7
3.8
3.9
3.10
3.11
3.12
3.13
Light Water Reactor [The energy net, 2012] [U.S.NRC, 2012]. . . . . . . . . . . . . . .
A typical temperature profile of a LWR fuel as a function of the fuel pin radius
[Konings et al., 2011]. . . . . . . . . . . . . . . . . . . . . . . . . . . . . . . . . . . . .
Macrograph of a fuel pellet after irradiation showing the typical radial cracks (left).
Pellet inside the pin illustrating the swelling with the irradiation time (right).
[Bailly et al., 1996]. . . . . . . . . . . . . . . . . . . . . . . . . . . . . . . . . . . . . . .
Micrographs at different pellet radius areas [Spino and Papaioannou, 2008]. High burnup structure (HBS or rim-structure) transformation [The energy net, 2012]. . . . . . .
Coordination state change in the transformation to the HBS (or rim-structure). . . . .
SEM micrographs of a fuel pellet at high-BU from the outer radius or rim (HBS in the
first micrograph) to inner radial positions from [Manzel and Walker, 2002]. . . . . . .
A novel fuel microstructure: nc-UO2 [The energy net, 2012]. . . . . . . . . . . . . . . .
Cyclic voltammetry experimental arrangement. . . . . . . . . . . . . . . . . . . . . . .
Overview of the acoustic microscope (in ITU developed) device showing acoustic sensors,
coupling liquid holder, sample platform and translation stages. . . . . . . . . . . . . .
Laser heating experimental set-up [Cappia et al., 2013]. . . . . . . . . . . . . . . . . .
Sample melting point setup. In the yellow area, the nc-UO2 pellet hold with three screws
is observable. . . . . . . . . . . . . . . . . . . . . . . . . . . . . . . . . . . . . . . . . .
.
2
.
3
.
4
.
.
5
6
.
.
7
9
. 13
. 21
. 23
. 24
Theoretical solubility limits of UIV and UV I species in aqueous solutions
[Fanghänel, Th. and Neck, 2002] [Neck and Kim, 2001] and experimental determinations for U-sulphate [Gil et al., 2010] and U-chloride solutions [Rousseau et al., 2002]
[Opel et al., 2007]. Compounds shown beside each equilibrium line show the precipitated solid phase when these conditions are exceeded. . . . . . . . . . . . . . . . . . . .
General set-up for reduction and controlled precipitation in a aqueous media method. .
Controlled massive precipitation in aqueous phase steps. . . . . . . . . . . . . . . . . . .
Uranyl Nitrate molecular structure. . . . . . . . . . . . . . . . . . . . . . . . . . . . . . .
Cyclic voltammetry set-up. . . . . . . . . . . . . . . . . . . . . . . . . . . . . . . . . . .
Cyclic voltammogram 0.1 M U and pH 0.5. UO2 (NO3 )2 solution in NaCl 1 M scanned
between -0.4 and +1.4 V vs. Ag/AgCl saturated at a scan rate of 0.1 V/s. . . . . . . . .
Influence of the frit on the system. Cyclic voltammogram 0.02 M U and pH=3.
UO2 (NO3 )2 solution in NaCl 1 M scanned between -1.0 and +1.2 V vs. Ag/AgCl
saturated at a scan rate of 0.1 V/s. . . . . . . . . . . . . . . . . . . . . . . . . . . . . . .
Influence of the concentration on the system. Cyclic voltammogram 0.02 M, 0.04 M
and 0.06 M U and pH∼3. UO2 (NO3 )2 solution in NaCl 1 M scanned between -1.0 and
+1.2 V vs. Ag/AgCl saturated at a scan rate of 0.1 V/s. . . . . . . . . . . . . . . . . . .
Influence of the acidity and scan rate on the system. Cyclic voltammogram 0.02 M U at
different pH (1.1, 1.6, 1.8 and 2.2) and rates (0.01, 0.02, 0.05 and 0.1 V/s). UO2 (NO3 )2
solution in NaCl 1 M scanned between -1.0 and +1.2 V vs. Ag/AgCl saturated. . . . . .
Electrochemical reduction set-up. . . . . . . . . . . . . . . . . . . . . . . . . . . . . . . .
Cyclic voltammogram 0.1 M U and pH<1. UO2 (NO3 )2 solution in HCl 0.33 M scanned
between -0.4 and +1.4 V vs. Ag/AgCl (saturated) at a scan rate of 0.1 V/s. The
theoretical reduction rate of the ion UO2+
2 at each moment was calculated with Eq. 2.7.
Change in visible absorption spectra for the reduction of 0.1 M U and initial pH<1.
UO2 (NO3 )2 solution in HCl 0.33 M. The theoretical reduction rate of the ion UO2+
2 at
each moment was calculated with Eq. 2.7. . . . . . . . . . . . . . . . . . . . . . . . . . .
U-solution at different steps during electrochemical reduction . . . . . . . . . . . . . . .
31
31
32
32
32
33
34
35
36
38
40
41
42
185
+4
3.14 Intensity peak decrease by both CV (e.g. UO2+
cathodic peak, Fig. 3.11) and UV2 /U
2+
spectrophotometry (e.g. UO2 absorption peak at 412.43 nm, Fig. 3.12) as a function
of the percentage of UO2 (NO3 )2 electrochemical conversion. . . . . . . . . . . . . . . .
3.15 Precipitation of nc-UO2 set-up. . . . . . . . . . . . . . . . . . . . . . . . . . . . . . . .
3.16 Controlled nc-UO2 precipitation from a electrochemically reduced UIV -solution 0.5 M
U in HCl 1M. pH monitoring vs. NaOH addition and time. . . . . . . . . . . . . . . .
3.17 Change in visible absorption spectra of the typical UIV band between 630 and 665 nm, of
a controlled nc-UO2 precipitation from a electrochemically reduced UIV -solution 0.1 M
U in HCl 1 M and pH<1 (left). Diminishing of intensity with increasing of the pH
because the precipitation of the U+4 in solution as nc-UO2 (right). . . . . . . . . . . .
3.18 U-solution before and after the precipitation. . . . . . . . . . . . . . . . . . . . . . . .
3.19 Uranium Speciation at different acidic media and solubility lines for UO2 (c) and
UO2 · xH2 O (am) represented with the constants data by [Guillaumont et al., 2003].
Yellow circles represent experimental points. Yellow line represents the piece of solubility line followed during precipitation. . . . . . . . . . . . . . . . . . . . . . . . . . . . .
3.20 Size distribution histogram from TEM measurements of nc-UO2 synthesized by precipitation in aqueous media. Diameter average size of 3.9(8) nm diameter average size. .
3.21 TEM micrographs of UO2 at low resolution, showing an assembly of nanocrystals, and
at high resolution, revealing lattice imaging of the nanocrystals. . . . . . . . . . . . . .
3.22 XRD pattern of nc-UO2 experimental data, fitted pattern, Bragg peak positions and
experimental-fitted difference. . . . . . . . . . . . . . . . . . . . . . . . . . . . . . . . .
3.23 Bragg diffraction peak positions and relative intensities for the refined XRD pattern of nc-UO2 by aqueous route (green), standard UO2 (00-041-1422-ICCD - red)),
U4 O9 (01-075-0944-ICCD - blue)) and U3 O8 (00-023-1460-ICCD - lila)), respectively
([ICCD, 2012] database). . . . . . . . . . . . . . . . . . . . . . . . . . . . . . . . . . . .
4.1
4.2
4.3
4.4
4.5
4.6
4.7
4.8
4.9
4.10
4.11
4.12
4.13
4.14
4.15
4.16
4.17
4.18
4.19
186
. 42
. 44
. 45
. 49
. 50
. 50
. 51
. 51
. 52
. 53
Precursor molecular structures used in the organic synthesis. . . . . . . . . . . . . . . .
Oleic Acid (OA), Oleylamine (OAM) and N-(cis-9-octadecenyl)oleamide (OOA) obtained after the condensation reaction together with water [Wu et al., 2006] (left). Intermediate steps of the nc-UO2 synthesis where free UO2 units and clusters interact
with the formed OOA (right) [Wu, 2008]. . . . . . . . . . . . . . . . . . . . . . . . . . .
Oleate as capping ligand bonded through chelating bidentate interaction on the surface
of the nc-UO2 . . . . . . . . . . . . . . . . . . . . . . . . . . . . . . . . . . . . . . . . . .
Arrangement for the organic thermal decomposition method. . . . . . . . . . . . . . . .
Steps in the thermal Decomposition of UAA in organic media. . . . . . . . . . . . . . .
(a) UAA + ODE + OA at RT (before applying any temperature). Turbid yellow
solution. (b) UAA + ODE + OA + OAM at RT (after stirring at 100°C). Transparent
orange solution. . . . . . . . . . . . . . . . . . . . . . . . . . . . . . . . . . . . . . . . . .
U-solution during the reaction step at different temperatures (160, 190 and 250°C). . . .
Th-solution during the reaction step at different temperatures. . . . . . . . . . . . . . .
Typical final UO2 solution after the reaction step and before precipitation. . . . . . . . .
Precipitation, cleaning and recollection in an organic solvent (hexane) of the nanocrystals of UO2 . . . . . . . . . . . . . . . . . . . . . . . . . . . . . . . . . . . . . . . . . . . .
Precipitation, cleaning and recollection in an organic solvent (toluene) of the nanocrystals of ThO2 . . . . . . . . . . . . . . . . . . . . . . . . . . . . . . . . . . . . . . . . . . .
Size distribution histogram from TEM measurements of UO2 nanoparticles synthesized
by thermal decomposition of UAA in organic media. Diameter average size of 4.9(3) nm.
TEM micrographs of UO2 at low resolution, showing an assembly of nanocrystals, and
at high resolution, revealing lattice imaging of the nanocrystals. . . . . . . . . . . . . . .
TEM micrograph of UO2 at high resolution, revealing lattice imaging of the nanocrystals
and interplanar distances. . . . . . . . . . . . . . . . . . . . . . . . . . . . . . . . . . . .
Size distribution histogram from DLS test of UO2 nanoparticles synthesized by thermal
decomposition of UAA in organic media. Hydrodynamic average size of 3.7(1) nm. . . .
STEM and TEM micrographs of ThO2 nanorods. . . . . . . . . . . . . . . . . . . . . . .
TEM micrographs of ThO2 nanorods at high resolution, revealing the lattice imaging. .
XRD pattern of nc-UO2 (organic route) experimental data, fitted pattern, Bragg peak
positions and experimental-fitted diference. . . . . . . . . . . . . . . . . . . . . . . . . .
Bragg diffraction peak positions and relative intensities for the refined XRD pattern of
nc-UO2 by organic route (green), standard UO2 (00-041-1422-ICCD - red), U4 O9 (01075-0944-ICCD - blue) and U3 O8 (00-023-1460-ICCD - lila), respectively ([ICCD, 2012]
database). . . . . . . . . . . . . . . . . . . . . . . . . . . . . . . . . . . . . . . . . . . . .
56
57
57
57
58
59
60
61
62
63
63
65
65
66
66
67
67
68
69
4.20 XRD pattern of nc-ThO2 experimental data, fitted pattern, Bragg peak positions and
experimental-fitted diference. Inside picture shows ThO2 nanorods powder as-produced. 70
5.1
5.2
5.3
5.4
5.5
5.6
5.7
5.8
5.9
5.10
5.11
5.12
5.13
5.14
5.15
5.16
5.17
5.18
5.19
5.20
5.21
5.22
TGA and DTA signal for nc-UO2 until 1200°C under Ar/5%H2 . . . . . . . . . . . . . .
In situ HT-XRD patterns of nc-UO2 under He (left). The typical UO2 and Pt (from
the heating plate) Bragg peak positions are also marked. The arrow on down-right side
of the graph shows a residual impurity which disappears with temperature. Evolution
of (111) and (200) peaks of UO2 cubic structure as a function of temperature (right)
[Jovani-Abril et al., 2011]. . . . . . . . . . . . . . . . . . . . . . . . . . . . . . . . . . . .
Evolution of the nc-UO2 crystallite size in function of the temperature
[Jovani-Abril et al., 2011]. . . . . . . . . . . . . . . . . . . . . . . . . . . . . . . . . . . .
a.) Lattice constant and crystallite size variation (curves only as a guide to eye) of ncUO2 in function of temperature, from in situ HT-XRD measurements under static He
atmosphere in comparison with lattice evolution in function of temperatures of standard
UO2 for different O/U ratios obtained by the relations of [Lynds et al., 1963], due to only
thermal expansion. b.) Relative crystallite size and lattice parameter vs. temperature
(curves only as a guide to eye). . . . . . . . . . . . . . . . . . . . . . . . . . . . . . . . .
Linear thermal expansion (LTE) and linear thermal expansion coefficient (LTEC) of
the nc-UO2 (curves only as a guide to eye) in comparison with data of bulk-UO2 from
[Martin, 1988]. . . . . . . . . . . . . . . . . . . . . . . . . . . . . . . . . . . . . . . . . .
Patterns comparison of nc-UO2 as-produced, nc-UO2 at 1200°C and nc-UO2 at RT after
thermal treatment at 1200°C measured in situ in the HT-XRD instrument under static
He atmosphere. . . . . . . . . . . . . . . . . . . . . . . . . . . . . . . . . . . . . . . . . .
Crystallite size and strain of nc-UO2 in function of temperature. Measurements done
at temperature under static He atmosphere (curves only as a guide to eye). . . . . . . .
XRD patterns of reference UO2 and aqueous route nc-UO2 (as-produced, after thermal
treatment under Ar/5%H2 at 600°C and 1200°C) . . . . . . . . . . . . . . . . . . . . . .
TEM images for the nc-UO2 as-produced and after thermal treatment under Ar/5%H2 .
Normalized absorption XANES spectra and the first derivate at the U-L3 edge of the
three different heated nc-UO2 samples from Aqueous route (nc-UO2 at RT, 600°C and
1200°C), together with the reference spectra of bulk UIV O2 . . . . . . . . . . . . . . . . .
a.) k3 -weighted spectra and b.) Fourier Transform at the U-L3 edge for the experimental
data of nc-UO2 (aqueous route) at different temperatures annealed and UIV O2 bulk
reference. . . . . . . . . . . . . . . . . . . . . . . . . . . . . . . . . . . . . . . . . . . . .
Comparison between experimental data from nc-UO2 annealead at 1200°C and UIV O2
reference of (left) k3 -weighted spectra and (right) Fourier Transform at the U-L3 edge. .
Experimental () and fitted data (−) for the nc-UO2 annealead at 1200°C of (left)
k3 -weighted spectra and (right) Fourier Transform at the U-L3 edge. . . . . . . . . . . .
U-O1 and U-U1 bond distances in function of the annealing temperature (under reducing
conditions) and finale size of the nc-UO2 sample (curves only as a guide to eye). . . . .
Stack of the 17 O MAS-NMR for nc-UO2 annealed at five different temperatures. . . . .
Characteristic fits for the spectra of the samples annealed at 600°C, 650°C and 700°C
(∗ = spinning sidebands; peak A = black; peak B = blue; peak C = green) . . . . . . .
Characteristic fits for the spectra of the samples annealed at 700°C, 800°C and 1200°C
(∗ = spinning sidebands; peak A = black; peak B = blue; peak C = green). . . . . . . .
Evolution of the 17 O shift (left) and of the full width at half maximum (right) as a
function of crystallite size for various temperatures. . . . . . . . . . . . . . . . . . . . . .
Infrared spectra recorded for nc-UO2 as-produced (RT), at 200°C, 600°C and 1200°C
under Ar/5%H2 annealed. Reference spectra for UO2 is also represented. Inside amplification of the infrared spectra showing the disappearing of the peaks at 1625 cm−1 and
3400 cm−1 with increasing annealing temperatures. . . . . . . . . . . . . . . . . . . . . .
Isothermal grain growth of nc-UO2 under He static atmosphere. For each isothermal
dwell temperature one new sample was used. Measurement was done in situ in the
HT-XRD device at temperature. All the curves have been fit using the Eq. 5.6. For the
one at 1200°C a fit using the Eq. 5.7 was also done. . . . . . . . . . . . . . . . . . . . . .
Isothermal grain growth of nc-UO2 under He static atmosphere. For each isothermal
dwell temperature one new sample was used. Measurement was done in situ in the
HT-XRD device. All the curves have been fit using the Eq. 5.6. . . . . . . . . . . . . . .
Grain growth relaxation time as a function of dwell temperature for the nc-UO2 samples
annealed under He static atmosphere during 50 h. Fit obtained excluding the value at
1200°C. . . . . . . . . . . . . . . . . . . . . . . . . . . . . . . . . . . . . . . . . . . . . .
74
75
76
78
79
79
81
82
83
84
87
89
89
90
91
92
93
95
97
99
100
101
187
5.23 Diffusion coefficient Di (m2 /s) as a function of temperature for the nc-UO2 samples
annealed under He static atmosphere during 50 h. Fit obtained excluding the value at
1200°C. . . . . . . . . . . . . . . . . . . . . . . . . . . . . . . . . . . . . . . . . . . . . . 102
5.24 Arrhenius diagram comparing the cation self-diffusion in UO2 fluorite-structure from
large-grain ([Matzke, 1987]) and nano-grain of this study (samples annealed under He
static atmosphere during 50 h). Tm is the melting point temperature (TmU O2 =3140 °K).104
TGA and DTA signal for nc-UO2 under Ar/5%H2 atmosphere. . . . . . . . . . . . . .
In situ HT-XRD patterns of nc-UO2 under He (left). The typical UO2 and Pt (heating
plate) Bragg peak positions are also marked. The (right) picture shows just the evolution
of (111) and (200) peaks of UO2 cubic structure as a function of temperature. . . . . .
6.3 Evolution of the nc-UO2 crystallite size in function of the temperature. . . . . . . . .
6.4 TEM images for the nc-UO2 . . . . . . . . . . . . . . . . . . . . . . . . . . . . . . . . .
6.5 a.) Lattice constant and crystallite size variation of nc-UO2 in function of temperature
(curves only as a guide to eye), from in situ HT-XRD measurements under static He
atmosphere in comparison with lattice evolution in function of temperatures of standard
UO2 for different O/U ratios obtained by the relations of [Lynds et al., 1963], due to only
thermal expansion. b.) Relative crystallite size and lattice parameter vs. temperature
(curves only as a guide to eye). . . . . . . . . . . . . . . . . . . . . . . . . . . . . . . .
6.6 Linear thermal expansion (LTE) and linear thermal expansion coefficient (LTEC) of
the nc-UO2 in comparison with data of bulk-UO2 from [Martin, 1988] (curves only as a
guide to eye). . . . . . . . . . . . . . . . . . . . . . . . . . . . . . . . . . . . . . . . . .
6.7 Patterns comparison of nc-UO2 pre-thermal treated, nc-UO2 at 1100°C and nc-UO2 at
RT after thermal treatment at 1100°C (measured in situ in the HT-XRD instrument
under static He atmosphere) . . . . . . . . . . . . . . . . . . . . . . . . . . . . . . . . .
6.8 Crystallite size and strain of nc-UO2 in function of temperature. Measurements done
at temperature under static He atmosphere (curves only as a guide to eye). . . . . . .
6.9 XRD patterns of reference UO2 and organic UO2 (as-produced, after thermal treatment
under Ar/5%H2 at 600°C and 1200°C). . . . . . . . . . . . . . . . . . . . . . . . . . .
6.10 Normalized absorption XANES spectra and the first derivate at the U-L3 edge of the
three different heated nc-UO2 samples from Organic route (nc-UO2 at RT, 600°C and
1200°C), together with the reference spectra of bulk UIV O2 . . . . . . . . . . . . . . . .
6.11 a.) k3 -weighted spectra and b.) Fourier Transform at the U-L3 edge for the experimental
data of nc-UO2 (organic route) at different temperatures annealed and UIV O2 bulk
reference. . . . . . . . . . . . . . . . . . . . . . . . . . . . . . . . . . . . . . . . . . . .
6.12 Normalized absorption XANES spectra and the first derivate at the Th-L3 edge of ncThO2 at RT together with the reference spectra of bulk ThIV O2 . . . . . . . . . . . . .
6.1
6.2
7.1
7.2
7.3
7.4
7.5
7.6
7.7
7.8
7.9
7.10
7.11
7.12
7.13
7.14
7.15
7.16
188
. 112
. 113
. 114
. 114
. 115
. 116
. 117
. 118
. 120
. 121
. 124
. 128
Hydraulic press (ITU) and nc-UO2 green pressed pellet. . . . . . . . . . . . . . . . . . . 130
Green density and theoretical density (TD) of the nc-UO2 pressed pellets vs. applied
force. . . . . . . . . . . . . . . . . . . . . . . . . . . . . . . . . . . . . . . . . . . . . . . . 131
a.) Dispersion of nc-UO2 in water with homogenizer. b.) Representation of the floatpacking process taken from [Godlinski et al., 2002]. . . . . . . . . . . . . . . . . . . . . . 132
Green pellet of nc-UO2 from aqueous route obtained by conventional uniaxial pressing. . 132
Typical microstructure of conventional pressed nc-UO2 green pellet. . . . . . . . . . . . 133
Schematic calcination steps for nc-UO2 powders from aqueous and organic routes. . . . 133
Green pellet of nc-UO2 from aqueous route obtained by float packing consolidation. . . 133
Mortar with thermally treated nc-UO2 powder from organic route. . . . . . . . . . . . . 134
Green pellet of nc-UO2 from organic route obtained by conventional uniaxial pressing. . 134
Schematic program for two-step sintering under Ar/5%H2 atmosphere. . . . . . . . . . . 135
Aqueous route nc-UO2 sintered pellet. . . . . . . . . . . . . . . . . . . . . . . . . . . . . 135
Organic route nc-UO2 sintered pellet. . . . . . . . . . . . . . . . . . . . . . . . . . . . . 136
Schematic heating program for slow calcination and sintering under Ar/5%H2 atmosphere.137
Relative linear shrinkage and its derivative of the nc-UO2 ceramic as a function of
temperature. Comparison with bulk-UO2 taken from [Lahiri et al., 2006]. . . . . . . . . 137
Arrhenius plot of the initial densification stages for a nc-UO2 by conventional compaction
pressed and sintered in oven under Ar/5%H2 . . . . . . . . . . . . . . . . . . . . . . . . . 139
Aqueous-Pressed. Macrostructure of conventional-pressed and sintered (1200°C) pellet
from the aqueous route nc-UO2 -powder. The scale bar is 100 μm. . . . . . . . . . . . . . 140
7.17 Aqueous-Pressed-PTT. Macrostructure of conventional-pressed and sintered (1200°C)
pellet from the aqueous route nc-UO2 -powder. Previous thermal treatment for dehydration of the nc-UO2 powder before pressing, was done. The scale bar is 100 μm. . .
7.18 Aqueous-Pressed-PTT. Fresh-fracture microstructure of conventional-pressed and sintered (1200°C) pellet from the aqueous route nc-UO2 -powder. Previous thermal treatment for dehydration of the powder before pressing, was done. . . . . . . . . . . . . .
7.19 Aqueous-Float Packing. Macrostructure of float packed consolidated and sintered
(1200°C) pellet from the aqueous route nc-UO2 -powder. The scale bar is 100 μm. . . .
7.20 Aqueous-Float Packing. Fresh-fracture microstructure of float packed consolidated and
sintered (900°C) pellet from the aqueous route nc-UO2 -powder. . . . . . . . . . . . . .
7.21 Aqueous-Float Packing. Fresh-fracture microstructure of float packed consolidated and
sintered (1200°C) pellet from the aqueous route nc-UO2 -powder. . . . . . . . . . . . .
7.22 Organic-Pressed-PTT. Macrostructure of conventional pressed and sintered (1200°C)
pellet from the organic route nc-UO2 -powder. Previous thermal treatment for burning
of the capping organics before pressing, was done. The scale bar is 100 μm. . . . . . .
7.23 Organic-Pressed-PTT. Fresh-fracture microstructure of of conventional pressed and sintered (1200°C) pellet from the organic route nc-UO2 -powder. Previous thermal treatment for burning of the capping organics before pressing, was done. . . . . . . . . . .
7.24 Typical Vickers (left) and Knoop (right) indentations. . . . . . . . . . . . . . . . . . .
7.25 Vickers indentations at different loads for the nc-UO2 Aqueous-Pressed pellet (Fig. 7.17).
Indentations performed with the instrumented indentor. . . . . . . . . . . . . . . . . .
7.26 Vickers indentations at different loads for three kind of nc-UO2 pellets (Table 7.1):
Aqueous-Pressed (Fig. 7.17), Aqueous-Float Packing (Fig 7.19) and Organic-Pressed
(Fig 7.22). Indentations performed with the manual mictroindentor. . . . . . . . . . .
7.27 Micrographs of Knoop indented nc-UO2 pellets. . . . . . . . . . . . . . . . . . . . . . .
7.28 Average HV (-) obtained for the different loads used for each kind of monolith. . . . .
determined by [Pujol et al., 2004] (Eq. 7.5). Repre7.29 Calibration curve ab vs. H
H E K
sentation of values for E K for the different nc-UO2 monoliths obtained by the calibration curve together with other reference materials from [Marshall et al., 1982] and
[Pujol et al., 2004]. . . . . . . . . . . . . . . . . . . . . . . . . . . . . . . . . . . . . . .
7.30 Acoustical image of a nc-UO2 sample from Aqueous-Float Packing. . . . . . . . . . . .
7.31 TEM micrographs of UO2 at high resolution for the three different sizes
[Zvoriste-Walters et al., 2013]. . . . . . . . . . . . . . . . . . . . . . . . . . . . . . . . .
for the three different sizes
7.32 In-situ HP-XRD pattern of nc-UO2
[Zvoriste-Walters et al., 2013]. . . . . . . . . . . . . . . . . . . . . . . . . . . . . . . .
7.33 Relative volumes vs. pressure. The lines represent the least-square fit of the 3rd order BM-EOS to the experimental data. Insert Fig.: compression data from the three
nc-UO2 samples plotted in the low pressure (LP) range (LP up to around 10 GPa)
[Zvoriste-Walters et al., 2013]. . . . . . . . . . . . . . . . . . . . . . . . . . . . . . . . .
7.34 Normalised pressure as a function of the Eulerian strain for the three nc-UO2 samples.
The solid lines represent a linear fit to the experimental data. In the F (f ) linear plot
the bulk modulus is obtained from the intercept on the F axis and the B0 from the
gradient F = B0 + (3B0 (B0 − 4)f )/2 [Zvoriste-Walters et al., 2013]. . . . . . . . . . .
7.35 The bulk modulus plotted as a function of three crystal size samples (4 nm, 6 nm
and 34 nm). A size approximation for the micro-sized bulk modulus UO2 from
[Pujol et al., 2004] to 200 nm has been done [Zvoriste-Walters et al., 2013]. . . . . . .
7.36 Differences in the HV vs. H
E K behaviour of irradiated and non-irradiated UO2 . . . .
7.37 E values from microacoustic tests and Knoop indentation from irradiated fuels
[Baron et al., 2005] and nc-UO2 (this work). . . . . . . . . . . . . . . . . . . . . . . . .
7.38 Thermal diffusivity of nc-UO2 (200 nm - 90% density) specimen upon temperature,
extrapolated at 95% density for comparison with bulk-UO2 (large-grain) (95% density) from [Fink, 2000]; red symbols: measurements at rising temperature, blue symbols:
measurements at falling temperature levels. . . . . . . . . . . . . . . . . . . . . . . . .
7.39 Melting point measurement for 10 nm-UO2 sample. . . . . . . . . . . . . . . . . . . . .
7.40 Melting point measurement for ∼200 nm-UO2 sample. . . . . . . . . . . . . . . . . . .
7.41 SEM images of the fresh fracture of surface-melted nc-UO2 sample. Three different size
areas (from surface to 40 μm depth, 40 μm to 115 μm and 115 μm to the opposite
surface) are distinguishable. . . . . . . . . . . . . . . . . . . . . . . . . . . . . . . . . .
. 141
. 141
. 142
. 142
. 142
. 143
. 143
. 148
. 148
. 149
. 150
. 151
. 152
. 153
. 154
. 155
. 157
. 158
. 159
. 160
. 160
. 163
. 164
. 165
. 165
189
7.42 SEM images of the three different size regions formed after surface melting of the ncUO2 sample. (First line of images): surface-40 μm, molten zone and columnar growth.
(Second line): 40 μm-115 μm, molten zone and non columnar growth. (Third line):
115 μm-opposite surface, unmolten zone, grain growth (241(70) nm) . . . . . . . . . . . 166
9.1
9.2
9.3
9.4
9.5
9.6
9.7
190
Magnetic susceptibility at 70 KOe for nano materials and 10 KOe for single crystal. .
Effective magnetic moment extracted from the Curie Weiss law Model (CW ) for the
different size of nano materials. . . . . . . . . . . . . . . . . . . . . . . . . . . . . . . .
Spark Plasma Sintering pellet of nc-Y-ZrO2 . . . . . . . . . . . . . . . . . . . . . . . . .
Microstructure of fresh fracture of nc-Y-ZrO2 pellet by SPS. . . . . . . . . . . . . . . .
Spark Plasma Sintering pellet of nc-Y-ZrO2 (left). Optical microscopy of the fresh
fracture for the thermal treated sample. The temperature gradients measured on the
sample surfaced are also indicated (right). . . . . . . . . . . . . . . . . . . . . . . . . .
Fresh fracture of the thermal treated sample. Thermal distribution measured in the
POLARIS facility. The temperatures were measured on the surface. . . . . . . . . . .
Micro- and macro-structure of nc-Y-ZrO2 bulk specimens subjected to POLARIS heating experiments to simulate a Large LOCA event. . . . . . . . . . . . . . . . . . . . .
. 184
. 185
. 186
. 186
. 187
. 188
. 188
Bibliography
[Ayyub et al., 1995] Ayyub, P., Palkar, V. R., Chattopadhyay, S., and Multani, M.
(1995). Effect of crystal size reduction on lattice symmetry and cooperative properties. Physical Review B, 51(9):6135–6138.
[Bailly et al., 1996] Bailly, H., D. Ménessier, and Prunier, C. (1996). Le Combustible
nucléaire des réacteurs à eau sous pression et des réacteurs à neutrons rapides: Conception et comportement, volume Série Synthèses.
[Banerjee et al., 2003] Banerjee, R., Sperling, E. A., Thompson, G. B., Fraser, H. L.,
Bose, S., and Ayyub, P. (2003). Lattice expansion in nanocrystalline niobium thin
films. Applied Physics Letters, 82(24):4250–4252.
[Baron et al., 2005] Baron, D., Masson, R., Gatt, J.-M., Spino, J., and Laux, D. (2005).
Evolution of the Fuel Mechanical Properties with Burn-up, an Extensive European
Experimental Program. In Water Reactor Fuel Performance JNS-ENS-ANS meeting.,
Kyoto, Japan.
[Birch, 1947] Birch, F. (1947). Finite Elastic Strain of Cubic Crystals. Physical Review,
71(11):809–824.
[Birch, 1978] Birch, F. (1978). Finite strain isotherm and velocities for single-crystal
and polycrystalline NaCl at high pressures and 300°K. Journal of Geophysical Research: Solid Earth, 83(B3):1257–1268.
[Böhler et al., 2012] Böhler, R., Welland, M. J., Bruycker, F. D., Boboridis, K.,
Janssen, A., Eloirdi, R., Konings, R. J. M., and Manara, D. (2012). Revisiting the
melting temperature of NpO2 and the challenges associated with high temperature
actinide compound measurements. Journal of Applied Physics, 111(11):–.
[Boswell, 1951] Boswell, F. W. C. (1951). Precise Determination of Lattice Constants
by Electron Diffraction and Variations in the Lattice Constants of Very Small Crystallites. Proceedings of the Physical Society. Section A, 64(5):465.
[Brazhkin et al., 2002] Brazhkin, V. V., Lyapin, A. G., and Hemley, R. J. (2002).
Harder than diamond: Dreams and reality. Philosophical Magazine A, 82(2):231–
253.
[Brendebach et al., 2007] Brendebach, B., Dardenne, K., Denecke, M., Rothe, J., and
Vitova, T. (2007). New developments at the INE-Beamline for actinide research at
ANKA. Nuclear Instruments and Methods in Physics Research Section A: Accelerators, Spectrometers, Detectors and Associated Equipment. 582:80–81.
[Bristow et al., 2001] Bristow, S., Shekunov, T., Shekunov, B. Y., and York, P. (2001).
Analysis of the supersaturation and precipitation process with supercritical CO2 . The
Journal of Supercritical Fluids, 21(3):257–271.
191
[Burda et al., 2005] Burda, C., Chen, X., Narayanan, R., and El-Sayed, M. A. (2005).
Chemistry and Properties of Nanocrystals of Different Shapes. ChemInform, 36(27).
[Cappia et al., 2013] Cappia, F., Jovani-Abril, R., Spino, J., Luzzi, L., Janßen, A., and
Manara, D. (2013). Laser melting of nano-crystalline uranium dioxide. Progress in
Nuclear Energy, (0):–.
[Carbol et al., 2009] Carbol, P., Fors, P., Winckel, S. V., and Spahiu, K. (2009). Corrosion of irradiated MOX fuel in presence of dissolved H2 . Journal of Nuclear Materials,
392(1):45 – 54.
[Casabella, 1964] Casabella, P. A. (1964). Determination of Nuclear Quadrupole Coupling Constants from Nuclear Magnetic Resonances in Polycrystalline Solids. The
Journal of Chemical Physics, 40(1):149–152.
[Chen et al., 2002] Chen, B., Penwell, D., Benedetti, L. R., Jeanloz, R., and Kruger,
M. B. (2002). Particle-size effect on the compressibility of nanocrystalline alumina.
Physical Review B, 66(14):144101–.
[Chen et al., 2001] Chen, B., Penwell, D., Kruger, M. B., Yue, A. F., and Fultz, B.
(2001). Nanocrystalline iron at high pressure. Journal of Applied Physics, 89(9):4794–
4796.
[Chung and Davies, 1979] Chung, T. and Davies, T. (1979). The superplastic creep of
uranium dioxide. Journal of Nuclear Materials, 79(1):143 – 153.
[Cimino et al., 1968] Cimino, A., Jacono, M. L., Porta, P., and Valigi, M. (1968). Structural and Magnetic Investigations of Oxide Solid Solution. Zeitschrift für Physikalische Chemie, 59(1_4):134–150.
[Claassen and Sandenbergh, 2006] Claassen, J. O. and Sandenbergh, R. F. (2006). Particle growth parameters in the precipitation of metastable iron phases from zinc-rich
solutions. Hydrometallurgy, 84(3–4):165–174.
[Conradson et al., 2005a] Conradson, S. D., Begg, B. D., Clark, D. L., den Auwer,
C., Ding, M., Dorhout, P. K., Espinosa-Faller, F. J., Gordon, P. L., Haire, R. G.,
Hess, N. J., Hess, R. F., Webster Keogh, D., Lander, G. H., Manara, D., Morales,
L. A., Neu, M. P., Paviet-Hartmann, P., Rebizant, J., Rondinella, V. V., Runde,
W., Drew Tait, C., Kirk Veirs, D., Villella, P. M., and Wastin, F. (2005a). Charge
distribution and local structure and speciation in the UO2+x and PuO2+x binary
oxides for x0.25. Journal of Solid State Chemistry, 178(2):521–535.
[Conradson et al., 2005b] Conradson, S. D., Manara, D., Wastin, F., Clark, D. L., Lander, G. H., Morales, L. A., Rebizant, J., and Rondinella, V. V. (2005b). Local Structure and Charge Distribution in the UO2 -U4 O9 System. ChemInform, 36(1):no–no.
[Deshpande et al., 2005] Deshpande, S., Patil, S., Kuchibhatla, S. V., and Seal, S.
(2005). Size dependency variation in lattice parameter and valency states in nanocrystalline cerium oxide. Applied Physics Letters, 87(13):133113–3.
[Dong et al., 1997] Dong, X., Hong, G., Yu, D., and Yu, D. (1997). Synthesis and
Properties of Cerium Oxide Nanometer Powders by Pyrolysis of Amorphous Citrate.
J. Mater. Sci. Technol., 13:113.
192
[Ekeroth et al., 2009] Ekeroth, E., Low, J., Zwicky, H.-U., and Spahiu, K. (2009). Corrosion studies with high burn-up LWR fuel in simulated groundwaters. volume 1224,
page 123. Material Research Society Proceedings.
[Fanghänel, Th. and Neck, 2002] Fanghänel, Th. and Neck, V. (2002). Aquatic chemistry and solubility phenomena of actinide oxi-des/hydroxides. Pure Appl. Chem.,
74(10):1895 – 1907.
[Fiévet et al., 1979] Fiévet, F., Germi, P., de Bergevin, F., and Figlarz, M. (1979).
Lattice parameter, microstrains and non-stoichiometry in NiO. Comparison between
mosaic microcrystals and quasi-perfect single microcrystals. Journal of Applied Crystallography, 12(4):387–394.
[Fink, 2000] Fink, J. K. (2000). Thermophysical properties of uranium dioxide. Journal
of Nuclear Materials, 279(1):1–18.
[Fujita et al., 1956] Fujita, J., Nakamoto, K., and Kobayashi, M. (1956). Infrared Spectra of Metallic Complexes. II. The Absorption Bands of Coördinated Water in Aquo
Complexes. Journal of the American Chemical Society, 78(16):3963–3965.
[Fujiwara et al., 2005] Fujiwara, K., Yamana, H., Fujii, T., Kawamoto, K., Sasaki, T.,
and Moriyama, H. (2005). Solubility product of hexavalent uranium hydrous oxide.
Journal of Nuclear Science and Technology, 42(3):289–294.
[Fujiwara et al., 2003] Fujiwara, K., Yamana, H., Fujii, T., and Moriyama, H.
(2003). Determination of uranium(IV) hydrolysis constants and solubility product of
UO2 · xH2 O. Radiochimica Acta, 91(6-2003):345–350.
[Fuketa et al., 2006] Fuketa, T., Sugiyama, T., and Nagase, F. (2006). Behaviour of 60
to 78 MWd/kgU PWR fuels under reactivity initiated accidents conditions. Journal
of Nuclear Science and Technology, 43(9):1080–1088.
[Fukuhara, 2003] Fukuhara, M. (2003). Lattice expansion of nanoscale compound particles. Physics Letters A, 313(5–6):427–430.
[Garzarolli et al., 1979] Garzarolli, F., von Jan, R., and Stehle, H. (1979). The Main
Causes of Fuel Failure in Water Cooled Power Reactors. Atomic Energy Review,
17(1):31–128.
[Gil et al., 2010] Gil, D., Malmbeck, R., Spino, J., Fanghänel, Th., and Dinnebier, R. E.
(2010). Nanoscale UO2 and novel complex U(IV)-sulphate phase formation from
electrolytically reduced uranyl sulphate solutions. Radiochimica Acta, 98(2):77–89.
[Godlinski et al., 2002] Godlinski, D., Kuntz, M., and Grathwohl, G. (2002). Transparent alumina with submicrometer grains by float packing and sintering. Journal
of the American Ceramic Society, 85(10):2449–2456.
[Godwal et al., 2010] Godwal, B. K., Speziale, S., Clark, S. M., Yan, J., and Jeanloz,
R. (2010). High pressure equation of state studies using methanol–ethanol–water and
argon as pressure media. Journal of Physics and Chemistry of Solids, 71(8):1059–
1064.
[Grüneisen, 1912] Grüneisen, E. (1912). Theorie des festen Zustandes einatomiger Elemente. Annalen der Physik, 344(12):257–306.
193
[Guillaumont et al., 2003] Guillaumont, R., Fanghänel, Th, Fuger, J., and Grenthe, I.
(2003). Update on the Chemical Thermodynamics of Uranium, Neptunium, Plutonium, Americium and Technetium, volume 5 of Chemical Thermodynamics. Elsevier
Science Ltd.
[Guisbiers, 2012] Guisbiers, G. (2012). Review on the analytical models describing
melting at the nanoscale. J. Nanosci. Lett., 2(8).
[Haines et al., 2001] Haines, J., Léger, J., and Bocquillon, G. (2001). Synthesis and
design of superhard materials. Annual Review of Materials Research, 31(1):1–23.
[He et al., 2005] He, Y., Liu, J. F., Chen, W., Wang, Y., Wang, H., Zeng, Y. W., Zhang,
G. Q., Wang, L. N., Liu, J., Hu, T. D., Hahn, H., Gleiter, H., and Jiang, J. Z. (2005).
High-pressure behavior of SnO2 nanocrystals. Physical Review B, 72(21):212102–.
[Hennig et al., 2007] Hennig, C., Schmeide, K., Brendler, V., Moll, H., Tsushima, S.,
and Scheinost, A. C. (2007). EXAFS Investigation of U(VI), U(IV), and Th(IV)
Sulfato Complexes in Aqueous Solution. ChemInform, 38(38).
[Hennig et al., 2005] Hennig, C., Tutschku, J., Rossberg, A., Bernhard, G., and
Scheinost, A. C. (2005). Comparative EXAFS Investigation of Uranium(VI) and
-(IV) Aquo Chloro Complexes in Solution Using a Newly Developed Spectroelectrochemical Cell. Inorganic Chemistry, 44(19):6655–6661.
[Hiernaut et al., 2008] Hiernaut, J.-P., Wiss, T., Colle, J.-Y., Thiele, H., Walker, C.,
Goll, W., and Konings, R. (2008). Fission product release and microstructure changes
during laboratory annealing of a very high burn-up fuel specimen. Journal of Nuclear
Materials, 377(2):313 – 324.
[Hofmeister, 1993] Hofmeister, A. M. (1993). Interatomic potentials calculated from
equations of state: Limitation of finite strain to moderate K’. Geophysical Research
Letters, 20(7):635–638.
[HSP-PAN, 2011] HSP-PAN (2011). HighScore Plus. PANalytical B.V., Almelo, The
Netherlands, version: 3.0d (3.0.4) edition.
[ICCD, 2012] ICCD (2012).
www.icdd.com.
The International Centre for Diffraction Data,
[Idiri et al., 2004] Idiri, M., Le Bihan, T., Heathman, S., and Rebizant, J. (2004). Behavior of actinide dioxides under pressure: UO2 and ThO2 . Physical Review B,
70(1):014113–.
[Jovani-Abril et al., 2011] Jovani-Abril, R., Eloirdi, R., Bouëxière, D., Malmbeck, R.,
and Spino, J. (2011). In situ high temperature X-ray diffraction study of UO2
nanoparticles. Journal of Materials Science, pages 1–6.
[JRC-ITU, 2013] JRC-ITU (2013). Joint Research Centre - Institute for Transuranium
Elements. http://itu.jrc.ec.europa.eu/index.php?id=11type=0.
[Kim et al., 2009] Kim, J.-G., Park, Y.-S., Ha, Y.-K., and Song, K. (2009). Infrared
Spectra of Uranium Oxides Measured by ATR-FTIR. Journal of Nuclear Science
and Technology, 46(12):1188–1192.
[Kittel, 1996] Kittel, C. (1996). Introduction to solid state physics. Wiley, New York.
194
[Klam et al., 1987] Klam, H. J., Hahn, H., and Gleiter, H. (1987). The thermal expansion of grain boundaries. Acta Metallurgica, 35(8):2101–2104.
[Kleykamp, 1979] Kleykamp, H. (1979). The chemical state of LWR high-power rods
under irradiation. Journal of Nuclear Materials, 84(1–2):109–117.
[Konings et al., 2011] Konings, R. J. M., Wiss, T., and Guéneau, C. (2011). Nuclear
Fuels. In Morss, L. R., Edelstein, N. M., and Fuger, J., editors, The Chemistry of
the Actinide and Transactinide Elements, page 3720. Springer Netherlands.
[Kulisch et al., 2009] Kulisch, W., Freudenstein, R., Ruiz, A., Valsesia, A., Sirghi, L.,
Ponti, J., Colpo, P., and Rossi, F. (2009). Nanostructured Materials For Advanced
Technological Applications: A Brief Introduction. NATO Science for Peace and
Security Series B: Physics and Biophysics, pages 3–34. Springer Netherlands.
[Kutty et al., 2004] Kutty, T., Hegde, P., Khan, K., Jarvis, T., Sengupta, A., Majumdar, S., and Kamath, H. (2004). Characterization and densification studies on ThO2 –
UO2 pellets derived from ThO2 and U3 O8 powders. Journal of Nuclear Materials,
335(3):462 – 470.
[Lahiri et al., 2006] Lahiri, D., Rao, S. V. R., Rao, G. V. S. H., and Srivastava, R. K.
(2006). Study on sintering kinetics and activation energy of UO2 pellets using three
different methods. Journal of Nuclear Materials, 357(1–3):88–96.
[Lai et al., 1998] Lai, S. L., Carlsson, J. R. A., and Allen, L. H. (1998). Melting
point depression of Al clusters generated during the early stages of film growth:
Nanocalorimetry measurements. Applied Physics Letters, 72(9):1098–1100.
[Lai et al., 1996] Lai, S. L., Guo, J. Y., Petrova, V., Ramanath, G., and Allen, L. H.
(1996). Size-Dependent Melting Properties of Small Tin Particles: Nanocalorimetric
Measurements. Physical Review Letters, 77(1):99–102.
[Laux et al., 2012] Laux, D., Baron, D., Despaux, G., Kellerbauer, A. I., and Kinoshita,
M. (2012). Determination of high burn-up nuclear fuel elastic properties with acoustic
microscopy. Journal of Nuclear Materials, 420(1–3):94–100.
[Lawn and Howes, 1981] Lawn, B. R. and Howes, V. R. (1981). Elastic recovery at
hardness indentations. Journal of Materials Science, 16:2745–2752.
[Li et al., 2004] Li, G., Boerio-Goates, J., Woodfield, B. F., and Li, L. (2004). Evidence
of linear lattice expansion and covalency enhancement in rutile TiO2 nanocrystals.
Applied Physics Letters, 85(11):2059–2061.
[Li et al., 2005] Li, G., Li, L., Boerio-Goates, J., and Woodfield, B. F. (2005). High Purity Anatase TiO2 Nanocrystals: Near Room-Temperature Synthesis, Grain Growth
Kinetics, and Surface Hydration Chemistry. Journal of the American Chemical Society, 127(24):8659–8666.
[Lifshitz and Slyozov, 1961] Lifshitz, I. M. and Slyozov, V. V. (1961). The kinetics of
precipitation from supersaturated solid solutions. Journal of Physics and Chemistry
of Solids, 19(1–2):35–50.
[Ling et al., 2008] Ling, T., Yu, H., Shen, Z., Wang, H., and Zhu, J. (2008). Virusmediated FCC iron nanoparticle induced synthesis of uranium dioxide nanocrystals.
Nanotechnology, 19(11):115608.
195
[Löffler and Johnson, 2000] Löffler,
J. F. and Johnson,
W. L. (2000).
Model for decomposition and nanocrystallization of deeply undercooled
Zr41.2 T i13.8 Cu12.5 N i10 Be22.5 . AppliedP hysicsLetters, 76(23) : 3394 − −3396.
[Lovley and Phillips, 1992] Lovley, D. R. and Phillips, E. J. (1992). Reduction of
uranium by Desulfovibrio desulfuricans. Applied and Environmental Microbiology,
58(3):850–856.
[Lynds et al., 1963] Lynds, L., Young, W. A., Mohl, J. S., and Libowitz, G. G. (1963).
X-ray and density study of nonstoichiometry in uranium oxides. page 58.
[Maeda et al., 2009] Maeda, K., Yamamoto, Y., Asakuma, Y., and Fukui, K. (2009).
Determination of crystal nucleus size of potassium chloride from ethanol solution
caused by ultrasonic irradiation. Chemical Engineering and Processing: Process Intensification, 48(4):902–906.
[Maier et al., 1982] Maier, G., Assmann, H., Dorr, W., Manzel, R., and Peehs, M.
(1982). Jahrestagung Kerntechnik. page 485, Bonn.
[Manara et al., 2012] Manara, D., Böhler, R., Boboridis, K., Capriotti, L., Quaini, A.,
Luzzi, L., De Bruycker, F., Guéneau, C., Dupin, N., and Konings, R. (2012). The
Melting Behaviour of Oxide Nuclear Fuels: Effects of the Oxygen Potential Studied
by Laser Heating. Procedia Chemistry, 7(0):505–512.
[Manara et al., 2005] Manara, D., Ronchi, C., Sheindlin, M., Lewis, M., and Brykin, M.
(2005). Melting of stoichiometric and hyperstoichiometric uranium dioxide. Journal
of Nuclear Materials, 342(1–3):148–163.
[Manara et al., 2008] Manara, D., Sheindlin, M., Heinz, W., and Ronchi, C. (2008).
New techniques for high-temperature melting measurements in volatile refractory
materials via laser surface heating. Review of Scientific Instruments, 79(11):–.
[Manzel and Walker, 2002] Manzel, R. and Walker, C. (2002). EPMA and SEM of
fuel samples from PWR rods with an average burn-up of around 100 MWd/kgHM.
Journal of Nuclear Materials, 301(2–3):170 – 182.
[Marshall et al., 1982] Marshall, D. B., Noma, T., and Evans, A. G. (1982). A Simple
Method for Determining Elastic-Modulus-to-Hardness Ratios using Knoop Indentation Measurements. Journal of the American Ceramic Society, 65(10):c175–c176.
[Martin, 1988] Martin, D. G. (1988). The thermal expansion of solid UO2 and (U,
Pu) mixed oxides- a review and recommendations. Journal of Nuclear Materials,
152(2–3):94–101.
[Martin, 2007] Martin, M. (2007). Oxygen and Cation Diffusion Processes in Oxygen
Ion Conductors. Diffusion Fundamentals, 39.1(6).
[Mathur and Singh, 2009] Mathur, S. and Singh, M., editors (2009). Nanostructured
Materials and Nanotechnology II - A Collection of Papers Presented at the 32nd
International Conference on Advanced Ceramics and Composites, volume 29.
[Matzke, 1987] Matzke, H. (1987). Atomic transport properties in UO2 and mixed
oxides (U, Pu)O2 . J. Chem. Soc., Faraday Trans. 2, 83:1121–1142.
[Matzke, 1992] Matzke, H. (1992). On the rim effect in high burnup UO2 LWR fuels.
Journal of Nuclear Materials, 189(1):141 – 148.
196
[Matzke and Spino, 1997] Matzke, H. and Spino, J. (1997). Formation of the rim structure in high burnup fuel. Journal of Nuclear Materials, 248(0):170–179.
[Mazaheri et al., 2011] Mazaheri, M., Mari, D., Hesabi, Z. R., Schaller, R., and Fantozzi, G. (2011). Multi-walled carbon nanotube/nanostructured zirconia composites:
Outstanding mechanical properties in a wide range of temperature. Composites Science And Technology, 71:939–945.
[Mazaheri et al., 2010] Mazaheri, M., Mari, D., and Schaller, R. (2010). High temperature mechanical spectroscopy of yttria stabilized zirconia reinforced with carbon
nanotubes. physica status solidi (a), 207(11):2456–2460.
[Mennecart et al., 2004] Mennecart, T., Grambow, B., Fattahi, M., and Andriambololona, Z. (2004). Effect of alpha radiolysis on doped UO2 dissolution under
reducing conditions. Radiochimica Acta, 92(9-11-2004):611–615.
[Meresse et al., 2000] Meresse, Y., Heathman, S., Le Bihan, T., Rebizant, J., Brooks,
M. S. S., and Ahuja, R. (2000). X-ray diffraction studies of AuCu3-type neptunium
compounds under pressure. Journal of Alloys and Compounds, 296(1):27–32.
[Mikeev, 1989] Mikeev, N. B. (1989).
Die stellung der lanthaniden und actiniden im periodensystem des mendeleev.
Naturwissenschaften, 76:107–113.
10.1007/BF00366600.
[Moelle and Fecht, 1995] Moelle, C. and Fecht, H. (1995). Thermal stability of
nanocrystalline iron prepared by mechanical attrition. Nanostructured Materials,
6(1–4):421 – 424.
[Mogensen et al., 1999] Mogensen, M., Pearce, J., and Walker, C. (1999). Behaviour of
fission gas in the rim region of high burn-up UO2 fuel pellets with particular reference
to results from an XRF investigation. Journal of Nuclear Materials, 264(1–2):99 –
112.
[Murray et al., 2000] Murray, C. B., Kagan, C. R., and Bawendi, M. G. (2000). Synthesis and characterization of monodisperse nanocrystals and close-packed nanocrystal
assemblies. Annual Review of Materials Science, 30(1).
[Murray et al., 1993] Murray, C. B., Norris, D. J., and Bawendi, M. G. (1993). Synthesis and characterization of nearly monodisperse CdE (E = sulfur, selenium, tellurium) semiconductor nanocrystallites. Journal of the American Chemical Society,
115(19):8706–8715.
[Natter et al., 2001] Natter, H., Löffler, M.-S., Krill, C., and Hempelmann, R. (2001).
Crystallite growth of nanocrystalline transition metals studied in situ by high temperature synchrotron X-ray diffraction. Scripta Materialia, 44(8–9):2321 – 2325.
[Natter et al., 2000] Natter, H., Schmelzer, M., Löffler, M.-S., Krill, C. E., Fitch, A.,
and Hempelmann, R. (2000). Grain-Growth Kinetics of Nanocrystalline Iron Studied In Situ by Synchrotron Real-Time X-ray Diffraction. The Journal of Physical
Chemistry B, 104(11):2467–2476.
[Neck and Kim, 2001] Neck, V. and Kim, J. I. (2001). Solubility and hydrolysis of
tetravalent actinides. Radiochimica Acta, 89.
197
[Newville, 2001] Newville, M. (2001). IFFEFFIT: interactive XAFS analysis and FEFF
fitting. J. Synchrotron Radiat., 8:322–324.
[Nita et al., 2005] Nita, N., Schaeublin, R., Victoria, M., and Valiev, R. Z. (2005). Effects of irradiation on the microstructure and mechanical properties of nanostructured
materials. Philosophical Magazine, 85(4-7):723–735. Sp. Iss. SI.
[Nogita and Une, 1994] Nogita, K. and Une, K. (1994). Radiation-induced microstructural change in high burnup UO2 fuel pellets. Nuclear Instruments and Methods
in Physics Research Section B: Beam Interactions with Materials and Atoms, 91(14):301 – 306.
[Noirot et al., 2008] Noirot, J., Desgranges, L., and Lamontagne, J. (2008). Detailed
characterisations of high burn-up structures in oxide fuels. Journal of Nuclear Materials, 372(2–3):318–339.
[O’Loughlin et al., 2003] O’Loughlin, E. J., Kelly, S. D., Cook, R. E., Csencsits, R.,
and Kemner, K. M. (2003). Reduction of Uranium(VI) by Mixed Iron(II)/Iron(III)
Hydroxide (Green Rust): Formation of UO2 Nanoparticles. Environmental Science
& Technology, 37(4):721–727. PMID: 12636270.
[Olsen et al., 1999] Olsen, J. S., Gerward, L., and Jiang, J. Z. (1999). On the rutile/αPbO2 -type phase boundary of TiO2 . Journal of Physics and Chemistry of Solids,
60(2):229–233.
[Opel et al., 2007] Opel, K., Weiß, S., Hübener, S., Zänker, H., and Bernhard, G.
(2007). Study of the solubility of amorphous and crystalline uranium dioxide by
combined spectroscopic methods. Radiochimica Acta, 95(3):143–149.
[Packter, 1958] Packter, A. (1958). Precipitation from Supersaturated Solutions of
Insoluble and Sparingly Soluble Metal Salts. Part I. The Particle Size of Crystalline
Precipitates. The Journal of Physical Chemistry, 62(9):1025–1029.
[Palosz et al., 2004] Palosz, B., Stel’makh, S., Grzanka, E., Gierlotka, S., Pielaszek,
R., Bismayer, U., Werner, S., and Palosz, W. (2004). High pressure x-ray diffraction studies on nanocrystalline materials. Journal of Physics: Condensed Matter,
16(5):S353.
[Park and Qian, 2010] Park, H. S. and Qian, X. (2010). Surface-Stress-Driven Lattice
Contraction Effects on the Extinction Spectra of Ultrasmall Silver Nanowires. The
Journal of Physical Chemistry C, 114(19):8741–8748.
[Patzke et al., 2002] Patzke, G. R., Krumeich, F., and Nesper, R. (2002). Oxidic Nanotubes and Nanorods—Anisotropic Modules for a Future Nanotechnology. Angewandte Chemie International Edition, 41(14):2446–2461.
[Peng and Peng, 2001] Peng, Z. A. and Peng, X. (2001). Mechanisms of the Shape Evolution of CdSe Nanocrystals. Journal of the American Chemical Society, 123(7):1389–
1395.
[Piermarini et al., 1975] Piermarini, G. J., Block, S., Barnett, J. D., and Forman, R. A.
(1975). Calibration of the pressure dependence of the R1 ruby fluorescence line to
195 kbar. Journal of Applied Physics, 46(6):2774–2780.
198
[Pujol et al., 2004] Pujol, M. C., Idiri, M., Havela, L., Heathman, S., and Spino, J.
(2004). Bulk and Young’s modulus of doped UO2 by synchrotron diffraction under
high pressure and Knoop indentation. Journal of Nuclear Materials, 324(2-3):189 –
197.
[Qadri et al., 1996] Qadri, S. B., Yang, J., Ratna, B. R., Skelton, E. F., and Hu, J. Z.
(1996). Pressure induced structural transitions in nanometer size particles of pbs.
Applied Physics Letters, 69(15):2205–2207.
[Qi et al., 2002] Qi, W. H., Wang, M. P., and Su, Y. C. (2002). Size effect on the
lattice parameters of nanoparticles. Journal of Materials Science Letters, 21:877–
878. 10.1023/A:1015778729898.
[Qu et al., 2001] Qu, L., Peng, Z. A., and Peng, X. (2001). Alternative Routes toward
High Quality CdSe Nanocrystals. Nano Letters, 1(6):333–337.
[Raghavan et al., 1998] Raghavan, S., Wang, H., Dinwiddie, R. B., Porter, W. D., and
Mayo, M. J. (1998). The effect of grain size, porosity and yttria content on the thermal
conductivity of nanocrystalline zirconia. Scripta Materialia, 39(8):1119–1125.
[Rai et al., 2003] Rai, D., Yui, M., and Moore, D. A. (2003). Solubility and Solubility
Product at 22 °C of UO2 (c) Precipitated from Aqueous U(IV) Solutions. Journal of
Solution Chemistry, 32:1–17.
[Ravel and Newville, 2005] Ravel, B. and Newville, M. (2005). ATHENA, ARTEMIS,
HEPHAESTUS: data analysis for X-ray absorption spectroscopy using IFEFFIT. J.
Synchrotron Radiat., 12:537–541.
[Rehr et al., 1998] Rehr, J. J., Ankudinov, A., and Zabinsky, S. I. (1998). New developments in NEXAFS/EXAFS theory. Catalysis Today, 39(4):263–269.
[Rekhi et al., 2001] Rekhi, S., Saxena, S. K., and Lazor, P. (2001). High-pressure Raman study on nanocrystalline CeO2 . Journal of Applied Physics, 89(5):2968–2971.
[Rodríguez-Carvajal, 1993] Rodríguez-Carvajal, J. (1993). Recent advances in magnetic structure determination by neutron powder diffraction. Physica B: Condensed
Matter, 192(1–2):55–69.
[Ronchi et al., 1999] Ronchi, C., Heinz, W., Musella, M., Selfslag, R., and Sheindlin,
M. (1999). A Universal Laser-Pulse Apparatus for Thermophysical Measurements in
Refractory Materials at Very High Temperatures. International Journal of Thermophysics, 20(3):987–996.
[Ronchi and Hiernaut, 1996] Ronchi, C. and Hiernaut, J. P. (1996). Experimental measurement of pre-melting and melting of thorium dioxide. Journal of Alloys and Compounds, 240(1–2):179–185.
[Ronchi et al., 2004] Ronchi, C., Sheindlin, M., Staicu, D., and Kinoshita, M. (2004).
Effect of burn-up on the thermal conductivity of uranium dioxide up to 100.000
MWdt−1 . Journal of Nuclear Materials, 327(1):58 – 76.
[Rondinella and Wiss, 2010] Rondinella, V. V. and Wiss, T. (2010). The high burn-up
structure in nuclear fuel. Mater. Today, (13):24–32.
199
[Rothe et al., 2012] Rothe, J., Butorin, S., Dardenne, K., Denecke, M. A., Kienzler, B.,
Loble, M., Metz, V., Seibert, A., Steppert, M., Vitova, T., Walther, C., and Geckeis,
H. (2012). The INE-Beamline for actinide science at ANKA. Review of Scientific
Instruments, 83(4):043105.
[Rousseau et al., 2002] Rousseau, G., Fattahi, M., Grambow, B., Boucher, F., and Ouvrard, G. (2002). Coprecipitation of thorium with UO2 . Radiochimica Acta, 90(911_2002):523–527.
[Rousseau et al., 2006] Rousseau, G., Fattahi, M., Grambow, B., Boucher, F., and Ouvrard, G. (2006). Coprecipitation of thorium and lanthanum with UO2+x(s) as host
phase. Radiochimica Acta, 94(9-11):517–522.
[Rousseau et al., 2009] Rousseau, G., Fattahi, M., Grambow, B., Desgranges, L.,
Boucher, F., Ouvrard, G., Millot, N., and Nièpce, J. (2009). Synthesis and characterization of nanometric powders of UO2+x , (Th,U)O2+x and (La,U)O2+x . Journal
of Solid State Chemistry, 182(10):2591 – 2597.
[Rupp et al., 2006] Rupp, J. L. M., Infortuna, A., and Gauckler, L. J. (2006). Microstrain and self-limited grain growth in nanocrystalline ceria ceramics. Acta Materialia,
54(7):1721–1730.
[Ryan and Rai, 1983] Ryan, J. L. and Rai, D. (1983). The solubility of uranium(IV)
hydrous oxide in sodium hydroxide solutions under reducing conditions. Polyhedron,
2(9):947 – 952.
[Sabioni et al., 1998] Sabioni, A. C. S., Ferraz, W. B., and Millot, F. (1998). First study
of uranium self-diffusion in UO2 by SIMS. Journal of Nuclear Materials, 257(2):180–
184.
[Sailaja et al., 2002] Sailaja, B. B. V., Kebede, T., Raju, G. S., and Rao, M. S. P.
(2002). Thermal decomposition of ammonium dioxodiaquaperoxyoxalatouranate(VI)
hydrate. Thermochimica Acta, 386(1):51–57.
[Santa-Cruz, 2009] Santa-Cruz, H. (2009). Processing and Properties of Macroporous
Nanocrystalline Yttria-Stabilised Zirconia Ceramics. PhD thesis, UNIVERSITÄT
BREMEN.
[Sarig et al., 1978] Sarig, S., Eidelman, N., Glasner, A., and Epstein, J. A. (1978). The
effect of supersaturation on the crystal characteristics of potassium chloride. Journal
of Chemical Technology and Biotechnology, 28(10):663–667.
[Sasajima et al., 2010] Sasajima, H., Sugiyama, T., Chuto, T., Nagase, F., Nakamura,
T., and Fuketa, T. (2010). Identification of radial position of fission gas release in
high burn-up fuel pellets under RIA conditions. Journal of Nuclear Science and
Technology, 47(2):202 – 210.
[Sherwood, 2001] Sherwood, J. N. (2001). Influence of mechanical stress on the growth
of crystals. pages 9–17.
[Solliard and Flueli, 1985] Solliard, C. and Flueli, M. (1985). Surface stress and size
effect on the lattice parameter in small particles of gold and platinum. Surface
Science, 156, Part 1(0):487–494.
200
[Sonoda et al., 2002] Sonoda, T., Kinoshita, M., Ray, I., Wiss, T., Thiele, H., Pellottiero, D., Rondinella, V., and Matzke, H. (2002). Transmission electron microscopy
observation on irradiation-induced microstructural evolution in high burn-up UO2
disk fuel. Nuclear Instruments and Methods in Physics Research Section B: Beam
Interactions with Materials and Atoms, 191(1–4):622–628.
[Spanier et al., 2001] Spanier, J. E., Robinson, R. D., Zhang, F., Chan, S.-W., and
Herman, I. P. (2001). Size-dependent properties of CeO2−y nanoparticles as studied
by Raman scattering. Physical Review B, 64(24):245407.
[Spino et al., 2003] Spino, J., Cobos-Sabate, J., and Rousseau, F. (2003). Roomtemperature microindentation behaviour of LWR-fuels, part 1: fuel microhardness.
Journal of Nuclear Materials, 322(2-3):204 – 216.
[Spino et al., 2008] Spino, J., Cruz, H. S., Birtcher, R., Ferrero, C., Pierritz, R., and
Fernández, A. (Sept. 2008). Developments at ITU towards a high-performance, gasretentive and PCI-resistant nanocrystalline UO2 -fuel. In Workshop on Radiation
Stability of Complex Microstructures. Santa Fe, USA.
[Spino and Papaioannou, 2000] Spino, J. and Papaioannou, D. (2000). Lattice parameter changes associated with the rim-structure formation in high burn-up UO2 fuels
by micro X-ray diffraction. Journal of Nuclear Materials, 281(2-3):146 – 162.
[Spino and Papaioannou, 2008] Spino, J. and Papaioannou, D. (2008). Lattice contraction in the rim zone as controlled by recrystallization: Additional evidence. Journal
of Nuclear Materials, 372(2–3):416–420.
[Spino et al., 2004] Spino, J., Papaioannou, D., and Glatz, J.-P. (2004). Comments on
the threshold porosity for fission gas release in high burn-up fuels. Journal of Nuclear
Materials, 328(1):67 – 70.
[Spino et al., 2012] Spino, J., Santa-Cruz, H., Jovani-Abril, R., Birtcher, R., and Ferrero, C. (2012). Bulk-nanocrystalline oxide nuclear fuels - an innovative material
option for increasing fission gas retention, plasticity and radiation-tolerance. Journal
of Nuclear Materials, 422(1–3):27 – 44.
[Spino et al., 1996] Spino, J., Vennix, K., and Coquerelle, M. (1996). Detailed characterisation of the rim microstructure in PWR fuels in the burn-up range 40-67
GWd/tM. Journal of Nuclear Materials, 231(3):179 – 190.
[Staicu, 2007] Staicu, D. (2007). Thermal diffusivity of irradiated MATINA inert matrices (MgO, Al2 O3 and MgAl2 O4 ). Joint Research Centre, Institute for Transuranium
Elements, Materials Research Unit, JRC-ITU-TPW-2007/10.
[Stehle et al., 1975] Stehle, H., Assmann, H., and Wunderlich, F. (1975). Uranium
dioxide properties for LWR fuel rods. Nuclear Engineering and Design, 33(2):230–
260.
[Sui and Lu, 1995] Sui, M. L. and Lu, K. (1995). Thermal expansion behavior of
nanocrystalline Ni-P alloys of different grain sizes. Nanostructured Materials, 6(5–
8):651–654.
[Sun et al., 1999] Sun, C. Q., Sun, X. W., Gong, H. Q., Huang, H., Ye, H., Jin, D.,
and Hing, P. (1999). Frequency shift in the photoluminescence of nanometric SiOx :
surface bond contraction and oxidation. Journal of Physics: Condensed Matter,
11(48):L547.
201
[Suzuki et al., 2006] Suzuki, T., Abdelouas, A., Grambow, B., Mennecart, T., and
Blondiaux, G. (2006). Oxidation and dissolution rates of UO2 (s) in carbonate-rich
solutions under external alpha irradiation and initially reducing conditions. Radiochimica Acta, 94(9-11):567–573.
[Suzuki et al., 2002] Suzuki, Y., Kelly, S. D., Kemner, K. M., and Banfield, J. F. (2002).
Radionuclide contamination: Nanometre-size products of uranium bioreduction. Nature, 419(6903):134–134.
[Swam, 1997] Swam, L. F. P. V. (Nov. 1997). Nuclear fuel pellet. US Patent 5991354.
[The energy net, 2012] The energy net (2012).
The
http://www.energy-net.org/01NUKE/NUKE-14.HTM.
Nuclear
Fuel
Cycle.
[Tolbert and Alivisatos, 1995] Tolbert, S. H. and Alivisatos, A. P. (1995). HighPressure Structural Transformations in Semiconductor Nanocrystals. Annual Review
of Physical Chemistry, 46(1):595–626.
[Tolbert et al., 1996] Tolbert, S. H., Herhold, A. B., Brus, L. E., and Alivisatos, A. P.
(1996). Pressure-Induced Structural Transformations in Si Nanocrystals: Surface and
Shape Effects. Physical Review Letters, 76(23):4384–4387.
[Tulenko and Wang, 2008] Tulenko, J. S. and Wang, J. (2008). Improved nuclear fuel
pellet design to eliminate the rim effect. Societe Francaise d’Energie Nuclaire –
International Congress on Advances in Nuclear Power Plants – ICA PP 2007. "The
Nuclear Renaissance at work", 2:1004.
[U.S.NRC, 2012] U.S.NRC (2012).
United States Nuclear Regulatory Commission. Boiling Water Reactor (BWR).
http://www.nrc.gov/reading-rm/basicref/students/reactors.html.
[Vermaak and Kuhlmann-Wilsdorf, 1968] Vermaak, J. S. and Kuhlmann-Wilsdorf, D.
(1968). Measurement of the average surface stress of gold as a function of temperature in the temperature range 50-985.deg. The Journal of Physical Chemistry,
72(12):4150–4154.
[Villegas and Shaw, 2009] Villegas, J. and Shaw, L. (2009). Nanocrystallization process
and mechanism in a nickel alloy subjected to surface severe plastic deformation. Acta
Materialia, 57(19):5782 – 5795.
[Vinet et al., 1989] Vinet, P., Rose, J. H., Ferrante, J., and Smith, J. R. (1989). Universal features of the equation of state of solids. Journal of Physics: Condensed Matter,
1(11):1941.
[Wagner, 1992] Wagner, M. (1992). Structure and thermodynamic properties of
nanocrystalline metals. Physical Review B, 45(2):635–639.
[Wan et al., 2006a] Wan, J., Duan, R.-G., Gasch, M. J., and Mukherjee, A. K. (2006a).
Highly Creep-Resistant Silicon Nitride/Silicon Carbide Nano–Nano Composites.
Journal of the American Ceramic Society, 89(1):274–280.
[Wan et al., 2006b] Wan, J., Duan, R.-G., Gasch, M. J., and Mukherjee, A. K. (2006b).
Methods of processing Si3 N4 /SiC nano-nano composites from polymer precursor.
Materials Science and Engineering: A, 424(1–2):105–116.
202
[Wang et al., 2008] Wang, Q., Li, G.-D., Xu, S., Li, J.-X., and Chen, J.-S. (2008).
Synthesis of uranium oxide nanoparticles and their catalytic performance for benzyl
alcohol conversion to benzaldehyde. J. Mater. Chem., 18:1146–1152.
[Wang et al., 2007] Wang, Y., Mei, Z. X., Yuan, H. T., Du, X. L., Zou, J., Jia, J. F.,
Xue, Q. K., and Zhang, Z. (2007). Effect of MgO in ZnO films grown on nitrided
sapphires. Journal of Crystal Growth, 305(1):74–77.
[Wang et al., 2003] Wang, Z., Liu, Y., and Zhang, Z. (2003). Handbook of Nanophase
and Nanostructured Materials. Number p.59. Kluwer Academic.
[Wang et al., 2002] Wang, Z., Pischedda, V., Saxena, S. K., and Lazor, P. (2002). X-ray
diffraction and Raman spectroscopic study of nanocrystalline CuO under pressures.
Solid State Communications, 121(5):275–279.
[Wang et al., 2001] Wang, Z., Saxena, S. K., Pischedda, V., Liermann, H. P., and Zha,
C. S. (2001). In situ x-ray diffraction study of the pressure-induced phase transformation in nanocrystalline CeO2. Physical Review B, 64(1):012102–.
[Wasserman and Vermaak, 1972] Wasserman, H. J. and Vermaak, J. S. (1972). On
the determination of the surface stress of copper and platinum. Surface Science,
32(1):168–174.
[Watteau et al., 2001] Watteau, M., Estève, B., Güldner, R., and Hoffman., R. (2001).
Framatome ANP Extended Burnup Experience and Views on LWR Fuels. World
Nuclear Association, Annual Symposium.
[Wei et al., 2008] Wei, X., Xu, G., Ren, Z., Wang, Y., Shen, G., and Han, G. (2008).
Size-controlled synthesis of BaTiO3 nanocrystals via a hydrothermal route. Materials
Letters, 62(21–22):3666–3669.
[Wei et al., 2007] Wei, Z., Xia, T., Ma, J., Feng, W., Dai, J., Wang, Q., and Yan,
P. (2007). Investigation of the lattice expansion for ni nanoparticles. Materials
Characterization, 58(10):1019–1024.
[Willis et al., 2007] Willis, A. L., Chen, Z., He, J., Zhu, Y., Turro, N. J., and O’Brien,
S. (2007). Metal Acetylacetonates as General Precursors for the Synthesis of Early
Transition Metal Oxide Nanomaterials. Journal of Nanomaterials, 2007.
[Wu et al., 2008] Wu, D., Wu, X., Lv, Y., and Wang, H. (2008). Influence of solubility on the particle size of fluorides crystalline precipitated from aqueous solutions.
Materials Letters, 62(17–18):3003–3006.
[Wu, 2008] Wu, H. (2008). Inorganic Colloidal Nanocrystals: Synthesis and Bioapplications. PhD thesis, UNIVERSITY OF FLORIDA.
[Wu et al., 2006] Wu, H., Yang, Y., and Cao, Y. C. (2006). Synthesis of Colloidal Uranium‚àíDioxide Nanocrystals. Journal of the American Chemical Society,
128(51):16522–16523. PMID: 17177400.
[Wu et al., 2004] Wu, L., Wiesmann, H. J., Moodenbaugh, A. R., Klie, R. F., Zhu,
Y., Welch, D. O., and Suenaga, M. (2004). Oxidation state and lattice expansion of
CeO2−x nanoparticles as a function of particle size. Physical Review B, 69(12):125415.
203
[Yongvanich et al., 2010] Yongvanich, N., Visuttipitukkul, P., Leksuma, P.,
Vutcharaammat, V., and Sangwanpanit, P. (2010). Sinterability and microstructure
of bi-added sno2 nanomaterials Sinterability and Microstructure of Bi-Added SnO2
Nanomaterials by Precipitation Method. Journal of Metals, Materials and Minerals,
20(3):67–72.
[Young and Cutler, 1970] Young, W. S. and Cutler, I. B. (1970). Initial Sintering with
Constant Rates of Heating. Journal of the American Ceramic Society, 53(12):659–
663.
[Yu et al., 2007] Yu, S., Sun, C.-J., Chow, G.-M., and Koch, C. (2007). Chemical Synthesis of Nanostructured Particles and Films. Nanostructured Materials - Processing,
Properties, and Applications (2nd Edition), volume Part I - Chapter 1. William
Andrew Publishing.
[Zhang et al., 2007] Zhang, J., Zhao, Y., and Palosz, B. (2007). Comparative studies
of compressibility between nanocrystalline and bulk nickel. Applied Physics Letters,
90(4):043112.
[Zhang et al., 1999] Zhang, W., Bao, X., Guo, X., and Wang, X. (1999). A
high‚Äêresolution solid‚Äêstate NMR study on nano‚Äêstructured HZSM‚Äê5 zeolite. 60(1-2):89–94.
[Zhao et al., 2006] Zhao, S.-J., Albe, K., and Hahn, H. (2006). Grain size dependence
of the bulk modulus of nanocrystalline nickel. Scripta Materialia, 55(5):473–476.
[Zhao et al., 2001] Zhao, Y. H., Sheng, H. W., and Lu, K. (2001). Microstructure
evolution and thermal properties in nanocrystalline Fe during mechanical attrition.
Acta Materialia, 49(2):365–375.
[Zhong et al., 2005] Zhong, L., Liu, C., Zachara, J. M., Kennedy, D. W., Szecsody,
J. E., and Wood, B. (2005). Oxidative Remobilization of Biogenic Uranium(IV)
Precipitates: effects of iron (II) and pH. J. Environ. Qual., 34:1763 – 1771.
[Zumstein and Rousseau, 1989] Zumstein, R. C. and Rousseau, R. W. (1989). Agglomeration of copper sulfate pentahydrate crystals within well-mixed crystallizers.
Chemical Engineering Science, 44(10):2149–2155.
[Zvoriste-Walters et al., 2013] Zvoriste-Walters, C. E., Heathman, S., Jovani-Abril, R.,
Spino, J. L., Janssen, A., and Caciuffo, R. (2013). Crystal size effect on the compressibility of nano-crystalline uranium dioxide. Journal of Nuclear Materials, 435(1–
3):123–127.
204


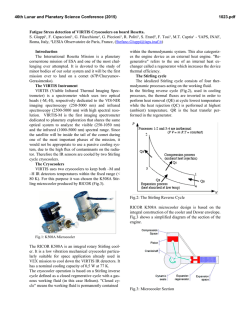
© Copyright 2026