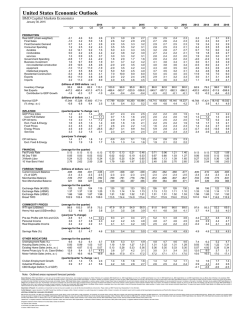
Canadian Economic Outlook
Canadian Economic Outlook
BMO Capital Markets Economics
January 30, 2015
Q1
PRODUCTION
Real GDP (chain-weighted)
Final Sales
Final Domestic Demand
Consumer Spending
Durables
Non-Durables
Services
Government Spending
Business Investment
Non-Residential Construction
Machinery and Equipment
Residential Construction
Exports
Imports
Q2
Q3
2014
Q4
Q1
Q2
2015
Q4
Q3
Q1
Q2
Q3
2016
Q4
2013
2014
2015
2016
(quarter/quarter % change : a.r.)
1.0
3.6
2.8
2.0
2.0
5.8
3.6
0.7
0.1
3.3
2.8
2.0
1.5
4.4
2.8
2.7
1.6
14.9
12.6
3.0
4.0
-0.5
-0.7
2.5
1.3
3.5
2.1
2.6
-0.7
1.4
0.3
1.0
-1.9
0.8
0.5
1.7
-0.3
0.5
-1.9
1.0
-5.0
1.4
5.2
3.0
-4.2
11.4
12.5
0.0
0.9
19.0
6.9
-4.0
-4.8
9.8
4.0
0.0
1.1
0.9
-0.7
2.7
2.0
2.8
2.7
0.0
-19.3
-20.0
-18.0
1.0
2.7
-2.5
1.8
1.7
0.3
2.5
1.0
2.7
2.7
0.2
-10.7
-11.0
-10.0
1.0
4.4
0.0
2.0
2.2
1.3
2.3
1.5
2.5
2.3
0.7
-1.3
-1.8
-0.5
0.5
5.0
1.9
2.2
2.3
1.6
2.3
2.0
2.3
2.4
1.1
0.4
0.0
1.0
0.0
5.3
3.1
2.3
2.3
1.9
2.2
2.0
2.3
2.2
1.1
3.2
3.0
3.5
0.0
5.1
3.5
2.3
2.4
2.1
2.1
1.5
2.2
2.1
1.5
5.3
5.5
5.0
-0.5
4.6
3.6
2.0
2.0
2.0
1.9
1.7
1.9
2.0
1.3
5.7
6.0
5.0
-1.0
4.4
4.1
2.1
2.1
2.1
2.0
1.5
2.0
2.1
1.5
6.2
6.5
5.5
-1.0
4.1
3.9
2.0
1.8
1.5
2.5
3.8
2.3
2.3
0.1
2.6
5.0
-1.7
-0.4
2.0
1.3
2.4
2.8
1.6
2.8
5.7
2.7
2.1
-0.1
-0.4
-0.1
-1.1
2.5
5.1
1.5
2.0
1.9
1.1
2.7
4.0
2.0
2.6
0.5
-6.9
-7.7
-5.5
2.7
3.6
0.9
2.2
2.2
1.7
2.2
1.7
2.3
2.2
1.1
2.0
1.9
2.2
-0.2
4.8
3.1
(billions of chained 2007 dollars : a.r.)
13.3
4.8
0.6
6.4
-0.9
-2.0
-1.0
1.3
-29.6
-19.3
-15.6
-21.4
1.8
2.8
0.9
-1.3
7.2
0.2
-14.2
1.6
7.9
0.1
-8.1
1.3
7.1
-0.2
-3.8
0.9
6.7
-0.1
-0.8
0.6
6.4
-0.1
1.3
0.4
6.1
-0.1
2.8
0.2
6.1
0.0
3.2
0.0
6.2
0.0
3.6
0.0
12.4
0.2
-39.6
0.2
6.3
-0.4
-21.5
1.1
7.2
0.1
-6.7
0.8
6.2
-0.1
2.7
0.5
Nominal GDP
(% chng : a.r.)
(billions of dollars : a.r.)
1,950
1,969
1,992
6.7
3.9
4.7
1,972
-3.8
1,980
1.6
2,001
4.4
2,024
4.6
2,048
4.8
2,073
5.0
2,099
5.1
2,126
5.3
1,894
3.4
1,976
4.3
1,994
1.0
2,087
4.6
INFLATION
GDP Price Index
CPI All Items
Excl. Food & Energy
Food Prices
Energy Prices
Services
(quarter/quarter % change : a.r.)
5.5
0.4
1.8
-2.0
2.8
3.7
1.3
0.1
2.4
2.3
2.1
1.2
2.2
5.5
1.5
3.9
11.2
11.2
-5.8
-17.5
1.6
3.6
3.3
0.2
-4.8
-1.9
1.5
2.8
-35.0
0.9
-0.2
1.8
1.8
1.6
1.9
2.1
2.4
2.2
2.1
2.2
3.0
2.0
2.4
2.3
2.0
2.6
4.4
2.1
2.5
2.1
2.0
1.7
4.4
2.1
2.6
1.9
1.6
2.1
5.0
2.3
3.0
2.2
2.0
1.9
5.2
2.0
3.1
2.4
2.4
2.1
3.4
2.2
1.4
0.9
0.9
1.2
1.5
1.4
1.9
1.9
1.6
2.3
3.5
2.1
-1.0
0.7
1.8
2.7
-12.6
1.7
2.4
2.1
1.9
2.1
4.2
2.1
CPI All Items
BoC Core
(year/year % change)
1.4
2.2
2.1
1.3
1.7
2.0
1.9
2.2
0.8
2.1
0.3
1.9
0.5
1.9
1.1
2.1
2.1
2.1
2.1
2.0
2.1
2.0
2.2
2.0
1.2
1.8
2.0
2.0
FINANCIAL
Overnight Rate
3-Month T-Bill
90-Day BAs
10 Year Bond Yield
(average for the quarter : %)
1.00
1.00
1.00
0.87
0.93
0.94
1.26
1.27
1.28
2.47
2.35
2.14
1.00
0.90
1.28
1.95
0.67
0.60
1.00
1.42
0.50
0.41
0.81
1.42
0.50
0.41
0.81
1.58
0.50
0.41
0.81
1.82
0.75
0.67
1.06
1.99
1.00
0.93
1.31
2.13
1.25
1.18
1.55
2.27
1.50
1.44
1.80
2.40
1.00
0.97
1.20
2.26
1.00
0.91
1.27
2.23
0.55
0.46
0.86
1.56
1.15
1.06
1.43
2.20
91
-36
87
-33
58
-37
39
-39
31
-39
8
-40
10
-41
13
-42
15
-43
18
-45
91
-9
88
-31
34
-39
14
-43
FOREIGN TRADE
Current Account Balance
(% of GDP)
Merchandise Balance
Non-Merchandise Balance
(billions of dollars : a.r.)
-45.0
-39.6
-33.6
-2.3
-2.0
-1.7
6.3
9.3
11.6
-51.4
-48.9
-45.2
-52.7
-2.6
-10.2
-42.4
-73.7
-3.7
-33.4
-40.3
-76.2
-3.8
-37.1
-39.1
-67.7
-3.4
-29.1
-38.6
-62.5
-3.1
-24.7
-37.8
-58.0
-2.8
-21.3
-36.7
-54.1
-2.6
-18.3
-35.8
-49.9
-2.4
-14.8
-35.1
-45.9
-2.2
-11.7
-34.2
-56.3
-3.0
-7.2
-49.0
-42.7
-2.2
4.2
-47.0
-70.0
-3.5
-31.1
-38.9
-52.0
-2.5
-16.5
-35.4
Exchange Rate (US¢/C$)
Exchange Rate (C$/US$)
Exchange Rate (¥/C$)
Exchange Rate (C$/Euro)
(average for the quarter)
90.6
91.7
91.8
1.103
1.090
1.089
93.1
93.6
95.5
1.51
1.50
1.44
88.1
1.135
100.8
1.42
81.6
1.226
98.1
1.39
78.9
1.267
96.0
1.45
78.7
1.271
96.8
1.45
79.5
1.257
99.1
1.42
80.5
1.242
101.3
1.40
81.4
1.229
103.4
1.37
82.2
1.217
105.5
1.35
83.0
1.204
107.6
1.33
97.1
1.030
94.7
1.37
90.6
1.105
95.8
1.47
79.7
1.255
97.5
1.43
81.8
1.223
104.5
1.36
INCOMES
Corporate Profits Before Tax
Corporate Profits After Tax
Personal Income
Real Disposable Income
(year/year % change)
11.0
19.4
3.0
9.5
3.3
3.6
1.8
1.5
0.3
-0.1
3.1
1.3
-20.0
-11.4
1.7
0.2
-23.6
-15.5
1.5
0.6
-23.6
-17.0
2.1
1.0
-16.1
-10.7
2.9
1.4
1.7
1.1
4.5
2.5
7.7
4.2
5.1
3.0
9.4
5.2
4.7
2.4
11.0
6.2
4.8
2.3
0.7
7.3
3.7
2.5
10.0
5.0
3.4
1.6
-20.9
-13.7
2.1
0.8
7.4
4.2
4.8
2.6
Savings Rate
(average for the quarter : %)
5.0
3.9
3.9
3.5
2.3
1.9
2.4
2.4
2.5
2.6
2.7
2.7
5.2
4.1
2.3
2.6
OTHER INDICATORS
Unemployment Rate (%)
Housing Starts (000s, a.r.)
Existing Home Sales (y/y % ch)
MLS Home Price Index (y/y % ch)
Motor Vehicle Sales (mlns, a.r.)
(quarter average)
7.0
7.0
176
196
1.9
6.3
5.0
5.1
1.74
1.85
6.7
185
6.2
5.4
1.96
6.7
184
0.5
3.4
1.93
6.7
177
-5.3
1.9
1.89
6.7
178
-4.6
2.1
1.88
6.6
183
-4.2
0.7
1.87
6.5
178
2.8
0.9
1.85
6.5
179
1.5
0.4
1.86
6.4
181
-2.6
-0.6
1.85
6.4
183
-1.5
-0.6
1.84
7.1
188
0.7
2.7
1.77
6.9
189
5.1
5.2
1.89
6.7
180
-3.5
2.0
1.89
6.4
180
0.0
0.0
1.85
(quarter/quarter % change : a.r.)
Employment Growth
0.6
-0.0
0.7
1.6
Industrial Production
5.3
4.7
0.8
1.6
Federal Budget Balance (% of FY GDP)
-0.0
-2.2
0.4
-0.6
0.9
1.3
1.0
1.3
1.4
3.2
1.0
3.8
1.0
3.3
0.9
3.0
1.4
1.8
-0.3
0.6
3.7
-0.1
0.6
0.3
0.3
1.0
2.5
0.4
Inventory Change
Contribution to GDP Growth
Net Exports
Contribution to GDP Growth
Canada/US spread: (bps)
90 day
10 year
82
-30
90
-27
10.4
7.8
3.8
2.0
7.0
199
6.0
5.3
1.99
1,991
-0.1
Note: Outlined areas represent forecast periods
General Disclosure: “BMO Capital Markets” is a trade name used by the BMO Investment Banking Group, which includes the wholesale arm of Bank of Montreal and its subsidiaries BMO Nesbitt Burns Inc., BMO Capital Markets Ltd. in the U.K. and BMO Capital Markets Corp. in the U.S. BMO Nesbitt Burns Inc., BMO Capital Markets Ltd. and BMO Capital Markets Corp are affiliates. Bank of Montreal or its subsidiaries (“BMO Financial
Group”) has lending arrangements with, or provide other remunerated services to, many issuers covered by BMO Capital Markets. The opinions, estimates and projections contained in this report are those of BMO Capital Markets as of the date of this report and are subject to change without notice. BMO Capital Markets endeavours to ensure that the contents have been compiled or derived from sources that we believe are reliable and
contain information and opinions that are accurate and complete. However, BMO Capital Markets makes no representation or warranty, express or implied, in respect thereof, takes no responsibility for any errors and omissions contained herein and accepts no liability whatsoever for any loss arising from any use of, or reliance on, this report or its contents. Information may be available to BMO Capital Markets or its affiliates that is not
reflected in this report. The information in this report is not intended to be used as the primary basis of investment decisions, and because of individual client objectives, should not be construed as advice designed to meet the particular investment needs of any investor. This material is for information purposes only and is not an offer to sell or the solicitation of an offer to buy any security. BMO Capital Markets or its affiliates will buy from or
sell to customers the securities of issuers mentioned in this report on a principal basis. BMO Capital Markets or its affiliates, officers, directors or employees have a long or short position in many of the securities discussed herein, related securities or in options, futures or other derivative instruments based thereon. The reader should assume that BMO Capital Markets or its affiliates may have a conflict of interest and should not rely solely
on this report in evaluating whether or not to buy or sell securities of issuers discussed herein.
Dissemination of Research: Our publications are disseminated via email and may also be available via our web site http://www.bmonesbittburns.com/economics. Please contact your BMO Financial Group Representative for more information.
Conflict Statement: A general description of how BMO Financial Group identifies and manages conflicts of interest is contained in our public facing policy for managing conflicts of interest in connection with investment research which is available at http://researchglobal.bmocapitalmarkets.com/Public/Conflict_Statement_Public.aspx.
ADDITIONAL INFORMATION IS AVAILABLE UPON REQUEST
BMO Financial Group (NYSE, TSX: BMO) is an integrated financial services provider offering a range of retail banking, wealth management, and investment and corporate banking products. BMO serves Canadian retail clients through BMO Bank of Montreal and BMO Nesbitt Burns. In the United States, personal and commercial banking clients are served by BMO Harris Bank N.A., Member FDIC. Investment and corporate banking
services are provided in Canada and the US through BMO Capital Markets. BMO Capital Markets is a trade name used by BMO Financial Group for the wholesale banking businesses of Bank of Montreal, BMO Harris Bank N.A, BMO Ireland Plc, and Bank of Montreal (China) Co. Ltd. and the institutional broker dealer businesses of BMO Capital Markets Corp. (Member SIPC), BMO Nesbitt Burns Securities Limited (Member SIPC) and
BMO Capital Markets GKST Inc. (Member SIPC) in the U.S., BMO Nesbitt Burns Inc. (Member Canadian Investor Protection Fund) in Canada, Europe and Asia, BMO Capital Markets Limited in Europe, Asia and Australia and BMO Advisors Private Limited in India.
“Nesbitt Burns” is a registered trademark of BMO Nesbitt Burns Corporation Limited, used under license. “BMO Capital Markets” is a trademark of Bank of Montreal, used under license. "BMO (M-Bar roundel symbol)" is a registered trademark of Bank of Montreal, used under license.
® Registered trademark of Bank of Montreal in the United States, Canada and elsewhere.
TM Trademark Bank of Montreal
© COPYRIGHT 2015 BMO CAPITAL MARKETS CORP.
A member of BMO Financial Group
© Copyright 2026
