
Download Part-2 - India Energy Congress 2015
24 x 7 : Power for All
81
Executive Summary Transforming distribution
Viability, affordability and reliability of power
distribution
• T he power sector in the country has witnessed
unprecedented growth in generation capacity
additions, T&D Network expansion and increase in
access to electricity leading to a substantive growth
in the per capita consumption of electricity in the
country. However with this growth the performance
of the distribution segment has remained lacklustre.
The financial losses of the distribution utilities have
been mounting at an alarming pace.
• The aggregate loss of all distribution utilities of the
country put together had already crossed Rs.90,000
crores by the end of FY12 and as per a World Bank
study, is expected to touch Rs.1.25 lakh crore by
the end of FY17, even after assuming a tariff hike
of 6% annually. The main reason for the losses
is the growing gap between the average cost of
supply and the average tariff which was 37 paise
per unit in FY06, and had reached 108 paise per
unit by FY12. Such huge losses lying in the books
of accounts of the distribution utilities are making
it extremely difficult for them to secure funding for
their intended investments, further impeding any
improvements.
• Most utilities (except those in Gujarat and Kerala)
are making heavy cash losses and thus cannot be
expected to make significant investments on their
own. Hence to bridge the investment gap, the
Central government would have to step in and
provide the necessary investments in the sector in
the immediate to medium term. Considering the
focus of the current government dispensation, a
substantial part of these investments are likely to be
in improving rural access.
• While investments in distribution infrastructure are
necessary to ensure viability in the long run and
improve affordability and reliability, other policy level
initiatives like promoting investments in demand
side management activities through tax benefits,
efficient lighting technologies like LED, adopting
smart grid initiatives, promoting green technologies,
separation of wires and retail supply businesses,
ramping up capacity addition, securing fuel supply
for generators, promoting rural franchisees at
local levels etc. would go a long way in increasing
competition and improving the performance of the
distribution segment.
82
Power to all: expanding access to electricity
espite electrifying close to 2 crore households
• D
under RGGVY, a large population is still without
power. In case of several states which have
achieved significant level of village electrification,
when it comes to household electrification,
their performance is dismal. Hence, monitoring
electrification at the village level has become rather
irrelevant in furthering the increase in access to
electricity at the household level.
• A comparison of electricity access suggest that India
is decades behind the developed countries in terms
of electricity access and consequently per capita
consumption. According to an IEA report, India
accounts for close to 25% of the world population
without access to electricity. With a per capita
consumption of approximately 900 units per annum,
India lags behind 120 countries on this parameter.
• Such poor electricity access is not only a hindrance
in the development of the rural economy it also
hampers the planned development of human
capital, thus adversely impacting the economic
development of the entire nation in the long run.
Thus, in order to improve access to electricity,
several steps need to be taken at the earliest, a few
of which are as below:
-Expanding the definition of electrification to
include greater number of electrified households
per village;
-Monitoring of electrification scheme at
household level and not at village level;
-Ensuring minimum number of supply hours in
electrified villages, failing which the purpose of
the electrification program would be defeated;
-Promoting Decentralized Distributed Generation
projects for far flung and remote villages and
ensuring self-sustainability of such projects;
-Efficient subsidy targeting through direct
transfers or other means need to be explored
as the current mode of tariff subsidies are
distorting consumption patterns.
Introducing retail competition: separation of
wheeling and retail supply
• T he Electricity Act, 2003 had provided for
introducing retail competition through introduction
of Open Access and parallel licensing in the country.
But the actual impact of both these provisions
has been limited or rather inconsequential. While
Parallel licensing, that allows for competition among
distribution licensees has remained confined to
small pockets with only three parallel licensees being
operational in the entire country today namely
in Mumbai (R-Infra and Tata Power), Jamshedpur
(JBVNL and JUSCO) and Greater Noida (PVVNL and
NPCL), open access has failed due to several reasons
like infrastructural constraints, regulatory issues like
delays in notification of wheeling and cross subsidy
surcharge, power deficit, non-tariff barriers such as
delays in evaluation and approval of open access
applications by the distribution licensees etc.
• Since the above steps have not been able to bring
about competition at the retail level, and the
wholesale competitive market in the country is in
place and functional the next logical step would
be to work towards segregation of the retail and
wires businesses. However a few legal challenges
need to be addressed before retail competition
can be ushered in. As per the opinion of the
Solicitor General of India, the Electricity Act 2003
has assigned the dual role of network operator
and of supplier to the distribution licensee and
hence the two cannot be separated without an
appropriate amendment to the Electricity Act, 2003.
Hence unless the Electricity Act is comprehensively
amended, retail competition would not be legally
tenable. In addition to the legal challenges, several
practical issues also need to be worked out before
introduction of retail competition in the country. A
few of the challenges are as below:
-A mechanism needs to be developed for
allocation of existing PPAs to the incumbent
licenses and also on how the same would be
re-allocated to any new entrants in future;
-)As per the current financing practices,
generating companies must have a FSA (Fuel
Supply Agreement) in place and for signing
the FSA, the coal companies essentially require
a long term Power Purchase Agreement. The
proposed amendments in the Electricity Act
mandates competitive bidding as the only
option for future power procurement by
the distribution licensees. Therefore in the
absence of PPAs, suitable mechanism needs to
be evolved for providing fuel linkages to the
generating companies.
-Cost reflective tariffs are a must for financial
viability of the utilities. The tariff setting
mechanism should therefore be linked to cost to
serve principle.
-Prior to segregation of wires and retail business,
the State Government must address the
mechanism to allocate the huge accumulated
losses of the distribution utilities to the
successor retail and wires operators.
PPP in Distribution
• The advent of private sector efficiencies in the
power distribution business, especially in the
form of distribution franchisees in the recent
past, has yielded substantial benefits to utilities
in achieving rapid loss reduction. This has also
improved customer service levels. The entire model
has therefore been of immense relevance to the
distribution utilities struggling with operational
and financial difficulties, given their present level
of performance. While franchisee models has
demonstrated its relevance, presently there are three
modes of securing private participation as below:
- Privatization (Delhi and Orissa experience)
-Distribution franchisee (Bhiwandi, Gaya,
Bhagalpur, Jalgaon, Agra, Ujjain, Gwalior etc.)
-PPP model of the Planning commission (yet to
be adopted)
• Most state distribution utilities across the country
are facing a multitude of problems like high loss
levels, ageing and shrinking workforce, inadequate
investments, lack of focus on IT, ever increasing
gap in consumer expectations and delivery etc.
Although privatization was sought to address most
of the above issues, the immense socio-political
opposition and employee sensitivities make it
difficult to implement. The private participation
models adopted in Orissa and New Delhi have
their own respective merits and demerits, however
given the above sensitivities, such modes of private
participation have not been replicated elsewhere in
the country.
• These bottlenecks in pursuing privatization, in a way,
forced the utilities to explore less sensitive options
for inviting private participation. The breakthrough
came with the Bhiwandi franchisee by MSEDCL
being successfully implemented. The franchisee
initiative was perceived as politically neutral, though
it did face some degree of opposition from the
employees. The policy and regulatory framework
of the country also allows the distribution licensees
to appoint franchisees in their areas of operation to
83
•
•
•
•
84
bring in efficiencies. The franchisee model allows
private players to bring in investments while the
ownership of the venture rests completely with the
licensee, obviating any political concerns.
Several franchisee models like input based
franchisee, collection based revenue franchisee,
O&M Franchisee, Rural – Electric Co-operative
Franchisee, Distributed Generation Based Franchisee
etc. have been experimented with across the
country and several have also been very successful in
addressing the requirements of the licensee. Among
the above models, however, the one that has
increasingly been adopted by different states is the
urban input based franchisee model. Agra-Kanpur
in UP, Nagpur-Aurangabad-Jalgaon in Maharashtra,
Gaya-Muzaffarpur-Bhagalpur in Bihar, UjjainGwalior-Sagar in MP have already been awarded to
successful bidders based on the above model.
Earlier it was perceived that areas having high
energy input and high AT&C losses (and as a
consequence high quantum of energy lost) would
be more attractive to potential bidders. However,
through various franchising experiences it has
emerged that the attractiveness of franchisee areas
is not determined by the potential of financial gains
alone but also by how the risks associated with the
venture are mitigated by the licensee in the RFPs.
The distribution business works in a business
environment where a large number of retail/small
consumers have to be serviced. This attribute of
dealing with a large number of retail consumers
not only imposes operational challenges but also
exposes the distribution utilities to direct socioeconomic and political risks. The licensees need
to partner with the franchisee and share risks
equitability to ensure success if the venture.
Another model which is being deliberated and
claims to mitigate several regulator risks associated
with the franchisee model is the PPP model of
the Planning Commission. Under this model a
concessionaire is selected through competitive
bidding and is required to obtain a distribution
license. Post securing the license, the concessionaire
is regarded as the incumbent licensee of the area,
thus allowing the private party to make investments
and secure regulated returns. It also allows the
concessionaire to secure power form its own
sources for supply to its area. All other aspects
of this model remain similar to the DF model
for all practical purposes. However both these
models face some challenges / issues which need
to be deliberated from case to case basis and a
suitable model adopted based on the immediate
requirements. A few of the associated challenges
with the models are as below:
-Quality of baseline data: Since bidders base their
bids on key parameters like average realization,
revenue, total sales etc., any doubt on the
accuracy of these figures has the potential of
jeopardizing the entire bid process with the
parties entering into unnecessary litigation.
-Employee and customer sensitivities: Adequately
addressing employee sensitivities in franchising/
PPP initiatives has continued to prove difficult.
-Regulatory approach to DF: Lack of clarity
on regulatory treatment of investments by
franchisee is a grey area which has not yet been
clarified by any state regulator.
-Smaller number of players: The number of
credible private players interested in the sector
is limited and several have already taken up
franchisee areas in different states leaving
very few for future initiatives. This is also a
bottleneck in increasing private participation.
-Standardization of bid documents: Though bid
documents have been standardized for input
based urban franchisee, the same may be done
for rural/mix franchisee initiatives, which are
increasingly being adopted by utilities for smaller
areas.
-Treatment of subsidy: In any franchisee area,
a large number of consumers belong to the
subsidized categories. Considering that most
franchises have been awarded for periods
upward of 10 years, the subsidy regime can
change over such long periods. A uniform
approach on the treatment of subsidies would
thus help the potential bidders hedge their risks
in a balanced manner.
Transforming distribution
Year / Period
2002
2013
% Change
Installed
Capacity
(MW)
105046
223344
113%
Generation
Pvt. Share
(MW & Ratio)
10,000
(10%)
78515.3
(33%)
685%
T&D Lines
Ckt. KMs.
60,30,148
89,70,112
49%
Per Capita
Consumption
559.2
917.2
64%
Villages
Electrified
82%
95%
17%
Electrified
HHs (Millions)
107
166
55%
Figure 1: Aggregate Losses of Utilities (Rs. '000 Cr.)
FY05
FY06
FY07
FY08
-15
• T he post Electricity Act, 2003 era in the Indian
power sector has witnessed the much needed
impetus to its growth and development. Evolution
of the industry structure and the process for
regulatory oversight has been instrumental in
changing the sector outlook and attracting private
sector investments. Some of the major indices
provided in the table below depict the key highlights
of path traversed by the sector during the post
Electricity Act period.
• P ost unbundling, the generation and transmission
functions have witnessed revitalized enthusiasm
with the flow of government as well as private
investments. Performance of generation and
transmission companies across most states has
registered commendable improvements. The
distribution leg has however failed to draw the
necessary attention. Very few states have made
distribution specific investments, and the majority
of investment has come from Union government
funded schemes like RGGVY, APDRP (now RAPDRP),
FRP etc. The distribution utilities in most states are
in such dire circumstances that they are unable to
cover even their operating expenses, let alone fund
additional investments.
• The financial losses of the distribution utilities have
been mounting at an alarming pace. As the graphs
below depict, the aggregate loss of all distribution
utilities of the country put together had already
crossed Rs.90,000 crores by the end of FY12 and
as per a World Bank study , is expected to touch
Rs.1.25 lakh crore by the end of FY17, even after
assuming a tariff hike of 6% annually.
-14
Viability, affordability and reliability of power
distribution
FY09
FY10
FY11
FY12
0.0
-54
-90.0
-67
-80.0
-74.3
-70.0
-64.5
-53.7
-60.0
-45
-38
-50.0
-32.9
-40.0
-27.2
-20.3
-12
-24.0
INR '000 Crores
-30.0
Loss (subsidy-received)
-92.8
-100.0
Loss (without subsidy)
Source: PFC Utilities reports
Figure 2: Cost of Supply (CoS) Vs. Realization (Paise/ Unit)
500
94
400
77
100
87
54
60
37
293
239
340
263
355
268
397
303
439
331
40
FY06
FY07
FY08
FY09
FY10
FY11
FY12
0
Paise/ Unit
49
276
227
100
120
80
300
200
108
258
221
Paise/ Unit
• It is evident that the sector has witnessed
unprecedented growth in generation capacity
additions, T&D Network expansion and increase in
access to electricity leading to a substantive growth in
the per capita consumption of electricity in the country.
There has also been an unprecedented growth in
the extent of private sector participation in the sector
through IPPs in generation, IPTCs in transmission and
to a limited extent through distribution franchisees
in the distribution segment. It can thus be said that
the aim of unbundling viz. to bring about functional
segregation within the sector ultimately leading
to identification of loss making functions and thus
bringing about targeted interventions, has been
achieved to some extent atleast in the generation
and transmission space. But, while the reforms have
brought the distribution function into sharp focus for
its continued poor performance, it cannot be said that
objectives of the Electricity Act have been achieved in
the distribution space.
-20.0
-9
-10.0
20
0
CoS (LHS)
Source: PFC utilities report
Realization (LHS)
Gap (RHS)
85
Andhra Pradesh
Arunachal Pradesh
Assam
Bihar
Chhattisgarh
Delhi
Goa
Gujarat
Haryana
Himachal Pradesh
Jammu & Kashmir
Jharkhand
Karnataka
Kerala
Madhya Pradesh
Maharashtra
Manipur
Meghalaya
Mizoram
Nagaland
Orissa
Punjab
Rajasthan
Tamil Nadu
Tripura
Uttar Pradesh
Uttarakhand
West Bengal
National Level AT&C losses
0.00
-5.00
-10.00
-15.00
-20.00
Source: PFC utilities report
owever, the inefficiency of the distribution utilities
• H
on one hand and the reluctance of regulators to
provide reasonable and regular tariff hikes on the
other, has led to tariffs not keeping pace with
costs. The continued high levels of AT&C losses in
the country (refer graph alongside) are reflective of
the inability of the utilities to improve operational
performance. At the same time, the mounting
regulatory assets, estimated to be close to Rs.70,000
crores ending FY13 reflect the indifference of the
state regulators to the financial crunch being faced
by the distribution utilities.
• Such huge losses lying in the books of accounts
of the distribution utilities are making it extremely
difficult for them to secure funding for their
intended investments, lack of which again impacts
their performance, pushing them into a downward
spiral of deteriorating performance. Unless steps
are immediately taken to address these concerns,
the viability of the distribution utilities, and as a
86
consequence, of the entire sector would remain
doubtful.
• Lately, it has also been felt that the sustained poor
performance of the distribution utilities is due to
continuing State monopoly in power distribution.
Private participation remains limited to either legacy
utilities or to a limited extent, through franchisees of
the existing distribution licensees. The distribution
utilities being wholly owned companies of the
respective State Governments, do not have to
worry about survival even in case of sub-optimal
performance, unlike private utilities where
operational efficiency and financial prudence is an
imperative for continued existence.
• The monopolistic nature of the segment does
not adequately penalize the government
distribution utilities for below par performance,
thereby perpetuating it to some extent. It is to be
understood that the final burden of such below
par performance is being borne by the end users of
electricity owing to the structure of the regulatory
regime of the country. Hence, on one hand the
consumers are getting a short shrift on services,
and on the other they are also expected to bear the
consequences.
• Further, as already stated, the distribution utilities
continue to work with a poor network infrastructure
owing to investment deficits. Most utilities
themselves are making heavy cash losses (Refer
graph below – except Gujarat and Kerala, all other
state utilities registered operating losses in FY12)
and thus cannot be expected to make significant
investments on their own.
Figure 3: Operating losses of distribution utilities of states (in Rs. ‘000 Crores) in
FY12
Andhra Pradesh
Arunachal Pradesh
Assam
Bihar
Chhattisgarh
Delhi
Goa
Gujarat
Haryana
Himachal Pradesh
Jammu & Kashmir
Jharkhand
Karnataka
Kerala
Madhya Pradesh
Maharashtra
Manipur
Meghalaya
Mizoram
Nagaland
Orissa
Punjab
Rajasthan
Tamil Nadu
Tripura
Uttar Pradesh
Uttarakhand
West Bengal
• T he main reason for the losses is the growing gap
between the average cost of supply and the average
tariff. While it was 37 paise per unit in FY06, it had
reached unsustainable proportions at 108 paise
per unit by FY12. Several factors have contributed
to this increase in the gap. Rising costs owing to
costlier fuel, higher wages and a general inflationary
increase in all other expenses has added up to
significant increase in the average cost of supply.
The regulatory regime of the country aims to offer
regulated tariffs to recover such increases in cost.
0.00
-5.00
-10.00
-15.00
-20.00
Source: PFC utilities report
losses directly impact the affordability of the power
for all categories of consumers. In case of the
subsidized consumer categories, this is reflected in
the rising subsidy burden on the state exchequer
(graph below), while in case of the subsidizing
categories the rising cost of power impacts their
competitiveness
900
800
700
600
500
400
300
200
100
0
AP
Arunachal Pradesh
Assam
Bihar
Chhattisgarh
Delhi
Goa
Gujarat
Haryana
Himachal Pradesh
Jammu & Kashmir
Jharkhand
Karnataka
Kerala
Madhya Pradesh
Maharashtra
Manipur
Meghalaya
Mizoram
Nagaland
Orissa
Punjab
Rajasthan
Sikkim
Tamil Nadu
Tripura
Uttar Pradesh
Uttarakhand
West Bengal
Debtor days by each state
Source: PFC utilities report
6.00
Subsidy per unit of input energy
5.00
4.00
3.00
2.00
1.00
0.00
AP
Arunachal…
Assam
Bihar
Chhattisgarh
Goa
Gujarat
Haryana
Himachal…
Jammu &…
Jharkhand
Karnataka
Kerala
Madhya…
Maharashtra
Manipur
Meghalaya
Mizoram
Nagaland
Orissa
Punjab
Rajasthan
Sikkim
Tamil Nadu
Tripura
Uttar…
Uttarakhand
West Bengal
• T o bridge this investment gap to some extent,
the Government of India continued the APDRP
program over the 11th Plan period in the form of
the Restructured APDRP (R-APDRP) initiative by
provisioning for capital investment led efficiency
improvements in the power distribution segment
with a total outlay of over Rs.55000 crores. Though
most of the utilities are still implementing Part-A
works under R-APDRP, the response to the works
has not been encouraging, with the utilities not
able to make the best use of the fund infusion
owing to their limited project management and IT
capabilities. Additionally, the Government of India is
also providing substantial funds to the state utilities
under Rajiv Gandhi Grameen Vidyutikaran Yojana
(RGGVY) for achieving 100% village electrification.
Such funding for infrastructure improvement would
be critical in ensuring the viability of the distribution
utilities, failing which the utilities are bound to face
serious financial crisis in the near future, posing
difficult questions for their viability.
• Owing to the above mentioned central government
schemes, it has increasingly been felt that efficiency
gains commensurate with these investments being
made in the sector need to be achieved to sustain
the sector in the long run. The limited achievements
of the state utilities on improving performance and
the contrasting stellar performance of legacy private
utilities like R-Infra, Torrent Power, CESC, JUSCO etc.
have fuelled the perception that there is need for
a more proactive involvement of the private sector
in the distribution space. The experience of Delhi in
privatization and Bhiwandi in franchising has further
strengthened this belief and has paved the way for
bringing greater private participation through PPP
initiatives in the distribution space.
• As far as the affordability of power is concerned, the
high AT&C losses are increasing the average cost of
supply each year. Not only are the utilities not able
to bill all consumers, they are unable to even collect
whatever is billed. Such a situation is leading to
rising arrears of the utilities, reflected in the debtor
days (Debtor days refers to the number of days of
revenue tied up in arrears) (refer graphs below).
• As can be seen form the above graph, even well
performing states like Gujarat, Kerala and Goa have
more than a month of revenue lying as arrears.
In a regulated business, such revenue losses are
simply not sustainable and strategies need to be
evolved to tackle the same at the earliest. Such
Source: PFC utilities report
Demand - Supply Gap
20%
15%
11.7% 12.3%
13.8%
16.6%
11.9%
13.3%
10.3% 10.6%
10%
5%
7.3%
8.4%
9.6%
9.9%
11.1%
10.1%
7.5%
8.5%
9.0%
8.7%
4.5%
4.2%
0%
FY05
FY06
FY07
FY08
FY09
FY10
Peak Deficit
FY11
FY12
FY13
FY14
Energy Deficit
Source: CEA Power Scenario at a Glance, March 2014
87
• A
survey of industrial consumers conducted by FICCI
in FY12 demonstrated that a significant number
of HT industrial consumers are heavily dependent
on captive sourced of energy for meeting their
requirements when the state utilities resort to
load shedding. Further, not only are the power
cuts in several states very long, the cost of captive
generation is also prohibitively high. A comparison
of these parameters across states is provided in the
graphs below:
88
• S uch lack of quality power not only impacts the
industrial output, but also stunts the development
of the human capital, specifically in the rural areas.
Although the demand supply gap has come down
substantially over the years, it needs to be kept in
mind that this is not reflective of the actual demand
of power. It is only the restricted demand which is
being captured. The power being curtailed at the
substations level is not even being captured in the
system. Going forward, as the electricity network
would grow in rural areas in the near future, there
would be considerable jump in the demand of
power. This demand increase would need to be
hadled through a three pronged approach:
(a) Ramping up capacity;
(b) Improving efficiencies; and
(c) Demand side management.
Key challenges in improving the viability,
realiability and affordability of power
Reduce losses
• The current AT&C losses at the national level are
unacceptably high. Unless these are brought down,
there is no scope of the sector booming viable.
There have been instances within the country and
abroad where utilities have been able to register
efficiency improvements of 7-8% annually (e.g.
in case of NDPL in India and Argentina in Latin
America). Since these efforts cannot be expected
from the state utilities, considering their precarious
financial situation the central government would
have to step in and continue to provide the
necessary investments required, but at the same
time suitable check and balances would also need
to be put in place to ensure efficient and result
oriented deployment of these funds. Loss reduction
would require s systematic implementation of key
reforms like separation of wires and retail business,
feeder segregation in rural areas, greater private
participation atleast in Tier 1 and Tier 2 cities etc.
Capacity addition
• Unless the sector witnesses competition in the
distribution space, improvements on parameters
like viability, reliability and affordability cannot be
expected. And effective competition can only come
about when there is surplus power in the state
and wholesale suppliers are vying with each other
to supply, reducing costs in the process. Hence all
necessary steps need to be taken to speed up the
existing capacity additions and make adequate
provisions for the future keeping in mind the
planned load growth.
Manage demand
• While loss reduction and capacity addition would
address the problem partially, demand management
form the consumer end is the most effective
solution. This can be done by offering tax sops
to industries which work towards improving their
process and make necessary investments for the
same, promoting efficient lighting systems like LEDs,
promoting green technologies like rooftop solar
through net metering provisions etc.
Investment in technology
• In the transmission and distribution segments
adopting smart grid initiatives like SCADA, DMS,
smart tariff mechanisms through AMI etc. are also
initiatives which will help improve efficiencies. In
addition up gradation of the existing power plants
to improve efficiencies and offering benefits to
states that take such initiative are steps which would
help boost investments in this domain.
Fuel supply
• Though India has the world’s fourth largest coal
reserves and there have been recent discoveries of
gas in several basins, most of the coal plants are
today struggling to secure fuel linkages. Several are
heavily dependent on imported coal for running the
plants. As a consequence several plants are either
under shut down or running on partial capacity.
The first step towards improving the affordability,
reliability and viability of power in the country
would be to end the policy logjam and provide coal
linkages to the power plants. Suitable mechanisms
also need to be put in place to ensure accountability
of Coal India for providing coal as per requirement.
Leveraging local experience
• Adoption of rural franchisees at the local levels is
likely to help distribution utilities achieve accelerated
loss reduction translating into direct improvement in
financial health of the utilities thus helping improve
viability of the entire sector.
89
Power to all: expanding access
to electricity
• In order to ensure inclusive development in the
country, specifically of the rural areas, access to
electricity is an essential requirement. Though
several states claim to have achieved 100%
electrification at the village level, the real picture
emerges when we look at the household level
electrification of the country.
• In the year 2001, just before rollout of reforms in
the country, the level of household electrification
in the country was a mere 56%. Though there has
been improvement in this in the past decade, it was
still at an unimpressive 67% in 2011 census. While
access in urban areas has improved significantly and
stood at 92% in 2011, in case of rural areas there
was barely any increase from the figure of 2001.
The table alongside provides a snapshot of the
electrification levels at village and household level
for all the states as per the census 2011. In the last
three years, though close to 2 crore households
have been electrified under RGGVY, there still are
several households not connected to the grid.
• As can be seen from the table, in case of several
states which have achieved significant level of
village electrification, when it comes to household
electrification, their performance is dismal.
For example, in case of Bihar, the household
electrification is barely 16% while the village
level electrification is a respectable 97%. Hence,
monitoring electrification at the village level has
become rather irrelevant in furthering the increase
in access to electricity at the household level.
90
State
Village Electrification
Household Electrification
Andhra Pradesh
100%
92%
Arunachal Pradesh
76%
66%
Assam
96%
37%
Bihar
97%
16%
Chhattisgarh
97%
75%
Delhi
100%
99%
Goa
100%
97%
Gujarat
100%
90%
Haryana
100%
91%
Himachal Pradesh
100%
97%
Jammu & Kashmir
98%
85%
Jharkhand
89%
46%
Karnataka
100%
91%
Kerala
100%
94%
Madhya Pradesh
98%
67%
Maharashtra
100%
84%
Manipur
86%
68%
Meghalaya
86%
61%
Mizoram
93%
84%
Nagaland
70%
82%
Orissa
79%
43%
Punjab
100%
97%
Rajasthan
98%
67%
Sikkim
100%
93%
Tamil Nadu
100%
93%
Tripura
93%
68%
Uttar Pradesh
89%
37%
Uttarakhand
99%
87%
West Bengal
100%
55%
INDIA
95%
67%
• C
omparing the performance of India on access to
electricity with our neighbouring countries in Asia
shows that India is behind neighbours like Nepal
and Sri-Lanka. The close correlation between
electricity consumption and economic achievement
is well established. Providing affordable and
continuous electricity to rural areas is of key
importance in maintaining robust economic growth.
Region
Population without
electricity millions
Electrification
rate %
Urban electrification
rate %
Rural electrification
rate %
China
3
99.8
100.0
99.6
India
306
75.3
93.9
66.9
Southeast Asia
134
77.6
90.5
67.2
Brunei Darussalam
0
100
100
99
Cambodia
9
34
97
18
Indonesia
66
73
85
60
Laos
1
78
93
70
Malaysia
0
100
100
99
Myanmar
25
49
89
29
Philippines
28
70
89
52
Singapore
0
100
100
100
Thailand
1
99
100
99
Vietnam
4
96
100
94
Rest of dev. Asia
172
61.4
81.9
51.7
Bangladesh
61
60
90
48
DPR Korea
18
26
36
11
Mongolia
0
88
98
67
Nepal
7
76
97
72
Pakistan
56
69
88
57
Sri Lanka
3
85
96
84
Other Asia
27
32
59
22
Developing Asia
615
83.1
95.0
74.9
91
• F urther, on the global front, India is decades behind
the developed countries in terms of electricity
access and consequently, per capita consumption.
According to an IEA report, India accounts for close
to 25% of the world population without access to
electricity (refer graph alongside) and is the country
with the largest population without electricity
access. India’s larger geopolitical and political
ambitions of playing a larger role in the global arena
cannot be fulfilled with such a dismal performance
on a basic necessity, namely institutionalized access
of electricity
but also extremely poor rural access, with a large
population still not connected to the electricity grid.
Figure 5: Global comparison of per capita consumption (kWh per annum, 2011)
14000
12000
10000
8000
6000
4000
2000
0
Million
Figure 4: Countries with the largest population
without access to electricity
350
70%
300
60%
250
50%
200
40%
150
30%
100
20%
50
10%
0
0%
Sub Saharan Africa
Developing Asia
Cumulative Share of Global (right Axis)
• W
ith a per capita consumption of approximately
900 units per annum, India lags behind 120
countries on this parameter. In order to reach
the global average of 4000 kWh/capita annual
consumption, India will have to invest close to
Rs.20 lakh Cores (at current cost) in the power
sector. Considering the present situation, reaching
the global average per capita consumption of 4000
units is unlikely to figure prominently on the agenda
of policy makers, but this figure needs to be kept
in mind as a thumb rule to assess the investments
required. The graph below presents a comparison of
the per capita consumption of electricity in various
countries:
• As can be seen from the above graph, India is far
behind even several of its Asian neighbours like
Malaysia, Singapore, Vietnam, Korea and China,
let alone developed western countries. Likewise,
even the third world developing countries like
South Africa, Brazil, Argentina and the entire world
average is way above the mark of India. The main
reason for this is not only the small industrial base
92
Source: The World Bank
• T he flagship scheme of the UPA government for
enhancing electricity access in rural areas was Rajiv
Gandhi Grameen Vidyutikaran Yojana (RGGVY).
With the announcement of ‘Deen Dayal Upadhyay
Gram Jyoti Yojana’ and expected investments of
close to Rs.75600 crore under the scheme, it is
expected that this scheme will take over from
RGGVY. Thus all the shortcomings of the RGGVY
should be suitably addressed in the new scheme
to ensure improved access in real terms to the end
consumers. A few of the issues are being listed
below.
Key challenges in ensuring acess to all
Issues specific to RGGVY – to be addressed under
DDUGJY
Definition of village electrification
• As per the current applicable definition of
electrification, a village is declared as electrified, if:
(a)Basic infrastructure such as Distribution
Transformer and Distribution lines are provided
in the inhabited locality as well as the Dalit Basti
hamlet wherever it exists.
(b)Electricity is provided to public places like
Schools, Panchayat Office, Health Centers,
Dispensaries, Community centers etc.
(c)The number of households electrified is at least
10% of the total number of households in the
village.
• As is clear from the above definition, there is strong
likelihood that a village with barely 10% households
being electrified would be considered as electrified.
This is the reason why states like Assam, Bihar and
UP have very low levels of household electrification
despite having achieved more than ninety percent
electrification at the village level. Thus, there is an
urgent need for modification in the definition to
electrification to make it more expansive. The limit
on household electrification definitely has to be
increased for securing a status of electrification.
• Further, the monitoring of village electrification
is presently being done at the village level. There
is a need to drill down to the next level, namely
the number of households. In order to make the
monitoring and reporting of focus on household
electrification simpler it would be useful to create
separate categories of village electrification level,
such as - Electrified Villages (as per definition),
Intensely Electricity Villages (with 50% or above HH
access) and Fully Electrified Villages (95% or above
HH access) etc.
Ensuring Minimum Hours of Supply
• While huge funds were released by the Central
Government under RGGVY and vast distribution
infrastructure was also created through the funds in
rural areas, it has come to the notice that in several
states the infrastructure is largely underutilised due
to extreme shortage of electricity. The situation
is particularly acute in states where electrification
has been rapidly achieved in the last five years. So,
although the distribution infrastructure is in place,
the generation and transmission capacity build up
has not been able to keep pace with the same. The
electrification thus achieved is thus only nominal and
not real.
• Hence, before releasing funds to the concerned
State Governments, the Central Government should
tie up with the States/Discoms at the time of
sanctioning of DPR etc. to ensure that adequate or
minimum prescribed hours of electricity is supplied
to the electrified villages/ Households. Further, it
would be essential to confirm that the utilities have
undertaken necessary steps to ensure reflection of
additional demand arising out of increased access
to electricity in their demand forecast and power
purchase planning. Suitable capacity additions
commensurate with the increasing requirement
owing to village electrification should be planned at
the national as well as state level.
Scheme formulation – need for
institutionalization of the process
• Under the RGGVY, while preparing Detailed Project
Reports (DPRs), similar cost benchmarks were
used by all the States across India (as per REC
estimates). However, the cost estimates for each
of the States is likely to be different depending
on various parameters like geography, population
density, region etc. Thus, while formulating future
Central Government schemes, the REC should
use past data on cost of village electrification as
per the experience in the 10th and 11th Plan and
State specific costing should be done considering
parameters such as length of circuit kilometres,
average number of Hamlets per village in the
state, level of electrification, per capita electricity
consumption etc. Further, within each state there
is wide variation in the geographical features, so
some flexibility needs to be provided to utilities to
make suitable changes to scheme formulation. This
would ensure timely scheme preparation as well
implementation.
• In addition, it was also observed that smaller DTs
were used in rural areas for electrification. This was
to improve efficiencies, reduce LT level losses, curb
theft and ensure that unnecessary overcapacities
were not created. However, the planner ignored
that once a particular village was electrified, a lot
of households would seek connections and village
level entrepreneurship initiatives would also pick up
speed. As a consequence the small DTs would not
be sufficient to cater to such a fast load growth.
This led to frequent failures of DTs in the initial
scheme implementation. Hence at the time of DPR
preparation, there is need for rationalization of
load forecasting keeping the population in mind –
suitable norms linking the population and the load
of a village and hence the network capacity required
in the particular village need to be developed which
can be used in future schemes like DDUGJY.
Decentralized Distributed Generation (DDG)
• Providing access to energy is being pursued by
either connecting the villages to the electrical grid,
or wherever this is not possible, through DDG
projects based on renewable fuels. Grid extension
involves developing dedicated transmission and
distribution infrastructure to reach each and every
village while on the other hand, DDG comprises
of small, modular, decentralized off-grid energy
93
systems (or in some cases grid connected systems
which are then called dispersed generation units)
located in or near the place where the energy is to
be consumed.
• Based on the geographical terrain, distance from the
nearest grid connection point and the economics
of extending the grid to a particular hamlet/village,
the decision of adopting / not adopting DDG is
made. DDGs become especially relevant in hilly and
remote tribal areas where other associated problem
for grid extension like forest clearance, tribal land
clearance etc. crop up. However, owing to multiple
responsibility centres (REC, State Nodal agencies
etc.) the DDG projects have taken a back seat as
no agency considers it as its responsibility. In some
states DDG projects have been mandated to be
taken up the respective State Renewable Energy
Development Agency while in some others REC is
responsible for the same.
• Hence, for the villages which cannot be connected
to the grid, for promoting DDG projects there is a
need to bring on board all other agencies involved.
This needs to be done at the highest level. The other
option is to empower the state utilities for taking
up even DDG projects, failing which the currently
unconnected villages would continue to face
difficulties.
Scheme implementation and monitoring
• Till now local institutions like Panchayati Raj
Institutions (PRIs) have not been stakeholders in
village electrification to any significant extent.
Involving PRIs during planning, implementation,
selection of rural franchisees (appointed under the
scheme) and monitoring of the scheme are likely to
give a positive fillip to the scheme over the longer
term. Further, scheme monitoring by most utilities is
being done through their own scheme monitoring
setup. There is utter lack of capacity in terms of
project management, quality check and supplychain management in case of utilities implementing
the scheme on their own. Such gaps need to be
addressed by helping utilities develop the necessary
capacities.
• In addition to poor project management practices
of the utilities, the scheme has also experienced
delays due to ‘right of way’ related issues, lack of
adequately experienced turnkey contractors and the
three tiered monitoring mechanism of the RGGVY.
94
Though the three tiered mechanism ensures quality
of implementation, it is also a major cause for delay.
Greater responsibility thus ought to be left to the
utility for scheme monitoring. Likewise, the right of
way related issues are likely to be addressed better
by involving the local PRIs. As far as the turnkey
contractors are concerned, their lack can only be
addressed by building up the necessary capacities
in the existing utilities. Hence these issues need to
be deliberated and debated before rolling out any
future schemes.
General issues in ensuring access
Bringing economics in rural supply
• As a consequence of the expanding rural consumer
base, with a majority being in the subsidized
categories, subsidy requirements of the state utilities
will also increase manifold, unless tariffs are further
rationalised. With government budgets already
strained and relatively lower disposable incomes of
rural households, maintaining affordability in rural
areas will be a key challenge.
• Moreover, as per the objectives of the Act and
National Tariff Policy, the cross subsidies need to be
reduced over time. Thus unless the rural consumers
become capable of bearing the cost of electricity,
the investments are not likely to yield expected
results. Hence economic development of the rural
areas, which can be fuelled with the access of
electricity should be planned and implemented in
parallel with the expanding rural network.
• In addition, the requirement of adopting rural
franchisees in the RGGVY electrified areas, as was
a mandatory clause in the scheme, should be given
greater emphasis. The revenue sustainability of
investments in rural network expansion is to be
ensured by having franchisees at the village level. It
would be even better if the same is done at the level
of a few feeder clusters, as the same can be better
monitored. Despite input level rural franchisee tariffs
approved in several states, such as Jharkhand, there
have been no takers for such franchises. Lack of
commercial interest / viability needs to be addressed
in creating modalities for such franchisees.
• Employment generation/ rural entrepreneurship
opportunities could be new ways of propagating
capacity building in rural franchisees. Small
franchisees at rural level would often lack capacity
to raise bills, maintain ledgers etc. (under the
input based model). Appropriate mechanisms for
ensuring assistance on such issues through providing
access to utility billing engine or even undertaking
the bill generation in the system for such franchisees
should be considered. There have been issues under
such franchisee models where utilities have lost
track of consumers and often consumers have been
charged wrongly by the franchisees.
Focus on a target based approach rather than
sustainable energy supply
• In the past in India a large number of off-grid
electrification projects have failed as the focus of the
projects as well as project initiators was on technical
installation of the equipment and its initial operation
rather than focus on long-term sustainability. This is
due to the nature of the design of the programmes.
Most programmes in India are designed and
implemented on a top down target based approach
in which each programme has a budget attached
with it, which in turn is converted into a capacity or
a number of systems which have to be installed. This
approach provides limited or no support in the form
of back up funds and support for O&M, technical
support for sustainable operation, development of
spares and sustaining the supply chains, etc.
• Although under RGGVY (DDG component) & the
Remote Village Electrification program of MNRE
there are provisions which try to ensure that the
systems work for at least a certain period of time,
until sustainable institutional arrangements at the
local level are created, these problems will continue
to afflict the Indian rural energy sector. For most
stakeholders, government DDG programmes are
seen as another target to be achieved with little or
no focus on the results, product development and
customization to local needs, sustenance or after
sales service.
shortages do not directly affect the primary income
sources of the poor, and needs like employment
opportunities, health care, and educational facilities
take precedence over fuel shortages. At the same
time provision of energy is largely the responsibility
of women, who in most societies, do not have
the power to influence choices. Thus for energy
interventions to be successful and address the
actual needs of the poor, these interventions have
to address traditional income generation avenues
and make the women more productive so that the
cost of the women’s time is more than the cost of
buying commercial fuels.
Inefficient subsidy targeting
• As part of the RGGVY scheme, although all the
consumers being added to the network are being
provided supply through an energy meter, the actual
reading and consumption monitoring of these
connections is largely ignored. Even after getting
connections, these consumers are either not being
served energy bills by the distribution utilities. In
cases where consumers are being charged for
electricity the same is being done at a fixed rate
without any real correlation with the consumption
of the household. As a result, households which
may not be eligible for subsidized electricity are also
getting misdirected subsidies.
• To ensure that the rural electricity infrastructure
remains sustainable, such subsidized consumers
would need to be rooted out. Involving local bodies/
NGOs as collection based franchisees, as is being
done in states like Jharkhand offers the potential
of adequately addressing the issue and at the same
time improving the financial health of the utility.
Rural energy shortage – not perceived as a
problem
• Before implementation of any rural energy
intervention, it is important to remember that the
rural community does not perceive energy shortages
as a problem. This is largely because most energy
95
Introducing retail competition:
separation of wheeling and retail
supply
• T he reform process was initiated by the Government
of India with an objective of bringing in greater
competition in the sector, translating into value
addition for consumers. With the reforms, the
generation and transmission sector was opened up,
to a considerable extent, to private participation
and the results are for all to see. Introduction
of competitive procurement by utilities has, to
a considerable extent, succeeded in attracting
private sector investments in the generation and
transmission segments of the sector. However,
distribution of electricity continues to be under the
monopoly of distribution utilities in their respective
license areas.
• While the Electricity Act, 2003 had made way for
retail competition through introduction of Open
Access in a time bound manner, the actual impact of
the same has been limited or rather inconsequential.
Parallel licensing, another feature of the act that
allows for competition among distribution licensees
has also remained confined to small pockets with
only three parallel licensees being operational in the
entire country today namely in Mumbai (R-Infra and
Tata Power), Jamshedpur (JBVNL and JUSCO) and
Greater Noida (PVVNL and NPCL). Due to this lack
of competition, the distribution segment has been
witnessing poor operational performance, with the
licensees seeing neither any significant penalty for
poor performance nor any benefits of improving
performance. The specific reasons why these
initiatives have not been able to take off in right
earnest are elaborated below.
Open access
• S ince private investments, and consequently,
competition in the sector were not forthcoming,
open access was tried as a method of bringing in
competition in the sector. Open access allowed end
consumers (in a phased manner, beginning with
1 MW and above) to source power directly from
generators/suppliers using the network of the state
distribution utility, subject to payment of wheeling
charge and cross-subsidy surcharge as determined by
the respective state electricity regulatory commissions.
Since the state distribution utilities had not
demonstrated consistent performance on efficiency
improvement and competitive procurement of power
it was envisaged that consumers (especially large
consumers) which were allowed to source power
96
through open access would move out to cheaper
sources of power and thereby force competition in
the retail supply of electricity.
• The prospect of losing high values consumers, it
was expected, would force utilities to improve their
performance (and hence reduce tariffs), thereby
benefiting their larger consumer base. On the other
hand, private generators were expected to benefit
by directly supplying to the end consumers at a
mutually agreed price. However, this initiative was
not fruitful for several reasons, a few of them being
listed below:
(a)Infrastructural constraints like lack of adequate
transmission and transformation capacity
leading to network congestion are not
conducive to open access;
(b)Regulatory issues like delays in notification of
wheeling and cross subsidy surcharge by state
regulators, very high cross subsidy surcharges
determined by the state regulators making
sourcing of alternate power through open
access unviable etc. are also issues which
restrict movement of consumers to the open
access regime;
(c)Power deficit scenario: The choice of open
access would become available to consumers
only in a power surplus scenario, where
consumers have choice. Due to the acute
deficits witnessed in the country the rates of
power have remained inconveniently high to
make open access a value proposition;
(d)Non-tariff barriers such as delays in evaluation
and approval of open access applications by the
distribution licensees;
• Since one of the major reasons for open access not
being able to pick up momentum was the delaying
tactics adopted by the licensees in approval of
open access applications, the Central Government
stepped in and through a letter of the Attorney
General of India, expressing the official view of the
Ministry of Law & Justice, voiced its opinion that
all consumers with a contracted demand of 1 MW
and above shall be considered to be deemed to
be open access consumers. It was suggested that
such deemed open access consumers should not
be considered as utilities consumers (for regulatory
and tariff purposes) and should be allowed procure
power independently.
• While there has been some participation by open
access consumers in the electricity exchanges, its
extent has remained limited to less than 1% (in MU
terms) of the total market for power in the country.
Tamil Nadu, Andhra Pradesh, Punjab and Gujarat
together account for close to 79% of all the open
access transactions in the country. Despite the
efforts of the Central Government, open access has
largely failed to create a platform for substantive
competition in the retail sale of electricity.
Parallel licensee
nother initiative of the Act aimed at bringing
• A
in competition in the distribution sector was
through enabling parallel licenses wherein two
or more licensees could compete for the same
customer base. While the provision of a parallel
licensee technically allows for competition, it calls
for a mandatory duplication of network by the
subsequent licensees.
• In the post reforms era, Jamshedpur (JSEB and
JUSCO) and Noida (NPCL and PVVNL) are the
only areas where parallel licensees have been
granted and made operational. While not much
information is available on NPCL-PVVNL, JSEB
has been alleging selective cherry-picking of HT
consumers by JUSCO translating in an ongoing
case between the two before the Jharkhand State
Electricity Regulatory Commission.
• Hence, it would not be an overstatement to say
that retail competition has remained limited to a
handful of large industrial consumers while the
larger consumer base in the area still continues to
have only one option, i.e. the incumbent licensee.
That only two parallel licenses have been granted
in the entire country in more than a decade in the
post reform era is itself an indicator of the failure of
introducing competition in retail supply of power.
Segregation of wheeling and retail supply of
electricity – the way forward
• It is pertinent in this context to consider the overall
status of the reforms in the electricity sector in India
vis-à-vis the path traversed by other countries where
the same has been taken to the level of introduction
of competition in retail sale of electricity. The
major phases in the reforms process have generally
covered the four phases ranging from:
(a)Existence of vertically integrated monopolistic
utilities, to
(b)Functional/ vertical segregation of utilities while
retaining a single buyer (discom) model, to
(c)Introduction of wholesale competition with
freeing up of generation segment, introduction
of competitive procurement by distribution
utilities, setting up of exchanges/ trading activity
etc. thereby allowing choice for distribution
utilities and large industrial consumers; to
(c)Introduction of full scale retail competition
with segregation of wheeling and supply
business and allowing for multiple licensees in
the supply business;
ith due consideration to the progress on reforms
• W
in India since 1991 and more so after the enactment
of the Electricity Act, 2003, it would be fair to place
the Indian electricity industry into mature / advanced
stages of “wholesale competition” (phase 3). The
generation sector has been already fully deregulated
(with de-licencing) with even public sector entities
mandated to undergo competitive processes for
entering into contracts with distribution utilities.
Further, the setting up of secondary market for
power through effective introduction of trading
and electricity exchange platforms is largely
accomplished in India.
• The logical next step in the process of consumer
centric reforms, is the introduction of retail
competition. Retail competition has been in place
for a considerable amount of time in the United
Kingdom, New Zealand, Australia, Argentina,
Norway, Spain and several states of the United
States of America. It has been observed that
the introduction of competition in retail sale of
electricity has been undertaken on achievement/
establishment of the following pre-requisites:
(a)Competitive wholesale market: A competitive
supply side and wholesale market along
97
with settlements system, innovative tools &
techniques for metering and billing and default
option are essential for the introduction of retail
competition.
(b)Cost reflective tariffs: Once the market
gets opened up to retail competition, large
subsidizing customers are likely to move to
the lowest tariff supplier, which will erode the
revenue from cross subsidies of the incumbent
licensee. Therefore, before retail competition
is introduced, cost reflective tariffs or at least
voltage and consumer category-wise costs of
supply should be accurately known;
(c)Separation of wheeling and supply: Wheeling
business should continue to be regulated in
order to prevent distribution companies from
exerting market power or indulging in anticompetitive market play and retail prices should
be market determined.
(d)Avoidance of network duplication: Duplication
of transmission and distribution wheeling
businesses should not be allowed, letting them
remain natural monopolies and regulated.
(e)Regulatory overview: In case of retail
competition the role of regulators remains to
the extent of a market watchdog or a facilitator
to ensure the efficiency gain of the competition
reaches to the consumers and no consumer is
deprived of the electricity.
Legal changes required
• The Solicitor General of India has opined that the
Electricity Act 2003 has assigned the dual role of
network operator and of supplier to the distribution
licensee and hence the two cannot be separated
without an appropriate amendment to the Electricity
Act, 2003.
• The Ministry of Power under the UPA Government
vide Notification No. 42/6/2011-R&R (Vol-III)
dated October 17, 2013 had issued the proposed
amendments to the Electricity Act, 2003 which
could not be taken up by the last government. A
debate/discussion on the same needs to be initiated
at the earliest to take up the segregation of retail
and wheeling businesses in the earnest. The intent
behind the proposed changes and an understanding
of implications of the same are provided in the table
below:
Key Proposed Amendments
Implication
Insertion of clause 2(a), 17(a), 25(ba), 35(a), 70(a), 70(b) and Amendment to clause 3,
17, 23 (a), 27 towards definition of separate distribution and supply licensees;
Definition of independent distribution and supply
licensees;
Insertion of Clause 1 (d) under Section 14 to define supply of electricity as a separately
licensed activity under the act.
Introduction of supply as a separate licensed activity
under the Act.
New Proviso under Section 14 (Grant of Licence):
“Provided further that any person engaged in the business of distribution of electricity
on or before the commencement of the Electricity (Amendment) Act,
……shall be deemed to have authorization to undertake distribution of electricity as
a distribution licensee and to supply electricity as a supply licensee till such time as the
transfer scheme under sub-sections (4A) (a) and (b) of section 131 is issued, whereupon
the distribution business and the supply business in respect of such person shall be
discharged in the manner as stipulated in the said transfer scheme.”
Provision for segregation of existing distribution
licensees into separate distribution and supply
licensees through a transfer scheme to be notified by
the concerned State Governments in a time bound
manner.
Amendments to various provisos under Section 14 to incorporate the separate supply
licensee structure.
Alignment of the Section 14 to the new structure
with a separate supply licensee.
Amendment to Proviso 6 of Section 14: Clause regarding 2 or more licensees within
the same area has been changed to make it applicable only for Supply Licences. The
scope has been limited to consumers having specified load profile. The provision for
distributing electricity through own distribution lines, applicable as per the existing
distribution licensee definition has been deleted from the clause.
Introduction of competition in the supply licensee
business.
Monopolization of the distribution/ wheeling business
to avoid duplication of network.
Insertion of new clause to Section 14: “PROVIDED also that in a case where a
distribution licensee or a supply licensee proposes to undertake the supply of electricity
for a specified area within his area of supply, through another person as a Franchisee,
that person shall not be required to obtain any separate licence from the concerned
State Commission and such distribution licensee or supply licensee shall be responsible
for supply of electricity in his area of supply:”
Enablement of franchisee appointment under both
distribution and supply licence activities.
98
Insertion of new clause to Section 14: “PROVIDED also that an intra-State trader shall be
deemed to be a supply licensee for the area for which trading license has been granted
to it and shall have the obligation to supply on demand to all consumers who have been
provided open access in the said area of supply.”
Widening of the scope of the intra-state transmission
license to that of a deemed supply licensee in
accordance with the new industry structure. Also,
envisages introduction of the duty to supply on
demand on intra-state transmission licensees.
Section 15 (Procedure for Grant of Licence), Clause 8: The period of licence has been
made case specific as may be specified by the concerned SERC.
SERCs will be able to define period of licence and
extension thereof, if any.
Section 20 (Sale of Utilities of Licensees) and Section 24 (Suspension of distribution
and supply licence and sale of utility): Several changes enabling SERCs to undertake
competitive sale of utilities of licensees on both expiry or revocation of licence. Earlier
provisions allowed only such sale on revocation of licence.
SERCs may undertake competitive sale of utilities on
expiry of existing licences thereby leading to larger
opportunities for private sector even in the wheeling
business. However, the concept of perpetual licence
to possibly come to an end.
Section 42 (Duties of Distribution Licensee and Open Access) Proposed Amendments
to 1st proviso of clause 2 entitles the incumbent supply licensee to collect cross subsidy
surcharge from Open Access consumers, while other charges shall be to the account of
the Distribution/ Wheeling licensee.
The subsequent supply licensees or other suppliers to
OA consumers would pay cross subsidy surcharge to
incumbent supply licensee.
Introduction of new chapter “Part VI A – Supply of Electricity”
Section 51A, 51B, 51C and 51D introduced: Key provisions include:
i. Definition of duties of supply licensee;
ii. Incumbent licensee to assume role of supply licensee;
iii. A time of 3 years granted to State Governments for issue of transfer scheme for
separation of business;
iv. Incumbent supply licensee to have obligation to supply to all consumers;
v. Subsequent supply licensees to supply to consumers under OA (Section 42);
vi. Incumbent licensee to supply on failure of subsequent supply licensee;
vii. Duty of supply licensee to procure power, as per requirement of consumers;
viii. Supply licensee shall supply at tariffs as determined by the SERC (procedures similar
to the existing tariff determination process)
ix. Provisions related to security from consumes similar to existing practice, as per SERC
approval;
x. SERCs to frame Electricity Supply Code which will determine terms of business for
supply licensees;
The time frame of 3 years for segregation would be
key to separation of the incumbent licensees in a time
bound manner for introduction of competition in the
retail supply business.
Introduction of new chapter “Part VIB – Other Provisions Relating to Distribution and
Supply of Electricity” Section 51H introduces provisions regarding consumer grievance
redressal regarding setting up/ empowerment of CGRF and Ombudsman by Supply
Licensees similar to existing provisions applicable to distribution licensees.
Supply licensees would be made answerable to
consumers.
Section 62 (Determination of Tariff) SERC to determine only ceiling tariffs where more
than one supply licensees operate. Procurement of power only by competitive bidding
by Supply Licensees as may be specified in NEP and NTP.
Competitive procurement regulatory oversight to
remain. However, the cost structure of the incumbent
licensees to drive the ceiling tariffs.
Enabling clause for empowering State Governments
Section 131 (Vesting of property of Board in State Government) Enables State
Governments to undertake drawing of transfer scheme for separation of distribution and
supply businesses, as envisaged in the amendments;
• T he likely impact of the Proposed Amendments
in the Electricity Act-2003 effecting segregation
of Distribution and Supply Business is summarized
below:
(a)The proposed amendments would facilitate the
introduction of full scale competition in the retail
market for electricity through easy entry for new
players under the supply licensee route without
the need for duplication of network. This was an
objective of the Act but, has not been realized
through the Open Access provisions under the
existing provisions of the Act.
(b)Under the proposed Ceiling Tariff mechanism,
the cost structure of the incumbent licensees
would set the ceiling tariffs, which would
give substantial advantage to the subsequent
supply licensees who do not carry the liabilities/
burdens associated with the legacy utilities.
(c) In the long-term the returns would remain close
to the regulated return levels due to the high
levels of regulatory oversight proposed in the
tariff determination process.
99
(d)The SERCs would play a crucial role in enabling
entry of supply licensees through enactment of
relevant regulations and separation of tariffs/
charges for the incumbent licensees (irrespective
of the notification of actual transfer scheme by
the State Governments).
(e)States with higher concentration of industrial/
large consumers are expected to witness more
interested subsequent licensees during the
immediate period because of the associated
ease of determination of load profile for such
consumer groups.
(f)Existing distribution licensees would get a
head-up with enactment of the proposed
amendments by becoming deemed Supply
Licensees across the state.
Open ended legal issues
• The following issues, which prima facie remain
unresolved in the proposed amendments, require
further deliberations and may be addressed through
suitable changes in the proposed amendments:
(a)Responsibility for consumer metering appears to
have been retained with the wheeling licensee,
however, the responsibility for meter reading
and reconciliations amongst supply licensees has
not been defined in the Act. While the SERCs
would be doing that through the Distribution
Code, allocation of overall responsibility for
settlements and dispute resolution in the Act
itself would have ensured clarity and consistency
across states.
(b)Responsibility for T&D losses (especially
commercial component, in the form of
direct theft etc.) is not clear. The allocation
of the same to the distribution licensee or
the incumbent supply licensee would have
substantial impact on the charges that
subsequent supply licensees would have to pay
to the distribution/ wheeling licensee.
(c)The provision for ceiling tariff along with
mandatory competitive procurement might
make it difficult for Supply Licensees who intend
to leverage on reliability/ continuity of supply to
its consumers.
• The responsibility of introduction of the proposed
amendments calls for sustained level action and
pursuance by the Ministry of Power, Government of
India.
100
Retail competition Case Study – United Kingdom
• T he UK electricity sector prior to reforms was
vertically integrated under the state-owned
Central Electricity Generating Board to look after
generation and transmission of power, and regional
area boards for distribution of power. Reforms
were initiated through the Electricity Act 1989
leading to restructuring and privatisation of the
electricity industry in UK. The Act had provisions for
privatization, introduction of competitive markets,
and a system of independent regulation. In the
first stage of reforms, all coal-fired and oil-fired
generating plants in England and Wales that had
previously been under the control of the Central
Electricity Generating Board (CEGB) were transferred
National Power and PowerGen, two companies
created specifically for the reforms.
• The assets of the erstwhile CEGB were also split into
3 generating companies (National Power, PowerGen
and Nuclear Electric) and one transmission company
(National Grid Company). Regional area boards were
replaced with 12 Regional Electricity Companies
(RECs) and the local distribution assets were
transferred to the respective RECs. In the later stages
First Phase (19891990)
•Unbundling and
privatization of
generation and
distribution utilities.
Transmission utility
accepted as a natural
monopoly. Regulator
vested with power to
regulate and monitor
the sector.
Second Phase (19901991)
•Wholesale market
reforms- Pooled
power market
operated as a cleating
house where power
was pooled by all
generators and prices
quoted. The price of
the last unit required
to meet the demand
determined the
clearing price.
Third phase (1991
1998)
•Segregation of retail
and wires business
and introduction of
retail competition in
phases - first for loads
above 1 MW, then for
loads above 100 kW
and in the last stage
for all loads.
of reforms, the government also divested off all the
12 RECs
• In the second phase, an electricity pool of England
and Wales was established. The Pool was to ensure
a competitive bidding process where generators
offered bid prices for electricity for half hour time
blocks. The last unit required to meet the demand
decided the clearing price for the system. Thus, the
Pool acted as a clearinghouse between generators
and wholesale consumers of electricity (primarily the
RECs). The National Grid Company (NGC) operated
the Pool and administered the Pool’s settlement
system on behalf of Pool members. However, the
Pool suffered from several drawbacks, the most
important of them being:
(a)The pricing mechanism was vulnerable to
gaming strategies by generators who could
manipulate the Pool price by withdrawing plant
from the market at key times; and
(b)There was a lack of competition in price setting,
because price setting remained dominated
by the two main generators – PowerGen and
National Power.
• At present there are 14 licensed distribution
network operators (DNOs) in UK, each responsible
for a distribution services area of its own. The 14
DNOs are owned by six different groups. There
are also four independent network operators who
own and run smaller networks embedded in the
DNO networks. There are various types of Supply
licences in UK at present, e.g. those for supply to
Domestic premises, Non Domestic premises etc.
and supply licence applicants can even apply for
specific premises/areas in which they are willing to
supply electricity. Domestic, and most commercial,
consumers buy electricity from suppliers who
pay the DNOs for transporting their customers'
electricity along their networks. Thus there is
absolute freedom to choose the supplier and hence
enhanced competition translating into improved
performance and cost efficiencies.
• For the sake of illustration, in any typical electricity
consumer’s bill (refer graph alongside) the split up
of the bill is displayed on a regular basis by OFGEM,
the sector regulator. As the red line denotes, the
net pre-tax margin has been rising over the years
and the trend is expected to continue of the
future, atleast in the immediate term, indicating
the benefits accruing to the utilities. At the same
time, the wholesale prices have also come down
significantly since 2009, against translating into
benefits for the consumers
Retail competition Case study – Argentina
rgentina initiated its power sector reforms in the
• A
early 90’s. The reform process was undertaken
under a larger economic liberalization package
of the government which was facing economic
stagnation and declining growth and was crumbling
under massive sovereign debt. The main utilities
then were Ayee, Hidronor and Segba which were
each responsible for generation, transmission and
distribution. There were also nineteen provincial
utilities – primarily distributors - and several
electricity cooperatives.
• As in most other cases, the Government started off
with unbundling of the vertically integrated sector
into Generation, Transmission and Distribution
utilities. The Generation leg was privatized in
the first phase, while the transmission utility was
accepted as a natural monopoly. The distribution
segment was further split up into retail and wires
business. Though the long term plan was to
privatize even the retail business while retaining
the wires business as a natural monopoly, the
Government stopped short of doing that and the
distribution utilities are themselves handling the
retail and wires business both even today.
• Post unbundling, an independent sector regulator
(Ente Nacional Regulador de la Electricad - ENRE),
101
•
•
•
•
102
a Wholesale Electricity Market (Mercado Eléctrico
Mayorista - MEM), and an independent market
operator (Compañía Administradora del Mercado
Mayorista Eléctrico S.A.-CAMMESA) were created.
ENRE was charged with enforcing laws, regulations
and concession terms, setting distribution service
standards, resolving disputes between electricity
companies, overseeing CAMMESA, and setting
maximum electricity prices.
CAMMESA is in turn a not for profit corporation
equally owned by the federal government
and four associations representing generators,
transmitters, distributors, and major users. It is in
charge of scheduling and dispatching generators in
accordance with the power demand, on the basis
of using marginal costs and availability offered by
generators, employing those generators offering the
lowest marginal costs first.
The generation companies cannot own majority
stake in Argentina's three transmission companies.
At the same time, the transmission companies have
to mandatorily provide open access to the power
generators on a regulated basis and they are not
allowed to hold a stake in either generation or
distribute utilities. At the same time, the distribution
utilities are organized as regional monopolies &
allowed to buy electricity from the MEM or through
contracts with power generation companies.
To further boost retail competition, the energy
market was initially opened up for customers
with demands greater than 5 MW which was
subsequently reduced to 30 kW in a phased
manner. These customers are free to contract
directly with generators and can participate directly
in the generation market. The tariff for Regulated
customers (below 30 kW) is estimated based on
a formula that takes into account the wholesale
prices, seasonality, capacity and local charges, if any.
After restructuring and privatization, the generation
space has witnessed very heavy competition
resulting in efficiency gains and reduction in cost
of electricity. The increased generation has also
allowed Argentina to meet its own electricity
demand as well as export electricity. Grid access
based on merit order dispatch principles which
require the electricity generated by the most
efficient supplier should be dispatched first. This rule
encourages a gradual but steady drive to upgrade
existing facilities and thus improve performance.
Argentina has also lowered barriers to entry of new
independent power producers and supplier groups.
Also, as set by ENRE and CAMMESA, it is far more
difficult for generators to withdraw capacity from
the dispatch queue.
• In addition, a series of new laws on foreign
investments removed restrictions on foreign
investments and allowed foreigners to acquire
100% of Argentine companies and to repatriate the
profits and capital. The overall sector investment
increased significantly from $318 million in 1994 to
a peak of more than $2 billion in 1997. Between
1994 and 2000, a total of $5.7 billion was invested
into electricity sector, the benefits of which can be
attributed directly to the exceptional reduction in
cost and gain in efficiencies.
Key challenges in segregating wires and retail
businesses
Tariff setting mechanism – linking it up with
Voltage wise category wise CoS
Allocation of existing PPA
• At present, the plants which had become
operational under the pre-competitive bidding
regime have long term PPAs with distribution
utilities which are expected to continue for a few
more years. Considering that most of these plants
are old and have also easy access to coal from
allocated mines, the electricity from these plants is
significantly cheaper. As a result, if the PPAs of these
plants are retained by the incumbent retail licensee,
it would have an undue cost advantage over other
players, thus tilting the playing field in its favour.
A mechanism would hence need to be developed
to allocate these PPAs to the future licensees. This
mechanism would have to ensure that the PPAs are
allocated in an equitable manner and no licensee
gets favoured.
• P resently, tariffs in the country are designed keeping
larger socio economic and political considerations
in mind. This means that cross subsidies are
inherently built into retail supply tariffs. Also,
despite the mandate of the National Tariff Policy to
move towards tariffs within the stipulated limit of
+/-20% of the average cost of supply, the tariffs for
agriculture and domestic categories have largely
remained sticky at lower levels. Such huge cross
subsidies are inherently detrimental to competition
in retail distribution as the licensee saddled with the
largest number of subsidized consumers would have
to face the lowest recoveries, making it gradually
unviable
• Thus, tariff rationalisation to reduce cross
subsidies has to be done in a phased manner
and in a relatively short period to ensure genuine
competition at retail level is established. For this,
all the state regulators that have demonstrated
considerable reluctance to hike tariffs would have
to be adequately sensitized. Also, the tariff setting
exercise would have to peg the tariffs to the voltage
and category-wise cost of supply as determined by
the concerned state regulators. Mechanisms for
dealing with this problem in the transition phase
would also need to be finalized after stakeholder
interactions. Unless such a scenario is in place, true
retail competition would be very difficult to achieve.
Securing finances
• As per the current financing norms, generators
planning to set up power plants in India have to
show fuel supply agreements and power purchase
agreements in order to secure financing for the
project as these provide revenue assurance. Under
the open market for retail competition, such PPAs
would not hold any relevance as the prices would be
determined by market forces. Hence, in the absence
of such sureties for the sale of power, generators
might find it difficult to secure adequate funding
for projects. Such changes in financing norms need
to be effected at the highest level by proactively
engaging the bankers as well as the regulators.
Weakening the dominant market position of
generators
• In a competitive retail market, dominance of large
generating companies may not be conducive to
genuine competition and there is likelihood that the
dominant players may manipulate the market. This
would usually involve breaking up bigger generating
companies into smaller ones to ensure a large
number of generators. The exact details of how this
can be achieved, along with alternatives, to prevent
abuse of market power needs to be chalked out
before roll out of retail competition.
Treatment of accumulated losses, regulatory
assets
• At present most of the state utilities are saddled
with huge financial losses. Before segregation of
the wires and retail business, a mechanism would
need to be developed to allocate these huge losses
between the two businesses. Also, it would need to
be decided how these accumulated losses impact
any subsequent licensees in the retail business. Same
is the case with regulatory assets. Utilities in Delhi
for example have several thousands of crores in
recognized regulatory assets, which they have not
been allowed to amortise and recover. These assets
and liabilities would need to be suitably allocated to
the unbundled utilities.
• As per the recommendations of the Forum of
Regulators, to deal with this problem, a Special
103
Purpose Vehicle (SPV) should be created and all
such assets and liabilities should be vested with it
and a Regulatory Surcharge could then be levied
on all consumers (of incumbent Discom as well
as competitive supply retailers) which would go
towards the SPV till such losses are made up for.
Allocation of distribution losses
• Similarly, the allocation of distribution losses
would also pose a problem. It may be argued that
technical losses would be greater on account of
retail licensees with higher allocation of customer
load, while it should be lower on account of smaller
retail suppliers. Although this makes technical
sense, practically it is very difficult to implement
as consumers would keep shifting from one retail
licensee to the other over billing cycles. Hence a
mechanism to allocate losses between the retailers
and the wires licensee would need to be evolved.
This is especially relevant considering the poor
metering condition of most distribution utilities in
the country. Under the present metering levels, it
would be very difficult to segregate the wheeling
(technical) losses and the retail (commercial) losses.
Hence suitable steps towards effective metering at
all voltage levels also need to be initiated to mitigate
this.
104
Operational difficulties
• In the initial transition years of retail competition,
consumers would either have to be provided with
smart meters able to record their real time demand
or it would have to be ensured that all consumers
on one feeder belong to a single retail licensee.
This is due to the fact that, if consumers do not
have smart meters, the retail licensees would not
be able to selectively impose load restrictions on
their own consumers alone and the effect of load
shedding by the incumbent licensee would have to
be unnecessarily borne by other consumers as well.
• Such a metering infrastructure would entail huge
capital investments by the retail licensees and might
impose unwarranted fiscal burden on the sector
as a whole. Hence, before the complete roll out
of retail competition in distribution, there should
be deliberations on finalizing such operational
protocols. Some of the options are
(a)have a phased roll out (large consumers initially
and subsequently smaller consumers),
(b)restrictions be imposed on consumers to bear
with load shedding of the incumbent licensee in
the transitions years or
(c)some other mechanism
PPP in Distribution
• T he advent of private sector efficiencies in the
power distribution business, especially in the
form of distribution franchisees in the recent
past, has yielded substantial benefits to utilities
in achieving rapid loss reduction. This has also
improved customer service levels. The entire model
has therefore been of immense relevance to the
distribution utilities struggling with operational and
financial difficulties, given their present level of
performance.
• Ensuring operational independence, efficiency
improvement and commercial functioning of the
electricity distribution segment has been one of
the core objectives of the power sector reforms
process adopted in the country. Unbundling,
corporatization, privatization as well as distribution
franchisees have been attempted to attain
realization of these objectives. Nevertheless, all
of these initiatives have varied in their outcomes
significantly. The two most important parameters
on which such structural interventions get evaluated
are the associated political will and efficiency gains.
As the figure alongside demonstrates, when political
acceptance is the main determining criteria, the
states tend to follow the corporatization route. On
the other hand, when the objective is to achieve
quick efficiency gains, states tend to move towards
outright privatization. Considering the political
fallout of the privatization route, State Governments
across the country are usually rather cautious in
traversing this path. The middle path, more often
than not, is adoption of the distribution franchisee
model which brings with it the key benefits of
Political Acceptance
High
Corporatization
SEB driven
Reforms
Distribution
Franchise
privatization while retaining Government control in
the long-run.
• The schematic shows a generalized representation
of the obstacles faced and the outcomes in terms
of efficiency gains achieved from past cases of
corporatization, privatization and franchising
experiences in the power distribution segment.
For instance, the outcomes of the privatization
experience in Odisha and Delhi are perceived
completely differently by stakeholders. While Delhi
has seen exemplary outcomes in terms of efficiency
improvement/ loss reduction, infrastructure
expansion and customer service improvements, the
privatized utilities in Odisha have been struggling
to demonstrate comparable tangible outcomes.
Similarly, even franchising across states and cities
has been seen to yield varied results.
• There has also been considerable stakeholder
debate on the appropriateness of privatization vs.
the distribution franchisee route for bringing in
private sector efficiencies in the power distribution
segment. The Task Force on Private Participation
in Power Distribution constituted by the Planning
Commission of India, under the Chairmanship
of B.K. Chaturvedi has also come up with a new
PPP Model which attempts at overcoming various
Avenues for Private Sector Participation in
Power Distribution
Privatization route (Sale
of Shares in
Corporatized Licensees)
Distribution Franchisee
Route (under DFA)
• Perpetual arrangement
through sale of majority
(>51%) shareholding in
corporatized
distribution licensees
• Privatization of
Distribution licensees
(Orissa & Delhi)
• Bhiwandi Model of
Urban Distribution
Franchisees typically a
15 year contractual
arrangement;
• Hybrid 5 year model as
in CESU, Orissa;
• Rural Franchisees;
PPP Route (Under
Concession Agreement
+ SERC Regulations)
• PPP Model a
combination of
Licensee and DF
model
• Not tested so far,
though initiated in
some states (UK, UP
and Assam)
Privatization
Low
Efficiency
105
shortcomings of both, absolute privatization as well
as the distribution franchisee route.
• It is pertinent to note that both privatization
and distribution franchisee routes have already
been tried out and there is ample documentation
available in the form of case studies and learnings,
while the PPP Model has not been implemented in
any case so far. Nevertheless, several states have
shown enthusiasm and the model is already under
various stages of inception for identified areas in
the states of Rajasthan, Assam, Uttar Pradesh,
Uttarakhand and Jammu & Kashmir.
• Despite the ongoing debate on the best model
for securing private participation in the sector, the
benefits of PPP in distribution have never been
contested and it has remained an important agenda
of successive Central Governments. As has already
been mentioned, private participation in distribution
has been for long considered as one of the most
effective solutions to resolving the efficiency issues
in distribution. The private distribution utilities
in Kolkata, Mumbai, Surat and Ahmedabad with
their exemplary performance on efficiency and
customer service measures were projected as
obvious examples of private efficiencies in the Indian
environment.
• Citing the experience of these legacy utilities, in
the early reform period, the thrust was on outright
privatization. But, since the success of the Bhiwandi
distribution franchisee, utilities have been more
amenable to working on a franchisee model
which does not involve the political risks of the
privatization route. A look at the timeline of private
participation in the country demonstrates that the
distribution franchisee route is increasingly being
adopted by utilities across the country to secure
private participation.
• Each of the modes of securing private participation
as listed above has its own set of pros and cons
which need to be evaluated by the individual utilities
on their own, in respect of their requirements. The
same have been discussed in the subsequent pages.
PPP through privatization: Orissa & Delhi
experiences
• The privatization exercise in both Orissa and Delhi
was taken up by the respective state governments
with the following key objectives:
(a)To give the power sector the autonomy by
106
Pre Reforms
1999
2002
• Delhi Distribution
Privatization
• Reliance: 2
Discoms
• Tata: 1 Discom
2007
• Bhiwandi
Distribution
Franchisee (DF)
• Torrent Power
• Operational
• Dewas
• Dainik Bhaskar
• Scrapped
2009
• Kolkata: CESC
• Ahmedabad: AECL
• Mumbai: BSES
• Surat: TPC
• Odisha Discom
Privatization
• Reliance: 3
Discoms
• AES: 1 Discom
• AES moved out,
OERC managing
operations now
2010
2011
2012
2012
2013
• UP Distribution
Franchisee – Agra
and Kanpur
• Torrent Power
• Agra: Operational
• Kanpur: Put on
hold
• Maharashtra DF–
Nagpur,
Aurangabad,
Jalgaon
• Nagpur :Spanco
• Aurangabad: GTL
• Jalgaon: CGL
• Operational
• MP DF – Gwalior,
Sagar, Ujjain
• Smart Wireless
awarded all 3
• Operational
• Jharkhand DF –
Ranchi
• CESC
• Odisha
Subdivisions DF –
15 subdivisions
franchised
• Operational
• Enzen, Feedback,
• Jharkhand DF –
Jamshedpur
• Tata Power
• Not Operational
• Bihar DF –
• Muzzafarpur: Essel
Ltd
• Bhagalpur: SPML
• Gaya: DPSC
keeping it away from Governmental control/
influence;
(b)To attract private sector finance on a sustainable
basis in the sector; and
(c)To introduce competition in the power sector.
• In case of Orissa, one of the main reasons for the
failure of the privatization exercise was that the
OERC, the distribution companies and the State
Government were not on the same page. The
biggest contributor was possibly the erroneous
assumption on opening level T&D losses made
by the State Regulator. A starting T&D loss level
of 43% was considered for FY1998-99, which
was essentially from a forecast in a World Bank
preparatory document (Staff Appraisal Report,
1996). Assuming an opening T&D loss level of 43%,
OERC set a target of 35% for FY1999-00, which
it considered achievable. Although it was later
established that the starting loss levels were closer
to 51%, it was not effectively represented before
OERC.
• Further, although the actual higher loss levels were
later recognised by OERC for subsequent years, it
strangely held firm on targets at 35% and below
for subsequent years, making it virtually impossible
for the distribution utilities to be profitable. In
nominal terms, there were no tariff increases over
long periods (2001-2006, etc.), resulting in crippling
effects on the distribution network, which was
starved of capital investments. After the privatization
exercise, the State Government too did not provide
any active support to the private investors in making
investments work.
• Another important factor that impacted the
privatization exercise in Orissa was the industrial
development in the state. At the time of
• Odisha
subdivisions DF –
Khalkote, Rambha,
Jajpur,
Dharamshala
• Enzen
• Operational
privatization, Orissa had several industrial investment
proposals lined up in the state with power demand,
particularly in the subsidising industrial and
commercial categories, forecast to grow at a healthy
rate. Instead, macroeconomic factors like industrial
recession in the late 90s as well as local factors like
increase in captive capacity due to uneconomic
industrial tariffs, combined to make industrial
demand from Distribution Companies to remain flat,
up to a decade post reform.
• On the other hand, unlike the Orissa privatization
exercise, Delhi had the experience of Orissa to learn
from. When the Govt. of National Capital Territory
of Delhi (GNCTD) undertook the electricity sector
reforms, it tried to rectify the mistakes of the Orissa
exercise and took the below mentioned steps to
correct the mistakes:
(a)Fixing achievable improvement targets during
the initial years of the transition period kept
the focus on efficiency improvement alive in
the entire process. Efficiency improvement/
reduction in losses was considered as the
biggest measure towards reducing cost of
supply to authorized customers and thus
contributing towards avoiding the need for any
tariff increase. Unlike the Orissa exercise, where
the regulator had fixed practically unachievable
targets, Delhi allowed the bidders to arrive at
targets through consensus and also brought on
board the DERC.
(b)Transition support by the GNCTD totalling to
Rs.34.5 billion during the first five years of
existence of the private utilities helped the
private utilities avoid the cash crunch they
would have otherwise faced during the initial
years when the efficiency levels were extremely
poor, as was the case in Orissa.
(c)Following an inclusive approach by bringing
the regulator, government and other key
stakeholders on the same page and ironing
out of the likely issues helped to prevent
pitfalls during the transition period. Making the
bid parameters binding on the DERC for the
purpose of tariff determination was amongst
the key measures for building/ensuring investor
confidence in the privatization process, which
was lacking in Orissa.
(d)There were several other factors which acted
in favour of the process including transferring
of land to licensees at a nominal cost, assets
pertaining to respective discoms were
transferred to them in the form of share capital
in the form of a loan with a moratorium of four
years, 85% liabilities were kept in the holding
company and a mechanism was put in place for
collection of DVB period arrears.
• However, despite the success of Delhi, it is unlikely
that any more privatization initiatives would be
taken up in the country in the near future. This is
because of the development of franchisee and PPP
models which despite offering almost all benefits
of privatization, fall short of complete privatization,
thus obviating or significantly reducing any
opposition on the political/employee front.
Distribution franchisee: a viable alternative
• A
s has already been stated, most state distribution
utilities across the country have been facing a
multitude of problems like high loss levels, ageing
and shrinking workforce, inadequate investments,
lack of focus on IT, ever increasing gap in consumer
expectations and delivery etc. Although privatization
was sought to address most of the above issues,
the immense political opposition to it and employee
sensitivities make it a difficult proposition. Moreover,
considering that the Orissa experiment is regarded
as a failure, it has also become clear that transferring
control to a private party alone is not sufficient to
improve performance.
• These bottlenecks in pursuing privatization, in a way,
forced the utilities to explore less sensitive options
for inviting private participation. The breakthrough
came with the Bhiwandi franchisee by MSEDCL
being successfully implemented. The franchisee
initiative was perceived as politically neutral, though
it did face some degree of opposition from the
employees. The policy and regulatory framework
of the country also allows the distribution licensees
to appoint franchisees in their areas of operation to
bring in efficiencies.
• The franchisee model allows private players to
bring in investments and approach loss reduction
strategies without external interference, unlike state
owned utilities which have to face considerable
political influence on their operations. At the same
time, the ownership of the venture rests completely
with the licensee, obviating any political concerns.
107
Considering these benefits, over the last decade
several states have initiated franchising activities,
adopting models most suitable to their respective
needs. The table below summarizes the different
franchisee models which have been adopted across
the country:
Model
Responsibility
Revenue/ Business Model
Pure Collection
Franchisee
• R
evenue Collections, disconnections/
reconnections;
• M
argin/ percentage
• Franchisee focuses primarily
on collections on
on collection efficiency
achievement of target;
• Incentive/ disincentive for
over/ under achievement
Revenue Franchisee Collection Based
• R
evenue Cycle Management - Billing, revenue
collection, disconnection/ reconnection;
• Complaints redressal;
• New connections release;
• M
argin/ percentage
• Franchisee not partner in T&D
on collections on
loss reduction.
achievement of target;
• Franchisee focuses primarily
• Incentive/ disincentive for
on collection efficiency.
over/ under achievement
Input Based Franchisee
• R
evenue Cycle Management - Billing, revenue
collection, disconnection/ reconnection;
• Complaints redressal;
• New connections release;
• E nergy supplied is
measured at 11 KV
feeder level/ DT level;
• Franchisee pays utility
at a prefixed tariff on
energy input
• F ranchisee is a partner in
AT&C loss reduction.
O&M Franchisee
• R
evenue Cycle Management - Billing, revenue
collection, disconnection/ reconnection;
• Complaints redressal;
• New connections release;
• O&M of downstream network
• E nergy supplied is
measured at 11 KV
feeder level/ DT level;
• Franchisee pays utility
at a prefixed tariff on
energy input
• F ranchisee is a partner in
AT&C loss reduction.
• Franchisee also contributes to
reliability of power supply;
Rural – Electric
• Society funds, owns and operates distribution
Co-operative Franchisee
system;
• Entire Consumer related activities;
• E nergy supplied is
measured at 11 KV
feeder level/ DT level;
• Franchisee pays utility
at a prefixed tariff on
energy input
• U
sually needs State
authorization;
• Is responsible for all facets of
distribution in the given area.
Distributed Generation
Based Franchisee
• T he franchisee runs
an independent
business model with no
transaction taking place
with the incumbent
distribution licensee.
• Is mostly used in areas
which are far from Grids and
not feasible/ viable to be
connected.
• F ranchisee funds, owns and operates
generation and distribution system in remote
areas not connected by Grid.
• Entire Consumer related activities;
• A
mong the above models the one that has
increasingly been adopted by different states is the
urban input based franchisee model. Agra-Kanpur
in UP, Nagpur-Aurangabad-Jalgaon in Maharashtra,
108
Remarks
Gaya-Muzaffarpur-Bhagalpur in Bihar, UjjainGwalior-Sagar in MP have already been awarded
to successful bidders based on the above model.
In this model, the urban areas are distinguished
from the rural ones by their significantly higher
load and network density and the presence of high
consumption – high tariff consumers. The Urban
areas owing to their subsidizing/high tariff mix
are more likely to be sustainable areas and thus it
becomes feasible to structure full service franchisees.
• N
evertheless, utilities have faced issues in attracting
credible bidders and awarding distribution
franchisees, even in areas offering high potential for
improvements. In a few cases, even with multiple
rounds of bidding, credible players have not shown
interest. In several others, the bidders have refused
to take over franchisee areas even after award. The
figure below provides a snapshot of the various
areas offered under franchising and their perceived
attractiveness to the potential bidders.
80%
Janjgir-Champa
Jalgaon
70%
Bhagalpur
AT&C Losses (%)
60%
Bhiwandi
Roorkee
Gwalior
Muzaffarpur Sheel-Mumbra-Kalwa
50%
Sagar
Dhanbad
Ujjain
Kanpur
Ranchi
Gaya
40%
Rudrapur
Agra
Jamshedpur
30%
Nagpur
20%
-
500
1,000
• T he above graph captures the AT&C losses vis-à-vis
the energy input to the franchisee area. The sizes of
the circle indicate the quantum of energy loss in the
area. Thus areas having high energy input and high
AT&C losses (and as a consequence high quantum
of energy lost) should have been more attractive to
the bidders. However, as the above graph shows,
in several large areas like Kanpur, Patna, Ranchi,
Jamshedpur, Dhanbad distribution utilities have
Patna
Aurangabad
1,500
Energy Input (MU)
2,000
2,500
3,000
faced problems in appointing franchisees. At the
same time, smaller areas with lesser perceived
financial gains like Gaya, Muzaffarpur, Bhagalpur,
Sagar etc. were awarded with relative ease.
• Hence the attractiveness of areas is not determined
by the potential of financial gains alone but also
by how the risks associated with the venture
are mitigated by the licensee in the RFPs.
The distribution business works in a business
109
environment where a large number of retail/small
consumers have to be serviced. This attribute of
dealing with a large number of retail consumers
not only imposes operational challenges but also
exposes the distribution utilities to direct socioeconomic and political risks. Due to the politically
sensitive nature of electricity tariffs, several utilities in
the country have not been allowed to recover their
legitimate expenses for years altogether, which has
turned them into financially sick entities. Additional
risks of dealing with the menace of theft/ pilferage
of power, facing public outrage due to widening
of demand-supply gap and multiple stakeholders
expectations etc. are some of the routine challenges
faced by the distribution utilities. While the
franchisee becomes the public face of a licensee in
its given area, several aspects of the business viz.
tariff related matters, dealing with demand-supply
gap etc. remain reasonably beyond its control.
• Therefore, the risk allocation matrix and the nature
of residual risks with the franchisee, are important
determinants of their attractiveness for private
investors. Cases where a balanced approach to
risk sharing is adopted and suitable risk mitigation
measures are put in place through the proposed
contractual arrangements, are likely to attract
more and serious bids. The table below provides a
summary of the key risks associated with the urban
distribution franchisee model, as has been learnt
from past experience:
Risk
Description
Supply Security
Growth pattern of consumption is a decider in the energy requirement of the franchised area, which is uncertain and
cannot be estimated accurately over the tenure of the franchisee arrangement. If the growth is higher and the energy
requirement goes beyond the committed energy input it would pose a high risk to the Distribution Franchisee.
External Power
Purchase
Although there can be an option of external power purchase if it is provided by the utility in the DFA/RFP, it should
be kept in mind that the rates at which power is available in the open market is highly dynamic and dependence on
external power purchase for requirement over and above that committed by the utility may pose a tariff challenge.
Baseline Data Quality
The loss target defined is dependent on the baseline distribution loss. Losses claimed by the utility in the RFP document
might be much lower than the actual losses due to under reporting. If this baseline loss gets changed and goes up
then the achievement of the target would be very difficult.
Distribution Loss Target
An optimistic and yet achievable loss reduction trajectory based on a factual assessment of the underlying issues
is essential for utilities while setting out mandatory targets in the DF bid documents. Proposing unrealistic targets
will either shun experienced bidders from such cases or render the franchisee unviable, which are both undesirable
outcomes for the utilities.
Investment plan
The investment plan is estimated based on the cost effectiveness of loss reduction measures and capacity creation for
meeting the anticipated demand growth in the franchisee area. Adequacy of the proposed capital investments as well
as the timeliness of its expenditure to yield the intended outcomes is a critical determinant of the private investors’
ability to match up with its financial forecasts considered at the bid stage. The sharing of risks arising out of factors
beyond reasonable control of private investors such as the following becomes crucial:
• delay in accord of regulatory approval to proposed investment plan;
• delay in disbursement of funds towards capital works committed under RAPDRP/ RGGVY etc.; and
• difficulties in availing necessary clearances and approvals for carrying out various works etc.
110
• T he manner in which the above risks have been
dealt with have had serious implications on the
success of the bid process as well as performance
of the operating franchisees. The following chapter
provides a detailed review of the urban distribution
franchisee experiences in the country.
PPP Modle of the Planning Commisison
• The franchisee models have yielded encouraging
results for distribution utilities in several states.
However, it is widely felt that the same cannot form
the basis for attracting private sector participation
in the power distribution sector in the long-run
because of the following reasons:
(a)The input based franchisee model is suited only
for high loss areas and is not suitable for utilities
which want to attract private sector involvement
for improving upon customer service levers in
areas/ towns which are already performing well
in terms of AT&C/ T&D loss levels.
(b)The commercial arrangement in the input
based franchisee model discourages the
private operators from making any significant
investments in the network infrastructure
towards the latter years of the contract period.
This has already been witnessed in some of the
input based franchisees which are nearing the
end of their contract period.
(c)Several utilities demanded unrealistic loss
reduction targets/reserve prices in the DF bids
which has restricted participation of experienced
players in the sector.
(d)The ability and the capacity of the utilities
to take back the DF areas at the end of the
contract period (typically 10 – 15 years) is
uncertain and may pose significant difficulties.
(e)Limited scope for independence in power
purchase and absence of direct interface with
the regulators is expected to limit the private
operator’s ability to add value over a long-term
horizon.
• In view of the above, the Government of India
constituted a task force under the Planning
Commission to study the existing model and
propose alternative models for incentivising private
investments in the sector. Post analysis of the
Franchisee model as adopted by a few States,
the task force suggested that the shortcomings
of the DF model can be addressed by appointing
a concessionaire under the PPP mode. The
concessionaire would be appointed through a
competitive bidding process for a period of 25 years
and the bid evaluation would be on the viability
gap funding required by the concessionaire or the
premium offered by it.
• Under this PPP model the selected concessionaire
is required to obtain a distribution license, thus
allowing the private party to make investments
and secure regulated returns. It also allows the
concessionaire to secure power form its own
sources for supply to its area. All other aspects of
this model remain similar to the DF model for all
practical purposes.
• The key benefits of the PPP Model over the
distribution franchisee model and conventional
privatization are:
(a)The private operator would have full flexibility in
all matters concerning the distribution business
in the area, including tariff, power purchase
and capital investments, and would be directly
answerable to the concerned SERC.
(b)The Model gives long-term sustainability and
visibility to the private operator.
(c)The Government would continue to hold control
over the private operator under the terms of the
concession agreement and the golden shares
proposed to be held in the SPV.
(d)The model can be equally useful for areas with
any consumer mix, geography or baseline loss
level.
• It is to be noted that none of the states have yet
tested the PPP model proposed by the Planning
Commission. Hence it would be difficult to
comment on the practical issues that are likely to be
faced during the implementation phase. The states
of Jammu & Kashmir, Uttar Pradesh and Assam
were reported to be actively considering award
of identified areas to private developers under
the PPP route. However, not much progress has
happened so far. UPPCL had initiated a process for
appointing consultants for project formulation and
undertaking various preparatory activities for award
of Ghaziabad, Meerut, Kanpur and Varanasi. But,
the process was called off due to stiff resistance
from employee unions.
111
PPP Model vs Franchisee Model
• A comparison of the PPP Model with that of the
franchisee model on various parameters is tabulated
below:
Parameters
Distribution Franchisee
PPP Model
Term of Agreement
• Fixed Terms for 10/15/ 20 years
• Extension might be challenging since input rate is
determined only for the term of the agreement;
• Proposed for a term of 25 years;
• Provision for extension by 10 years;
• Being a SERC regulated entity, extension is
expected to be smooth;
Choice of Area
• E asier and flexible to configure any potential area
into a proposed area for franchisees
• E asier and flexible to configure any potential area
into a proposed area for PPP
Responsibility
•
•
•
•
•
• All responsibilities as a distribution licensee;
Regulatory Recognition
• Franchisee is answerable only to the licensee
• C
oncessionaire to assume the role of a licensee
and shall be regulated by the respective SERC;
Ability to terminate, in
events of default
• L icensee free to terminate DF contract at any
point
• G
overnment may terminate concession agreement
in event of default.
Binding Efficiency
Improvement Targets
on Private Player
• L icensee sets targets at the transaction stage;
• The model isolates the licensee from the actual
efficiency levels once the input rate is determined
through the competitive bidding process;
• B
inding targets may be agreed at the transaction
stage itself.
Employee Handling
• E mployees have the option to work for the
Franchisee or remain with the licensee.
• E xisting Employees transferred to new licensee;
option for Voluntary Retirement Scheme (VRS)
may also be given.
Method of
remuneration
• T he DF earns margin between input rate and retail • Regulated returns as may be approved by the
tariff
Regulator;
• Franchisees margin/ return is unregulated;
Power Purchase/
Energy Input
• E nergy input to be arranged by licensee;
• Provision for additional purchase by the
franchisee through the licensee.
• P PAs to be assigned to the Concessionaire/ Special
Purpose Vehicle (SPV) for the specific area;
Capital expenditure
• F ranchisee to meet the minimum specified Capex
during the initial few years of operation (generally
the first 5 years);
• Investments likely to diminish with the maturity of
contract due to the reducing RoI.
• C
oncessionaire to make investments during the
initial years in accordance with the terms of the
concession agreement, subject to regulatory
approvals;
• Capital investments expected to continue over
the term of the agreement as the concessionaire
would continue to earn returns on the same,
subject to regulatory approvals;
112
Power Purchase (optional)
Capital Expenditure
Operation & Maintenance
All revenue cycle activities
Customer Handling
• A
s can be seen from the above comparison, both
the models have a pros and cons. In terms of dealing
with employees and the efficiency targets to be
achieved, both the models are similar. However,
on several other parameters, the PPP model offers
significantly greater flexibility to the bidders. As an
example, in the PPP model the concessionaire is free
to procure power to ensure round the clock power
and can also make capital investments in tune with
its requirements. The model also offers longer terms
for the concession agreement, which is perceived
to be easier to extend once the contract period is
completed. These advantages of the PPP model make
it more attractive and potentially, offers a sustainable
route to private participation in power distribution.
• On the other hand, the risk-return profiles of the
two models differ widely. In the case of the DF
model, the investor can achieve above normal
returns in the first few years through accelerated
AT&C loss reduction (greater than the target
efficiency levels). However, in the case of the PPP
model, this will not be possible as returns are
regulated by the concerned SERC. Nevertheless,
the franchisee model is, by far, a significantly riskier
business in comparison to the licensed business
envisaged under the PPP route.
Key challenges in attarcting private participation
in power distribution
Challenges in distirbution franchisee
Quality of baseline data
• In the recent bids called in Jharkhand and Bihar, the
quality of baseline data was of significant concern.
Since the bidders base their bids on key parameters
like average realization, revenue, total sales etc.,
any doubt on the accuracy of these figures has the
potential of jeopardizing the entire bid process with
the parties entering into unnecessary litigation.
• In the recent bids in Jharkhand, the third party
audit of the information submitted by the
erstwhile JSEB could not be completed due to data
deficiencies. Likewise, franchisee areas like Agra,
Gwalior, Kanpur and Nagpur faced similar issues.
Therefore, an accurate baseline is an absolute
must for running a successful bid process. The
power distribution business is itself a significantly
risky business proposition considering the present
business environment of the segment. By providing
poor/wrong information such risks get further
heightened.
Employee and customer sensitivities
• Adequately addressing employee sensitivities in
franchising/PPP initiatives has continued to prove
difficult. Strong opposition from employees of the
JSEB has been able to indefinitely delay the DF for
Ranchi and Jamshedpur areas. Delhi, Agra & Kanpur
too witnessed similar opposition. Although most
RFPs claim to offer a choice to employees in terms
of joining the franchisee or staying with the state
utility, lack of open communication lines muddles
the perception of the employees. A standardized
approach that satisfactorily addresses the concerns
of employees needs to be outlined, which could be
followed for any of the future PPP initiatives.
Lack of clarity on regulatory treatment of
investments by franchisee
• The input based franchisee model allows the DF to
make investments in the franchisee area. However,
there is a lack of clarity on regulatory treatment
of such investments. All franchisee RFPs mandate
that at the end of term all such assets would be
transferred to books of accounts of the licensee at
their residual value. But during the DF term, can the
licensee earn RoE on these investments? Also, while
the benefit of the assets is accruing to only those
consumers residing in the franchisee area, their cost
is being shared by the entire consumer base through
the ARR and tariff setting mechanism. These
questions are open ended and need to be addressed
through appropriate legal and regulatory measures.
Smaller number of players
• The number of credible private players interested in
the sector is limited and several have already taken
up franchisee areas in different states. The need is to
help develop more players to increase competition.
Vendors who have been engaged in electrical
execution related works over several years and
have an understanding of the sector can emerge
as potential players in the power distribution
segment as well. With the impending segregation
of wheeling and retail supply business, such players
who have developed capabilities in understanding
the distribution business would help bring about
real competition at the retail level. This is likely to
result in efficient delivery to the end consumer.
Standardization of bid documents
113
• T he MoP had come out with the standard bidding
document for input based urban franchisees in
2012. The said document was also adopted by
the Bihar utilities in the recent bids for Gaya,
Muzaffarpur, Bhagalpur and PESU area. However,
even in rural and peri-urban areas, significant
efficiency gains could be achieved by carving out
a mix of large rural and urban areas. This has been
done in Orissa by CESU and in Jharkhand by JSEB.
• Such smaller franchisee initiatives can be taken
up in a short time and do not require extensive
preparation. They also do not face significant
opposition from either employees or consumers.
At the same time, they help the utilities by bringing
in technical and operational best practices, which
can be scaled up by the utility in non-franchisee
areas as well. States like Jharkhand have even been
experimenting with their bid documents for such
areas, having to revise the same thrice in less than
a year, learning from their experiences. Hence
standard bidding documents for such rural-urban
mix areas would go a long way in helping utilities
appoint distribution franchisees for smaller areas.
Treatment of subsidy
• In any franchisee initiative, a large number of
consumers belong to the subsidized categories.
Considering that most franchises have been
awarded for periods upward of 10 years, the
subsidy regime can change over the period of the
distribution franchise term. Moreover, such changes
are largely determined by the orientation of the
political dispensation in power. Hence, decisions
on discontinuation or announcement of additional
subsidies can have huge implications for the revenues
of the DF. In the DF bids called by the various state
utilities till now, such subsidies have not received a
uniform treatment. While some states have called
for bids inclusive of subsidies, others have called for
bids net of subsidies. As an example, if bids are called
inclusive of subsidies, and a populist dispensation
announces huge subsidies for consumer categories,
the distribution utility would gain substantially
but, the entire burden would be passed on to
the distribution franchisee, in a way ensuring the
failure of the franchise. A uniform approach on the
treatment of subsidies would thus help the potential
bidders hedge their risks more efficiently.
Challenges in Privatization and Planning
114
Commission PPP model
• In view of the impending segregation of retail
and wheeling business, it is highly unlikely that
any privatization exercise in distribution would
be taken up by the State Governments at this
juncture. Therefore, the available options today are
the DF model and the PPP model of the Planning
Commission. The DF model of private participation
in power distribution has been adopted in several
instances and hence, its pros and cons have been and
understood to a reasonable extent. The PPP model
floated by the Planning Commission however, is yet
to be adopted anywhere in the country and hence,
the practical difficulties associated with it are likely to
become apparent only after we see it being applied.
A comparison of the divergence of views on the two
models however is listed in the box below.
Shunglu Committee Vs BK Chaturvedi Report
A task force was framed by the Planning Commission to examine and evolve the
framework for the franchisee and PPP Models. Chaturvedi panel favoured PPP
model over distribution franchisee model or privatization model of Delhi for private
participation in power distribution sector. Chaturvedi panel pointed out:
•Franchisee model is incapable of bringing adequate capital investments
•Franchisee model would not ensure quality and quantity of supply, competition
and open access
•Franchisee model will not ensure financial stability of the sector
•Franchisee is not required to obtain a distribution license hence outside purview of
SERCs
•Franchisee model suffers from legal issues that restrict the purchase of power from
market
The panel recommended public private partnership model in the distribution of
electricity as consistent with Electricity Act 2003 and a way forward. It suggested
that the concessionaire selected through competitive bidding would be responsible
for maintenance, operation and upgrading of the distribution network. It
recommended enough flexibility to concessionaire to procure bulk power from
market at competitive prices. The panel also observed that the PPP Model would
enable limited resources funding by financial institutions and viability gap funding
support from government
The Shunglu panel which came out with its report after Chaturvedi report contested
its claim and questioned the financial and administrative viability of the PPP model. It
pitched for Franchisee model. According to Shunglu panel:
•Success and legality of franchisee is proved in Bhiwandi;
•Franchisee is accountable to licensee which in turn accountable to SERCs
•Torrent Power has brought 100 Cr of Capex in Bhiwandi every year hence DF is
capable of bringing in Capex
•PPP Model would cause tariff anomaly in state and reduce number of participating
companies which would further hinder competitive bidding and necessitate capital
support from government
•PPP would complicate assets sharing between government and private player.
Meanwhile many states like Maharashtra, Karnataka and Andhra Pradesh have
objected the suggestions of Chaturvedi panel citing successful implementation of
franchisee model in Bhiwandi.
Furthering Energy Efficiency
115
“To meet the demand of the
present generation, without
compromising the need of the
future generation…” – this
World Business Counsil for
Sustainable Development’s
vision has compelled us to
think for our future generation
and thereby optimally utilize
resources across various
development initiatives.
116
Executive Summary
To ensure countries economic development an access to
cost effective commercial energy is necessary. In India
an increasing urbanization and industrialization both
created greater demands for energy with high levels of
transportation (of people and goods) and other energy
intensive industrial services. The energy requirement
would be driven further by India’s urban agenda of
creation of 100 “Smart Cities” in industrial corridors.
With rising energy demand and cascade increase in
energy import bill as well as detrimental effects of
fossil fueled energy on local and global environment
constraints the further economic developments.
Realizing the growing challenge of climate change
and energy security and its likely impacts on the
Indian economy, GoI initiated policy initiatives through
various missions under National Action Plan on Climate
Change (NAPCC) for more sustainable development
by addressing energy efficiency. Despite of GoI
initiative, contribution form end use energy efficiency
improvements is constrained due to key challenges &
barriers other than the cost-effectiveness of efficiency
measures. To ensure appropriate policy support for
energy efficient technologies to achieve its full potential,
barriers and key challenges in implementing end use
energy efficiency need to be identified. In this context,
this paper intends to raise the backdrop for three sub
areas of ‘Industrial Energy Efficiency (Perform, Achieve &
Trade (PAT) Implementation)’, ‘Reducing oil dependence
in transportation’ & ‘Smart Cities and Energy Use’.
Industrial Energy Efficiency through PAT
To promote industrial energy efficiency, the "Perform,
Achieve and Trade" (PAT) mechanism is an innovative
and challenging initiative introduced under National
Mission on Enhanced Energy Efficiency (NMEEE). The
PAT mechanism assigns energy efficiency improvement
targets to the country's most energy intensive industrial
units. Industrial units that achieve savings in excess of
their target will be issued Energy Savings Certificates
(ESCerts) for saving in excess of target. Units that
underperform can buy these ESCerts to meet their target
compliance requirement or to pay penalty. This will
ensure that the total desired savings are achieved in the
most cost effective manner.
With first PAT cycle over the three years period from
Apr 2012 to Mar 2015, 477 Industries from 8 different
industry sectors are notified as Designated Consumers
(DCs) under the provisions of Energy Conservation Act,
2001.
With pretext of the broad bandwidth of specific energy
consumption (SEC) within each industry sector, targets
were set BEE for individual plants based on the trend of
energy consumption and energy-savings potential of the
plants. The target setting approach adopted combines
the use of historical performance factors (installed
technology, raw material, and production) that places
the installation into one of multiple bands. It then uses a
benchmark approach to set targets within those bands.
Monitoring and verification of energy savings will
be conducted by BEE empanelled Accredited Energy
Auditors and an ESCert would be issued by Ministry
of Power/BEE for a one ton of oil equivalent of energy
savings achieved by the DC, over and above the
target savings. Each certificate will be unique tradable
commodity which will be traded in two exchanges i.e.
Indian Energy Exchange (IEX) and Power Exchange of
India (PXIL).
With an intention to identify key issues and challenges,
the international energy efficiency / emission trading
schemes similar to that of PAT are also analyzed in detail.
The international energy efficiency/emission trading
schemes covered are comprised of European Union
Emission Trading Scheme (EU ETS)
Climate
Change Agreements (CCAs) &CRC Energy Efficiency
Scheme (CRC).
Reducing Oil Dependence in Transportation
Almost all of transportation energy use in India is in the
form of petroleum products, with 70% of diesel and
99.6% of petrol consumed by Transport sector alone.
Within transport sector, road transport accounts for 95%
of diesel consumption and 100% of petrol consumption.
This leads to a large drain of foreign currency resources,
and in political and economic tensions with oil-supplying
countries. The environmental costs of burning petroleum
products are also enormous. Ultimately, the cost of
utilizing petroleum products for transportation will
be prohibitively high, as the supplies diminish to
the point at which they are more expensive to
employ than alternative forms, and as the environment
continues to suffer. Implementing the improved fuel
117
efficiency measures for vehicles, shifting to alternative
fuels and control the vehicle population by modal shift
to public transport etc, could be the possible ways and
means to minimize oil dependence.
Understanding the facts, with a new government in
Delhi, India’s urban agenda is now focused on the
creation of 100 “Smart Cities” enabled with the latest in
technology and infrastructure.
In India, since 2006, National Biofuel Centre of the
Petroleum Conservation Research Association (PCRA)
focus on development of technologies for production
and utilization of bio fuels. In addition the new
government emphasized on blending of 5% ethanol
with petrol as green initiative.
A smart city uses information and communications
technology (ICT) to enhance its livability, workability and
sustainability to gives access to the comfortable, clean,
engaged, healthy and safe lifestyle with fundamental
infrastructure services and resources without
compromising the ability of future generations to meet
their own needs. Smart cities enable the efficient use of
natural, human and economic resources and promote
cost saving in times of austerity, and they are careful
stewards of taxpayer money.
For Improved fuel efficiency of vehicles, BEE has
proposed a “standards and labelling” initiative which
specify medium and long term fuel consumption
standards for new cars which would provide a regulatory
signal to manufacturers to continuously reduce the
average fuel consumption of cars sold by them over
the next 10 year period and the labeling of all new cars
that are sold in the market, with the labels providing
consumers with information on the fuel consumption of
a car model. Whereas internationally, many developed
countries have already introduced a wide variety
of policies such as voluntary targets and regulatory
standard programmes to accelerate the deployment of
more fuel-efficient cars and vehicle technologies such
as labelling for road vehicle tyres for maximum rolling
resistance limits as well as mandatory fitting of Tyre
Pressure Monitoring System (TPMS) etc. In addition to
this programs for improvements in driving techniques,
or eco-driving, has been taken up in India as well as
internationally to significantly improve on-road fuel
efficiency and CO2 emissions together with better safety.
With transport infrastructure unable to cope with
exorbitant vehicle growth, resulting in congestion, traffic
jams, and health impact, the incentives and policies
needed to promote public transport and goods transport
by rail instead of road needs to be identified. Some
possible steps could be facilitating ticketing between
different modes (viz an integrated rail-road ticket),
strategies for staggering office / school timings in urban
areas etc.
Energy is one of the eight prime responsibilities for
smarter city with ICT’s plays critical role in smart energy
and help cities to optimize these energy systems, making
them more efficient and more resilient. Implementing
smart energy systems also helps preserve precious
natural resources and gives residents, businesses and
cities themselves a whole host of ways to monitor and
control their energy consumption to save money in
following ways,
1. Using less energy - Smart energy makes it easier
to use wind, solar and other renewable sources, and
wastes less energy during transmission and delivery and
it gives customers tools to reduce their energy usage and
costs.
2. Decreasing reliance on nonrenewable energy
sources- Smart grids make it far easier for customers to
generate energy on premise (for instance, via rooftop
solar) and to trade energy back and forth with the grid.
3. Lessening energy operating costs - Smart energy
reduces operating costs compared to traditional
methods. Smart systems can also manage peak times
by briefly reducing demand (called demand response)
instead of building new standby power plants that will
only get used a few times per year, and can even dim
LED street lights to enable lower operating costs.
Smart Cities & Energy Use
With India urbanizing very fast, India needs to fi¬nd
smarter ways to manage complexities, reduce expenses,
increase efficiency and improve the quality of life.
118
As far as energy efficiency policy for Smart cities is
concern nothing has been initiated so far except some
initiatives by BEE and other stakeholders to promote
building energy efficiency through policy measures
such as ‘Energy Conservation Building Code (ECBC)’,
‘Leadership in Energy and Environmental Design (LEED)’,
& ‘Green Rating for Integrated Habitat Assessment
(GRIHA)’.
Key Issues & Challenges for Discussion
This section highlights the key issues in successful
implementation energy efficiency initiatives. The policy
makers & regulators, along with other market players,
needs to play pro-active role in addressing the key issues
currently faced by energy efficiency sector.
Industrial Energy Efficiency Through PAT
Reducing Oil Dependence in
Transportation
Smart Cities & Energy Use
Target setting based on banding approach may
present problems over time as there is no
provision to move the less efficient companies
“up” in the banding structure.
Challenges in Ensuring the Ethanol
Availability without Price Pinch to the
Consumers
How much energy does 100 Smart City upgradation
require? and is this energy available?
Inadequate Institutional Setup & Governance
Though Ethanol Blend is Cheaper per
Litre, It may Costlier per Kilometer
To build a comprehensive smart city plan will be
prerequisite to explore possibilities that Smart cities
actively seek ways to share ICT/other infrastructure
between city departments.
Banking of ESCerts have the disadvantage of
allowing PAT scheme to be “polluted” beyond
the first phase if there is a large overachievement by industry against phase 1 targets
The challenge is to promote public
transport.
As a Policy and Leadership supporting practice- To
develop energy smart city profiles by identifying the
most promising domains for energy efficiency
improvements for Indian Smart Cities.
High economic effort involved with Limited
Coverage Under PAT Cycle 1
High initial cost, the lack of clear
information and limited market
availability could be a constraint
for penetration of energy efficient
technology measures
Assessment of to what degree can developments in
Indian Smart city be influenced by the following
activities
Extending the PAT scheme: Broadening and
Deepening
Comprehensive, high quality
information through vehicle labelling
is a prerequisite for sound decision
making
Necessity to build and adhere to a multi-modal
transportation plan
Risk of leakage -that is, potentially newer plants
being built just below the qualifying threshold
under PAT.
Clarity on long-term action required
Conflict of interest between scheme
administrator/ regulator and scheme assessor
Financial support mechanisms
Synchronization between Targets Set by
Regulators and under PAT in case of Thermal
Power Station
119
Strategic Context & Background
Economic development requires increased access to
commercial energy in India, as increasing urbanization
and industrialization both create greater demands
for energy. Urban populations demand high levels of
transportation (of people and goods) and other energyusing services. Building and operating the urban
infrastructure and industrial and commercial facilities all
require energy, especially electricity and transportation
fuel. Rising living standards result in greater demands
for energy-consuming services, such as private
transportation and home appliances. Moreover, rural
electrification as well as energy access for all is a major
priority in India, where a small supply of electricity can
significantly improve living conditions.
In addition, with new government in Delhi, India’s urban
agenda is now also focused on the creation of 100
“Smart Cities” in industrial corridors. But the question
comes, how India will access the massive quantity of
energy needed to develop 100 smart cities?
The Analysis of sector specific energy consumption in
000 tons of Oil Equivalent from all sources of energy
is provided below as Figure1. As indicated, 50%
consumption is by Industry sector comprised of 62%
energy supply from coal and balance from other sources
of energy such as electricity, oil products etc. On the
other hand, transport sector consumption is 8% with
petroleum products as majority source of energy.
The dramatic oil price increases over last few years,
combined with rising interest rates and dollar
appreciation, ended the era of cheap energy for the
India with significant reliance on imports. Suddenly,
energy had become a constraint and it continues today
to constrain development in two areas: the economy
and the environment. The major economic constraints
include the foreign exchange demands for imported
oil and the capital demands for building new energy
production and distribution facilities.
While consumers in industrialized countries were
disrupted by the oil shocks, the high oil prices effectively
priced many developing countries out of the market,
depriving them of the fuel they need. Although the
current world oil market is very soft, this may be a
temporary aberration. The prospect of higher oil prices
makes the developing countries’ energy situation
especially precarious.
120
Figure 1: Sector Specific Energy Consumption for FY 2013
19355
Industry
Transport
77,086
Resedential
167,250
Commercial & Public Sector
Agriculture
Non-Specified/ Other
25,999
13,907
5,623
25,314
In the past, environmental issues have been considered
secondary to economic growth in developing and
industrialized nations. Recently, however, both local
and global environmental impacts have been
identified as a potential constraint to development.
Thus, one of the principal reasons for pursuing energyefficiency improvements is that energy consumption
leads to unescapable externalities, ranging from local
pollution and global greenhouse gases to energy and
nuclear security risks, that are not reflected in energy
supply costs and planning efforts. By mitigating these
problems with technical improvements that are costeffective relative to new energy supplies, innovative
energy-efficiency programs appear to offer a “win-win”
solution.
Realizing the growing challenge of climate change,
energy security and its likely impacts on the Indian
economy, the Government of India (GOI) released the
National Action Plan on Climate Change (NAPCC) in June
2008, with the objective of achieving a sustainable path
of development that simultaneously advances economic
and environmental objectives. The NAPCC enunciates
eight key National Missions guiding the country through
the climate change challenge, with a specific ‘National
Mission on Enhancing Energy Efficiency’ (NMEEE).
NMEEE as a key component of the NAPCC reflects the
GOI’s increased and renewed emphasis on achieving
energy efficiency in Indian economy. This Mission by
promoting innovative policy and regulatory regimes,
financing mechanisms, and business models seeks to
not only create, but also sustain, markets for energy
efficiency in a transparent and time bound manner.
End use energy efficiency improvements offer the
least expensive way to reduce energy shortages. Since
the fossil fuel reserves are finite and fast depleting,
sustainability in energy sector in future can be ensured
through adoption of large scale energy efficiency
improvements for different sectors. Over past few
years, in India, energy efficient technologies have been
promoted through R&D, demonstration projects and
other programs supported by government subsidies
and fiscal incentives. Despite off, contribution of energy
efficiency improvements is not much in the overall
energy scenarios. There are reasons other than cost
effectiveness, which act as barriers to the acceptance of
energy efficiency improvements for different end uses
of different sectors. All these barriers and key challenges
in implementing end use energy efficiency need to be
identified for proper designing of policies for helping
energy efficient technologies to achieve their potential.
With reference to above and in context of WEC-IEC
2015 conference to be held in New Delhi in January
2015, this paper discuss about on board energy
efficiency aspects across three sub areas below which
will have potential to impact future energy needs.
• Industrial Energy Efficiency (Perform, Achieve &
Trade (PAT) Implementation)
• Reducing oil dependence in transportation
• Smart Cities and Energy Use
This background paper is intended to lay the backdrop
and raise the relevant issues for furthering end use
energy efficiency across these sub topics above.
121
Industrial Energy Efficiency
through PAT
In its implementation plan, NMEEE seeks to upscale
the efforts to create the market for energy efficiency,
estimated to be about INR 74,000 crore. The Mission
seeks to create conducive regulatory and policy regime
to foster innovative and sustainable business models to
unlock this market. As a result of implementing NMEEE,
it is estimated that by the end of five years, about 23
million tonnes of oil equivalent (MTOE) of fuel will be
saved, a capacity addition of over 19,000 MW will be
avoided, and emissions of carbon dioxide reduced by
98.55 million tonnes annually.
Figure 2: No of DCs & Energy Consumption Threshold Level from Different
Sectors
NO OF DCS
Alumini …
Textile ,
90
Pulp &
Paper ,
31
The "Perform, Achieve and Trade" (PAT) mechanism
is an innovative and most challenging initiative
introduced under NMEEE to make improvements in
energy efficiency in energy-intensive large industries and
facilities more cost-effective by certification of energy
savings that could be traded.
Cement ,
85
Fertilizer , 29
PAT Implementation
The PAT scheme is founded on energy intensity i.e
specific energy consumption (SEC) rather than an
absolute measure of energy usage. The advantage of
an intensity-based scheme is that it allows absolute
energy usage growth while rewarding improved energy
efficiency.
Scheme Coverage
The genesis of the PAT mechanism flows out of the
provision of the Energy Conservation Act, 2001, (EC Act
2001). With provision under EC Act 2001, with Ministry
of power’s (MoP) notification issued on 2nd March 2007
under section 14 (e), Central Government as on 30th
March 2012 notified 477 energy intensive industries and
other establishments from 8 different industrial sectors
122
Iron
&Steel , 67
Thermal Power Plant
, 30000
Cement , 30000
Fertilizer , 30000
Iron &Steel , 30000
Pulp & Paper , 30000
1st PAT Cycle is of three years period from FY 2012-13
to FY 2014-15. The PAT mechanism assigns energy
efficiency improvement targets to the country's most
energy intensive industrial units with targets set in such a
manner that would reflect the current energy intensity of
the installation.
Industrial units that achieve savings in excess of their
target will be issued Energy Savings Certificates (ESCerts)
for saving in excess of target. Units that underperform
can buy these certificates to meet their target
compliance requirement or to pay a penalty.
Chlor -Alkali ,
22
Thermal
Power
Plant , 144
Textile , 3000
Chlor -Alkali , 12000
Aluminium,7500
0
5000
10000
15000
20000
25000
Energy Condumption Threshhold (toe)
as Designated Consumers (DCs) consuming energy
more than the threshold summarized as below,
Usefully, alongside major industrial energy consumers
(“downstream”) the PAT scheme includes large power
stations (“upstream”), as these are large users of
energy in their own right, and the application of a PAT
target served to provide an additional focus on energy
efficiency.
A further advantage of an intensity-based scheme is
that savings made “downstream” are not automatically
of benefit to the upstream producers (as they are in
the European Union Emission Trading Scheme (EU ETS),
and similarly does not create challenges for upstream
producers if consumption increases downstream). This is
because the reduced consumption reduces the volume
30000
Figure 3: Spread of Sector Specific SEC
bandwidth for Different Sectors Covered under
PAT
7.0
6.5
6.0
SEC Range (TOE/Ton of product)
5.5
5.0
4.5
4.0
The target setting approach adopted combines the use
of historical performance factors (installed technology,
production) that places the installation into one of
multiple bands. It then uses a benchmark approach to
set targets within those bands.
Table 1: Sector wise energy consumption and energy
saving targets under PAT Cycle-1
Sr No
Sector
No. of
Identified DCs
PAT Cycle-1
Energy Saving
Targets under
PAT Cycle-1
(million toe)
1
Aluminum
10
0.456
3.5
3.0
2.5
2.0
1.5
2
Cement
85
0.816
1.0
3
Chlor-Alkali
22
0.054
0.5
0.0
of electricity demanded from the power generation
sector. It does not affect the intensity target, and so
power producers do not benefit from downstream
energy efficiency measures, and are neither adversely
affected
Target Setting
Bureau of Energy Efficiency (BEE) based on sector specific
situation analysis studies observed the wide bandwidth
of specific energy consumption (SEC) within an industrial
sector. The baseline SEC bandwidth based on data
reported by 477 DCs is very wide within the same
industry segment, as indicated below.
While wide bandwidth within the industry sector
indicates large energy-savings potential, it is also
a reflection of the differences in the energy-saving
possibilities amongst plants because of their varying
vintage, production capacity, raw material quality, and
product-mix. Thus without significant homogeneity
amongst units within a sector it is not feasible to define
a single norm/standard.
With pretext of the broad bandwidth of SEC within a
sector, and inability of all plants to achieve a sectoral
benchmark SEC, SEC improvement targets were set
for individual plants based on the trend of energy
consumption and energy-savings potential of the plants.
4
Fertilizer
29
0.478
5
Iron & Steel
67
1.486
6
Pulp & Paper
31
0.119
7
Textile
90
0.066
8
Thermal Power Plants
144
3.211
Total
478
6.686
The SEC of an industry is calculated based on Gateto-Gate concept considering net energy input into
the designated consumers’ boundary divided by total
quantity of output exported from the designated
consumers’ boundary and expressed in terms of the ton
of oil equivalent (toe)/per unit of product.
The plant boundary is selected in such a way that the
total energy input and the defined product output is fully
captured. Typically it is the entire plant excluding colony,
residential complex and transportation system. Similarly,
mining operations in case of Iron & Steel, Aluminum and
Cement sector are not part of plant boundary. The plant
boundary defined once would remain fix throughout the
entire PAT cycle i.e. from April 2012 to March 2015.
The National Energy Target for all the 8 sectors covered
under PAT Cycle 1 is decided as 6,686 million toe. Then
the sectoral targets will be arrived at on pro-rata basis
of energy consumption among 8 sectors to achieve
National Target. Sector wise energy consumption and
energy saving targets under PAT Cycle-1 are as indicated
in Table below,
SEC reduction targets for each plant are calculated
123
statistically based on relative SEC approach after
grouping the DCs suitably. The Target year SEC arrived
at after discounting for the SEC reduction targets from
baseline SEC were notified by Ministry of Power by
notification dated 30th March 2012.
M&V, Issuance &Trading of ESCerts
Subsequent to PAT Target notification, The Rules for the
PAT scheme were notified by the Central Government on
30th March 2012 which provides complete mechanism
to be followed by the designated consumer.
Table 2: Timelines for DCs for Compliance with PAT
Scheme over PAT Cycle 1
Description
Mandatory
Compliance
Voluntary
Compliance
Submission of
Form 1
Aluminum
10
(Energy E-filling)
Once in a year
NA
Submission of
Form A
Chlor-Alkali
22
(Performance
Assessment
Document)
Once in 3 years
Before
Compliance
year
Submission of
Form B
Iron & Steel
67
(Verification
by Accredited
Energy Auditor
for Verification)
Once in 3 years
Before
Compliance
year
Issuance of
ESCerts
Once in 3 years
Before
Compliance
year
Submission of
Form D
Thermal Power
Plants
144
(Performance
Compliance
Document)
Once in 3 years
NA
Synchronization
between
Targets Set by
Regulators and
under PAT in
case of Thermal
Power Station
Synchronization
between Targets
Set by Regulators
and under PAT in
case of Thermal
Power Station
auditor, shall put in place transparent, independent and
credible monitoring and verification arrangements for
energy consumption and production based on the BEE
(Manner and Intervals of Time for Conduct of Energy
Audit) Regulations, 2010 for compliance with the energy
consumption norms and standard.
For the issuance of ESCerts and compliance of PAT
scheme, time lines indicated in table 2 below needs to
be followed by each designated consumer.
Monitoring and verification of energy savings will
be conducted by Accredited Energy Auditors. After
submission of Form 1 and Form A, the Designated
Consumer has to hire an accredited energy auditor,
from the list of BEE empanelled accredited energy
auditors for the verification of these forms. Accredited
energy auditor will verify Form 1 and Form A and
submit certificate of verification through Form B to BEE
within 3 months from the last day of the financial year.
This process is mandatory after the last financial of the
cycle, whereas designated consumer can submit these
documents after verification in the voluntary phase for
issuance of ESCerts i.e after completion of one year from
1st Apr 12. Concept of target, compliance ESCerts &
Penalty is highlighted in figure 4 below,
As indicated in figure 4 above, when a designated
consumer achieve and surpass the target, it can sell its
excess savings in the form of Energy Savings Certificates
(ESCerts), and if a designated consumer fails to achieve
its targets, it must purchase the appropriate number of
ESCerts to “meet” its energy savings targets or to pay a
penalty.
The value of one energy savings certificates would be
equal to one metric ton of oil equivalent of energy
consumed. For the year 2011-12 the value of per
Figure 4: Concept of target, compliance ESCerts & Penalty
As per the provisions in these rules, the designated
consumer in consultation with the accredited energy
Issued ESCerts
Baseline SEC
Penalty
Saving Traget
Compliance
Achieved
SEC
Purchased
ESCerts
Scenario 1:
Scenario 2:
Overachieved
Underachieved
Targets
Targets
metric ton of oil equivalent of energy was notified as
INR 10154 and would be reviewed every year based
on formula notified in the PAT rules utilizing weighted
average costs of coal, oil, gas and electricity etc.
An ESCert would be issued by Ministry of Power/BEE for
a one ton of oil equivalent of energy savings achieved
by the designated consumer, over and above the
target savings. Each certificate will be unique tradable
commodity which will be traded in two exchanges i.e.
Indian Energy Exchange (IEX) and Power Exchange of
India (PXIL). First ESCert will be issued after completion
of one financial year i.e. in 2013-14.
The designated consumer who has been issued the
energy savings certificates during the first PAT cycle
may use them for the purpose of banking until the next
compliance cycle. ESCerts issued in 1st PAT Cycle would
remain valid till the completion of the compliance period
of the next cycle.
nternational Trading and Energy Efficiency
Schemes
This section outline the key considerations from the
international trading schemes with an intention to
draw from the lessons learnt from the successes and
failures of similar schemes to PAT focusing on energy
efficiency/ emissions trading. It provides insights so as to
understand the applicability of elements of policies that
could be appraised to the current Indian context keeping
in mind the need for a growth metric to be integrated
within the overall PAT scheme. The table below makes
reference to a three of such international, regional or
national policies.
Table 3: Overview of International trading and energy efficiency schemes
Scheme Details
European Union Emission Trading
Scheme (EU ETS)
Climate Change Agreements
(CCAs) ,
CRC Energy Efficiency Scheme
(CRC)
Type
Mandatory emissions trading scheme.
Voluntary mechanisms to encourage
energy efficiency.
UK's mandatory energy saving
scheme aimed at improving energy
efficiency and reducing carbon
dioxide emissions.
Objective
Scheme as a key measures for delivering its
commitments under the Kyoto Protocol and
for delivering its objective of demonstrating
leadership in reducing emissions of
greenhouse gases.
With implementation of climate
change levy met increasing pressure
on business to contribute to UK
objectives to climate change,
0.816
Coverage
Over 10,000 energy intensive installations
across the 25 Member States of the European
Union.
Energy intensive industries in the UK
covering 53 industry sectors.
CCAs focus on ten major energy
intensive sectors (aluminium,
cement, ceramics, chemicals, food &
drink, foundries, glass, non-ferrous
metals, paper, and steel) and there
are over thirty smaller sectors with
agreements.
Large public and private sector
organizations. Scheme will affect
approximately 20,000 organizations,
with around 5,000 of these required
to participate in the scheme.
Operation Cycles
Phase 1 - From 2005 to 2007,
Phase 2 - From 2008 to 2012,
Phase 3 - From 2013 to 2020.
CCAs were first introduced in 2001
till March 2013, scheme continued
further with targets apply to
participating sectors from 2013 to
2020, with the scheme running until
2023.
Started in April 2010, with a threeyear introductory phase. Majority
of the proposals were introduced
at the start of the second phase, in
2014.
Target Setting
Phase 1 and 2 was based on straight line
caps on energy usage allowance throughout
the phase. Phase 3 has a decreasing cap,
declining by 1.8% per year to 2020. Phase 1
and 2 allocation was done through national
governments based on a share for each
sector. Whereas Phase 3 involved centrally
allocated EU targets.
Government provided an 80%
discount from the Climate Change
Levy for those industry sectors
that agree challenging targets for
improving their energy efficiency or
reducing carbon emissions. Targets
are based on historical levels of
energy use.
An organization will be included in
CRC provided it has one or more
half hourly electricity meters settled
on the half hourly market; and
responsibility for total half hourly
metered electricity supplies of at
least 6,000 MWh.
Institutional Setup European Commission administers the
& Governance
scheme centrally, proposing policy for
adoption through directives, approving
Member States’ plans and monitoring
the scheme outcome. Central European
Environment Agency is overseeing the
scheme but each member state has
competent authority to manage the scheme
within country.
Department of Energy and Climate
Change (DECC) oversee the scheme
with support form consultants
employed to give technical support
on target setting. With limited staff
including consultants, initial effort is
concentrated on the top ten sectors.
The Scottish Environmental
Protection Agency (SEPA),
Environment Agency (EA) and
Northern Ireland Environment
Agency (NIEA) are appointed as joint
scheme Administrators. For whole
of the UK, the basic administrative
functions are carried out by the EA.
Monitoring,
Verification and
reporting
Participating companies required to
monitor their emissions, get it verified by an
accredited verifier, and report their emissions
annually to the relevant Member State
authority
Energy use and production data
reporting to DECC on a biannual
basis. Provided participants have
used fewer kWh per unit of
production than their target sets out,
they will meet the target. DECC will
check the information through site
audits in first cycle.
CRC participants have to report
Registration Data; Evidence Pack;
Annual Statements and Footprint,
Emission reporting via online registry
with self-certification. Standard rules
to follow for measuring different
types of energy use appropriately
and keep adequate records to
support the information to be
reported to the Administrators.
Trading
Arrangements
Companies fail to surrender sufficient
allowances to cover their verified emissions
must pay a penalty, and buy the required
number of allowances from the market. There
are national registries specific to each nation
connected directly to the United Nations
Framework Convention on Climate Change’s
(UNFCCC’s) International Transaction Log
(ITL). ITL is responsible for checking all
transactions to ensure they adhere to the
rules of international emissions trading under
the Kyoto Protocol. ITL also linked to the EC’s
Community Independent Transaction Log
(CITL) responsible for checking all transactions
to ensure that they adhere to the rules of the
EU ETS.
CCA holders are able to access the
UK ETS, with target units that overachieve against targets allowed to
convert that over-achievement into
allowances for sale in the UK ETS.
Similarly, target units that fail to meet
targets through direct means, may
make up the shortfall by purchasing
and retiring UK ETS allowance.
Operate as cap and trade scheme
with participants required to
purchase and surrender allowances
corresponding to their annual CRC
emissions with one allowance
equivalent to one tonne of carbon
dioxide emitted. Allowances can be
purchased during the sale or auction
of allowances, by trading with other
participants or third parties on the
secondary market, or via the safety
valve mechanism. Allowances may
also be banked for use in future
years except for introductory phase.
126
2.3Key Issues & Challenges for Discussion
This section highlights the key issues in successful
implementation of the PAT scheme to most efficiently
meet the Ministry of Power’s energy conservation
objectives. The policy makers & regulators, along with
other market players, needs to play pro-active role in
addressing the key issues currently faced by energy
efficiency sector.
2.3.1 Target Setting Based on Banding of
Industrial Installations:
Target setting methodology adopted by BEE in PAT Cycle
1 combines the use of historical performance factors
(installed technology, raw material, and production)
that places the installation into one of multiple bands.
Subsequently it uses a benchmark approach to set
targets within those bands. This is a practical and
relatively unbiased approach to avoid the downside of a
purely historical or purely benchmarked approach both
of which disadvantage efficient (new) and inefficient
(old) installations, respectively. However, the banding
approach may present problems over time as there
is no provision to move the less efficient companies
“up” in the banding structure. There is also significant
information asymmetry between Government and
Industry, with an observed correlation between
engagement and lower / looser targets outcomes.
2.3.2 Inadequate Institutional Setup &
Governance
BEE envisaged ex-post award of ESCerts which enabled
the PAT scheme to start without necessarily needing
a trading architecture and other institutional setup in
place. It also allows the scheme administrator to verify
energy consumption performance before allocating
or awarding valuable certificates to sites. Also as
per provision in PAT rule, first ESCert could be issued
after completion of one financial year i.e. in 2013-14.
However even after 32 months since inception of PAT
Cycle 1 there is no issuance of ESCert and no Trading
Platform in place.
For year 2011-12 the value of per metric ton of oil
equivalent of energy was notified as INR 10154 which
was to be reviewed every year as per the provisions of
PAT rules, however there is no notification thereafter for
year 2012-13 and 2013-14 and hence no price signal for
energy efficiency investments.
With ex-post allocation of ESCerts, even with first
PAT cycle comes to end in March 2015; there is
not significant insights available in terms of ESCerts
allocated/ traded make it difficult to take a stock on
achievements against targets. In combination, these
issues may result in the benefits of the trading aspect of
the scheme being significantly weakened.
2.3.3 Banking of ESCerts
With current provisions allowing for full banking from
PAT Cycle 1 to PAT Cycle 2 have encouraged the earliest
possible adoption of energy efficiency technologies
and enable over-achieving DCs to carry forward the
benefits of their investments in a situation where
prices fare at very low levels. Banking does however
have the disadvantage of allowing a scheme to be
“polluted” beyond the first phase if there is a large overachievement by industry against phase 1 targets (as has
occurred in the CCAs, UK ETS and EU ETS) and could
reduce the actual performance required in a later phase.
Also new participants stand to be at a disadvantage
as the scheme expands. This is particularly true in case
of deepening (by reducing the inclusion thresholds to
20,000 toe / annum) due to their competitors having
been included early in the scheme and having the
economies of scale to implement energy reduction
measures.
2.3.4 High economic effort involved with
Limited Coverage Under PAT Cycle 1
Review of international schemes focusing on energy
efficiency/ emissions trading schemes similar to that of
PAT, indicates a very broad scheme coverage with EU
ETS covering over 10,000 energy intensive installations
across the 25 Member States of the European Union,
CCAs focusing on energy intensive industries in the UK
covering 53 industry sectors and CRC energy efficiency
scheme covers participation from 5000 large public
and private sector organizations. Whereas PAT Cycle 1
covers only 478 energy intensive industries including
144 thermal power plants. Given the limited coverage
under PAT Cycle 1 and considering the various costs such
as administrative and transaction costs, coordination
costs for stakeholders such as BEE/ IEX/ DCs etc., the
economic efforts involved would be significantly higher
in comparison to similar international schemes.
127
2.3.5 Extending the PAT scheme: Broadening
and Deepening
It should be noted that despite inclusion of the power
sector (and other highly intensive energy consuming
industries) in the PAT scheme, there are significant
numbers of small, inefficient installations that will
not be included within the PAT scheme. Most of the
international energy efficiency/ emissions trading similar
to that of PAT had covered several other industry sectors
like vehicle manufacturing, glass, foundries, refineries,
ceramic and food processing that are not covered under
PAT Cycle 1. In India, petrochemical and refining sector
has huge energy saving potential and should cover
under PTA Cycle 2.
2.3.6 Risk of Leakage
While a PAT as well as other international schemes aim
to make maximum impact by targeting the big energy
guzzlers, it is important to consider competitiveness
issues (such as where some firms within a sector may
be covered while other may not) and the risk of leakage
(that is, potentially newer plants being built just below
the qualifying threshold).
For example with two industrial installations having same
capacity, production, technology except with industry
“A” relying on captive generation within plant boundary
whereas industry “B” procuring power from grid, for the
same quantum of end use electricity consumption the
overall energy consumption for industry “A” importing
primary fuel for captive generation would be significantly
higher than that of Industry “B”. As per current SEC
norms based on gate to gate approach SEC for industry
“A” will be more than that of SEC of industry “B”. This
is despite of fact that Industry “A” is contributing to
lower energy losses even outside plant boundary with no
transmission and distribution losses due to onsite power
generation.
2.3.7 Clarity on long-term action required
Experience from a number of schemes highlights the
benefits of setting targets for a longer-term horizon.
Reasonable clarity about the future of the tradable asset,
and stability in the policy parameters will be critical
to the value of ESCerts. Policy uncertainty fails to give
participants clear long-term price signals, and therefore
the incentives to make energy use and investment
decisions taking into account expected cost and benefits
over that timeframe. The UK ETS has been affected by
128
policy uncertainty in various ways.
2.3.8 Conflict of interest between scheme
administrator/ regulator and scheme assessor
With current provisions under PAT rules, BEE is acting as
scheme administrator as well as ESCert issuing authority
after detailed assessment. In most circumstances, any
conflict of interest between scheme administrator and
assessor should be avoided to ensure that the scheme
integrity is not compromised.
2.3.9 Synchronization between PAT and
other EE schemes initiated / to be taken up BEE
and Other stakeholders & Financial support
mechanisms
In addition to PAT, there are several other initiatives to
be taken up under NMEEE to enhance energy efficiency.
These initiatives are,
• Market Transformation for Energy Efficiency (MTEE)- to accelerating the shift to energy efficient appliances
in designated sectors through innovative measures that
make the products more affordable,
• Energy Efficiency Financing Platform (EEFP)- a
mechanism to finance DSM programs in all sectors by
capturing future energy savings,
• Framework for Energy Efficient Economic
Development (FEEED) - Developing fiscal instruments to
promote energy efficiency
Also BEE has also taken up separate initiatives on
‘Industrial Energy Efficiency in Small & Medium
Enterprises (SMEs)’ with an objective to accelerate the
adoption of EE technologies and practices in 29 chosen
clusters in the SME sector through knowledge sharing,
capacity building and development of innovative
financing mechanisms. However for better achievement
of overall targets there should be synchronization of PAT
and other EE schemes.
Fiscal incentives and funds must be made available to
support energy efficiency projects (such as through
reduced interest loans) and to promote clean energy
technologies. NMEEE initiatives under FEEED on ‘Partial
Risk Guarantee Fund’ and ‘Venture Capital Fund for
Energy Efficiency’ are still at initial stage of development
, to ensure availability of adequate financing for
investment in industrial energy efficiency projects would
be challenge. Given the huge financing requirement
for achieving the energy saving targets, the challenge
for the policy makers and key stakeholders shall be
to overcome the financing issues faced by sector and
implement measures for tapping funding for the sector.
2.3.10 Synchronization between Targets Set by
Regulators and under PAT in case of Thermal
Power Station
For powers plants, Central Electricity Regulatory
Commission (CERC) or State Electricity Regulatory
Commission (SERC) are setting the target while fixing the
tariff. To ensure a complete synchronization between
the targets sets by regulatory commission and under
PAT needs to be taken in to account from perspective of
tariff fillings along with consideration for disallowance
of additional fuel cost by regulator for not meeting the
normative SHR.
Reducing Oil Dependence in
Transportation
Transport and energy are inter-dependent with transport
sector in India is one of the main consumers of energy
and is also a major determinant of energy demand.
Based on all India study by Petroleum Planning and
Analysis Cell (PPAC) of Petroleum Ministry, 70% of diesel
and 99.6% petrol is consumed in the transport sector
alone. Further break up of sub sectors/ categories
based on end-use of the fuels is as provided below,
Table 4: End use Segment wise consumption for Diesel &
Petro As on Jan 2014
Rapid growth in India’s population and economy has
contributed to an increased demand for transport
services. As a result, the sector’s energy demand has
gone up, and its dependence on energy from fossil fuels
(oil) has increased manifold.
The current energy consumption patterns clearly reveal
the heavy dependence of the transport sector on
petroleum products which insists the need for reducing
oil dependence in transportation.
Ways and Means to Minimize Oil Dependence
Sector
End-use
segment
% Share
Submission of
Form 1
Aluminum
10
(Energy E-filling)
Once in a year
NA
Submission of
Form A
Chlor-Alkali
22
(Performance
Assessment
Document)
Once in 3 years
Before
Compliance
year
Submission of
Form B
Iron & Steel
67
(Verification
by Accredited
Energy Auditor
for Verification)
Once in 3 years
Before
Compliance
year
Issuance of
ESCerts
Once in 3 years
Before
Compliance
year
Submission of
Form D
Thermal Power
Plants
144
(Performance
Compliance
Document)
Once in 3 years
NA
Synchronization
between
Targets Set by
Regulators and
under PAT in
case of Thermal
Power Station
Synchronization
between Targets
Set by Regulators
and under PAT in
case of Thermal
Power Station
India has substantial reserves of natural gas
in the form of conventional natural gas,
shale gas and gas hydrates. According to an
estimate , India has 1241 billion cubic metres of
conventional gas, 7462.5 billion cubic metres of
recoverable shale gas reserves and 1890 trillion
cubic metres of gas hydrates.
As indicated in table above, within transport sector,
road transport accounts for largest consumption of 95%
of total diesel consumption and 100% of total petrol
consumption.
At present, Indian Railways are running its fleet
of locomotives on predominantly two fuels,
i.e. diesel and electricity. Prices of both these
fuels have been rising rapidly due to increasing
prices of crude oil/imported coal, devaluation of
130
In particular, in India, transport is one of the sectors
having received the least energy efficiency policy
action so far. However, the growing concern on energy
security and greenhouse gas emission implications
of oil-dominated road transportation, reducing the
fuel used in this sector should be one of the highest
priorities. In view of this, it is important to note the
relevance of the road transport energy paradigm can
be split into three broad options so as to minimize oil
dependence discussed below,
a)Alternative Energy Sources:
i.Potential Use of Natural Gas in Rail
Transport
Current oil prices are on the lower cycles and is
just a passing phenomenon, in long run when
oil prices recovers, gas can be seen as transition
fuel into ultimate low carbon economy. Natural
gas is available in the form of conventional
natural gas, shale gas, gas hydrates etc. With
the introduction of economical processes of
extraction of shale gas, exploitation of shale gas
reserves has become a commercial reality.
Rupee etc. As indicated in table 4 above, Indian
Railways in % terms consume 3.24% of total
annual diesel consumption, however in absolute
terms it’s about two billion liters of diesel
annually and is quite significant.
In above context and in a move to adopt
environment friendly and cost effective alternate
fuel, the Indian Railways taken up various
projects on utilization of natural gas as fuel
for its fleet of diesel locomotives. Under this,
Research Design & Standard Organisation
(RDSO), a research wing of the Ministry of
Railways based at Lucknow, is actively working
on development of a prototype of locomotive
based on Liquefied Natural Gas (LNG). Once the
prototype is proven on field, Indian Railways
plan to build another 20 LNG based locomotives
on the same concept. As per concept paper
issued by the Railways the cost of LNG is 60 per
cent less as compared to diesel for generating
the same amount of power.
Indian Railways are also planning for duel fuel
options by retrofitting 40 diesel locomotives with
CNG (compressed natural gas) kits to reduce
emissions levels. The move comes after a pilot
project by RDSO revealed that using dual fuel
locomotives reduced smoke emissions by 20 %. In
case of duel fuel engine, since CNG shall replace
approximately 50% of diesel, the operating
expenses shall be reduced by about 30 %.
30
History
2012
Brest Crude oil
Spot Prices
Projections
Oil-to-gas price ratio
20
2040=3.2
2018=3.4
10
2012=7.1
0
1990
2000
2010
2020
2030
2040
ii.
Use of Bio-Fuel
In India, the National Biofuel Centre of the
Petroleum Conservation Research Association
(PCRA) is concentrating its efforts on bio-diesel
and bio-petrol. The National Mission on
Bio-diesel is being implemented from 2005-06,
with the focus on the development and
demonstration of technologies for production,
conversion, and utilization of biofuels for
different applications.
In addition, the new government has
emphasized on blending 5% of ethanol
with petrol as a green initiative as well as a
measure to cut down oil import bill and asked
oil marketing companies to procure the sugar
industry's byproduct at more than 10% of the
prevailing petrol price. The percentage blending
of ethanol can also go up to 10% in a state
with a view to generate revenue for sugar
mills enabling them to make timely and better
payment of cane price to sugarcane farmers.
b)Improved Fuel Efficiency of Vehicles
India Initiatives: In order to accelerate reduction
in the average fuel consumption of new cars
which are introduced in the Indian market,
BEE has come out with consultation paper
proposing a two pronged approach being
put into place. The approach introduces,
on the one hand, medium and long term
fuel consumption standards for new cars
which would provide a regulatory signal to
manufacturers to continuously reduce the
average fuel consumption of cars sold by them
over the next 10 year period. On the other
hand, the approach also introduces the labeling
of all new cars that are sold in the market, with
the labels providing consumers with information
on the fuel consumption of a car model, and
of the relative fuel consumption of the model
compared to other models in the same weight
class. These two instruments together provide
a ceiling for fuel consumption of new cars that
are sold in India, as well as provide a market pull
for low fuel consumption models. This strategy,
combines a “supply push” with a “demand pull”
and enables large scale transformation in the
automobile market towards car models ever
decreasing fuel consumption levels.
Fuel/lubricants consumption in a vehicle
depends on various factors like vehicular design,
131
road conditions, traffic pattern, driving habits,
and maintenance practices. Out of these, the
quickest and cheapest way to effect saving of
fuels is by following good driving habits. On
an average a saving of about 10-20 percent of
diesel consumption is possible. Proper driving
not only saves fuel but also reduces breakdowns
and increases road safety. This also reduces
the pollution levels due to vehicle emissions.
In view of this PCRA taken up a driver training
program with an objective to train drivers/driver
instructors and mechanics of the organized and
unorganized sectors of the road transport on
good driving habits and maintenance practices.
Also, to develop a cadre of drivers and driver
instructors who can further train other drivers
on their own and thus promote and propagate
fuel conservation in the road transport sector.
International Initiatives: Internationally, many
developed countries have already introduced
a wide variety of policies such as voluntary
targets and regulatory standard programmes to
accelerate the deployment of more fuel-efficient
vehicle technologies. They has also taken up
initiatives such as labelling (of individual vehicle
components) for road vehicle tyres for maximum
rolling resistance limits to ensure penetration of
more fuel efficient tyres in the market. Roughly
20% of a motor vehicle’s fuel consumption is
used to overcome rolling resistance of the tyres
(IEA, 2005).
Similarly additional fuel is also required when
tyres are underinflated. In most real-world
driving conditions, tyres are underinflated
compared to their optimum performance
level. The United States was the first country
to introduce mandatory fitting of Tyre Pressure
Monitoring System (TPMS) for all light vehicles
to ensure proper inflation levels of tyres.
Identifying a fact that improvements in driving
techniques, or eco-driving, can significantly
improve on-road fuel efficiency and CO2
emissions as well as also contribute to better
safety, and reduced noise and stress. In some
developed countries, eco-driving training is an
important part of road safety programmes.
Eco-driving is the operation of a vehicle in a
132
manner that minimizes fuel consumption and
emissions. It includes:
•Optimizing gear changing.
•Avoiding vehicle idling, e.g. by turning the
engine off when the vehicle is stationary.
•Avoiding rapid acceleration and deceleration.
•Driving at efficient speeds. The most efficient
speed for most cars is between 60 km/h and
90 km/h. Above 120 km/h, fuel efficiency falls
significantly in most vehicles.
•Reducing weight by removing unnecessary
items from the car, and reducing wind
resistance by removing roof attachments such
as ski racks.
In above context, to ensure overall improved
fuel efficiency, policy packages adapted
to country requirements are needed that
incorporate elements of technology,
purchasing decisions and driving behavior.
The technology part deals with improving
engine and vehicle designs for energy efficient
operations; purchasing decisions deals with
standards and labelling to enable shifting from
less to more efficient transportation options
one such as electric drive systems and driving
behavior ensures operation of a vehicle in a
manner that minimizes fuel consumption and
emissions.
c)Vehicle Population:
Many of the present trends of energy usage
patterns and their growth are unsustainable
in the long run. An example is the growth in
private transport (cars, scooters, motorcycles)
in urban areas. The increase in household
incomes has resulted in significant growth in
private vehicles. Unfortunately the transport
infrastructure is unable to cope with this
increase resulting in congestion, traffic jams,
and health impact.
The incentives and policies needed to promote
public transport and goods transport by
rail instead of road have to be identified. It
is necessary to adopt measures to remove
bottlenecks and leverage investments for
augmenting freight capacity in the railways.
Some possible steps could be facilitating
ticketing between different modes (viz an
integrated rail-road ticket) and providing
information about routes and timings. Strategies
for staggering office / school timings in urban
areas to balance traffic loads can also be
explored.
Increasing the load factor for a given transport
mode; reducing the need for transport/distance
travelled per vehicle. To ensure optimal traffic
and usage patterns by efficient routing, and no
empty back hauls can also be explored.
Key Issues & Challenges for Discussion
Fueling infrastructure could be a critical issue.
In India, while the lack of LNG fueling infrastructure in
synchronization with railway infrastructure remains the
largest hurdle, an additional environment, right of way
issues could further impact the timelines.
Safety Issues for LNG based locomotives
As a liquid, LNG is not explosive. LNG vapor will only
explode in an enclosed space within the flammable
range of 5-15 percent and needs an additional safety
rules and regulations in place. When the mixture is less
than 5 percent natural gas it doesn't burn. When the
mixture is more than 15 percent natural gas in air, there
is not enough oxygen for it to burn. Also, the repair and
maintenance facilities of such locomotives would require
significant development of facilities besides development
of skilled manpower.
Challenges in Ensuring the Ethanol Availability
without Price Pinch to the Consumers
The ethanol blending initiative of Government of India
(GoI) is going to pinch consumers as ethanol prices
have zoomed ahead of petrol. The government's 'Green
Initiative' has apparently turned into a 'Save Sugar
Industry' drive as the oil marketing companies have been
asked to procure the ethanol at more than 10% of the
prevailing petrol price. As a result, the blended petrol
price will be higher than the pure petrol price.
Despite higher rate for ethanol, this hasn't improved
the ethanol supplies to the industry. The industry could
achieve approximately 1.7%-1.8% ethanol blending
nationwide, as against the target of 5% in 2013-14.
Thus to ensure an availability of ethanol is also a
challenge for successful implementation.
Though Ethanol Blend is Cheaper per Litre, It may
Costlier per Kilometer
Ethanol blends do not affect performance of the vehicle
in terms of torque or horsepower but they do lower
the mileage of the vehicle up to 25%. This is because
ethanol has lower energy content than petrol; a higher
blend therefore means lower mileage. It is possible for
ethanol blends to be cheaper per litre but costlier per
kilometer.
The challenge is to promote public transport.
What are the interventions required to modify the usage
patterns and convince commuters to opt for public
transport? How can we retrofit mass transit systems on
already congested cities and towns? What incentives
and disincentives (carrot and stick) will work? What
other measures can strengthen urban public transport
systems?
High initial cost, the lack of clear information and
limited market availability could be a constraint
for penetration of energy efficient technology
measures
In developed countries including European Union,
auto manufacturers already carefully minimize rolling
resistance of tyres fitted to new cars because this
is an effective way to comply with fuel economy
standards. However, the rolling resistance of tyres in the
replacement market could be higher than those offered
on new cars, so the fuel savings from the low rolling
resistance tyres could be lost after the original tyres wear
out. Consumers may not always purchase low rolling
resistance tyres as replacement tyres due to their high
initial cost, the lack of clear information provided, and
limited market availability (IEA, 2009c).
Comprehensive, high quality information through
vehicle labelling is a prerequisite for sound
decision making
For customers to purchase the most efficient vehicles
on the market, they must first know about the
efficiency levels of the vehicles under consideration.
Research shows that many consumers are not aware
that their choices can have a significant impact on
the environment and that labels significantly influence
the choice that consumers make within a vehicle class
(Teisl, M. et al., 2008). Labels showing fuel economy
and CO2 emissions values and displayed on vehicles are
necessary to inform consumers about the fuel efficiency
characteristics of the vehicle in question.
133
Labelling is not adequate without Fiscal
incentives
Experience in the European Union shows that labels in
isolation do not reduce vehicle emissions. A review of
EU labelling policy demonstrated that the highest level
of success in influencing consumers’ vehicle purchasing
behavior occurred when fuel economy and CO2
emissions labels were combined with fiscal incentives, as
was done in the Netherlands and the United Kingdom
(EC and ADAC, 2005)
In the first instance financial incentives or penalties,
in combination with sound information, incentivize
the purchase of more energy efficient vehicles and
so can accelerate the deployment of energy efficient
technologies. The vehicle tax systems of many countries,
in Europe particularly, are now based on vehicle CO2
emissions and research has shown that consumers
respond quickly to such financial incentives.
Smart Cities & Energy Use
India is urbanizing very fast and as India’s population
continues to grow, more citizens will move to cities
with needs to expand the capacity of our cities. As per
McKinsey and Company study in 2010, India's urban
population is projected to grow from 340 million in
2008 to 590 million in 2030. To accommodate this
massive urbanization, India needs to fi¬nd smarter ways
to manage complexities, reduce expenses, increase
efficiency and improve the quality of life. Understanding
the facts, with a new government in Delhi, India’s
urban agenda is now focused on the creation of 100
“Smart Cities” enabled with the latest in technology and
infrastructure.
inexpensive energy; educational opportunities;
affordable housing and commercial space; and
efficient transportation.
• Enhanced sustainability: giving access to the
resources people need without compromising
the ability of future generations to meet their
own needs. Smart cities enable the efficient use
of natural, human and economic resources and
promote cost saving in times of austerity, and they
are careful stewards of taxpayer money. It isn’t
about investing huge sums of money into new
infrastructure, it’s about making infrastructure do
more and last longer for less.
In the Union Budget of 2014-15, a sum of INR 70 billion
(around $1.2 billion) is provided to fulfil governments
vision of “developing ‘one hundred Smart Cities’, as
satellite towns of larger cities and by modernizing the
existing mid-sized cities.” In order to allow foreign
investors to have a larger role in the development of
Smart Cities, the entry requirements for Foreign Direct
Investment (FDI) in terms of minimum built up area and
capital conditions were substantially reduced.
In line with above Cities have essential functions and
services that must be available every day. Homes
must have water, businesses must have power, waste
must be collected, and children must be educated
and so on. Given the context there are eight essential
responsibilities, although not all of them fall under a
city’s direct control, all of them are essential to everyday
life and commerce. The eight city responsibilities are
indicated in adjacent figure.
What Makes Smart City?
While energy is one of the prime responsibilities insisting
the need for essential service for Smarter city, use of
information and communications technology (ICT) is
an important aspect to integrate technology enablers
such as instrumentation and control, connectivity,
interoperability, security and privacy, data management,
computing resources & analytics that improve the eight
responsibilities.
A smart city uses information and communications
technology (ICT) to enhance its livability, workability and
sustainability. While the meaning of the term has been
quite hazy and contested, the presence of high-end
infrastructure and technology-enabled city governance
seems to be a prerequisite. Smart Cities may refer to
entirely new cities (greenfield projects) built from scratch
or existing cities (brownfield project) made “smart” by
investing in technology and infrastructure. Smart Cities
are more livable, more workable and more sustainable –
both economically and environmentally.
• E
nhanced livability: Offers better quality of life
for city residents with an access to a comfortable,
clean, engaged, healthy and safe lifestyle enabled
by inexpensive energy, convenient mass transit,
good schools, faster emergency responses, clean
water and air, low crime and access to diverse
entertainment and cultural options.
• E
nhanced workability: In the smart city, people
have access to the foundations of prosperity – the
fundamental infrastructure services that let them
compete in the world economy. Those services
include broadband connectivity; clean, reliable,
Buildings
Public
Safety
Water
Energy
Smart City
Human
Services
Telecom
Payments
Transport
135
Cities can’t function without energy. It fuels our subways
and trains. It cools, heats and lights our homes and
businesses. It pumps our water and processes the food
we eat. And it powers the technologies that are the
foundation of a smart city. Given the context of this
paper, sections to follow covers energy’s critical role in
smart cities and energy efficiency aspects.
Smart City Energy Use & Efficiency
ICT’s plays critical role in smart energy and help cities
to optimize these energy systems, making them more
efficient and more resilient. Implementing smart energy
systems also helps preserve precious natural resources
and gives residents, businesses and cities themselves a
whole host of ways to monitor and control their energy
consumption to save money.
Energy’s Critical Role in Smart Cities
Smart energy powers the technologies listed below that
are the foundation of a smart city, from smart meters
that offer two-way communications between customer
premises and utilities, to outage management systems
that make the power grid more resilient.
• S mart Meters: on every home and building give
residents and the utility invaluable information about
energy use, leading to greater efficiency, demand
response initiatives, improved reliability and cost
savings,
• Building Integrated Alternate Energy: reduces the
need for fossil fuel generation,
• Clearly defined interconnection standards: make it
easy for residents to plug solar and wind in to the
grid,
• Communication Network that connects Smart
Meters: can often be used for other city purposes
• Automation Equipment: can execute protection
schemes in microseconds, minimizing outages
• Automated outage management: detects
disturbances and isolates areas before they create a
cascading blackout.
• Visualization and Analytics: provide full situational
awareness of what is going on with the electric
power and gas system
Improvements in a city’s energy infrastructure by
deploying a smart grid as a specialized communications
136
Despite India’s effort to achieve
energy security by opening new mines
and acquiring oil wells abroad, the
massive quantity of energy required
for smart cities is likely to remain
elusive
network moves electricity and data to balance supply
and demand and maintain reliable service and also
facilitate energy saving and contributes to green
attributes as well, as mentioned below.
Using less energy - Smart energy is cleaner and more
efficient, producing less impact on the environment.
First, it makes it easier to use wind, solar and other
renewable sources. Second, it wastes less energy during
transmission and delivery. Third, it gives customers tools
to reduce their energy usage and costs. And there are
add-on effects, because using less energy means using
less water too.
Decreasing reliance on nonrenewable energy
sources- Smart grids make it far easier for customers
to generate energy on premise (for instance, via rooftop
solar) and to trade energy back and forth with the grid.
Implementing the right devices and instrumentation,
such as improved solar meters, reducing the barriers to
solar generation. Smart energy, with the help of reliable
two-way communications, makes grids more flexible
overall to customer demand.
Lessening energy operating costs - Smart energy
reduces operating costs compared to traditional
methods. For example, sensors and monitors can report
on the actual condition of expensive equipment so it can
be serviced based on actual condition and not a guess.
This kind of asset management can squeeze many extra
years of use from an asset, without compromising safety.
Smart systems can also manage peak times by briefly
reducing demand (called demand response) instead of
building new standby power plants that will only get
used a few times per year, and can even dim LED street
lights to enable lower operating costs.
Initiatives to promote Building Energy Efficiency
in India
Energy Conservation Building Code (ECBC)
Developed by the Bureau of Energy Efficiency (BEE),
the ECBC prescribes a minimum standard for energy
use in new buildings and major retrofits. The load
requirement for buildings to comply is 100 kW or 120
kilovolt-amps (kVA), which means that both commercial
and high-rise residential buildings (approximately five
stories or higher) come under the code’s purview. The
ECBC establishes minimum requirements for energy
efficient building design and construction. The code is
voluntary at the national level, and the Ministry of Urban
Development and state governments are responsible for
its implementation and enforcement. Two states have
fully adopted the code as mandatory, while several states
are working toward making the ECBC operational for
new construction and major retrofits.
Leadership in Energy and Environmental Design
(LEED)
EED is an internationally recognized green building rating
system. LEED verifies that a building was designed and
built using improved performance strategies, including
energy savings, water efficiency, and carbon dioxide
emissions reduction. LEED India is the localized version
of the international rating system and is administered by
the Indian Green Building Council (IGBC). According to
IGBC, projects that comply with the ECBC also qualify
for LEED India ratings, provided they are equivalent to
ASHRAE standards. To continually improve efficiency,
LEED should strengthen its standards to encourage
compliance beyond the ECBC as states adopt codes and
the ECBC is improved.
Green Rating for Integrated Habitat Assessment
(GRIHA)
GRIHA is the national rating system for green building
design, developed and implemented by The Energy and
Resources Institute (TERI) and the Ministry of New and
Renewable Energy (MNRE). If buildings contain fully
air-conditioned interiors, ECBC compliance is mandatory
for GRIHA ratings. If buildings are naturally ventilated,
ECBC compliance is required only for the systems and
equipment installed within the building. All new central
government and public sector buildings are to comply
with the requirements of at least three-star GRIHA
ratings. Like LEED, the GRIHA standard should also be
strengthened as codes are improved.
Key Issues & Challenges for Discussion
What should Smart Cities mean in Indian context?
It is unclear whether the 100 smart cities referred to are
greenfield ones or upgraded older cities. It is imperative
to define a Smart city in Indian context with detailed
norms for Smart Cities. Some of the key challenges in
this context are,
• How to harmonize with existing norms of National
Building Council (NBC) on sustainability, initiatives by
MNRE on solar cities? Revision in ECBC in smart city
context?
• How to bring sustainable and smart habitat into the
master plan including use of demolition waste?
• Norms to cover efficient use of water, waste
management, energy consumption for smart cities
and deployment of initiatives such as city gas
distribution?
How much energy does Smart City upgradation
require? and is this energy available?
At this point of time, even if it is assumed that 100
smart cities referred by GoI are based on up gradation of
older cities, two questions arise: how much energy does
upgradation require, and is this energy available?
Despite India’s effort to achieve energy security by
opening new mines and acquiring oil wells abroad, the
massive quantity of energy required for smart cities is
likely to remain elusive. Can India access the massive
quantity of energy needed to develop 100 smart cities?
Will more fossil fuel use, the primary cause for carbon
emissions in projects such as smart cities, bullet trains,
necessarily reduce poverty?
To build a comprehensive smart city plan will be
prerequisite to explore possibilities that Smart
cities actively seek ways to share ICT/other
infrastructure between city departments.
Improvements in a city’s energy infrastructure – deploying
a smart grid, for instance – can’t occur without an
understanding of dependencies between energy and
other city systems and services. It is necessary that
someone from the city budget office to evaluate the value
in reducing needless duplication and redundant spending
recognize interdependencies between departments and
the value of cross-coordination. Actively seeking ways to
share ICT infrastructure between city departments – and
having backup plans in place should problems occur
simply makes sense.
137
Unlike developed countries, Indian cities are comprised
of an older city constructed with narrow streets made
for pedestrians and animal carts and low-rise buildings
made from lime binders, and a newer city constructed
with broad streets for fossil- fuelled vehicles and
concrete high-rise buildings. It needs to have better
plan and cost estimates for upgrading Smart City
infrastructure.
As a Policy and Leadership supporting practiceTo develop energy smart city profiles by
identifying the most promising domains for
energy efficiency improvements for Indian Smart
Cities.
Which “domains“ are most promising for improving
energy efficiency in general? How strong are actual
activities for improving energy efficiency in these
“domains“? Which “domains“ have a high potential for
improving energy efficiency? In which “domains“ actual
and potential activities diverge most? Which actors have
the ability and the power to influence energy efficiency?
What kind of activities are suitable to influence energy
efficiency?
Assessment of to what degree can developments
in Indian Smart city be influenced by the
following activities
Subsidies and financial incentives, User fees and
penalties, Public or private investment, Public or private
procurement (preference of energy efficient goods and
services), General legal regulations (e.g. laws, directives),
Private-law contracts (e.g. individual obligations),
.Information and lobbying campaigns, Education of
citizens, Free market without political intervention, &
Cooperation of different actors.
Necessity to build and adhere to a multi-modal
transportation plan.
Smart cities should build a holistic, integrated plan
that encompasses all of their existing transport modes
as well as those they want to pursue in the future.
This integrated and multi-modal plan connects cities’
technology investments in transportation infrastructure
to ensure sharing, scalability, connectivity and efficiency.
The plan takes into account shifts in population, demand
and regional interconnectivity. Cities with an integrated
transport authority will find it easier to implement a
single, multi-modal transport plan. Those without a
single authority will have to build coalitions and create
both mandates and incentives for a combined plan.
138
Abbreviations
BEE
Bureau of Energy Efficiency
CCAs
Climate Change Agreements
CITL
Community Independent Transaction Log
CNG
Compressed Natural Gas
CPSUs
Central public-sector undertakings
DCs
Designated Consumers
DECC
Department of Energy and Climate Change
EA
Environment Agency
ECBC
Energy Conservation Building Code
ESCerts
Energy Savings Certificates
ESCO
Energy Servicing Companies
EU
European Union
EU ETS
European Union Emission Trading Scheme
FDI
Foreign Direct Investment
GOI
Government of India
GRIHA
Green Rating for Integrated Habitat Assessment
ICT
Information & Communication Technology
IEA
International Energy Agency
IEX
Indian Energy Exchange
ITL
International Transaction Log
LEED
Leadership in Energy & Environment Design
MNRE
Ministry of New & Renewable Energy
MoP
Ministry of power
MTOE
million tonnes of oil equivalent
NAPCC
National Action Plan for Climate Change
NIEA
Northern Ireland Environment Agency
NMEEE
National Mission for Enhanced Energy Efficiency
PAT
Perform Achieve and Trade
PCRA
Petroleum Conservation Research Association
PPCA
Petroleum Planning & Analysis Cell
PXIL
Power Exchange of India
RDSO
Research Design and Standards Organisation
RMSDP
Regulated Multi State Demand Side Management Program
SEC
specific energy consumption
SEE
Super-Efficient Equipment
SEPA
Scottish Environmental Protection Agency
SIDBI
Small Industries Development Bank of India
TOE
ton of oil equivalent
UK ETS
UK Emission Trading Scheme
UNFCCC
United Nations Framework Convention on Climate Change
Regulatory Independence
139
Electricity Regulation and
Ensuring Independence
140
Executive Summary
The Electricity (Supply) Act, 1948 enabled setting up
of State Electricity Boards to undertake the generation,
distribution and transmission activities. However, owing
to direct control of the State Government on the SEBs
and infrequent revisions in consumer tariff, the financial
situation of the SEB’s had reached unsustainable levels.
Various enabling legislation to initiate reforms and
policy initiatives to improve the health of the power
sector and enable private participation had failed. The
monopolies of the SEBs remained largely intact and the
SEBs continued to perform poorly on operational and
financial parameters.
the Regulatory Commission at the Forum of Regulators
level with the oversight of the Appellate Tribunal could
also be an effective measure to ensure autonomy of the
regulators. Other alternatives may include development
of a national level cadre for appointment of qualified
regulatory staff to assist the Regulatory Commissions
which may also prove useful for bringing about
autonomy of the regulator.
In order to provide an impetus to the sector and ensure
its financial sustainability, the Electricity Act 2003 was
enacted which envisaged creation of professionally
managed, financially viable and consumer focused
utilities operating under independent regulatory
bodies. Another major objective of the Act was to limit
the involvement of the State Governments to policy,
governance and administrative matters.
In view of the continuing deteriorating financial health
of the utilities, the Electricity Act 2003 does not seem to
meet its desired objective. One of the primary reasons
for the continuing poor performance of the utilities has
been the interference of State Governments in various
matters. Whether it is with regard to the selection of
the members of the Regulatory Commission or the
appointment of the board members of the government
owned power sector companies, the State Government
plays a major role in impacting the decisions at both
ends that continues to remain a cause of concern.
Further, the autonomy and transparency of the SERCs
with respect to tariff determination is considered
questionable in view of the delays in issuance of tariff
orders and disallowance of legitimate expenses of
the power sector companies. Delays in notification of
regulations which enable implementation of reforms in
the sector i.e. Open Access, Multi-year tariff framework,
etc. also are considered as bottlenecks in achieving the
objectives of the Electricity Act.
One of the possible solution to ensure independence
of Electricity Regulators is to have an independent
“Appointments Commission” at central level as proposed
under the draft Regulatory Reform Bill for overseeing
/ undertaking the appointments to the Commission.
Alternatively a framework for performance review of
141
Evolution of India’s
Regulatory Framework
Structure prior to Electricity Act 2003
The first enabling legislation for development of the
power sector, post-independence, was the Electricity
Supply Act 1948. The key objectives of the Act were
to ensure co-ordinated development of a grid system
that subsumed then existing, isolated supply systems,
and extended the grid to unserved areas. The State
Electricity Boards that were authorised to undertake
generation, transmission and distribution were set up
under the Act. Further, CPSUs in the generation and
transmission space were set up.
The SEBs were also given tariff setting powers.
In practice, electricity tariffs were set by State
Governments. Tariff levels that did not recover, in some
cases, even operating costs and the inability of State
budgets to fund the resulting shortfall through subsidies,
resulted in financially sick utilities. In some cases, the
utilities were unable to even pay for power purchases,
let alone invest in system expansion and strengthening.
Further, the tariff structure was heavily skewed against
industrial and commercial consumers and absence of
competition resulted in no incentives for the SEBs to
improve the situation.
Various state governments enacted enabling legislation
to initiate reforms that were to address problems in
the sector. Policy initiatives were made by the Central
Government like opening up of generation to the
private sector in 1991 and providing for private sector
participation in transmission sector in 1998. However,
the monopolies of the SEBs remained largely intact and
the SEBs continued to perform poorly on operational
and financial parameters.
Recognising the root cause of the problem, the Electricity
Regulatory Commissions Act 1998 was introduced,
which for the first time sought to insulate tariff setting
from political considerations. Further, the federal and
state regulators were to promote competition, protect
consumer interests and drive efficiency and economy in
the sector. However, notifying State Commissions was
at the option of the State Governments.
142
Reform Process and Issuance of the Electricity Act
2003
Learning from the experiences of the 90s, the Electricity
Act 2003 was notified. Notification of the Electricity Act
2003 was the first comprehensive attempt to address
inter-linked issues by creating an enabling environment
for fundamental reforms in the sector. The Act brought
in significant improvements in the risk perception of the
sector and whetted the investment appetite of investors,
especially in generation. Key provisions of the Act that
were behind this change in perception are
• Removal of the need for techno-economic
clearances by the Central Government for thermal
power projects. Retained only for hydro projects
above an investment threshold of Rs. 1000 Crores
• Unbundling of the State Electricity Boards
• Creation of contestable pool of consumers through
open access to distribution and transmission
networks and mandating independence of
transmission
• Provision for competitive procurement of power and
transmission services
• Mandatory creation of empowered State Regulators
• In the critical Distribution segment, the Act provided
a framework for the appointment of franchisees,
which is being currently pursued in several states
both in urban and rural areas. This, in many ways
provided a politically acceptable way forward on
private participation in distribution, which had
otherwise come to a standstill post-Delhi for lack of
political willingness in other states.
In short, the reforms envisaged creation of professionally
managed, financially viable and consumer focused
utilities operating under independent regulatory bodies.
The involvement of State Governments was expected to
be limited only to policy, governance and administrative
matters. It was envisioned that the independent
regulators would act independently to protect the
interests and rights of all the stakeholders to the sector.
Major Issues
Selection of Members of State Regulatory
Commissions
One of the key objectives of the Act is to limit the role
of State Governments in tariff setting. However, State
Governments continue to be owners of majority of
utilities and have a key role in selecting members of the
Commission
Figure 1: Background of regulators
Judiciary, 2%
Private Sector, 1%
PSU 15%
Regulated Utility 26%
Administrative
Services 51%
With regard to the selection of the Members of the State
Commission, Section 85 of the Act states the following:
“85. (1) The State Government shall, for the purposes
of selecting the Members of the State Commission,
constitute a Selection Committee consisting of –
(a)a person who has been a Judge of the High
Court- Chairperson;
(b)the Chief Secretary of the concerned State
- Member;
(c)the Chairperson of the Authority or the
Chairperson of the Central Commission
- Member:
Provided that nothing contained in this section shall
apply to the appointment of a person as the Chairperson
who is or has been a Judge of the High Court.”
The appointment of the members of Regulatory
Commission is the most crucial aspect of ensuring
autonomy. In practice, the selection of members of
SERCs is largely confined to officers of the government
and government controlled enterprises. A study was
conducted by Prayas Energy Group for understanding
the present status of Regulatory governance and
evaluate the transparency and accountability related
provisions of the Act. The findings of the study show
that regulators are largely from government or related
sectors.
Further, the appointments to vacant positions of the
Commission are not sometimes not undertaken in a
timely manner, which affects the proper functioning
of the Commission. Some SERCs were observed to
be working with a single member, resulting in delay in
regulatory proceedings. This has also came as a major
concern and the APTEL has expressed its displeasure
over the delays in appointments and has raised the
concern that such regulatory uncertainties could lead
to the defeat of objectives of the Electricity Act of
2003. In fact, TNERC had to issue a draft amendment
in January 2014 proposing to reduce the quorum of the
Commission to one member for issuance of Orders, as
the absence of quorum was being used as grounds for
challenging the regulatory proceedings.
Dependance of State Utilities on State
Government
Unbundling and corporatization of utilities as per
the Act was primarily aimed at creating independent
utilities operating on commercial principles. However,
ownership largely remains with State Governments and
consequently, members of the board are exclusively
nominees of the State Government. The Companies Act
requirement of having independent board members is
generally not met by several utilities.
Cashflow analysis of utility finances typically show that
surpluses are not being generated that can be used
for equity contribution in project schemes, resulting in
reliance on budgetary support to fund projects. Further,
debt is typically available only when backed by State
Government guarantees. Apart from capital funding,
utilities are also supported by the State Government by
way of subsidy support, financial support towards power
procurement and revenue deficit, etc.
Non-revision of Tariff and Delay in Issuance of
Tariff Orders
As per the Section 86 (1) (a) of the Electricity Act 2003,
tariff determination is one of the most important
functions entrusted to Regulatory Commissions. Further,
the Act provides necessary provisions for recovery of
efficient cost of supply through tariff, while protecting
consumer interest.
143
These issues have in effect translated into an increasing
gap between the average cost of supply and the average
tariff. The graph alongside depicts the gap between the
ACoS and the tariff as it has increased over the years.
The gap has risen to from Rs. 0.42/kWh in FY06 to
Rs.1.14/kWh in FY12, when aggregated at the national
average level. This means that at the end of FY12, the
utilities were losing Rs.1.14/kWh for every unit they were
supplying.
Figure 2: Increasing under recoveries of utilities
1.14
4.5
0.93
4.0
3.5
3.0
0.42
0.51
0.83
0.81
0.55
1.0
0.8
0.6
2.5
2.0
0.4
1.5
1.0
0.2
0.5
0.0
0.0
ACS
144
1.2
ABR
Gap
Gap (Rs./unit)
Average Cos and Average Revenue
5.0
While the prominent reason for the increase in this
gap between cost and revenue is poor operational
performance of the distribution utilities, part of the gap
may also be attributable to the delay or non-recognition
of the various cost parameters of the distribution
utilities.
Over the years, as has been noticed in case of several
states, the state Regulators failed to issue tariff orders for
many years at a time. Likewise, in case of several states,
the disallowances were so huge that they were not
sufficient to meet even the power purchase expenses of
the licensees, let alone other expenses. The table below
summarizes the above mentioned issues:
No. of states where
timely tariff order issued
No. of states where
tariff was hiked
FY08
6
15
FY09
5
13
FY10
2
14
FY11
4
20
FY12
3
19
FY13
8
26
The average delay in issuance of tariff orders by the
SERCs have been very high in the past. A look at the
graph indicates that the average delay in issuance of
tariff orders of all States is approx. 200 days during
FY07 to FY11. This includes a number of states where
the tariff order was not issued. Although the delay
has improved marginally, it is primarily on account of
more SERCs issuing Orders in the subsequent years.
Post the directive of APTEL in Suo Moto Appeal No 1
of 2011 for timely issuance of tariff order, there has
been a significant improvement in timely issuance of
tariff orders. A delay in issuance of tariff order results in
the utility not being able to recover revised tariff for an
entire year, which is the typical tariff period.
Figure 3: Average delay in issuing tariff orders
300
250
Avg Delay in days
However, the regulatory process has been facing several
challenges, which have not allowed for sustained
improvement in the financial position of utilities in most
states as envisaged in the Act. Some of the major issues
observed across a large number of states include:
• Frequent and significant delays in submission of
ARR/ Tariff proposals by utilities and issuance of tariff
orders by state regulators
• A combination of unrealistic efficiency targets set
by regulators and absence of commercial principles
based operations by utilities, resulting in significant
disallowance of cost
• Overly protective approach of the state governments
towards consumers and exercise of influence over
regulators leading to infrequent and insufficient tariff
hikes, which are sometimes less than inflationary
increases
• Regulators not taking cognizance of delays in
disbursal of subsidy from state governments.
244
214
212
200
177
178
150
90
100
50
0
FY07
FY08
FY09
FY10
FY11
FY12
This causes under recovery of aggregate cost, leading to
deficits and financial constraints on the utility.
Delay in Formulation of Regulations
One of the key functions of SERCs is the notification of
regulations to operationalise various provisions of the
Act and define the regulatory framework within which
utilities and other stakeholders have to operate. Delay in
issuance of regulations has resulted in non-achievement
of the objectives of the Act i.e. development of the
energy sector, promoting competition, protection of
consumer interest, etc.
Of the essential frameworks relating to Open Access,
Standards of Performance, Renewable Power obligation,
Supply code, CGRF, MYT, Trading, ABT, etc., only a
few SERCs have been able to issue regulations on all
of them. The SERCs which have been able to do so
include Andhra Pradesh, Delhi, Gujarat, Karnataka and
Maharashtra. A few states like Orissa, Uttar Pradesh,
etc. have not issued key regulations like Multi-year Tariff
Regulations, which is essential for providing regulatory
certainty on tariff. Even where MYT regulations have
been issued, many states have not put subsequent
measures or processes in place to ensure implementation
and monitoring of the same.
With the notification of Electricity Act 2003, open
access was required to be implemented as per Section
42 in a non-discriminatory manner. However, most
of the SERCs have delayed the implementation of this
provision. The issuance of necessary regulations in
this regard have been delayed in many states or high
cross-subsidy surcharge has been levied in order to
discourage transition of high paying consumers to
power procurement through open access. Facilitating
open access has been seen as loss of cross-subsidy
available towards subsidizing the tariff of agriculture
and domestic consumers, which would then require
tariff rationalisation. Therefore, utilities typically delay
the process by withholding required information and
SERCs have not pursued the matter. As per the data on
participation of industries/ consumers on exchanges, the
proportion of direct procurement under open access has
remained at the sub 1% level of the overall market for
electricity.
Despite the notification of the National Tariff Policy
and the distinct requirement of notification of cross
subsidy roadmap therein, in most states except a few
like Chhattisgarh, Karnataka, Maharashtra etc., the cross
subsidies have rather been rising.
While regulators have notified loss reduction targets
for most utilities or are at least setting annual targets,
the accompanying assistance in terms of setting up of
special courts and police stations to help deter theft
continues to be lacking in several states.
Discussion Points/ Suggested
measures for ensuring autonomy
of Regulatory Commissions
The following measures, some of which are already
under consideration, are likely to drive institutional
development and independence of SERCs
Sustained and full discharge of functions
mandated by Electricity Act 2003
The Electricity Act entrusts multiple functions to
the SERCs and empowers them to carry out their
responsibilities in order to regulate the power sector in
the state. However, it is often seen that SERCs have not
been discharging their duties fully, resulting in uneven
progress on objectives of the Act.
In such a scenario, APTEL has already directed the SERCs
in its Order dated 11th Nov 2011 to send information
on tariff revision, adequacy and Fuel and Power Purchase
Cost Adjustment to the Forum of Regulators (FOR) by
June 1 of every year to check on the progress with
regard to the directions given and submit a report to the
APTEL on the same. Pursuant to the same, the number
of SERCs which have issued tariff orders post the
directive has increased. Therefore, effective, transparent
and smooth functioning of the Regulatory Commissions
may be brought about by mere adherence to the
guidelines.
However, the situation where the regulators have to be
regulated is less than ideal.
Independent Regulatory Cadre:
It is important that the Regulatory Commissions have
suitable and qualified staff who are capable of assisting
the Commission with technical inputs required for
decision making. It is observed that majority of the staff
of the State Commissions are either on deputation from
the state power utilities or on contract basis.
Development of a national level cadre of regulatory staff,
with suitable qualifications in technical, commercial,
regulatory and financial aspects of power sector
regulation could be one solution. Further, well defined
career paths for this cadre will have to be developed to
attract quality personnel.
146
Centralized Appointment of Members &
Chairperson:
Currently, most of the members of the Regulatory
Commission are former officers of the government and
government controlled enterprises. The selection of the
members of the Regulatory Commission is done by a
selection committee which is chaired by chief secretary
of the state which may lead to interference of the
existing Government in the selection procedure.
A possible solution is to have an independent
“Appointments Commission” at central level on the lines
of the Judicial Appointments Commission for overseeing
/ undertaking the appointments to the Commission. This
will require amendments to the Electricity Act, 2003.
With regard to this a draft Regulatory Reform Bill has
been prepared in 2013 and approved for stakeholder
consultation. The objective of the Bill was to make
regulators across key infrastructure sectors accountable
to Parliament in addition to giving them power of
licensing. Also, the bill aimed at a centralized selection
procedure for the members and chairperson in a
transparent manner which shall ensure transparency as
well as accountability of the Regulatory Commission and
enforce separation of powers at the state level.
Framework for Performance Review of SERCs:
The existing structure provides limited accountability
of the SERCs. An annual report summarizing activities
of the Regulatory Commission every year is submitted
to the State Government. However, the report does
not have an evaluation mechanism to administer the
effectiveness of decisions/guidelines/regulations notified
by SERC during the period under consideration. The
evaluation mechanism may therefore require adequate
institutional strengthening.
A study conducted by Prayas Energy Group indicates
that the Regulatory Commission are not complying with
the preparation of annual reports. The study indicates
that annual reports of many SERCs including Bihar, Tamil
Nadu, Haryana and Uttarakhand are not available on
their website while a few have annual reports which are
3-4 years old.
An alternative mechanism of monitoring of SERCs
performance is through APTEL which can review the
Orders of the Commission based on the petition filed
by the aggrieved party. However, currently the APTEL
is not mandated to routinely monitor or review SERC
performance.
Therefore, it is considered that establishment of a
process for performance review of SERCs could be
useful in encouraging them to maintain their focus on
the key expectations and associated timelines. While
there was some progress on such an initiative, the
proposed committee for the same included government
representatives which attracted severe criticism from
various stakeholders. A framework at the Forum of
Regulators level with the oversight of the Appellate
Tribunal could be an acceptable and effective approach
in taking this forward.
This has precedence in key developed countries like the
UK and the United States. In the United Kingdom, the
Committee on Regulatory Reforms and the Committee
on Delegated Powers and Regulation specifically oversee
the working of all regulators across sectors. In United
States as well regulators are required to prepare a
cost-benefit analysis before formulation of rules which
are reviewed by the chief regulatory oversight body:
Office of Information and Regulatory Affairs (OIRA), and
subsequently by the Congress.
However, in addition to mandating involvement of the
State Government on FRP related aspects, the Draft
Bill covers State Government involvement on several
key issues of immense relevance to all state owned
distribution utilities, such as:
Section
Summary of key aspects
Section 3:
State Electricity
Distribution
Management
Statement to be
laid before the
State Legislature
• S tate Government to lay before State Legislature in each
financial year during budget session specific targets/ KPIs on
key aspects including sustainability, accounting, regulatory
compliance, tariff filings etc.
• Action plan for execution strategies, monitoring and
feedback process for the strategic KPIs;
• Assessment of compliance by respective agencies;
Section 4: Long
term Planning for
sustainability of
State Distribution
Licensee
State government
shall take
appropriate
measures to
provide for the
following:
• L icensee estimates demand and availability on long-term
basis and enters into contracts (PPAs) with due approval
from SERC
• Preparation and regulatory approval of loss reduction plan
• Introduction of energy accounting up to DT level;
• Advance declaration of subsidy to specific consumer
categories
• Creation of annual budgetary provision and timely release
of subsidies
• Payment to licensee in respect of supply to State
Government establishments
• Setting up of special courts;
• Operationalization of SLDC;
• Propagation of private sector participation and competition
in the electricity distribution sector;
Section 6:
Accounting
measures
• Establishment of Empowered Committee to ensure
identification, provisioning and write offs of receivables and bad
and doubtful debts;
• Preparation of accounting policies for financial
management and management of receivables and provisioning
of bad and doubtful debts;
• Preparation of fixed asset registers;
Section 7:
Corporate
Governance
• O
ptimal combination of functional, nominee and
independent directors on Board of Directors of utilities:
- Functional directors shall not exceed 50%;
- Maximum 2 Nominee Directors by State Government;
- Number of Independent Directors as per Companies Act
• State Government to lay down code of conduct for
all Board Members and Senior Management of State
Distribution Licensees (in line with Guidelines on Corporate
Governance for Public Sector Enterprises, notified by the
Department of Public Enterprises, GoI);
Section 8:
Regulatory
Compliance and
Tariff filings
i-annual State Government level review of regulatory
• B
compliance by distribution licensee;
• Ensure regular and timely filing of ARR/ True-up and Tariff
petitions by distribution licensee;
• State Government to make fiscal provision for grant
and any adverse impact out of regulatory disallowances
imposed upon the distribution licensee;
• State Government to ensure liquidation of regulatory assets;
Ensuring Accountability of State Government
The Ministry of Power, Government of India in
September, 2013 had introduced the “Model State
Electricity Distribution Management Responsibility Bill,
2013”. The Model Bill aims to provide for responsibilities
of State Governments to ensure financial and
operational turn around and long-term sustainability of
the state owned distribution licensees. The Model Bill
has presently been made mandatory by the MoP only
for the states participating in the Financial Restructuring
Plan.
147
It is felt that, the Model State Electricity Distribution
Management Responsibility Bill, 2013 along with
suitable changes and adaptations could be pursued
for implementation in all states, irrespective of their
participation in the FRP Scheme. The implementation
of the same becomes more critical where the states are
lagging in their performance on AT&C losses and are
also facing wide gap between ACOS and ARR. The MoP,
GoI may consider making Distribution Responsibility Bill
mandatory for states to also avail benefits under Central
Sector Schemes, especially those aimed at reforms and
efficiency improvement such as the RAPDRP, NEF interest
subsidy scheme etc.
Ensuring constructive participation and accountability
of the State Governments, in their capacity of being
the sole shareholders of the state owned utilities, is
therefore seen as one of the most critical areas for the
future set of reforms in the distribution sector.
148
Coal Regulatory Issues
Executive summary
Coal – the pre-dominant source of primary energy
in India
Coal meets the highest share of primary energy needs
in India. It is the biggest conventional energy source
for electricity generation in India. It enjoys the largest
share in terms of installed capacity in India’s energy mix.
Coal demand in India is driven by end users in power
generation, which is the largest consumer, followed by
iron & steel, cement, fertilizer, etc. Though the share of
renewable energy is expected to increase in coming years,
coal is likely to remain India’s main source of energy for
the next two to three decades. In view of that, and to
explore India’s huge coal reserve, coal production and
supply need to be ramped up rapidly from the present
level to keep pace with the ever growing demand.
An independent umbrella regulatory body will play an
important role in this regard, as it will ensure transparency
in coal mining activities, protect investor and consumer
interests, attract investments and promote competition.
This will drive performance improvement of the coal
sector as well as the Indian economy as a whole.
Key issues plaguing the Indian coal sector
Coal supply shortage and rising import
Indigenous coal production in India is failing to keep
pace with the ever-growing coal demand, resulting
in reduced production levels by the end users. This
demand – supply gap is met by importing coal. This
leads to exposure of the Indian coal sector to volatility of
international coal price and change in international coal
regulations.
Irrational and inadequate coal linkages
The FSAs signed by CIL with power producers following
the Presidential directive point to a serious gap between
the incremental coal linkage requirement by the power
plants and the incremental forecasted coal production
by CIL, which shows lack of coordination between
relevant ministries / departments involved in planning of
coal production and linkages. Moreover, even if power
plants receive the contracted quantity of coal, that will
not be sufficient enough to run the plants at their rated
capacity. These indicate serious flaw in the coal linkage
planning mechanism, and show its lack of harmony
with coal production and generation capacity addition
planning, and actual progress of mining and power plant
projects.
Bottlenecks in coal price pooling mechanism
150
The coal price pooling mechanism, as being evaluated by
the Government of India, is expected to address the coal
supply shortage issue as well as mitigate the impacts
of high price of imported coal. However it will be
uneconomical for inland power plants located far away
from coastal regions to use imported coal, and such
power plants should not be charged the pooled price of
coal. Otherwise this mechanism will lead to undue rise
in electricity tariffs from these plants, and a subsequent
increase in financial burden on the already cash-starved
state discoms, and on the electricity end users. Hence
the price pooling mechanism should be devised in such
a manner so that it can balance the interests of power
producers, state discoms and electricity end users.
Delay in clearances and land acquisition
Obtaining all requisite clearances to develop a new
coal mine often takes years mainly due to multiplicity
of clearing agencies, lack of coordination, delay in land
acquisition and R&R process, and delay from captive coal
block allottees’ in applying for mining lease. All these
lead to delay in commencement of coal mining.
Auctioning of captive coal blocks
Following the mass de-allocation of captive coal blocks
(all but four of 218 blocks awarded between 1993 and
2010) by the Supreme Court, the Government of India
has initiated auctioning of the cancelled coal mines /
blocks, and has already earmarked 46 Schedule-II & III
coal mines / blocks for allocation through e-auction by
the Nominated Authority.
Environmental impacts and non-compliance to
environmental norms
Coal mining activities result in air and water pollution
in nearby areas. Present environmental scenario in coal
mining sector is in distress, indicating dysfunctional
environmental monitoring and enforcement systems,
leading to non-compliance of environmental norms by
coal miners.
Inadequate coal transportation and evacuation
infrastructure
Increasing coal demand requires simultaneous
augmentation of coal transportation infrastructure. In
India, coal is primarily transported by rail. However,
progress in development of rail network for coal
transportation has been slow, leading to build up of
pit-head coal stocks. Slow progress in rail network
augmentation offsets the advantage of increased
coal production at pit-head. Main reasons of such
slow progress of rail projects are long duration for
environmental and forest clearances, and long gestation
period for such projects. Over-dependence on rail
network can be reduced by choosing an optimal
mix of other transportation arrangements like crosscountry pipe conveyor, coal slurry pipeline, cable belt
conveyor, inland water-ways, along with rail networks.
Coordination among relevant ministries for development
of coal transportation infrastructure will be of utmost
importance.
Inadequate coal washing capacity
Indian coal is characterized by high ash content.
Therefore, penetration of coal washing technology is
of high importance, as it will help in reduction of ash
content in coal. However present coal washing capacity
in India is inadequate to wash all the coal produced.
This indicates that huge investment and capacity
addition is needed in the area of coal washing.
Weak HR strength and productivity
Weak HR strength and productivity in organizations
like CIL, Coal Controller’s Organization (CCO) leads to
sub-optimal management of their operations, and failure
to take advantage of improved mining technologies.
Very low penetration of underground coal mining
technology
Only 10% of Indian coal is produced from underground
mines (Source: CCO, 2011). With properly implemented
underground mining, displacement, clearance, land
acquisition and pollution related problems are likely to
be significantly reduced. Although underground mining
is strategically desirable, it continues to be neglected.
Labour health and safety
It has been observed that mine fatalities are increasing
and a very low percentage of contractual employees
undergo regular health check-ups. The institutional
safety mechanisms intended to ensure labour health and
safety are not functioning as desired.
Illegal mining and coal theft
Illegal mining and coal diversion has resulted in inefficient
and unaccounted use of the precious resource, hazardous
and inefficient mining practice, increased pollution,
increased crime and loss of revenue to the State. To
address this challenge, innovative solutions are required
with social and law-and-order dimensions.
Coal reserves estimation
The methodology of Indian Standard Procedure (ISP)
followed in India for coal reserves estimation has
considerable uncertainty in it. Adopting the modern
United Nations Framework Classification (UNFC)
methodology has resulted in significant downward
correction of extractable mineral reserves in many other
countries. This is a serious concern as reserve estimates
form the basis for the country’s energy planning.
Publication of coal statistics
The Office of the Coal Controller’s Organization (CCO) is
responsible for collecting and publishing key information
and statistics about the coal sector. However no
statistics are available on the website of CCO at present.
Availability of all relevant, updated data, from a single
source in a consolidated and easily accessible manner
would provide stakeholders with key information. This
would, in turn, help improve accountability of the sector.
Monopoly of CIL
In its recent judgment, the Competition Commission
of India (CCI) had observed that Coal India Limited
(CIL) had been abusing Its dominant position and had
directed CIL to cease and desist from indulging in the
conduct which is in contravention of the provisions of
the Competition Act.
Roles of the coal regulator in the context of
present issues plaguing the Indian coal sector
The Government of India through an executive order in
March 2014 constituted the Coal Regulatory Authority
(CRA) under the overall administrative control of the
Ministry of Coal. It was supposed to function as an
interim non-statutory body till the approval of the Coal
Regulatory Authority Bill, 2013 tabled by the Ministry of
Coal in December 2013. However, the regulator remains
non-functional and no appointments have been made in
the organization.
In addition to the roles of the regulator as envisaged
in the Coal Regulatory Authority Bill, 2013, some more
roles of the regulator have been proposed in context
with the present key concern areas in the Indian coal
sector as discussed earlier. All the roles taken together
will make the coal regulator act as an independent
umbrella regulatory body for the coal sector, and address
the issues in the sector.
151
Strategic Context
Introduction
Coal is the pre-dominant source of primary energy
in India, with the largest share of India’s electricity
production. It has the largest domestic reserve base
among the major fuel sources. Performance of the
coal sector is of utmost importance to the country’s
economy as it plays a critical role in the value chains
of all major industrial segments, namely electricity,
steel, cement, etc. Given the growing importance of
coal in the emerging economic landscape in India, the
relevant activities namely development of coal mines,
coal production and dispatch to end users have to
be streamlined with the bottlenecks addressed to the
greatest extent possible. An independent umbrella
regulatory body will play an important role in this
regard, as it will ensure transparency in the coal mining
activities, protect investor and consumer interests,
attract investments and promote competition, thereby
helping improvement of performance of the coal sector
as well as the Indian economy as a whole.
Coal – dominant source of energy in India
In 2013, coal met around 55% of the total primary
energy need in India, the highest among all available
energy sources. This primacy of coal has been growing
over the years. Given resource constraints and other
factors, this is expected to continue
Figure 1: Primary energy consumption in India
(FY13)
Hydro
Electric 5.0%
Renewables
2.0%
Nuclear
1.0%
Figure 2: Generation by fuel source (FY14)
Nuclear,
3.6%
Diesel, 0.2%
Hydro,
14.0%
Natural Gas,
4.6%
Coal, 77.6%
Source: CEA
India is ranked fifth globally in terms of coal reserves.
The coal reserves are found up to a depth of 1200
meters. The Geological Survey of India estimates the
reserves at around 301 billion tonne as on 01.04.2014,
out of which coking coal accounts for around 11%,
non-coking coal accounts for 88% and the remaining is
tertiary coal.
Sectors dependent on Coal
Figure 3: Sector-wise demand for coal (FY13)
Cement
3.1%
Others,
15.1%
Iron & Steel
10.2%
Natural Gas
8.0%
Oil , 29.0%
Coal , 55.0%
Source: CEA
Coal based generation capacity dominates the electricity
generation capacity of India. Coal capacity accounts
of 60% of installed capacity, as of September 2014. In
152
FY14, the generation share of coal based electricity was
77.6% of total electricity generation from conventional
energy sources in India.
Power
71.6%
The major industrial sectors consuming coal include
power, iron & steel, cement, etc. Steel plants are
consumers of coking coal, whereas power, cement,
sponge iron, fertilizer, etc. are the consumers of
non-coking coal. Power sector is the largest consumer
of coal, followed by iron & steel, and cement segments.
Figure 4: Estimated coal demand (FY22)
Cement,
4.8%
Projected demand for Coal
Others,
7.9%
The future demand for coal in India will be driven by
performance of the end use industries. The Working
Group in their report on Coal & Lignite for the 12th Five
Year plan assessed the demand for coal based upon
projected demand from the end use sectors like power,
steel, cement, sponge iron, brick, aluminium, paper,
Figure 6: Coal demand in India (Million Tonne)
Iron &
Steel
12.0%
1373
1500
Power
75.3%
980.5
1000
638.73
713.39
500
Source: Report of the Working Group on Coal & Lignite for
formulation of Twelfth Five Year Plan
Figure 5: Estimated coal demand (FY17)
Cement,
5.7%
0
2011-12
(Actual)
Others,
6.7%
2012-13
(Actual)
2016-17
(Projected)
2021-22
(Projected)
textiles, glass & refractory, etc
Source: Report of the Working Group on Coal & Lignite for
formulation of 12th 5-year Plan, Annual Report, 2013-14, Ministry
of Coal, GoI
Iron &
Steel,
13.5%
The above graph indicates an estimated increase in coal
demand at a CAGR of 8.3% till FY 2016-17, and at a
CAGR of 7% till FY 2021-22.
Power,
74.1%
Source: Report of the Working Group on Coal & Lignite for
formulation of Twelfth Five Year Plan
The same trend is expected to follow in India in the next
ten years with the power sector being the largest driver
for coal demand, followed by iron & steel, and cement
industries. This shows that coal will continue to play a
critical role in the industrial growth of the country, and
will remain the major contributor to the performance of
the above mentioned industries.
153
Indian Coal Sector – Institutional Structure
Coal mine exploration to coal consumption cycle,
and mapping of functions of different institutions
in coal sector
Exploration
Mine
Development
Coal
Production
Coal
Washing
Coal
Transport
Coal Consumption
• CMPDIL
154
• CIL
• SCCL
• NLC
• Captive miners
• CIL
• SCCL
• NLC
• Captive miners
• CIL
• Private players
• End Users
Policy
formulation
Coal pricing
Grant mining
license
Procedure &
standard for
coal sampling
Quality
surveillance
Ministry of
Coal, GoI
CIL, SCCL,
NLC (Coal
producers)
Respective
State Mining
Depts, Ministry
of Coal
CCO
Third party coal
samplers
Indian Coal Sector – legislative framework
The coal sector in India is governed by various laws
and regulations. Some of these are specific to the coal
mining industry, and some are only incidental to the
sector. Forest (Conservation) Act, 1980 and Environment
(Protection) Act, 1986, enacted for the protection
of forest and environment, are incidental to the coal
mining business. The various legislations governing the
sector are depicted in the table below:
Legislation
Brief Description
The Mines Act, 1952
regulation of labour and
safety in mines
The Mines and Minerals
(Development and
Regulation) Act, 1957
and its amendments
to regulate mining and
mineral development in
India;
coal listed as schedule-1
material
The Coal Mines
(Nationalisation) Act,
1973
nationalization of private
coal mines
The Coal Mines
(Conservation and
Development) Act, 1974
conservation of coal and
development of coal
mines
The Coal Bearing
Areas (Acquisition and
Development) Act, 1957
and its amendments
acquisition of unworked
land containing or likely
to contain coal deposits
by the State, thereby
ensuring greater public
control over the coal
mining industry
The Colliery Control
Rules, 2004
power of the Coal
Controller
Forest (Conservation) Act,
1980 and its amendment
conservation of forests
The Environment
(Protection) Act, 1986
protection and
improvement of
environment
Clearances required for a new coal mine
In the present legislative framework, a captive coal
block allottee has to obtain a number of clearances
and approvals before commencing production. The
approvals and approving agencies are mentioned in the
table below:
Approvals / Clearances
Approving Agency / Authority
Mining Lease
Approval or Purchase of
Geological Report
MPDIL (or Mineral Exploration Corporation Ltd,
• C
SCCL)
• Directorate General of Civil Aviation and Ministry
of Defense (for unexplored blocks if Arial
reconnaissance is conceived)
Mine Plan
• CMPDIL
• Coal Controller
Mine Safety
• Directorate General of Mine Safety
Mining Technology &
Conservation Measures, &Z
Coal Categorization
• Coal Controller
Mining Lease
• S tate Government (Mining Department),
Ministry of Coal (GoI) – Reviewed at various
levels within the Departments at the State &
Central Government level
Environment
Environment Impact
Assessment / Environment
Management Plan
• State Pollution Control Board
• State Environmental Impact Assessment
Authority
• State Water Resource and Water Supply
Department
• District Administration (for various aspects of
site clearance)
• Coal Controller
• Department of Environment (MoEF)
Forest
Forest Clearance & Valuing
Compensatory Afforestation
• Committee to Advise GoI (MoEF)
• Office of Chief Conservation of Forests (Regional
Office of MoEF)
• State Forest Department & District Authority
• Department of Forest (MoEF)
• State Revenue Department
Land Acquisition
• Ministry of Coal (under provision of CBAADA)
• State Department of Revenue
Infrastructure (Electricity,
Water, Railways, Road etc.)
• A
ppropriate Departments of the State Govt. &
Ministries of Central Govt.
The above statutory clearances involve central and state
ministries, are often a lengthy process and lack clarity.
This causes significant delay in production from the
allotted captive coal blocks.
155
Present Issues Pertaining to the
Indian Coal Sector
Coal supply shortage and rising import
Domestic coal production is failing to keep pace with
ever-increasing demand, resulting in rapid increase of
the demand supply gap.
Figure 7: Coal demand supply gap (Million Tonne)
800
533
mtpa
730
713
524
593
540
559
639
556
568
566
571
400
0
2010-11
2011-12
Domestic Coal Production
2012-13
Domestic Coal Supply
2013-14
Coal Demand
Source: Annual Reports, 2011-12 & 2013-14, Ministry of Coal, GoI
Figure 8: Rising coal imports (Million Tonne)
131
140
105
mtpa
71
70
49
32
33
37
19
0
2010-11
2011-12
Coking Coal
2012-13
2013-14
Non-Coking Coal
Source: Annual Reports, 2011-12 & 2013-14, Ministry of Coal, GoI
The major coal producers in India, CIL and SCCL,
who produce nearly 90% of the country’s total coal
production, have been unable to meet the demand
of end users. The main reasons for such reduced
supply of coal can be attributed to delay in clearances
and land acquisition for new mines, inadequate coal
transportation and evacuation infrastructure, low
manpower productivity, and CIL monopoly. This has
resulted in low PLF of the coal based power stations,
reduced output of other end users, and end users filling
the supply gap by importing coal.
156
Coking coal has been imported by SAIL and other steel
manufacturing units. Coal based power plants, cement
plants and sponge iron plants are importing non-coking
coal. Rise in coal imports resulted in exposure of the
Indian power sector to the volatility of international
coal prices, as well as changes to international coal
regulations. Coal cost has been made a pass through,
thus making the end users vulnerable to international
coal price rise.
To ensure increase in domestic coal supply, a Presidential
directive was issued to CIL asking it to enter into legally
binding Fuel Supply Agreements (FSA) with power
producers. As per those FSAs, CIL will mandatorily supply
at least 80% of the required amount of coal to the
power plants. However the penalty to be paid by CIL for
coal supply below trigger level of 80%, as approved by
the CIL board, is much lower than that sought by the
PMO.
Irrational and inadequate coal linkages
As per Presidential directive issued to CIL, it has signed
a total of 160 FSAs till 31.03.2014 with power plants
for an aggregate capacity of 72,575 MW, which are
commissioned or to be commissioned during the
period from 01.04.2009 to 31.03.2015, and an annual
contracted quantity of 221.6 MT (Source: Annual
Report, Ministry of Coal, GoI). This requires incremental
coal production of 221.6 MT by CIL by FY 15. In sharp
contrast, the projected incremental coal production
under business-as-usual scenario by CIL in the entire
12th Plan period, as envisaged in the Working Group
report on Coal and Lignite for the 12th 5-year Plan,
has been only 118.5 MT (including underground
production). Such a gap of incremental demand of
coal linkages from power plants and coal production
points to serious lack of coordination between different
ministries involved in planning of coal production and
linkages. Clearly the plants with whom FSAs have been
signed will not get the contracted quantity of coal.
Moreover the actual coal allocation has only been 3.05
MTPA/GW as against the norm of 5 MTPA/GW, which
means even if the plants receive the contracted quantity
of coal, they will not be able to utilize their full capacity.
These issues indicate that serious thought is to be given
to the coal linkage mechanism, to be carried out in
harmony with coal production and generation capacity
addition planning, and actual progress of mining and
power plant projects.
targeting of compensation and even those eligible for
compensation often being offered inadequate and / or
delayed compensation have led to considerable social
distress, alienation of local population and eventually
local resistance to coal mining.
Bottlenecks in coal price pooling mechanism
Captive coal block allottees have also been seen delaying
in exploring and applying for mining lease after block
allocation, which led to delay in commencement of
mining activities. Over time, the number of captive coal
blocks producing coal and the quantity of coal produced
from such blocks has fallen well short of expectations.
Out of 218 captive coal blocks allocated since 1993,
production was started in only 40 blocks.
To meet its supply commitments, CIL is presently
envisaging the option of importing coal and blending
it with its own stock of domestic coal to supply its
customers. In order to mitigate the impact of high
prices of imported coal, one possible alternative is price
pooling of coal, wherein price of the imported coal will
be distributed among all coal based power plants. The
Government of India is presently evaluating the option
of price pooling of coal applicable for coal based power
plants commissioned after 2009. Most of these power
projects are stranded either due to lack of coal linkages
or due to cancellation of coal block allocation. Import of
coal by CIL to meet the supply gap and implementation
of the price pooling mechanism will definitely address
the issue of coal supply for these power projects.
However, it will be uneconomical for power plants
located far away from coastal areas to use imported
coal, and hence such power plants should not be
charged pooled price of coal. Otherwise this will lead to
undue rise of electricity tariff from these plants, which
will increase the financial burden on the already cashstrapped State discoms. The end users of electricity may
also have to pay higher electricity bills. The price pooling
mechanism should be devised in such a manner that
it should balance the interests of the power producer,
State discoms and end users of electricity.
Delay in clearances and land acquisition for coal
mines
Obtaining all the requisite clearances to develop a new
coal mine often takes years due to various causes.
Multiplicity of clearing agencies and lack of coordination
between them is one of the dominant reasons for delays
in mine development.
Land acquisition delay is another major bottleneck in the
coal mine development process. The land acquisition
process involves displacement & rehabilitation of local
population, compensation payments and benefits
sharing. Weak public participatory processes, poor
Auctioning of captive coal blocks
The Supreme Court in its judgment dated Aug 25, 2014
and order dated Sep 24, 2014 scrapped the allocation
of all but four of the 218 captive coal blocks awarded
between 1993 and 2010, stating that allocation of
the coal blocks had been illegal and arbitrary, as no
transparent process of auction through competitive
bidding was followed.
The Ministry of Coal, Government of India subsequently
issued an approach paper for auctioning of coal mines
on Dec 17, 2014, seeking stakeholder comments. The
Ministry of Coal, Government of India in accordance
to the provisions of the Coal Mines (Special Provisions)
Ordinance, 2014, has also earmarked 46 Schedule-II &
III coal mines / blocks for allocation through e-auction
by the Nominated Authority, with bid due date of Jan
31, 2015 for Schedule-II mines and Feb 14, 2015 for
Schedule-III mines.
Environmental impacts and non-compliance to
environmental norms
Coal mining, especially opencast mining, results in severe
air and water pollution in the areas near the mines.
Coal mining, particularly open cast mining, results in
air pollution because of coal dust, causing respiratory
diseases and lower agricultural productivity. Surface
water and ground water get polluted due to discharge
of chemicals used for mine explosion, dispersal of
sediments into drainage system by erosion of overburden dumps, lowering of ground water level in mine
area due to exhaustive pumping of mine water, etc. Also
157
the current environmental monitoring and enforcement
systems are dysfunctional, leading to non-compliance of
environmental norms by coal miners.
prompt evacuation of coal from pit head locations,
as well as carry imported coal from ports to desired
destinations.
Inadequate coal transportation or evacuation
infrastructure
To augment such infrastructure, there has to be seamless
coordination between relevant ministries, which will
ensure fast execution of the transportation infrastructure
projects, and help address the transportation bottlenecks.
Many end users of coal are located away from the
pit-head mines. So increasing demand for coal calls
for concurrent augmentation of coal transportation
infrastructure.
Primary mode of coal transport in India is through
the rail network as it is the most efficient means for
long distance inland coal transportation. However,
progress in development of rail network for coal
transportation has been slow. The pit-head closing
stock of raw coal as on March 31, 2013 was 63.409
MT, which could not be transported to the end users
mainly due to transportation bottleneck. Slow progress
in augmentation of the rail network is off-setting the
advantage of increased production at pit-head. The
inadequate rail infrastructure remains a key bottleneck
in the coal supply chain. Such slow augmentation in rail
infrastructure can be attributable to long duration in
obtaining environment and forest clearances, and long
gestation period in construction of rail infrastructure.
Inadequate coal washing capacity
Indian coal is characterized by high ash content (around
40%). However the directive of Ministry of Environment
and Forests (MoEF) restricts use of coal with more than
34% ash content in power stations located 1000 km
away from pit heads. MoEF is contemplating to further
reduce this distance to 500 km. Use of washed coal will
be critical for thermal power plants, as coal washing
reduces ash content, transportation burden, pollution and
ash disposal requirement. Further, this will improve power
plant efficiency. However present capacity of non-coking
coal washeries in the country is only 110 mtpa as against
the country’s coal production of about 565 mtpa., which
indicates that huge investment and capacity addition is
needed in the area of coal washing in order to ensure
supply of better quality of coal to end users.
Weak HR strength and productivity
For example, in the 11th plan working group report,
three critical rail links to three potential coalfields
of North Karanpura (Jharkhand), Ib Valley (Odisha)
and Mand-Raigarh Coalfield (Chhattisgarh) were
identified. Completion of these links is expected to
lead to production and offtake of 200 MT of coal from
these coalfields. However, these links are yet to be
commissioned, and are expected to be ready only by
2016 end.
There is over-dependence on rail network for longdistance inland coal transportation. To reduce such
over-dependence, alternatives for long distance coal
transportation like cross-country pipe conveyor, cable
belt conveyors, coal slurry pipeline, or water-way coal
transportation may be envisaged. All these options
have their own advantages and disadvantages, but
an optimal mix of these options along with the rail
network, according to the nature of geographical
terrains, proximity of the power plants to the coal mines,
proximity to existing rail / road / water ways, would
form a transportation infrastructure that would facilitate
158
The manpower productivity in CIL for both open cast
and underground mines is considerably lower than other
top coal producing countries. CIL has not recruited
personnel at executive and management levels for
many years. This has put restrictions on its ability to
effectively manage its operations and take advantage of
improvement in mining technology such as much larger
excavators and long-wall mining.
CCO is expected to monitor the production from
different coal blocks. However, it is unable to fulfil its
responsibility due to lack of technical staff.
Very low penetration of underground coal mining
technology
Compared to a world average of 60% of total coal
production being extracted through underground
operation, only 10% of Indian coal is produced from
underground. As per CMPDIL, about 22% of India’s
proven coal reserves lie at a depth greater than 300
m, and is suitable for extraction through underground
mining. With properly implemented underground
mining, displacement, clearance, land acquisition and
pollution related problems are likely to be lower.
updated data, from a single source in a consolidated
and easily accessible manner would provide stakeholders
with key information. This would, in turn, help improve
accountability of the sector.
Labour health and safety
Monopoly of CIL
Safety in Indian coal mines is an area of major concern.
Mine fatalities are on a rising trend and significantly low
percentage of contractual employees undergo regular
health check-up. The institutional safety mechanisms
intended to ensure labour health and safety are not
functioning as desired.
CIL is the monopoly supplier of coal in India with above
80% of coal supplied coming from CIL. CIL has allegedly
taken undue advantage of its dominant CIL is the
monopoly supplier of coal in India with above 80% of
coal supplied coming from CIL. In its recent judgment,
the Competition Commission of India (CCI) had
observed that Coal India Limited (CIL) had been abusing
its dominant position and had directed CIL to cease
and desist from indulging in the conduct which is in
contravention of the provisions of the Competition Act.
Illegal mining and coal theft
Illegal mining and coal diversion has resulted in
inefficient and unaccounted use of the precious
resource, hazardous and inefficient mining practices,
increased pollution, increased crime and loss of revenue
to the state. To address this challenge, innovative
solutions are required with social and law-and-order
dimensions.
Coal reserves estimation
In India, estimation of coal reserves is computed by
the Geological Survey of India (GSI) as per the CMPDIL
adopted Indian Standard Procedure (ISP) code of
1956. There is considerable uncertainty about the coal
reserves as estimated in this method. Adopting the
modern United Nations Framework Classification (UNFC)
methodology has resulted in significant downward
corrections of extractable mineral reserves in other
countries like Germany, Poland, South Africa, and for
other minerals like copper, lead-zinc, rock phosphate in
India. This is a serious concern as reserve estimates form
the basis for the country’s energy planning.
Publication of coal statistics
The Office of the Coal Controller’s Organization (CCO) is
responsible for collecting and publishing key information
and statistics about the coal sector. However no statistics
are available on the website of CCO at present. Some
data regarding the coal sector is available in a scattered
manner in the Ministry of Coal, GoI website, and in the
websites of CIL, SCCL, etc. Availability of all relevant,
There has been dispute over the quality of coal supplied
by CIL to power plants, as power plants face issues
of receiving low grade coal mixed with stones and
boulders. Low grade of coal supply results in high
detention of railway rakes, damage to coal handling
equipment and boiler tubes in power plants, and
increased pollution. This low quality supply problem
persists even after introduction of third party sampling
mechanism at coal loading points. Also consumers
getting coal supply under FSAs with CIL are facing
shortage in quantity of coal supply. However in spite of
these quantity and quality problems, there seems to be
no effective grievance redressal mechanisms.
A presidential directive was issued to CIL asking it to
enter into legally binding Fuel Supply Agreements (FSA)
with power producers. As per those FSAs, trigger level
for imposing penalty is 80% of the Annual Contracted
Quantity (ACQ). The penalty is decided by the CIL board,
and is lower than that sought by the PMO. Also the FSAs
don’t bind CIL to make due efforts to source imported
coal at cheaper price but binds the consumer to pay for
the price quoted by CIL.
Coal prices were deregulated in 2000 and coal producers
were allowed to set the prices of coal they produced.
However under a monopolistic scenario of coal supply,
the rationale for deregulation of pricing is difficult to
understand.
159
Roles of the Coal Regulator in
the context of present issues in
the Indian coal sector
Formation of the Coal Regulatory Authority by
the Government of India
The Government of India, through an executive order
on March 4, 2014, constituted the Coal Regulatory
Authority (CRA) under the overall administrative control
of the Ministry of Coal. It was supposed to function
as an interim non-statutory body till the approval of
the Coal Regulatory Authority Bill, 2013 tabled by the
Ministry of Coal in December 2013. However till now,
the regulator remains as a non-operational entity, and no
appointment has been made in the organization.
The functions of the Coal Regulatory Authority as
envisaged in the Coal Regulatory Authority Bill, 2013 are:
• Specify, by regulations, methods of testing for
declaration of grades or quality of coal;
• monitor and enforce closure of mines as per
approved mine project plan towards closure of mine;
• ensure adherence to approved mining plan;
• specify the principles and methodologies for
determination of price of raw coal, washed coal and
any other by-product generated during the process
of coal washing;
• call for information, record or other documents from
the entities and publish statistics and other data in
relation to the coal industry;
• specify by regulations procedure for automatic coal
sampling and weighing;
• specify by regulations the standards of performance
and norms of operational efficiency except in the
area related to mines safety;
• adjudicate upon disputes between the parties in
relation to grading, quality, testing, pricing, supply
and sampling of coal;
• specify by regulations, with the prior approval of
the Central Government, the terms and conditions
which shall apply to the holders of permission
granted by the Central Government for opening of a
coal mine, seam or section of a seam;
• recommend for consideration of the Central
Government suspension or cancellation of
permission granted by the Central Government for
opening a coal mine, seam or a section of a seam;
• Advisory to the Central Government on:
-formulation of policies in coal sector, including
allotment or earmarking of coal blocks for any
purpose, through any mode, and coal linkage;
-promotion of competition, efficiency and
economy in activities of the coal industry;
160
-promotion of investment in coal industry;
-development of various mining technologies,
beneficiation methods to improve mining and
conservation of coal resources.
Evaluation of the functions of the Coal
Regulatory Authority – Discussion points &
Recommendations
• T he following table identifies those functions which
are not present in the list of envisaged functions, but
are desirable for an independent coal regulator, in
light of the present issues of the Indian coal sector:
Present coal sector
issues – Discussion
Points
Proposed function of coal regulator to address the
issue
Irrational & inadequate
coal linkages and
coal transportation
infrastructure
• P olicy & guideline formulation with an aim for
rationalization of current and future coal linkages
(including proposal for dedicated coal corridor,
single window mechanism for development of coal
transportation links, etc.)
• Granting approval to FSA-s between CIL and end
users
Bottlenecks in coal price • Laying out a transparent and uniform mechanism
pooling mechanism
for price pooling of coal, and approve the pooled
prices of coal determined as per the price pooling
mechanism
Delay in clearances and • Policy & guideline formulation with an aim to
streamline the clearance procedures for land
land acquisition for new
acquisition (including proposal for formulation of a
coal mines
single window clearance agency for new coal mines)
Auctioning of captive
coal blocks
• R
esolving disputes in relation to coal block auctioning
process
Inadequate coal
washing facility
• L aying out policy and monitoring norms for use of
washed coal
Weak HR strength
& productivity, and
dysfunctional labour
health and safety
mechanism
• F ormulating operational guidelines and monitoring
mechanisms for coal mines, including benchmarking
of manpower productivity, equipment productivity,
operational health & safety
Illegal mining and coal
theft
• F raming of guidelines & monitoring mechanisms for
mitigation of coal leakages (including proposal for
formulation of special task force, etc.)
All the functions mentioned above along with the
functions envisaged in Coal Regulatory Authority Bill,
2013 will make the coal regulator act as an independent
umbrella regulatory body for the coal sector, and address
the loopholes in the sector.
Pricing of O & G Role of Regulator
161
Executive Summary
As per forecast made by the Working group on energy
sector for the 12th Plan, the country requires energy
supply to grow at CAGR of 6.5 percent to maintain
the growth rate of 9 percent over the next five years.
It is projected that the oil and gas requirement by the
terminal year of the 12th Plan would reach 204.80
mtoe and 87.22 mtoe respectively. This demand for oil
and gas would be fulfilled by import of 164.8 mtoe (or
80.5 percent) crude oil and 24.8 mtoe (28.4 percent)
natural gas in 2016-17. During the 12th Plan, import
dependence on crude oil is expected to increase from 76
percent in 2010-11 to 80 percent in 2016-17.
Before the introduction of NELP, India's Exploration
and Production (E&P) sector was largely dominated
by ONGC and Oil India Limited until the 1990s. Since
1993, the Government of India has signed Production
Sharing Contracts (PSCs) for 28 exploration blocks
under Pre-NELP rounds, 11 of which have already been
relinquished or surrendered. At present, there are 16
exploration blocks under operation.
The New Exploration Licensing Policy (NELP) was
introduced in 1997-98 by the Government of India
to boost hydrocarbon exploration in the country. The
Directorate General of Hydrocarbon (DGH) has held
nine rounds of bidding under NELP I to NELP IX to date.
Under the NELP I-IX rounds, the DGH has awarded 248
blocks covering a total area of 1,468,511 sq km.
For Natural Gas, Government of India has recently
notified the New Domestic Natural Gas Pricing
Guidelines, 2014 which prescribe a formula for
determination of well head price. The gas price,
determined, under these guidelines would be applicable
to all gas produced from nomination fields given to
ONGC and OIL India, New Exploration and Licensing
Policy (NELP) blocks, such PreNELP blocks where,
the Production Sharing Contract, (PSC) provides for
Government approval of gas prices and Coal Bed
Methane (CBM) blocks. The pricing formula takes into
162
account the price prevailing at Henry Hub, NBP, Alberta
Canada and Russia.
Pricing in the upstream sector are governed through
Production sharing contracts. Specifically in context
of the PSC framework, the prime concerns have
been hovering around delayed decision making,
cost implications, multiple level of scrutiny, micromanagement by the government.
In order to uphold investor interest in the sector, it is
important for the government to optimally balance the
interests of both the government and the oil companies.
An alternative approach to address the above concerns
had been proposed by the Rangarajan Committee in
December 2012 viz. the Revenue Sharing Model.
Revenue Sharing Model has received a mixed response
from the stakeholders in the sector. The model ensures
that GOI will start recovering revenue from the start of
production. However, investor perception is that the
mechanism shifts the goalpost from enhancing E & P to
enhancement of revenues to the Government.
In order to reduce our import dependence, it is
important the overall pricing and revenue sharing
framework should provide long term clarity on the GOI
priorities related to maximisation of Exploration and
Production or the maximisation of realised profits in
order to resurrect the interest of E & P companies in the
sector. Besides, there is also an urgent need to address
the issues associated with poor geological database.
However, irrespective of the fiscal approach GOI should
extend key enablers like Open Acreage Licensing Policy
(OLAP), National Data Repository, E-governance/ SWC
and ensuring the sanctity of old contracts in order to
ensure better participation by the oil companies in the E
& P sector:
Strategic Context
The Directorate General of Hydrocarbons (DGH)
provides the Regulatory framework to the upstream
sector. For the midstream and downstream sectors, the
Petroleum and Natural Gas Regulatory Board (PNGRB)
has been entrusted with the responsibility for providing
authorisation for pipelines, tariff setting, operational
standards and exclusivity to CGD networks. Broadly,
the regulatory framework allows 100% FDI under
automatic route in upstream and midstream sectors.
The regulations under the downstream sector allow
49% investments in case of Public sector units (PSU) via
FIPB route and 100% in case of private companies in
the refining sector. For downstream sectors other than
refining, the framework allows 100% FDI under the
automatic route.
Licensing regime in Oil and Gas sector
Pre-New Exploration Licensing Policy (NELP)
Before the introduction of NELP, India's Exploration and
Production (E&P) sector was largely dominated by ONGC
and Oil India Limited until the 1990s. With the initiation
of the liberalization process in 1991, the upstream
sector was opened up with annual exploration bidding
rounds for small and medium size fields for development
by private companies and JVs. In 1992 and 1993, two
rounds of bidding for small and medium size fields were
held.
New Exploration Licensing Policy (NELP)
The New Exploration Licensing Policy (NELP) was
introduced in 1997-98 by the Government of India
to boost hydrocarbon exploration in the country. The
Directorate General of Hydrocarbon (DGH) has held
nine rounds of bidding under NELP I to NELP IX to date
(Figure 1). Under the NELP I-IX rounds, the DGH has
awarded 248 blocks covering a total area of 1,468,511
sq km. Participation by foreign exploration companies
has increased since the first NELP-I bidding round in
1999. In 2006, the number of foreign companies
exceeded the domestic companies bidding under
NELP VI. It is noteworthy that two major discoveries in
the Barmer basin (Rajasthan) and KG basin (offshore
East India) were appraised, developed and put into
production under NELP.
Figure 1: Blocks awarded under NELP I - NELP VIII Rounds
12.0
200
180
10.0
160
140
8.0
120
6.0
100
80
4.0
60
40
% of Total
Sedimentary
Basin
Oil and Gas sector operates under the aegis of Ministry
of Petroleum and Natural Gas (MoPNG). The upstream
sector is governed by the Oilfields Regulation and
Development Act, 1948 which provides for regulation
of oilfields and development of mineral oil-petroleum
and natural gas resources. The Petroleum and Natural
Gas Rules, 1959 (PNG Rules) which were drawn up
under Section 5 and 6 of the Act regulate the grant
of exploration licenses and mining leases in respect
of petroleum and natural gas. Under these rules GOI
has been vested with the powers to grant exploration
licenses/mining leases for offshore areas, while the State
governments are empowered to do so for onland areas.
The Production sharing contracts between the GOI and
contractor/oil companies are signed under Section 5(2)
of the PNG Rules. .
Since 1993, the Government of India has signed
Production Sharing Contracts (PSCs) for 28 exploration
blocks under Pre-NELP rounds, 11 of which have
already been relinquished or surrendered. At present,
there are 16 exploration blocks under operation. Major
hydrocarbon discoveries made in the pre-NELP blocks
are in the Gulf of Cambay by Cairn Energy, Gujarat
State Petroleum Corporation (GSPC) & Essar, and in the
Rajasthan Basin by Cairn Energy.
Nos.
Regulatory Framework in Indian Oil and Gas
sector
2.0
20
0
NELP I
NELP II
NELP III
NELP IV
NELP V
NELP VI NELP VII NELP VIII
0.0
No. of Blocks Offered
No. of Blocks Bid For
No. of Bids Received
No. of blocks awarded
No. of PSC signed
Area Awarded (% of total sedimentary baisn area)
Source: Directorate General of Hydrocarbons, India
163
A broad overview of the recent rounds of bidding under
the NELP framework are cited below:
NELP VIII
The NELP VIII Licensing Round attracted a total of 76
bids for 36 blocks, out of 70 blocks on offer. A total of
62 companies comprising of 10 foreign companies and
52 Indian companies have bid either on their own or as
a part of consortia. Total 32 (8 deep water, 11 shallow
water and 13 in onland areas) blocks were awarded and
contracts have been signed for all the blocks. According
to MOP&NG, investments of approximately USD 1.1bn
have been committed in this round.
NELP IX
Under the ninth round of New Exploration Licensing
Policy (NELP-IX) total 34 exploration blocks including 19
new blocks and 15 relinquished blocks were offered to
the bidders. Out of the 34 blocks, 19 onland blocks, 8
deep water and 7 shallow water blocks were offered.
Bids were received for 33 blocks but only 16 blocks have
been awarded. Government has signed 13 Production
Sharing Contracts on 28th March, 2012 for 2 shallow
water blocks and 11 onland blocks which are in the
states of Assam (2), Gujarat (6), Madhya Pradesh (2)
and Rajasthan (1) and in the basins of Gujarat-Kutch
(2), Assam-Arakan (2), Cambay (6), Rajasthan (1) and
Vindhyan (2).
As may be observed from the graph above the overall
participation of bidders in the last few rounds of NELP
had shown deteriorating interest from the oil companies.
Key reasons for the same are discussed subsequently in
the paper.
Pricing Framework in Oil and Gas sector and Role
of Regulator/Government
Currently the pricing framework for upstream sector is
governed by MoPNG and DGH whereas the Tariff for
midstream and downstream transmission networks are
determined by PNGRB. Pricing in the upstream sector are
governed through Production sharing contracts which
are subsequently discussed in detail. MoPNG decided
164
the priorities for allocation of gas to various sectors and
prices are determined through an Administered Price
Mechanism.
Government of India has recently notified the New
Domestic Natural Gas Pricing Guidelines, 2014 which
prescribe a formula for determination of well head
price of gas in Rs/MMBtu on GCV basis. The gas
price, determined, under these guidelines would be
applicable to all gas produced from nomination fields
given to ONGC and OIL India, New Exploration and
Licensing Policy (NELP) blocks, such PreNELP blocks
where, the Production Sharing Contract, (PSC) provides
for Government approval of gas prices and Coal Bed
Methane (CBM) blocks.
The difference between the price determined under
these guidelines converted to NCV basis and the
present price would be credited to the gas pool account
maintained by GAIL. The decision to pay the said
amount would depend on the outcome of pending
arbitration and any attendant legal proceedings.
The pricing formula takes into account the price
prevailing at Henry Hub, NBP, Alberta Canada and
Russia. The price and volume data is to be considered
for the trailing four quarters with a lag of one quarter.
The tariff would be determined/notified after every six
months.
As per the guidelines, the current subsidy of 40%
available in NER would continue and would be extended
to private parties also in order to incentivize exploration
and production
For pipeline transmission, PNGRB has laid down the
tariff regulations for determination of tariff applicable
for a period of five years. Irrespective of the actual
utilization of pipelines, the tariff regulations assume
100% utilization of pipeline volume by the end of fifth
year which leads to under recovery of expenses incurred
by the pipeline developers.
Fiscal Regime: Production
Sharing Contracts in Oil and Gas
Sector
Portfolio of Fiscal Regimes in Upstream Sector
Different fiscal regimes under the upstream sector can
be characterized as follows: • C
oncessionary Systems: In this system, the oil
company owns the oil & gas produced at well head
and pays royalty & taxes to Govt
• Contractual Systems: In this system, oil Company
receives a share of production or revenues. This
could be further categorized into following:
-Under PSC, Oil Company receives a share of
production, while in service contracts, Oil
Company receives a share of profit
-Technical assistance contracts (TACs) and Joint
venture are other forms of petroleum fiscal
systems which are found in both concessionary
system and contractual system.
Fiscal Regime choices for the Government involves
various trade-offs wherein it has to protect its fair share
in upside of the project economics on one side and
controlling costs and protect interests of private sector
(receive returns commensurate with the underlying
risks through the implementation of a stable, fair and
transparent contract system) on the other side. The
diagram given below depicts various fiscal regimes and
related trade-offs.
Various regimes adopted in different countries and
reasons thereof: • Production Sharing Contracts adopted by
Indonesia, Mozambique, China, Angola, Egypt and
India. PSCs are preferred in countries with lower
level of data availability/ reliability and where there
are large unexplored areas. It has improved riskreward trade off for investors
• Concession agreement is adopted by developed
countries such as UK, Norway, US due to
administrative and regulatory ease and flexibility to
adapt Government’s take
• Service Agreements adopted by countries
like Middle East, Mexico and Iran with low
exploratory risks, low investments & costs. It helps
in maintaining absolute monopoly of the NOC
in the respective countries while making use of
international service providers for their expertise
Figure-2: Hydrocarbon fiscal Regimes
PSCs
Petroleum Fiscal Regimes
Service
Agreements
Concession
Agreements
Concessionary Systems
Contractual Systems
Service Agreements
Control on Costs
Production Sharing
Contracts
Pure Service Agreement
(Fee for E&P work)
Risk Service Agreement
(Cost recovery + Fee if
successful)
165
Production Sharing Contracts in Oil and Gas
Sector under NELP
Some of the key features of existing NELP regime are
listed below: • Contractor allowed to set off the cost incurred on
exploration, and subsequently on development
and production, against revenues earned in the
operation. Balance revenues are shared between the
Contractor and the Government in the proportion
agreed to in the PSC based on Investment multiple
(IM).
• Royalty and income tax are separately payable.
• For the purpose of implementation of contractual
provisions in the PSC regime, a management
structure exists in the form of a Management
Committee (MC)
oMCs constituted under it offered a suitable
forum for regular interaction between the
Government and Contractors. Contractors
were given representation on MCs, with each
company constituting the Contractor being
represented through a member on the MC. In
addition, there are 2 government nominees on
the MC.
• Two main biddable elements: (i) Cost Recovery and
(ii) Sharing of profit petroleum, based on the Pre-Tax
Investment Multiple (PTIM).
oThe portion of Contract Cost deducted in a
year is termed as Cost Petroleum. The revenue
remaining after cost recovery is called Profit
Petroleum.
oCost recovery - independent variable; determines
profit petroleum (dependent variable)
oThe Contractor is entitled to deduct a biddable
percentage (up to a maximum of 100%) of the
admissible contract costs, from the total value of
petroleum produced and saved
• Any un-recovered portion of Contract Costs is
carried forward to succeeding years if during any
year, cost petroleum is not sufficient to enable the
Contractor to recover in full Contract Costs, due for
recovery in that year, then:
o firstly, royalty payments are recovered;
o production costs are recovered next;
166
o exploration costs are recovered next;
o finally, development costs are recovered.
• The shares of the Operator & Govt. in profit
petroleum in a particular year, calculated on
the basis of PTIM (IM) actually achieved by the
Contractor at the end of the preceding year.
• IM ratio slabs are stipulated in PSC, and are based
on the bid made by the Contractor. Usually, higher
the IM ratio, higher is the Government share.
Table: IM for KG-D6 for illustration
Investment
multiple (IM)
Government
Share
Contractor
Share
<1.5
10%
90%
>=1.5 and < 2.0
16%
84%
>=2.0 and < 2.5
28%
72%
>=2.5
85%
15%
• C
ontractors’ revenue = Revenue from cost
petroleum + share of profit petroleum
• Some of the typical terms used in the PSCs for Profit
sharing are defined below:
oThe formula for calculating Investment Multiple
ratio for the Contractor at year end:
Sum of Annual Net Cash Incomes (Cumulative YTD)/ Sum of Annual Investments
(Cumulative YTD) where
• Net Cash Incomes are without interest and are cumulative from the year in
which production costs were first incurred or production first arose.
• Annual Investments are without interest and are cumulative from the year in
which exploration and development costs were first incurred
oThe formula for calculating Net Cash Incomes &
Investment at the end of any year is as follows:
• N
et Cash Income = Contractor’s revenue (Cost Petroleum + share of
Contractor in Profit Petroleum) less Contractor’s Production costs and royalty
payments
• Investment = Contractor’s Exploration costs + Development costs
Relative considerations of the current PSC
The primary objectives of Government of India are to
achieve energy security and reduce dependency on
imports, maximize Risk Capital to explore all potential
resources and accelerate optimal development of
discovered resources. While the PSC framework is
created to meet these objectives, Government of India
faces challenges such as perception created around
“Gold plating” of investment and “wilful underproduction”. The current PSC framework poses the
following relative considerations to the Government and
the oil company:
Particulars
Merits
To the
• Control over cost expenditure of the Oil
Government
Companies
• Operational control by active participation
in Management Committees
To the Oil
Company
Demerits
• F ront ending of CAPEX by operators prevent
the next IM slab and thereby keeping
government’s share low
• Administrative and managerial burden for
Govt.
• Oil Company can resort to “Gold Plating”
and delay profit/petroleum sharing for the
government
• Disputes related to pricing
• Disputes in budget approvals/cost approvals
cause delays and issues remain unresolved
ultimately affecting production, thereby
increasing import dependence and costs
• Only 1 block (KG-D6) currently under
production
• Slower decision making by Govt.
• E nables operators to recover the
• S crutiny of expenditure and investment-related
investments made before they share
decisions by the Govt.
profits with the Government
• Delays in decision making/approvals leads to
• 7 year tax holiday from date of
financial burden on Investors and disputes
commencement of commercial production
• Exemption from customs duty & Cess on
imports for petroleum production
• Lower royalty rates
• Freedom to the contractors for marketing
of crude oil and gas in the domestic
market
167
Challenges in PSC and
Alternative Revenue
sharing Model
Challenges in Indian Hydrocarbon Industry- Lack
of interest shown by Bidders in last NELP bids
The current Indian hydrocarbon environment can be
characterized by increasing demand supply deficit and
high import dependence for both crude oil and gas. This
is reflected in the increasing import bill and widening
current account deficit. Despite several initiatives to
attract investors, recent NELP bidding rounds have
witnessed diminishing interest of IOCs, which is limiting
the technological and investment capabilities.
A key deterrent to the above have been the significant
events of delays/ legal hassles in the Indian E&P space.
Besides, the above, the issues related to pricing of
hydrocarbon in India, high risk perception (~1 in 10
exploration wells successful), expensive exploration
activities in prospective deep waters wherein the well
costs are ranging between $80 to $120m and increasing
competition for foreign investment in the region are the
other key challenges that needs to be addressed under
the fiscal regime.
Specifically in context of the PSC framework, following
issues have been an area of prime concern:
• Delayed Decision Making: The current fiscal model,
with primary focus on recovery of upstream
costs, has been found to be a major constraint in
expediting exploratory work and is also lacking in
incentives to keep costs down
• Cost Implications: Contractors have inadequate
incentives to reduce capital expenditure – and
substantial incentive to “front-end” capital
expenditure, so as to retain the IM in the lower slabs
or to delay movement to the higher slabs.
• Multiple Level of Scrutiny: There will always be scope
of scrutiny by other agencies to check whether the
GoI has discharged its responsibility properly or not
and whether the costs being recovered are correct.
• Micro-management: Contractors at times perceive
Government’s efforts to protect its commercial and
technical interests as micromanagement of oil &
gas field operations, either through Management
Committees (MC) or otherwise
Need for Change: Proposed Revenue Sharing
Model
In order to uphold investor interest in the sector, it is
important for the government to optimally balance the
168
interests of both the government and the oil companies.
An alternative approach to address the above concerns
had been proposed by the Rangarajan Committee in
December 2012. Some of the broad contours of the
overall proposal for Revenue Sharing Model proposed by
the Committee is provided below:
• B
idding Parameter: Contractor to bid the share in
% terms payable to the GoI (after royalty) as per
the price-class and incremental production matrix.
Bids to be submitted for oil & gas cases separately.
Bidding has to be progressive on GoI take for each
subsequent level in the following manner:
• Bid Evaluation Criteria: GoI NPV @ 10% will be
calculated for each price band separately for oil
& gas only for the GoI production share offered
(excluding royalty and income tax) and summed up.
Company offering highest NPV @ 10% combined
for oil and gas can be awarded highest score
Shallow Water Offshore Block (Oil Case)
Daily
Production
(Mbod)
Oil Price (USD/Bbl)
< or = 75
USD
> 75 to <
or = 90
> 90 to <
or = 105
> 105 to < or
= 120
Government Take (%)
< or = 10
> 10 to < or
= 30
> 30 to or
= 50
• R
oyalty: Royalty will be paid to the GoI from
Gross Revenue. Fixed ad-valorem rate of royalty is
suggested for the proposed model.
• Production Sharing: Revenue, net of royalty,
will be shared between the Contractor and the
Government, based on the average daily production
in a year/quarter. The average price for the quarter
will be considered for determining the price for the
calculation of Government’s share
Impact on Government
The proposed mechanism is expected to bring in the
following advantages to the Government:
• E asier to administer as Management Committee will
not be required to approve budgets, cost estimates,
approve audits
• Focus will be on Technical aspects
> 120
• Detailed monitoring of Costs will not be required
• Revenue will flow to the government from day 1 of
commercial production
• Incentivizes Operator to keep costs down and not
resort to “Gold Plating”
• Abnormal Price rise or Surprise discovery gains will
also accrue to the Government
However, the downside of the mechanism could be
on account of risk perception by bidders towards
poor geology in India for E&P activities. This has been
accentuated by lack of available and accessible, reliable
geo-seismic data. This being the case, the revenue
sharing model may raise concerns on cost recovery for
investors, due to uncertainty about India’s reserves. The
above concerns may lead to lesser participation in the
bidding rounds for E&P activities in India, leading to risk
of hydrocarbons remaining unexplored/undeveloped
Impact on the Contractors
The proposed features of the mechanism will induce the
following advantages to the contractors:
• Operators will enjoy greater freedom in operations
• No minimum threshold Government share proposed
• Exploration period proposed to be enhanced to 10
years from current 7/8 years in PSC and exploration
possible throughout lease period in area provided
• Proposed to provide flexibility in carrying out
Minimum Work Program (MWP) activities
However from the contractor’s perspective the regime is
yet to address the following areas:
• P erception of poor geology will give rise to
uncertainty, also accentuated by uncertainty/lack of
clarity in pricing
• Cost recovery may be uncertain due to above
concerns, giving rise to lower returns which may
lead to issues in financing such projects
• Draft revenue sharing contract is silent with regard
to security mechanism available to lenders in case of
Contractor default, other than assignment/charge of
contractor interests and opening of escrow account
for deposit of all revenues
169
Points for Discussion :
Choice of Revenue model
for Oil and Gas sector
Revenue Sharing Model has received a mixed response
from the stakeholders in the sector. This model ensures
that GOI will start recovering revenue from the start of
production. However, investor perception is that the
mechanism shifts the goalpost from enhancing E & P to
enhancement of revenues to the Government.
A broad comparison of the two approaches for
contracts in upstream oil and gas sector is provided
below:
Para-meters
PSC
Revenue Sharing
Bidding Parameter
Cost recovery % and share to Government based on
Investment Multiple (IM)
Revenue Share to Government based on Price-Production
matrix
Profit Sharing
First Costs towards Exploration, development & Production
are recovered by Contractor and then balance profits, if any
are shared between Contractor and Government
Revenue accrues to Government from Day 1 of
commencement of Production, based on agreed share
Adminis-tration
High level of Government involvement through
Management Committee; approvals required for budgets,
audits; costs incurred leading to disputes and delays
Technical reviews are critical; role of Management
Committee vastly reduced
Investment Risk
Lesser Investment risk to the Contractor as Costs recovery
is assured; profit share of Government is higher at higher
IM
Due to geological uncertainty, pricing issues, cost recovery
is uncertain. Due to return risks, participation & financing
may prove to be a challenge
Given the above merits in each of the proposition, the
key issues that need to be addressed are:
a.Whether maximisation of Exploration and
Production shall be the priority of the GOI given the
dependence on crude or revenue maximisation is a
better approach?
b.What shall be the approach to address the issues
associated with poor geological database – a critical
parameter for bidding?
c.What institutional mechanisms should be provided
to address the concerns around delays in statutory
clearances?
d.How can the issues of cost control that prevent the
contractor from further drilling be addressed?
In case an alternative approach from the current PSC is
adopted, will the existing contracts be made to migrate
to the new framework?
Irrespective of the fiscal approach adopted by GOI
going forward, the following key enablers should be
provided by GOI to ensure better participation by the oil
companies in the E & P sector:
170
Open Acreage Licensing Policy (OLAP)
• Adopt the OALP using the existing data repositories
of National Oil Companies (NOCs)
• Oil and gas acreages will be available round the year
instead of cyclic bidding rounds launched under
NELP
National Data Repository
• One of the pre-requisite/ challenges for the
formulation of OALP is to establish a data repository
center to provide quality and reliable geo-scientific
data
• Provide required funds in a phased manner over 5
years
E-governance/ SWC
• Single Window clearance mechanism to ensure
faster clearances
• Adopt a concurrent approach for statutory approvals
to minimize the total time taken
• E stablish IT based workflow system and move to
E-governance
Old Contracts Sanctity
• It is important to maintain the sanctity of the earlier
contracts
• Contractors base their long-term operations, capital
structures and processes around predictable fiscal
systems
• Changing existing PSCs will affect investor
confidence
Further for the midstream and downstream sector, the
Regulator needs to consider the actual utilization of
pipeline networks and devise mechanism to address
such volume risks. A robust and structured approach by
the Regulator for mitigating such risks will further boost
the investments in the midstream and downstream
sector considerably.
Notes
172
Notes
173
Notes
174
175


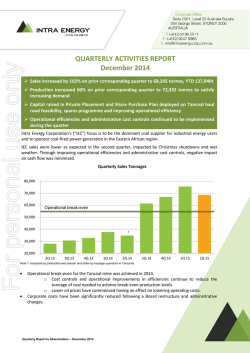

© Copyright 2026