
The kinetics of Fe and Ca for the development of
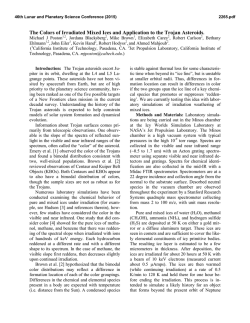
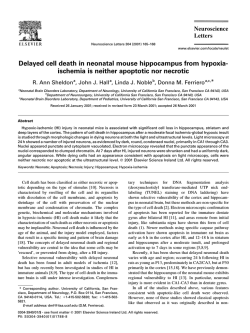
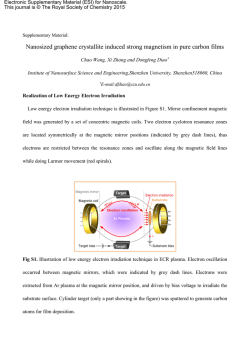
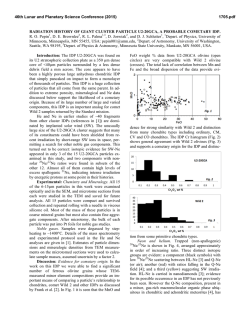
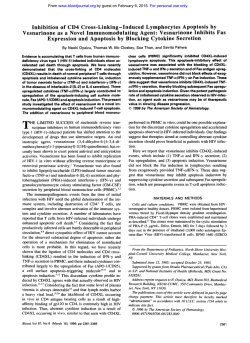
Nuclear Instruments and Methods in Physics Research B 189 (2002) 437–442
www.elsevier.com/locate/nimb
The kinetics of Fe and Ca for the development of
radiation-induced apoptosis by micro-PIXE imaging
S. Harada a,*, Y. Tamakawa a, K. Ishii b, A. Tanaka b, T. Satoh b,
S. Matsuyama b, H. Yamazaki b, T. Kamiya c, T. Sakai c, K. Arakawa c,
M. Saitoh c, S. Oikawa d, K. Sera e
a
b
Department of Radiology, Iwate Medical University, 19-1 Uchimaru, Morioka, Iwate 020-8505, Japan
Department of Quantum Science and Energy Engineering, Tohoku University, Sendai 980-8579, Japan
c
Takasaki Radiation Chemistry Research Establishment, JAERI, Takasaki, Gunma 370-1292, Japan
d
Ion Accelerator Corporation, Hakodate 040-0076, Japan
e
Cyclotron Center, Iwate Medical University, 348-1 Tomegamori, Takizawa, Iwate 020-0173, Japan
Abstract
To study the interactions between the induction of radiation-induced apoptosis and trace elements kinetics, human
leukemia cells were irradiated in vitro by 60 Co c rays, after which the cells were evaluated for the detection of apoptosis
and trace element (Fe, Ca, Zn) imaging was carried out. The frequency of apoptosis, i.e. the number of apoptotic bodies
per 100 nuclei, was obtained by microscopic assay using TUNEL staining at 400 magnification. The trace element
distribution in the cell was determined by micro-PIXE using 2 MeV proton beams. In the early phase of apoptosis, the
maximum level of Fe accumulation was observed in the cell stroma. In the mid to end phase, Fe accumulation was
diminished, and instead, Ca accumulation increased and Zn decreased in the nucleus. There appear to be two steps for
the development of apoptosis: (1) the signaling from cell stroma to nucleus by Fe or an Fe-containing enzyme; and (2)
the degeneration of the nucleus by Ca-dependent enzyme, and release of Zn from digested nucleus. Those strong
accumulations may be new markers for apoptosis. Ó 2002 Elsevier Science B.V. All rights reserved.
PACS: 82.80.Ej; 87.50.Gi
Keywords: Radiation; Apoptosis; Micro-PIXE camera; Ca; Fe; Zn
1. Introduction
Radiation induced-apoptosis is the suicidal
process of the cell initialized by irradiation, which
is controlled and executed by a series of genes and
*
Corresponding author. Tel.: +81-19-651-5111x3660; fax:
+81-19-622-1091.
E-mail address: [email protected] (S. Harada).
protein enzymes [1–4]. In the mechanism of radiation-induced apoptosis, it is well known that
there are three steps: (1) the initializing of apoptosis; (2) the decision of apoptosis; and (3) the
‘‘executioner’’ phase of apoptosis. The initializing
of radiation-induced apoptosis is performed by
irradiation. Then the effectiveness of this initialization is tested by the decision of apoptosis, which
is controlled by the gene P 53, Bcl-2/Bax family [5].
When the initialization of apoptosis is determined,
0168-583X/02/$ - see front matter Ó 2002 Elsevier Science B.V. All rights reserved.
PII: S 0 1 6 8 - 5 8 3 X ( 0 1 ) 0 1 1 2 1 - 1
438
S. Harada et al. / Nucl. Instr. and Meth. in Phys. Res. B 189 (2002) 437–442
the cell undergoes the executioner phase of apoptosis: the process for the auto-digestion of its nucleus, which is strictly concerned with the kinetics
of the trace elements.
The executioner phase of apoptosis can be divided into three steps: (1) the depolarization of the
mitochondrial membrane [6–10]; (2) the releasing
of Cytochrome C from the mitochondria to cytosol
[6–10]; (3) activation of Caspase family and/or the
DNase c in nucleus [11–17]. In the first step of the
executioner phase of apoptosis, the inner membrane
of mitochondria is depolarized by inflow of the
calcium and/or magnesium ion into the inner
membrane of mitochondria [6–10]. After the depolarization of the inner membrane of mitochondria, the mitochondria release cytochrome C to
cytosol [6–10], and activate the caspase family,
DNase c, and Ca/Mg dependent endonucleases in
nucleus [11–17], which digest the DNA in the nucleus and cause cells to die. Of these enzymes, the
cytochrome C includes Fe in its chemical structure
[18,19]. The caspase family requires Mg, DNase c
also requires Ca, and Ca/Mg dependent endonuclease requires Mg and Ca for activation [11–17].
The DNA contains the Zn in its backtyping protein
[18,19], which is digested by caspase family, DNase
c, and Ca/Mg dependent endonuclease [11–17].
Therefore, it is considered that: the kinetics of
Mg, Ca, Fe and Zn may interact with the induction
of apoptosis; however this has not been studied
extensively.
Among the trace elements described above, the
interactions of Ca, Fe and Zn were tested for the
development of radiation-induced apoptosis, using
micro-PIXE.
2. Materials and methods
2.1. Tumor systems
The human leukemia cells MOLT-4 and HL-60
were grown in RPMI-1640 supplemented with
10% fetal calf serum, using 9 cm diameter dishes.
When the cell covered 70% of the bottom of the
dishes, the cells were used for experiments.
24 h before irradiation, the medium was exchanged for a new one containing 10% HEPES (4-
(2-hydroxyethyl)-1-piperazineethanesulfonic acid).
When the medium was changed, a Mylar film (1
lm in thickness) held in a ring of 2 cm diameter
was placed at the bottom of the dish, so that the
cells could grow and adhere to the Mylar film. The
cells were grown in the same condition for 24 h.
Then irradiation was performed.
2.2. Irradiation
Irradiation was carried out using 60 Co c rays.
The dishes were placed in the square radiation field
of dimensions 18 18 cm2 . The dose rate ranged
from 34.1 to 35.1 c Gy/min. The backward and
side scatter fractions were less than 0.3%. In a
preliminary experiment, the radiation was administered incrementally using values of 1, 2, 5, 10, 20
Gy, in order that we could determine a suitable
irradiation dose from the observed induction rate
of apoptosis as a function of irradiation dose. As a
result we chose to measure the frequency of apoptosis at 6 h after irradiation.
2.3. Frequency of apoptosis, induction rate of
apoptosis versus the irradiation dose, and selection
of a suitable irradiation dose
The apoptosis was detected by assaying the
apoptotic bodies using the May Giemsa staining.
The frequency of apoptosis was expressed as the
percentage of apoptotic cells to the whole number
of cells. For selecting the suitable irradiation dose,
the rate of frequency relative to the radiation dose
was calculated using the following formula: F =D
(%=Gy), where F was the frequency of apoptosis
on 6 h after irradiation and D was the radiation
dose. The suitable radiation dose was determined
by two criteria: (1) more than 50% of apoptosis is
observed in the irradiated cell; and (2) the induction ratio is higher than that given by other doses.
2.4. Preparation of the target for PIXE
To study time dependence, the Mylar film was
picked up 3, 6, 9, 12 and 24 h after irradiation. It
was washed by dipping it in THAM (Tris-hydrooxyaminomethane) buffer five times, and then
dipped in isopentane cooled by liquid nitrogen.
S. Harada et al. / Nucl. Instr. and Meth. in Phys. Res. B 189 (2002) 437–442
439
Then the Mylar film was freeze dried in vacuum
and subjected to micro-PIXE analysis.
2.5. Micro-PIXE analysis
The target was irradiated by a 2 MV proton
beam, 2 lm in diameter at the point of impact, and
induced X-rays were recorded by Si–Li detector.
The cell was scanned by the 2 MV micro-proton
beam within a 90 90 lm2 area, and the X-ray
signals were converted into two-dimensional images. In this way, the distribution of the Ca, Fe
and Zn were imaged in the cell.
2.6. Statistics
The statistical analysis was carried out using
one way ANOVA (analysis of variance). The data
were determined significant at the 0.05 probability
level.
3. Results
3.1. Optimizing the radiation dose
In order to optimize the radiation dose, the alteration of the frequency of apoptosis 6 h after
irradiation was plotted against the radiation dose
(Fig. 1). The slope of the plotted line below 5 Gy
was steeper than that over 5 Gy. Irradiation below
the 5 Gy level resulted in a significant greater induction ratio (11:7%=Gy) than that over the 5 Gy
level (0:99%=Gy). Below the 5 Gy level, it was only
the 5 Gy irradiation that induced more than 50%
of apoptosis. Therefore, we determined the suitable irradiation dose to be 5 Gy. In the HL-60
cells, there were no increases of the frequency of
apoptosis.
3.2. Alteration of the frequency of apoptosis at 5 Gy
irradiation
The alteration of the frequency of apoptosis
against time is plotted in Fig. 2. In the apoptotic
sensitive MOLT-4 cells, the frequency of apoptosis
gradually increased, and reached 92:1 2:13% on
24 h after irradiation. Therefore, we have deter-
Fig. 1. The alteration of the frequency of apoptosis 6 h after
irradiation versus the radiation dose (1, 2, 5, 10, 20 Gy) for HL60 cells (j) and MOLT-4 cells (r). The slope of the plotted line
represents the induction of the rate of apoptosis. Note that the
slope of the line below 5 Gy dose was steeper than that over 5
Gy in MOLT-4 cells.
mined that most MOLT-4 cells underwent the
apoptotic pathway under the 5 Gy irradiation. In
the HL-60 cells, there were no increases of apoptosis by 5 Gy irradiation.
3.3. Micro-PIXE imaging of Ca, Fe and Zn
The images of Ca, Fe and Zn in MOLT-4 cells
by micro-PIXE camera are shown in Fig. 3. Before
irradiation, there was no high accumulation of
Fe in the MOLT-4 cell. The calcium was distributed homogenously in the nucleus of unirradiated
MOLT-4 cells. The Zn was mainly present in the
nucleus of unirradiated MOLT-4 cells.
6 h after irradiation of MOLT-4 cells, a high
accumulation of Fe was observed in the cytosol;
9 h after irradiation, the high accumulation of Fe
was enlarged, and a weak accumulation around it
was observed; 24 h after irradiation, the high accumulation of Fe was diminished. The Ca began to
440
S. Harada et al. / Nucl. Instr. and Meth. in Phys. Res. B 189 (2002) 437–442
Fig. 2. Alteration of the frequency of apoptosis due to 5 Gy
irradiation: The alteration of the frequency of apoptosis against
the time courses for HL-60 cells (j) and MOLT-4 cells (r). The
MOLT-4 cells show a gradual increase of apoptosis after 5 Gy
irradiation, reaching 92:1 2:13% at 24 h after irradiation.
accumulate 6 h after irradiation; high accumulation
of Ca was observed 9 h after irradiation; that high
accumulation was present 24 h after irradiation,
when the high accumulation of Fe diminished.
As for the Zn, its accumulation decreased from
the nucleus 6 h after irradiation. In spite that: there
was proximal recovery of Zn accumulation 9 h
after irradiation; the Zn in the nucleus decreased
24 h after irradiation.
In the apoptotic resistant HL-60 cell, there were
no kinetic changes of Ca, Fe and Zn in the microPIXE images.
4. Discussion
Previously, several studies have been made
concerning the relationships between the induction
of apoptosis and trace elements [5–8]. Those elements are mainly Mg, Ca and Zn. The Mg and
Ca depolarize the inner membrane of mitochondria, which have been studied using flow cytome-
try [5–8]. The Ca and Mg kinetics are correlated
with the enzyme activity of DNase c and Ca/Mg
dependent endonuclease [14–17], whereas Zn inhibits the activity of those enzymes [14], which
have been mainly researched by protein immunoblotting. However, the acting sites of those trace
elements have been estimated indirectly by cell
fractionation. There are few reports that image the
acting site of the trace elements directly. In the
kinetics of Fe, it is well known that the cytochrome
C contains the Fe [18,19]. However, the kinetics of
Fe in the development of apoptosis have not been
studied.
In this study, we used micro-PIXE imaging for
studying the kinetics of Ca, Fe and Zn in the
apoptotic cell. We directly imaged the distribution
of Ca, Fe and Zn in one apoptotic cell, enabling us
to research the localization of those elements in the
cell.
In this study, the maximum of Fe accumulation
was observed in the cytosol of the apoptotic cell
6–9 h after the irradiation. As the only enzyme
linked to apoptosis that contains Fe is cytochrome
C, the high Fe accumulation may represent the
cytochrome C. It is also considered that the Fe or
Fe-containing enzyme is not present in the cell in a
diffuse manner; but accumulates in the cytosol as
a high point, during apoptosis. Accumulation of
Ca in the nucleus was observed 9 and 24 h after
irradiation, which suggest increased activity of Ca/
Mg dependent endonucleases, and/or the DNase c.
The decrease of zinc in the nucleus in the apoptotic
cell may represent the digestion of the backtyping
protein of DNA.
This study presents the kinetics of Fe, Ca and
Zn during the induction of apoptosis. However,
further molecular study is required. The kinetics of
Fe must be tested to ascertain if it correlates with
the cytochrome C releasing from mitochondria to
cytosol, or not. The correlation between the Ca
kinetics in the nucleus and the activity of the Ca
related enzymes: (the Ca/Mg dependent endonuclease and the DNase c) remains unclear. The zinc
kinetics should be tested to ascertain whether Zn
correlates with the DNA fragmentation, or not. In
our laboratory, evaluation of the apoptosis related
enzyme activity and the kinetics of trace elements
is underway.
S. Harada et al. / Nucl. Instr. and Meth. in Phys. Res. B 189 (2002) 437–442
441
Fig. 3. The distribution of Ca, Fe and Zn in the apoptotic cells with time.
References
[1] J.F.R. Kerr, A.H. Wyllie, A.R. Currie, Br. J. Cancer 26
(1972) 239.
[2] J.F.R. Kerr, J. Searle, B.B. Harmon, C.J. Bishop, in: C.S.
Potten (Ed.), Perspectives on Mammalian Cell Death,
Oxford University Press, New York, 1972, p. 93.
[3] E. Duchaud, A. Ridet, D. Stoppa-Lyonett, N. Janin,
E. Moustacchi, F. Roselli, Cancer. Res. 56 (1997) 1400.
[4] S. Harada, R. Sato, R. Nakamura, H. Oikawa, S. Ohgi,
Y. Tamkawa, T. Yanagisawa, Int. J. Radiat. Oncol. Biol.
Phys. 48 (2000) 1059.
[5] J. Yang, X. Liu, K. Bahalla, C. Naekyun Kim, A.M.
Ibrado, J. Cai, T.-I. Peng, D.P. Jones, X. Wang, Nature
275 (1997) 1129.
[6] Q. Zao, T. Kondo, A. Noda, Y. Fujiwara, Int. J. Radiat.
Biol. 75 (1999) 493.
[7] M.M. Chien, K.E. Zahradka, M.K. Newell, J.H. Freed,
J. Biol. Chem. 274 (1999) 7059.
[8] R. Eskes, B. Antonsso, A. Osen-Sand, S. Monteessuit, C.
Richter, R. Sadoul, G. Mazzei, A. Nicholas, J.-C. Martinou, J. Cell Biology 143 (1998) 217.
[9] G. Fang, B.S. Chang, C.N. Kim, C. Perkins, C.B.
Thompson, K.N. Bhalla, Cancer Res. 58 (1998) 3202.
442
S. Harada et al. / Nucl. Instr. and Meth. in Phys. Res. B 189 (2002) 437–442
[10] A. Takahashi, E.S. Alnemri, Y.A. Lazebnk, T. Fernades
Alenmri, G. Litwack, R.D. Moir, R.D. Goldman, G.G.
Poirier, S.H. Kaufman, W.C. Earnshaw, Proc. Nat. Acad.
Sci. USA 93 (1996) 8395.
[11] S. Tamura, D. Shiokawa, Biochem. Biophys. Res. commun. 203 (1994) 789.
[12] M.J. Arends, R.G. Morris, A.H. Wyllie, Am. J. Pathol. 136
(1990) 593.
[13] B. Zhivotovsky, P. Nicotera, G. Bellomo, K. Hanson,
S. Orrenius, Exp. Cell Res. 207 (1993) 163.
[14] L.V. Nikonova, I.P. Beletsky, S.R. Umansky, Eur. J. Biochem. 215 (1993) 893.
[15] W.H. Str€atling, C. Grade, W. H€
orz, J. Biol. Chem. 259
(1984) 5893.
[16] T. Hashida, Y. Tanaka, N. Matsunami, K. Yoshihara,
T. Kamiya, Y. Tanigawa, S.S. Koide, J. Biol. Chem. 257
(1982) 13114.
[17] R. Ishida, H. Akiyoshi, T. Takahashi, Biochem. Biol. Res.
commun. 56 (1974) 703.
[18] R. Stryer, in: Glycolysis in Biochemistry, Freeman, New
york, 1988, p. 409.
[19] B. Alberts, D. Brah, J. Lewis, M. Raff, K. Roberts, J.D.
Watson, Molecular Biology of the Cell, Garland Publishing Inc., New York, 1989, p. 489.
© Copyright 2026