
Nanosized graphene crystallite induced strong magnetism in pure
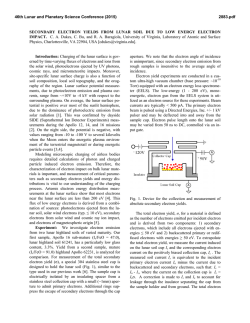
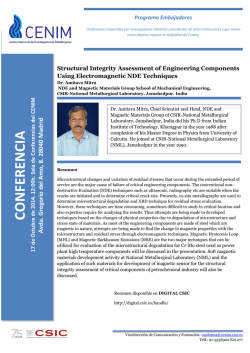
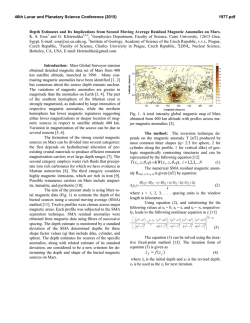
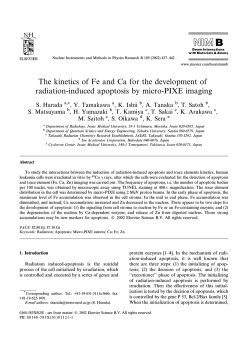
Electronic Supplementary Material (ESI) for Nanoscale. This journal is © The Royal Society of Chemistry 2015 Supplementary Material: Nanosized graphene crystallite induced strong magnetism in pure carbon films Chao Wang, Xi Zhang and Dongfeng Diao* Institute of Nanosurface Science and Engineering,Shenzhen University, Shenzhen518060, China *E-mail:[email protected] Realization of Low Energy Electron Irradiation Low energy electron irradiation technique is illustrated in Figure S1. Mirror confinement magnetic field was generated by a set of concentric magnetic coils. Two electron cyclotron resonance zones are located symmetrically at the magnetic mirror positions (indicated by grey dash lines), thus electrons are restricted between the resonance zones and oscillate along the magnetic field lines while doing Larmor movement (red spirals). Fig S1. Illustration of low energy electron irradiation technique in ECR plasma. Electron oscillation occurred between magnetic mirrors, which were indicated by grey dash lines. Electrons were extracted from Ar plasma at the magnetic mirror position, and driven by bias voltage to irradiate the substrate surface. Cylinder target (only a part showing in the figure) was sputtered to generate carbon atoms for film deposition. In order to extract electron from the plasma, substrate was located near magnetic mirror position. The exact position of substrate was fixed at the point where the floating voltage was zero, which was derived from plasma diagnosis results [33]. Thereafter, a positive bias voltage was applied on the substrate, which generated an electric field force. The electrons were driven towards the substrate by the electric field force, realizing electron irradiation. The irradiation energy E was determined by substrate bias voltage U, 𝐸 = |𝑒𝑈| (1) where e is elementary charge. By controlling Ar gas pressure, electron irradiation density can be changed. The electron irradiation density was derived from substrate current is, since 𝑖𝑠 = 𝜌𝑒𝑠 𝑣 (2) where s is substrate area, and v is electron velocity. By substituting electron dynamic energy 1 𝐸 = 𝑚𝑣2 2 (3) into Eq.(1) and Eq.(2), then electron irradiation density can be obtained below, 𝑁= 𝑖𝑠 𝑚 𝑒𝑠 2𝑒𝑈 (4) where s is substrate area, and m is electron mass. According to the above methods, different electron irradiation energies and densities can be selected during film deposition. Fig. S2 Plan view transmission electron microscope (TEM) image of carbon films deposited under electron irradiation energy of 80, 100, 250 and 300 eV, respectively. The 80 and 100 eV sample contained graphene nanocrystallite, while the 250 and 300 eV sample contained graphite-like structure. Plasma Mass Spectrometry test In order to further eliminate the influence of impurities inside the film, inductively coupled plasma mass spectrometry (ICP-MS) was introduced to measure the impurities concentration. The mainly impurity concentrations are shown in the following Table S1. Table S1. Impurity contents in the film. The results are mean values from two replicate measurements. Element Atomic ppm Element Atomic ppm Al 18.39 Fe 48.86 P 5.53 Co 0.76 Ti 1.39 Ni 6.60 V 0.19 Cu 367.52 Cr 19.32 Zn 1.90 Mn 5.25 Pb 0.44 It can be seen that the total amount magnetic metallic impurities (Fe, Co and Ni) are less than 60 ppm. Even they behave as a bulk ferromagnetic material, their maximum contribution to the magnetic moment in our samples would be less than 3× 10⁻⁶ emu, a twentieth of the original signal. So the intrinsic impurities are not the sources of paramagnetic behavior of film. Table S2. Saturation magnetization Ms and residue magnetism Br of sample A-H Sample number E-I density cm-3 E-I energy eV Ms emu/g Br memu/g A 1011 10 0.017 1.7 B 1011 50 0.075 4.2 C 1011 150 0.27 34 D 1011 200 0.12 16 E 1010 10 0.008 0.7 F 1010 50 0.04 15.8 G 1010 250 0.37 28.1 H 1010 300 0.14 4.4

© Copyright 2026