
+3.3% +120bps +3.0%
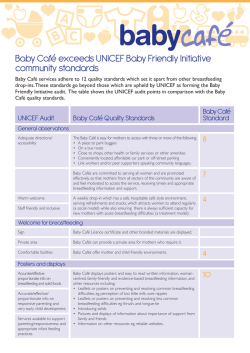
We are very proud to have finished the year with a strong set of
fourth quarter results. The sustained momentum in our Win Bigger
businesses and the return to growth in Baby gives us confidence to
raise our 2015 full year guidance on core sales growth to 3.5 percent
to 4.5 percent.
— Michael Polk, President and Chief Executive Officer
#NWLQ414
Q4 EARNINGS
NET SALES
Q4 Financial Highlights
$1.53B
+3.3% +70bps +120bps $0.49
CORE SALES
GROWTH
NORMALIZED
GROSS
MARGIN
Net sales grew 4.1
percent, despite a 320
basis point adverse
impact from currency.
NORMALIZED
driven by positive mix and
productivity. This funded a
60 basis point increase in
advertising and promotion.
$291M
OPERATING INCOME
MARGIN
NORMALIZED
EARNINGS
PER SHARE
due to continued
progress on overheads
related to
Project Renewal.
a 6.5 percent increase
despite significantly
increased advertising
investment.
R E T U R N E D
$147M
OPERATING CASH FLOW
in dividends
and stock
repurchase
TO SHAREHOLDERS
Global Growth: REGIONAL HIGHLIGHTS
NA
+2.7%
EMEA
+3.2%
APAC
+8.2%
LATAM
+16.5%*
+4.7%
*adjusted for SAP timing
TOTAL INTERNATIONAL (OUTSIDE NORTH AMERICA)
Q4 CORE SALES GROWTH
Q4 Highlights
Our “WIN BIGGER” businesses continue to GROW:
COMMERCIAL
TOOLS
WRITING
CORE SALES GREW
PRODUCTS
CORE SALES GREW
+5.7%
CORE SALES GREW
+7.5%
driven by market share
growth in most geographies
as a result of strong
innovation, advertising, and
marketing programs.
+6.7%
driven by strong volume
growth on Irwin in Europe
and Asia Pacific and very
good growth of Lenox in
North America.
as a result of strong
innovation and volume
growth in the US, Brazil
and China.
Q4 NET
SALES
BABY & PARENTING
Returns to Growth
The global Baby business returned to
growth in the fourth quarter with growth
outside of EMEA of over 3 percent.
Baby &
Parenting
$208.9M
Writing
$418.2M
Commercial
Products
$213.0M
Tools
$227.3M
HOME SOLUTIONS
Net Sales Growth
Home
Solutions
$458.6M
Our newly acquired brands delivered
terrific year over year growth and
enabled Home Solutions net sales
growth of 10.8 percent.
We continue to make STRATEGIC CHOICES
designed to strengthen our portfolio, increase our rate of growth and improve our
operating margins, while simultaneously passing value back to our shareholders.
Completed ACQUISITIONS of BABY JOGGER
Holdings, Inc. and BUBBA BRANDS
Q3 Completed
Acquisition
&
®
Innovation
Winning Capabilities
Global Expansion
COMPLEX TY EXTENDED
Procurement
Supply Chain
Overhead
PROJECT
RENEWAL RE NVESTING
to generate an incremental $200M of annualized savings by the end of 2017
Announced our
intention to EXIT
OUTLETS
ELECTRICS
our Calphalon Outlet stores, Calphalon Electrics business and
Endicia online postage business in order to focus our resources on the parts of our
portfolio that have the greatest growth potential.
NWL
SHARE
REPURCHASE
Announced our decision to INCREASE and EXTEND
our open market share repurchase authorization by
an additional $500M through 2017
Year-End Financial Highlights
NET SALES
$5.73B
ALL-TIME
HIGH
+3.0% +90bps +40bps $2.00
CORE SALES
GROWTH
despite exiting
$25 million of EMEA
business representing
over 40 basis points of
global core sales growth.
NORMALIZED
GROSS
MARGIN
driven by productivity,
favorable mix and pricing.
$634M
OPERATING CASH FLOW
NORMALIZED
OPERATING INCOME
MARGIN
driven by pricing, productivity
and favorable mix, partially
offset by adverse foreign
currency and a significant
increase in advertising.
R E T U R N E D
$546M
TO SHAREHOLDERS
NORMALIZED
EARNINGS
PER SHARE
compared with $1.82
per diluted share in the
prior year, an increase
of 9.9%.
in dividends
and stock
repurchase
LATIN AMERICA GROWTH
enabled by European Tranformation
+22.6%
2014 Core Growth in Latin America of +22.6%, fueled by EMEA
margin transformation to parity with North America.
These are strong, competitive results. And we have delivered them while
simultaneously driving change. We are proud of our progress, but more
importantly we are excited by the future. We are on track to both strengthen
the company and create bigger value for shareholders. That’s the power
of the Growth Game Plan.
— Michael Polk, President and Chief Executive Officer
For more information visit www.ir.newellrubbermaid.com
For full financial data and non-GAAP reconciliations, please refer to Newell Rubbermaid’s
Q4 2014 earnings release issued on January 30, 2015, available at www.ir.newellrubbermaid.com.
#NWLQ414


© Copyright 2026