
SIERRA VISTA AZ AREA - Real Market Reports
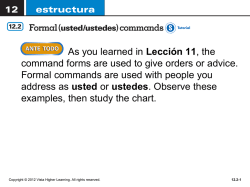
REAL ESTATE MARKET REPORT
SIERRA VISTA AZ AREA
Su
M
Tu
W
Th
F
Sa
1
2
3
4
5
6
7
8
9
10
11
12
13
14
15
16
17
18
19
20
21
22
23
24
25
26
27
28
Sunday, February 1
2015
TABLE OF CONTENTS
Charts and Commentary ………………………………………………..
Market Summary Table
………………………………………………..
Glossary
………………………………………………………………...
The Sonny Lee Home Selling Team
Your Realtors
122 N. 7th Street
Sierra Vista, Arizona 85635
www.SonnyLee.com
[email protected]
520*452*0400
Real Market Reports
RealMarketReports.com
Pages 1-2
Page 3
Page 4
REAL ESTATE MARKET REPORT
SIERRA VISTA AZ AREA
Sunday, February 1, 2015
The Sonny Lee Home Selling Team
Your Realtors
[email protected]
520*452*0400
Let's take a look
The pending ratio indicates the supply
& demand of the market. Specifically,
a high ratio means that listings are in
demand and quickly going to contract.
Alternatively, a low ratio means there
are not enough qualified buyers for the
existing supply.
at the real estate market. Currently
there are 43 sales pending in the
market overall, leaving 465 listings still
for sale. The resulting pending ratio is
8.5% (43 divided by 508). So you
might be asking yourself, that's great...
but what exactly does it mean? I'm
glad you asked!
"Current inventory is described
as somewhat slow."
Taking a closer look, we notice that
the $100K - $150K price range has a
relatively large number of contracts
pending sale.
We also notice that the $150K - $200K
price range has a relatively large
inventory of properties for sale at 123
listings. The median list price (or
asking price) for all properties in this
market is $189,900.
Number of Listings For Sale vs. Pending Contract
Properties For Sale
Contracts Pending
Sierra Vista AZ Area
140
Updated on 2/1/2015, RealMarketReports.com
Copyright © The Sonny Lee Home Selling Team
120
100
80
60
40
20
Num Sold vs. Off-Market (Last 6 mos.)
Sold
Off-Market
Sierra Vista AZ Area
300
Updated on 2/1/2015, RealMarketReports.com
Copyright © The Sonny Lee Home Selling Team
250
200
150
100
50
Real Market Reports
RealMarketReports.com
1
$700K
$650K
$600K
$550K
$500K
$450K
$400K
$350K
$300K
$250K
$200K
$150K
$100K
$50K
$0K
0
$700K
$650K
$600K
$550K
$500K
$450K
$400K
$350K
$300K
$250K
$200K
$150K
$100K
$50K
$0K
0
A total of 328 contracts have closed in
the last 6 months with a median sold
price of $154,000. Breaking it down,
we notice that the $150K - $200K price
range contains the highest number of
sold listings.
Alternatively, a total of 1033 listings
have failed to sell in that same period
of time. Listings may fail to sell for
many reasons such as being priced
too high, having been inadequately
marketed, the property was in poor
condition, or perhaps the owner had
second thoughts about selling at this
particular time. The $150K - $200K
price range has the highest number of
off-market listings at 278 properties.
Market Dashboard
REAL ESTATE MARKET REPORT
SIERRA VISTA AZ AREA
Sunday, February 1, 2015
The Sonny Lee Home Selling Team
Your Realtors
[email protected]
520*452*0400
Looking at the chart to the right, you
might be wondering why average days
on market (DOM) is important. This is
a useful measurement because it can
help us to determine whether we are
in a buyer's market (indicated by high
DOM), or a seller's market (indicated
by low DOM).
Active listings
(properties for sale) have been on the
market for a median time of 113 days.
Median Days on Market (DOM)
Sold
For Sale
Sierra Vista AZ Area
500
Updated on 2/1/2015, RealMarketReports.com
Copyright © The Sonny Lee Home Selling Team
450
400
350
300
250
200
150
Analysis of sold properties for the last
six months reveals a median sold
price of $154,000 and 119 days on
market. Notice that properties in the
$350K - $400K price range have sold
quickest over the last six months.
100
50
The recent history of sales can be
seen in the two charts below. The
median sold price for the last 30 days
was $154,000 with a DOM of 126
days.
"The median list-to-sales ratio
for this area is 94.2%."
Ratios are simple ways to express the
difference between two values such as
list price and sold price. In our case,
we typically use the list-to-sale ratio to
determine the percentage of the final
list price that the buyer ultimately paid.
It is a very common method to help
buyers decide how much to offer on a
property.
Since the recent DOM is greater than
the median DOM for the last 6 months,
it is a negative indicator for demand. It
is always important to realize that real
estate markets can fluctuate due to
many factors, including shifting interest
rates, the economy, or seasonal
changes.
Median Sold Prices
Sep
Real Market Reports
RealMarketReports.com
Nov
Dec
Jan
$700K
$650K
$600K
$550K
$500K
$450K
$400K
Sierra Vista AZ Area
160
140
120
100
80
60
40
20
0
Copyright © The Sonny Lee Home Selling Team
Updated on 2/1/2015, RealMarketReports.com
Oct
Analysis of the absorption rate
indicates an inventory of 8.5 months
based on the last 6 months of sales.
This estimate is often used to
determine how long it would take to
sell off the current inventory of
properties if all conditions remained
the same. It is significant to mention
that this estimate does not take into
consideration any additional properties
that will come onto the market in the
future.
Median Days on Market (Sold)
Sierra Vista AZ Area
$162K
$160K
$158K
$156K
$154K
$152K
$150K
$148K
$146K
$144K
$350K
$300K
$250K
$200K
$150K
$100K
$50K
$0K
0
Feb
2
Copyright © The Sonny Lee Home Selling Team
Updated on 2/1/2015, RealMarketReports.com
Sep
Oct
Nov
Dec
Jan
Feb
Market Dashboard
REAL ESTATE MARKET REPORT
SIERRA VISTA AZ AREA
Sunday, February 1, 2015
The Sonny Lee Home Selling Team
Your Realtors
[email protected]
520*452*0400
43
MARKET SUMMARY TABLE
A = Average Value
M = Median Value
N/A = Not Available
Price Range
465
Low
High
Num
#
$0
$49,999
9
$50,000
$99,999
42
$100,000
$149,999
87
$150,000
$199,999
123
$200,000
$249,999
74
$250,000
$299,999
59
$300,000
$349,999
27
$350,000
$399,999
18
$400,000
$449,999
10
$450,000
$499,999
7
$500,000
$549,999
0
$550,000
$599,999
6
$600,000
$649,999
1
$650,000
$699,999
1
$700,000
+
1
Market Totals
1033
PENDING [2]
328
ACTIVE [1]
Days
on
Market
Current
List
Price
A
116
$
37,257
M
142
$
39,900
A
137
$
81,938
M
121
$
87,950
A
111
$ 127,871
M
82
$ 125,000
A
124
$ 176,169
M
108
$ 178,000
A
134
$ 227,717
M
99
$ 229,000
A
170
$ 277,412
M
141
$ 277,367
A
133
$ 322,924
M
71
$ 320,000
A
253
$ 371,829
M
161
$ 371,750
A
209
$ 427,040
M
211
$ 429,450
A
303
$ 479,257
M
168
$ 475,000
A
144
$ 580,933
M
139
$ 575,000
A
78
$ 649,900
M
78
$ 649,900
A
450
$ 680,000
M
450
$ 680,000
A
297
$ 880,000
M
297
$ 880,000
465
OFF-MARKET (last 6 mos) [3]
Num
#
Pend
Ratio
Num
#
Num
#
2
18%
15
24
9
18%
53
58
13
13%
160
73
13
10%
278
74
6
8%
220
51
0
135
32
0
75
12
0
48
2
0
16
1
0
13
1
0
6
0
0
3
0
0
5
0
0
1
0
0
5
0
1,033
328
43
8%
ABSORPTION RATE
(months of inventory)
SOLD/CLOSED (last 6 months) [4]
Days
on
Market
Original
List
Price
Final
List
Price
Sold/
Closed
Price
ListSale
Ratio
A
136
$
78,811
$
72,549
$
30,511
42%
M
92
$
53,950
$
44,900
$
35,750
80%
A
148
$
90,357
$
77,065
$
73,284
95%
M
119
$
89,000
$
77,000
$
70,750
92%
A
138
$ 175,569
$ 130,755
$ 125,650
96%
M
126
$ 140,000
$ 129,999
$ 126,900
98%
A
157
$ 189,678
$ 179,977
$ 174,244
97%
M
105
$ 189,000
$ 178,450
$ 175,000
98%
A
177
$ 238,083
$ 229,312
$ 221,383
97%
M
131
$ 235,000
$ 229,900
$ 223,450
97%
A
168
$ 290,591
$ 283,643
$ 276,072
97%
M
146
$ 289,900
$ 284,950
$ 275,000
97%
A
143
$ 352,958
$ 346,864
$ 328,697
95%
M
131
$ 352,708
$ 344,900
$ 332,897
97%
A
50
$ 366,500
$ 359,500
$ 350,750
98%
M
50
$ 366,500
$ 359,500
$ 350,750
98%
A
182
$ 445,000
$ 424,900
$ 405,000
95%
M
182
$ 445,000
$ 424,900
$ 405,000
95%
A
126
$ 499,000
$ 499,000
$ 450,000
90%
M
126
$ 499,000
$ 499,000
$ 450,000
90%
2.3
4.3
7.2
10
8.7
11.1
13.5
54
60
42
8.5
Market Averages
141
$ 211,874
153
$ 187,008
$ 169,668
$ 160,594 95%
Market Medians
113
$ 189,900
119
$ 176,053
$ 163,500
$ 154,000 94%
Date Range (Off-Market & Sold) = 08/03/2014 to 02/01/2015
Data believed to be accurate but not guaranteed.
Est.
Mos.
Favors Sellers
Favors Buyers
Status = [1] A; [2] P; [3] L, E; [4] C
Zip Code = 85650, 85616, 85615, 85635
Dwelling = Single Family Res
Real Market Reports
RealMarketReports.com
3
Market Summary Table
REAL ESTATE MARKET REPORT
SIERRA VISTA AZ AREA
Sunday, February 1, 2015
The Sonny Lee Home Selling Team
Your Realtors
[email protected]
520*452*0400
1. PROPERTIES FOR SALE (ACTIVE)
a. Number Active: The number of listings for sale which are currently being marketed but do not yet have a purchase
agreement.
b. Days on Market (DOM): The marketing period of currently active listings. This does not account for some listings
which have had a previous listing period, but were re-entered as a new listing.
c. Current List Price: The price that a property seller is currently asking.
2. CONTRACTS PENDING
a. Number Pending: The number of current listings for which a contract has been signed but has not yet closed.
b. Pending Ratio: Sometimes called a “list-to-pending ratio”. This is a measure of how fast properties are going under
contract vs. how fast they are being listed.
Pending Ratio =
P (Number of Pending Listings)
A+P (Number of Active + Pending)
(P) represents properties that buyers have chosen
(A+P) represents the entire pool from which they have chosen
3. OFF-MARKET
a. Number Off-Market: The number of listing agreements that have failed to close in the last 6 months. Some
owners may choose to re-offer their property for sale.
4. PROPERTIES SOLD (CLOSED CONTRACT)
a. Number Sold: The number of properties that have gone to a closing in the last 6 months.
b. Days on Market (DOM): The marketing time it has taken properties to sell in the last 6 months.
c. Original List Price: The price at which a sold property was originally marketed.
d. Final List Price: The price at which a sold property was marketed just prior to selling.
e. Sold/Closed Price: The price for which a property sold.
f.
List to Sales Ratio: The percentage of the list price that the buyer ultimately paid for the property.
List to Sales Ratio =
Sold Price
Final List Price
5. ABSORPTION RATE / MONTHS OF INVENTORY
a. Absorption Rate / Months of Inventory: An estimate of how fast listings are currently selling measured in months.
For example, if 100 properties sell per month and there are 800 properties for sale - there is an 8 month supply of
inventory before counting the additional properties that will come on the market.
Real Market Reports
RealMarketReports.com
4
Glossary


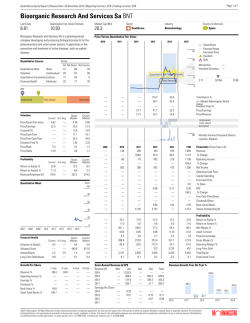
© Copyright 2026