
Economic Research
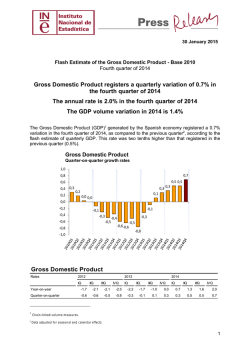
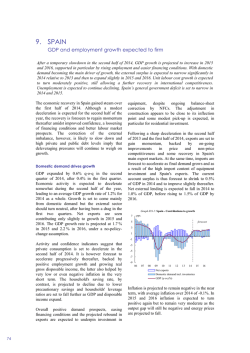
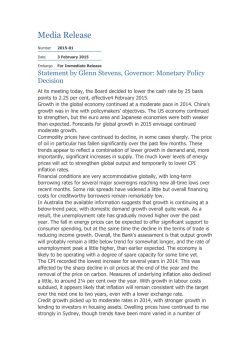
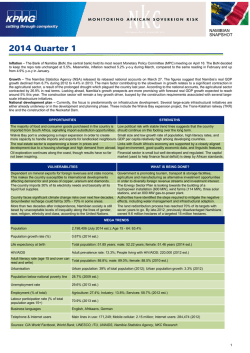
Economic Research
Published by Raymond James & Associates
Scott J. Brown, Ph.D., (727) 567-2603, [email protected]
February 2 - 6, 2015
Weekly Economic Monitor _____________________________________________________________________________________
The Advance GDP Report for 4Q14
The various news agencies were quick to report that the
economy “cooled” or “slowed” in the fourth quarter. However,
there’s a lot more to the GDP report than the headline figure.
Details confirm a lot of what we already knew. The mixed
nature of the components likely led investors to focus on global
weakness rather than the underlying domestic strength.
As expected, the GDP report reflected a strong quarter for
consumer spending (despite evidence of a “soft” December) and
a relatively soft quarter for business fixed investment.
Inventories rose sharply, leading to concerns that we’ll see a
moderate correction in 1Q15 (that is, less production). The
trade deficit was much wider than anticipated. Of course, a
strong dollar and soft global growth should lead to a wider
deficit. However, the data for October and November had
suggested little change (hence, a sharp widening assumed for
December). Domestic Final Sales (GDP less net exports and the
change in inventories), a measure of underlying domestic
demand, rose at a 2.8% pace, but would have been closer to
3.4% if not for a drop in defense spending. So somebody please
tell me why we should focus on the headline GDP figure.
Pers. Spd.
Resid. Inv.
Exports
Ch. Invent.
6
5
Real GDP (trillion $2009)
18.0
18.0
17.5
17.5
Real GDP (BEA)
Potential GDP (CBO)
previous
17.0
16.5
17.0
16.5
-1.9%
16.0
16.0
15.5
15.5
-7.2%
15.0
Contributions To U.S. GDP Growth, %
7
The Fed’s plan to “normalize” monetary policy depends a lot
on the perceived amount of slack in the economy. With ample
slack, you’re not going to see much upward pressure on
inflation. Last week, the Congressional Budget Office released
revised projections, which included a downward revision to the
estimates of potential GDP. The output gap now appears to be
about 1.9%, vs. 7.2% at the end of the recession. Granted, these
are fuzzy figures. The estimate of potential GDP depends on a
lot of assumptions (such as productivity growth, a big unknown).
However, taken at face value, the data suggest that the
economy can grow above trend for several quarters before
running into constraints that would add inflationary pressure.
15.0
7
Bus. Inv.
Gov't
Imports
Real GDP
6
5
4
4
3
3
14.5
source: Bureau of Economic Analysis,
Congressional Budget Office, Raymond James
14.0
05
06
07
08
09
10
11
12
13
14
15
16
17
Types of Economic Landings
2
1
1
0
0
-1
-1
-2
-2
potential GDP
-3
-3
soft landing
-4
12.1
12.2
12.3
12.4
13.1
13.2
13.3
reverse soft landing
-4
13.4
14.1
14.2
14.3
hard landing
14.4
The GDP report adds to the recent underlying themes for
investors. Soft global growth and a strong dollar will have a
clear negative impact on the earnings of U.S. multinationals.
We heard as much from several of these firms last week.
However, what most people are missing is the clear
strengthening of the underlying domestic economy. The labor
market is improving. Consumers and small businesses are
growing more optimistic. Bank credit, still relatively tight, is
gradually getting easier. The housing recovery, a major
disappointment so far, is exhibiting better fundamentals. While
wage growth has been relatively soft, the drop in gasoline prices
is providing a substantial boost to the household sector.
14.0
18
log output
2
source: Bureau of Economic Analysis
14.5
Source: Raymond James
time
The Fed does need to consider its end game. Its desire is to
achieve a soft landing, rather than overshooting and having to
endure a hard landing. Yet, there’s no sign we are going to
overshoot potential GDP anytime soon. The strong dollar and
soft global economy are restraints for some parts of the U.S.
economy, but should be offset by areas of domestic strength.
For the Fed, the bigger concern from abroad is the risk of more
substantial financial market disruptions.
© 2015 Raymond James & Associates, Inc., member New York Stock Exchange/SIPC. All rights reserved.
All expressions of opinion reflect the judgment of the Research Department of Raymond James & Associates, Inc. (RJA) as of the date stated above and are subject to change. Information has been obtained from third-party
sources we consider reliable, but we do not guarantee that the facts cited in the foregoing report are accurate or complete. Other departments of RJA may have information that is not available to the Research Department about
companies mentioned in this report. RJA or its affiliates may execute transactions in the securities mentioned in this report that may not be consistent with the report's conclusions.
ThisRJA
trasbh
clien
International Headquarters: The Raymond James Financial Center | 880 Carillon Parkway | St. Petersburg, Florida 33716 | 800-248-8863
Raymond James
Economic Research
Treasury Yields
13-wk 26-wk 52-wk
1/02/15
1/23/15
1/30/15
0.02
0.03
0.01
0.11
0.07
0.06
0.25
0.17
0.15
Dollar
2-yr
3-yr
5-yr
10-yr
30-yr
$/Euro
$/BP
JY/$
0.66
0.51
0.47
1.07
0.84
0.75
1.61
1.28
1.17
2.12
1.77
1.66
2.69
2.33
2.24
1.202
1.128
1.130
1.536
1.502
1.506
120.20
117.80
117.47
Recent Economic Data and Outlook
The economic data were mixed, but consistent with strong
growth and very low inflation into early 2015. The Fed policy
statement was, as expected, a near photocopy of the one from
mid-December. Investors were battered by earnings reports and
concerns about global growth.
PCE Price Index, y/y % ch.
3.0
3.0
2.5
2.5
2.0
2.0
1.5
1.5
1.0
1.0
ex-food & energy
0.5
0.5
overall
source: BEA
0.0
0.0
2010
2011
2012
Equities
2013
2014
2015
No surprise, Greece’s Election resulted in a shift to the left. The
new leadership indicated that it has no intention of leaving the
euro, but is pushing for less austerity and some debt relief,
setting up a confrontation with the “Troika,” which is
demanding its pound of flesh. This could drag on for a while.
The Federal Open Market Committee repeated that it can “be
patient in beginning to normalize the stance of monetary
policy.” In deciding when to begin raising short-term interest
rates, the FOMC repeated that it will take into account “a wide
range of information, including measures of labor market
conditions, indicators of inflation pressures and inflation
expectations, and readings on financial and international
developments.” The FOMC noted that the economy has been
expanding at a “solid” pace (vs. a “moderate” pace in the midDecember statement). The FOMC expects inflation to “decline
further in the near term,” but repeated its belief that inflation
will “rise gradually toward 2% over the medium term as the
labor market improves further and the transitory effects of lower
energy prices and other factors dissipate.”
Real GDP rose at a 2.6% annual rate in the advance estimate for
4Q14, up 2.5% y/y. Consumer spending rose at a 4.3% pace.
Business fixed investment rose 1.9%. A wider trade deficit
subtracted a full percentage point from GDP growth, faster
inventory growth added 0.8 ppt, and a drop in defense spending
subtracted 0.6 ppt. The PCE Price Index fell at a 0.5% annual
rate, while core inflation slowed to 1.1% (vs. the Fed’s 2% goal).
The Conference Board’s Consumer Confidence Index jumped to
102.9 in the initial estimate for January (the strongest since
August 2007), vs. 93.1 in December and 79.4 a year earlier.
Current job market perceptions were less depressed and
CD/$
NASD
SPX
DJIA
1.173 4726.81 2058.20 17832.99
1.240 4757.88 2051.82 17672.60
1.270 4635.24 1995.04 17166.10
respondents were more optimistic about future job availability.
Expectations of household income improved.
The University of Michigan’s Consumer Sentiment Index rose to
98.1 in January (the highest since January 2004), vs. 93.6 in
December. “Importantly,” according to the report, “the gains
during the past six months were as large among households
with incomes under $75,000 as over that amount.”
The Employment Cost Index rose 0.6% over the three months
ending in December, up 2.2% y/y. Wages and salaries rose 0.5%
(+2.1% y/y), while benefit costs rose 0.6% (+2.6% y/y).
Durable Goods Orders fell 3.4% in December, reflecting a 55.5%
decline in civilian aircraft orders. However, ex-transportation
orders fell 0.8% (vs. -1.3% in November and -1.2% in October).
Orders for nondefense capital goods fell 0.6%, the fourth
consecutive monthly decline (shipments slipped 0.2%).
The Chicago Purchasing Managers Index rose to 59.4 in January,
vs. 58.8 in December. Orders, production, and employment
strengthened. Inventories fell sharply. Prices paid fell.
New Home Sales rose 11.6% (±16.5%), to a 481,000 seasonally
adjusted annual rate (+8.8% ±17.9% y/y).
Existing Home Sales rose 2.4% in December, to a 5.04 million
seasonally adjusted annual rate (+3.5% y/y). Results were mixed
across regions. Homes for sale fell 11.1% (-0.5% y/y).
The Pending Home Sales Index fell 3.7% in December (+6.1%
y/y). The National Association of Realtors cited low inventories
of homes for sale, but remained optimistic.
The Congressional Budget Office expects a deficit of 2.6% of
GDP in FY15 (but it should start rising again after FY17).
Economic Outlook (1Q15): Real GDP growth of 2.5-3.0%.
Employment:
The unemployment insurance claims data
suggest no appreciable increase in layoffs (beyond the usual
seasonal pattern) in early 2015. Small firms are hiring.
Consumers: Strong job growth is a plus and lower gasoline
prices will boost consumer purchasing power in 2015.
Confidence is rising, but we still need to see a pickup in wages.
Manufacturing: Mixed. A stronger dollar and weakness in the
global economy are expected to restrain exports, but domestic
demand should strengthen in the months ahead.
Housing/Construction: Supply constraints have eased and
affordability has improved. Look for a better balance in 2015
(less speculative buying, better consumer fundamentals).
Prices: The PCE Price Index remains well below the Fed’s 2%
goal – and the core rate is moving in the wrong direction. Pipeline
pressures are mild. Wage pressures are limited. Inflation
expectations remain well-anchored, but may decline.
Interest Rates: With low inflation and a still-high elevated level
of slack in the economy, the Fed can be patient in deciding
when to begin raising short-term interest rates. Global financial
conditions are also a consideration (along with the outlooks for
inflation and the job market).
© 2015 Raymond James & Associates, Inc., member New York Stock Exchange/SIPC. All rights reserved.
International Headquarters: The Raymond James Financial Center | 880 Carillon Parkway | St. Petersburg, Florida 33716 | 800-248-8863
2
Raymond James
Economic Research
This Week:
Sunday
2/01
Monday
2/02
Tuesday
2/03
Wednesday
2/04
Thursday
2/05
Friday
2/06
forecast
last
last –1 comments
+0.3%
-0.2%
+0.0%
NF
+1.0%
54.4
+0.4%
+0.6%
+0.0%
53.9
-0.3%
55.1
+0.3%
+0.3%
+0.2%
54.8
+1.2%
57.6
soft wage strength pulled into November
weak retail sales results (but quirky)
the core CPI rose 0.003%
53.7 in the flash estimate
minor implications for GDP revision
likely to be mixed
-2.3%
16.9
13.6
+210
57.0
-0.7%
16.8
13.5
+241
56.5
-0.7%
17.1
13.8
+227
58.8
lower oil, but a soft trend otherwise
results usually depend on final weekend
but likely to remain relatively strong
moderately strong
some pickup likely
295
-0.1%
+2.3%
-44.4
-63.7
+195
+190
5.6%
62.8%
34.6
+0.2%
265
+2.3%
-1.0%
-39.0
-58.3
252
240
5.6%
62.7%
34.6
-0.2%
308
+2.9%
-3.7%
-42.2
-61.6
353
345
5.8%
62.9%
34.6
+0.2%
no change
perhaps a mild weather impact
seen about flat
uneven in recent quarters
assumed a lot wider in the GDP est.
imports up, exports down
annual benchmark revisions due
a more moderate pace seen in 1Q15
should be little changed
trending flat, but better for ages 25-54
seen steady
mild wage pressures
Jan
Dec
NF
NF
NF
100.4
3.6%
1.9%
Jan
NF
-10.3
2/07
Jan
292
+0.3%
+0.2%
+0.5%
+0.1%
295
-0.9%
-1.0%
-0.2%
+0.2%
NF
NF
100.0
-2.5%
-0.1%
98.1
Super Bowl XLIX
NE Patriots vs. Seattle Seahawks
8:30 Personal Income
Personal Spending
PCE Price Index ex-f&e
9:45 Markit US Manf PMI (final)
10:00 Construction Spending
10:00 ISM Manf. Index
Dec
10:00 Factory Orders
tbd Motor Vehicle Sales, mln
domestically built
8:15 ADP Payroll Estimate, th.
10:00 ISM Non-Manf. Index
Dec
Jan
7:00 BOE Policy Decision
8:30 Jobless Claims, th.
8:30 Productivity (prelim.)
Unit labor Costs
8:30 Trade Balance, $bln
goods only
8:30 Nonfarm Payrolls, th.
private-sector
Unemployment Rate
Employment/Population
Avg. Weekly Hours
Avg. Hourly Earnings
Jan
Jan
Jan
Jan
1/31
4Q14
Dec
Jan
Next Week:
Monday
2/09
no significant data
Tuesday
2/10
Wednesday
2/11
7:30 Small Business Optimism
10:00 JOLTS: hiring rate
JOLTS: quit rate
1:00 Treasury Note Auction
1:00 Treasury Note Auction
2:00 Treasury Budget, $bln
Thursday
Friday
2/12
2/13
8:30 Jobless Claims, th.
8:30 Retail Sales
ex-autos
ex-autos, bld mat, gasoline
10:00 Business Inventories
1:00 Treasury Bond Auction
8:30 Import Prices
ex-food & fuel
9:55 UM Consumer Sentiment
Dec
Jan
m-Feb
This Week…
A busy week for economic data, but we may not get a clear
picture due to potential distortions from seasonal adjustment.
For example, we can expect to lose more than 2.8 million jobs
each January. Are we really going to worry about the nearest
20,000 or so in the adjusted figure? Yes, we are. Even with the
onslaught of data, earnings reports and overseas developments
are still likely to influence the stock market.
98.1 trending higher
3.7% a gradual trend higher
1.9% but still below normal
3-year notes
10-year notes
+2.9 seen moderate
295
+0.4%
+0.1%
+0.5%
+0.2%
still subject to some seasonal noise
moderate (watch for revisions)
lower gasoline prices
expected to rebound
reduced by lower oil prices
30-year bonds
-1.8% falling oil prices
-0.2% but disinflationary pressure otherwise
93.6 trending higher
consumer spending. Lower gasoline prices will drive inflation
lower, but the core rate is also edging down.
11.2
Real Consumer Spending, trillion 2009 dollars, annual rate
11.1
11.0
11.2
11.1
quarter
11.0
month
Monday
10.9
10.9
Personal Income and Spending (December) – Quarterly figures
10.8
10.8
10.7
10.7
10.6
10.6
were included in the GDP report. The monthly figures would
normally give us a good idea of the momentum heading toward
1Q15. However, other data reports suggest that some of
December’s seasonal strength was likely pulled forward into
November (it was a strong quarter). The 4Q14 GDP data
suggest a modest gain in income in December and a decline in
Source: Bureau of Economic Analysis
10.5
10.5
2013
2014
© 2015 Raymond James & Associates, Inc., member New York Stock Exchange/SIPC. All rights reserved.
International Headquarters: The Raymond James Financial Center | 880 Carillon Parkway | St. Petersburg, Florida 33716 | 800-248-8863
2015
3
Raymond James
Economic Research
Construction Spending (December) – Not market-moving, these
figures could have some minor implications for GDP revisions.
ISM Manufacturing Index (January) – Softer global growth and a
stronger dollar should be having a negative impact on exporters.
Increasing strength in the domestic economy should help offset
that somewhat. Results are likely to be mixed across industries.
Seasonal adjustment may exaggerate weather effects.
ISM Manufacturing Index and Components
60
10
58
8
56
6
54
4
52
2
50
0
48
-2
46
-4
44
42
40
38
36
34
source: Institute for
Supply Management
06
07
08
09
10
11
12
13
14
142
source: BLS
141
140
140
139
139
138
138
137
137
-8
136
136
-10
135
135
-12
-14
32
05
Nonfarm Payrolls (million, not seas. adj.)
142
141
-6
Inventories
Supplier Deliveries
Employment
Production
New Orders
ISM Manf. Index
weight on the adjusted payroll figure (but the markets likely
will). This release will include annual benchmark revisions to
the payroll data (based on actual payroll tax receipts), but that
shouldn’t matter much. In September, the BLS estimated that
this revision would lift the March 2014 payroll figure by just
7,000 (less than 0.05%) – that’s tiny. The unemployment rate
should hold roughly steady, but the trend is lower. While
payroll growth has been strong, we haven’t seen much of a
pickup in the employment/population ratio.
134
-16
133
-18
132
15
134
2014-15
133
2013-14
2012-13
132
2011-12
131
131
Tuesday
Factory Orders (December) – Orders for durable goods (which
account for most of the volatility) were reported to have fallen
by 3.4% (following a 2.1% decline in November). Orders for
nondurables should reflect the drop in oil prices.
Jul
Aug
Sep
Oct
Nov
Dec
Jan
Feb
Mar
Apr
May
Jun
Employment / Population, %
81
64
Aged 25-54 (left)
Total (right)
80
63
79
62
78
61
Wednesday
77
60
ADP Payroll Estimate (January) – Everyone knows that the ADP
76
59
figure is not a good predictor of the monthly change in the BLS
data. Nevertheless, the financial markets may react to a
surprise (and there’s a good chance of that).
75
Unit Auto Sales (January) – Replacement needs and relatively
easy bank credit should continue to support auto sales in 2015.
Strong job growth and lower gasoline prices will also help.
ISM Non-Manufacturing Index (January) – These figures should
remain consistent with moderately strong growth in the overall
economy. Watch new orders and employment.
Thursday
Jobless Claims (week ending January 31) – The figures are still
subject to seasonal noise, but the underlying trend suggests no
appreciable increase in early 2015 (either due to layoffs in the
energy sector or due to an unwinding of seasonal strength).
Trade Balance (December) – In the advance GDP estimate, the
58
source: Bureau of Labor Statistics
74
57
07
08
09
10
11
12
13
14
15
Next Week …
The economic calendar thins out. January is not a critical month
for most retailers, but the financial markets are expected to pay
attention to the sales data, which should rebound from a “soft”
December (the trend was strong in 4Q14).
Coming Events and Data Releases
February 12
Retail Sales (January)
February 16
Presidents Day (markets closed)
March 18
FOMC Policy Decision, Yellen press conference
Friday
March 6
Employment Report (February)
Employment Report (January) – We normally lose over 2.8
April 29
FOMC Policy Decision (no press conference)
million jobs each January, largely reflecting the end of the
holiday shopping period. Hence, one should not put much
June 17
FOMC Policy Decision, Yellen press conference
Bureau of Economic analysis assumed a sharp widening of the
trade deficit in December, reflecting a drop in exports and a
pickup in imports. The deficit should widen further in 2015.
© 2015 Raymond James & Associates, Inc., member New York Stock Exchange/SIPC. All rights reserved.
International Headquarters: The Raymond James Financial Center | 880 Carillon Parkway | St. Petersburg, Florida 33716 | 800-248-8863
4


© Copyright 2026