
View/Open - University of Technology, Sydney
i
SLC11A1 PROMOTER POLYMORPHISMS,
GENE EXPRESSION AND ASSOCIATION
WITH AUTOIMMUNE AND
INFECTIOUS DISEASES
A Thesis Submitted for the Degree
of
Doctor of Philosophy
by
Nicholas Steven Archer
B. Sc.(Hons1)
School of Medical and Molecular Biosciences, Faculty of Science,
University of Technology Sydney, Australia.
2012
ii
CERTIFICATE OF
AUTHORSHIP/ORIGINALITY
I certify that the work in this thesis has not previously been submitted for a degree nor
has it been submitted as part of requirements for a degree except as fully acknowledged
within the text.
I also certify that the thesis has been written by me. Any help that I have received in my
research work and the preparation of the thesis itself has been acknowledged. In
addition, I certify that all information sources and literature used are indicated in the
thesis.
Nicholas Steven Archer
2012
iii
ACKNOWLEDGMENTS
I am grateful to many people who have supported and helped me throughout the
completion of my postgraduate studies. In particular, my supervisors Dr Bronwyn
O’Brien and Dr Najah Nassif, both of whom have provided immeasurable guidance,
support and wisdom throughout the completion of my postgraduate work. I thank you
for the effort and enthusiasm you have shown to my work.
I wish to extend a special thanks to Stephanie Dowdell for her friendship and support
through the completion of my PhD and assistance with reverse-transcriptase real-time
PCR. I also appreciate and acknowledge the support provided to me from the numerous
postgraduate students, postdoctoral and support staff that I have had the privilege and
honour to work alongside of and socialise with.
Futhermore, I would like to thank the following people for their technical guidance for
the experimental work completed in this project. Paul Held and Sharon Guffogg for
assistance with the Biotek fluorescent plate reader. Dr Lisa Sedger for assistance with
flow cytometery and Dr Mike Johnson for confocal microscopy analysis. Narelle
Woodland, Gilian Rozenberg and the Prince of Wales Hospital for assistance with
staining of THP-1 cells and positive controls. Additionally, a big thankyou to David
Hyatt and Lonza for the loan of the Nucleofector instrument.
I would like to also acknowledge Jenefer M. Blackwell, Anna Dubaniewicz, A Graham,
Leonardo A Sechi, Lee E Sieswerda, Maria Gazouli, Margje Haverkamp, Linda Wicker,
Jennie Yang, Eileen Hoal, Timothy Sterling and Alison Motsinger-Reif for supplying
additional population data for the completion of meta-analyses.
Finally, I would like to thank the support of my family, my partner, Sarah, my parents,
Lynette and Warwick and sister and brother-in law, Kerri and Daniel. While you never
did understand exactly what I was doing, you still tried to show an interest!
iv
ABSTRACT
Solute Carrier Family 11A Member 1 (SLC11A1) is a member of a highly conserved
group of ion transporters and has restricted localisation to the phagosomal membrane of
monocytes/macrophages. SLC11A1 plays an immunomodulatory role in influencing
macrophage activation status and the T helper 1/T helper 2 bias. As such it modulates
susceptibility to infectious/autoimmune diseases. A polymorphic (GT)n promoter
microsatellite repeat is known to alter SLC11A1 promoter activity. Of the nine (GT)n
alleles identified, alleles 3 and 2, which account for a combined allele frequency of
greater than 95%, drive high and low SLC11A1 expression, respectively. The increased
SLC11A1 expression, driven by (GT)n allele 3 is hypothesised to result in a heightened
activation status of classically activated macrophages, affording resistance to infectious
disease, but conferring susceptibility to pro-inflammatory autoimmune diseases.
Conversely, decreased SLC11A1 expression in the presence of allele 2 would confer
susceptibility to infectious disease, but resistance to autoimmune disease.
A large number of studies assessing the association between the presence of specific
(GT)n promoter alleles with the incidence of infectious and autoimmune disease have
produced inconsistent associations. Meta-analyses are powerful analytical tools which
combine individual association studies to estimate the strength of an association,
therefore, meta-analyses of case control association studies (from 1991-2006) analysing
the association of SLC11A1 promoter (GT)n alleles 2 and 3 with the incidence of
autoimmune disease were performed. The meta-analyses found a weak predominance of
disease in the absence of allele 2, with a fixed effects pooled OR of 0.80 (95% CI =
0.22), however, a random effects pooled odds ratio (OR) of 0.88 (95% CI = 0.66) for
allele 3 suggested no association with the incidence of autoimmune disease.
The publication of additional case control studies between 2006 and the present allowed
a more comprehensive meta-analysis to be completed. This analysis, which included
additional SLC11A1 polymorphisms, represents the largest study assessing the
association of SLC11A1 polymorphisms with disease occurrence to date. Allele 2 of the
(GT)n microsatellite was associated with increased and reduced incidence of infectious
[OR=1.32 (1.20-1.46)] and autoimmune diseases [OR=0.90 (0.81-1.00)], respectively.
Allele 3 was significantly associated with reduced incidence of infectious disease
v
[OR=0.82 (0.76-0.88)], however, the association with susceptibility to autoimmune
disease occurrence did not reach statistical significance [OR=1.11 (0.98-1.26)]. The
findings of the meta-analysis challenges the hypothesis that allele 3 is the disease
causing variant at the (GT)n microsatellite repeat.
The results of these meta-analyses highlight small sample sizes as a major limitation of
case control association studies. Completion of large-scale studies has been impractical
because conventional SLC11A1 (GT)n genotyping methodologies are time consuming
and cannot differentiate all (GT)n variants. A high resolution melt curve methodology
has been designed and optimised to genotype two SLC11A1 polymorphisms, the (GT)n
and (CAAA)n microsatellite repeats. Assay validation yielded a 100% success rate for
genotyping of the (GT)n and (CAAA)n microsatellites. The designed methodology is the
first to enable accurate, sensitive and high-throughput genotyping of these
microsatellites and will enable the completion of sufficiently large association studies
required to determine the association between the SLC11A1 (GT)n and (CAAA)n
polymorphisms and disease occurrence.
In addition to the (GT)n microsatellite, the -237C/T polymorphism has also been shown
to modulate SLC11A1 expression, with the T variant driving low expression in the
presence of (GT)n allele 3. Little is known about SLC11A1 transcription or the
mechanism by which the (GT)n and -237C/T promoter polymorphisms modulate
SLC11A1 expression. Bioinformatic studies were completed to identify putative
regulatory elements involved in transcription and promoter constructs, containing
different lengths of the SLC11A1 promoter, were prepared and used to assess promoter
function. A 581bp promoter region (-532 to +49) that controlled SLC11A1 expression in
monocytes was identified. Within this region was identified a 148bp minimal promoter
region (-99 to +49) containing the core elements for the formation of the basal
transcriptional complex. The greatest transcriptional enhancement was identified within
a 170bp region (-532 to -362) containing a novel IRF-Ets composite sequence for the
recruitment of transcription factors IRF-8 and PU.1. Additionally, the promoter
constructs suggested that the SLC11A1 promoter may mediate bidirectional
transcription. It was further determined that, in monocytic cells, the ability of (GT)n
alleles 2 and 3 to differentially modulate SLC11A1 expression was not due to their
differing abilities to form Z-DNA, but to monocyte-specific factor(s) binding to a 165bp
vi
region (-362 to -197) of the SLC11A1 promoter. Additional bioinformatic and functional
assays suggested that the T variant of the -237C/T polymorphism reduced SLC11A1
promoter activity independently of the (GT)n microsatellite repeat.
Infectious and autoimmune diseases are major contributors to morbidity and mortality.
SLC11A1 is instrumental in regulating macrophage function and hence susceptibility to
infectious and autoimmune diseases. This study has provided insight into the association
of SLC11A1 with disease incidence, has developed a novel genotyping methodology to
allow the completion of large association studies and has elucidated mechanisms of
transcriptional regulation of SLC11A1 and the influence of polymorphisms on SLC11A1
expression.
vii
PUBLICATIONS ARISING FROM THE WORK
DESCRIBED IN THIS THESIS
(A) PUBLICATIONS IN PEER-REVIEWED JOURNALS
Nicholas S. Archer, Najah Nassif & Bronwyn A. O’Brien (2012) “The SLC11A1 (GT)n
promoter polymorphism modulates expression through monocyte specific factor(s) to
alter susceptibility to infectious and autoimmune diseases”, (Manuscript in preparation).
Nicholas S. Archer, Najah Nassif & Bronwyn A. O’Brien (2012) “Meta-analysis of
SLC11A1 polymorphisms: (GT)n allele 2 exerts selective pressure in infectious and
autoimmune disease”, (Manuscript in preparation).
Nicholas S. Archer, Melinda Sirmias, Stephanie Dowdell, Najah Nassif & Bronwyn A.
O’Brien (2012) “Genotyping disease-associated SLC11A1 microsatellite repeats by high
resolution melt analysis”, (Submitted).
Nicholas S. Archer, Najah Nassif & Bronwyn A. O’Brien (2010) “Discrimination of
microsatellite repeat polymorphisms of the SLC11A1 promoter by melting curve
analysis using the Eppendorf Mastercycler ep realplex”, Eppendorf Technical
Application Note 206.
Bronwyn O’Brien, Nicholas S. Archer, Fraser Torpy & Najah Nassif (2008)
“Association of SLC11A1 Promoter Polymorphisms with the incidence of autoimmune
and Inflammatory Diseases: A Meta-Analysis”, Journal of Autoimmunity, 31(1): 42-51.
viii
(B) CONFERENCE ABSTRACTS
Nicholas Archer, Najah Nassif & Bronwyn O’Brien (2011) Poster entitled:
“Macrophage specific factors differentially regulate allele specific SLC11A1 expression
and consequent susceptibility to infectious and autoimmune disease”, 32nd Lorne
Genome Conference.
Nicholas Archer, Najah Nassif & Bronwyn O’Brien (2010) Presentation entitled: “The
SLC11A1 (GT)n promoter polymorphism modulates susceptibility to infectious and
autoimmune disease”, 27th Combined RNSH/UTS/USyd/KIMR Scientific Research
Meeting – Winner of the John Hambly award for best UTS presentation.
Nicholas Archer, Najah Nassif & Bronwyn O’Brien (2010) Poster entitled:
“Elucidation of the essential promoter region of SLC11A1”, 31st Lorne Genome
Conference.
Nicholas Archer, Melinda Sirmias, Stephanie Dowdell, Najah Nassif & Bronwyn
O’Brien (2009) Poster entitled: “Genotyping of functional SLC11A1 polymorphisms
associated with infectious and autoimmune diseases”, 26th Combined
RNSH/UTS/USyd/KIMR Scientific Research Meeting.
Nicholas Archer, Najah Nassif & Bronwyn O’Brien (2008) Presentation in the Young
Investigator Category “Elucidation of the Essential Promoter Region of SLC11A1”, 25th
Combined RNSH/UTS/USyd/KIMR Scientific Research Meeting.
Nicholas Archer, Najah Nassif & Bronwyn O’Brien (2007) Presentation entitled:
“Genotyping SLC11A1 promoter polymorphisms by high resolution melt (HRM)
analysis”, 24th Combined RNSH/UTS/USyd/KIMR Scientific Research Meeting.
(C) AWARDS
Awarded the John Hambly Award for the best UTS presentation at the Combined
RNSH/UTS/USyd/KIMR Scientific Research Meeting 2010.
ix
CONTENTS
CERTIFICATE OF AUTHORSHIP/ORIGINALITY ...................................................... ii
ACKNOWLEDGMENTS ...............................................................................................iii
ABSTRACT ..................................................................................................................... iv
PUBLICATIONS ARISING FROM THE WORK DESCRIBED IN THIS THESIS ... vii
(A) PUBLICATIONS IN PEER-REVIEWED JOURNALS ...................................... vii
(B) CONFERENCE ABSTRACTS ...........................................................................viii
(C) AWARDS ............................................................................................................viii
CONTENTS ..................................................................................................................... ix
LIST OF FIGURES .....................................................................................................xxiii
LIST OF TABLES ....................................................................................................... xxix
LIST OF APPENDICES .............................................................................................. xxxi
LIST OF ABBREVIATIONS ..................................................................................... xxxii
CHAPTER 1 – INTRODUCTION ................................................................................... 1
1.1 STRUCTURE AND FUNCTION OF SLC11A1 ................................................... 2
1.1.1 Historical Background ..................................................................................... 2
1.1.1.1 Discovery of the Human SLC11A1 Gene ................................................. 3
1.1.2 Structure of SLC11A1...................................................................................... 4
1.1.3 Tissue and Cellular Expression of SLC11A1 .................................................. 7
1.1.3.1 SLC11A1 is Recruited to the Phagosomal Membrane in
Macrophages/Monocytes ...................................................................................... 7
1.1.3.2 SLC11A1 Expression and Monocyte/Macrophage Development ............ 9
1.1.3.3 SLC11A1 Expression in PMN Leukocytes............................................. 11
1.1.3.4 Expression of SLC11A1 in Other Tissues .............................................. 11
1.1.4 Function of SLC11A1 .................................................................................... 12
1.1.4.1 SLC11A1 Functions as a Symporter to Transport Cations Out of the
Phagosome .......................................................................................................... 12
1.1.4.2 Role of SLC11A1 in Resting Macrophages ............................................ 13
1.1.5 Pleiotropic Effects of SLC11A1 .................................................................... 15
1.1.5.1 SLC11A1 Modulates Adaptive Immune Responses ............................... 16
1.1.5.2 SLC11A1 Modulates Cytokine Levels ................................................... 16
x
1.1.5.3 SLC11A1 Modulates Expression of Pro-Inflammatory Effector
Molecules ............................................................................................................ 17
1.1.6 SLC11A1 and Autoimmune Disease ............................................................. 18
1.2 SLC11A1 POLYMORPHISMS ............................................................................ 21
1.2.1 Genomic Organisation of the SLC11A1 Locus .............................................. 21
1.2.2 SLC11A1 Polymorphisms .............................................................................. 21
1.2.3 SLC11A1 Functional Polymorphisms ............................................................ 24
1.2.4 SLC11A1 Polymorphisms Affecting Expression Levels................................ 25
1.2.4.1 SLC11A1 Promoter Polymorphisms ....................................................... 26
1.2.4.2 SLC11A1 UTR Polymorphisms .............................................................. 26
1.3 SLC11A1 PROMOTER POLYMORPHISMS AND DISEASE OCCURRENCE
..................................................................................................................................... 27
1.3.1 The SLC11A1 (GT)n Microsatellite Promoter Polymorphism ....................... 27
1.3.2 The (GT)n Promoter Polymorphisms Modulate SLC11A1 Expression .......... 29
1.3.3 The SLC11A1 -237C/T Promoter Polymorphism .......................................... 30
1.3.4 The Association of SLC11A1 (GT)n Promoter Variants with Infectious and
Autoimmune Diseases ............................................................................................. 31
1.3.4.1 SLC11A1 (GT)n Promoter Polymorphism and Infection ........................ 32
1.3.4.2 SLC11A1 (GT)n Promoter Polymorphisms and Autoimmune Disease ... 34
1.3.5 Limitations of Association Studies Analysing the SLC11A1 (GT)n
Polymorphism and Disease Occurrence.................................................................. 37
1.4 BACKGROUND TO THE PROJECT AND AIMS ............................................. 38
1.4.1 Background to Project .................................................................................... 38
1.4.2 Aims of the Project......................................................................................... 39
CHAPTER 2 – GENERAL MATERIALS & METHODS............................................. 42
2.1 MATERIALS ........................................................................................................ 43
2.1.1 General Materials and Reagents .................................................................... 43
2.1.2 DNA Size Standards ...................................................................................... 43
2.1.3 Oligonucletides .............................................................................................. 44
2.2 METHODS ........................................................................................................... 45
2.2.1 Sterility and Containment .............................................................................. 45
2.2.2 DNA Techniques ............................................................................................ 45
2.2.2.1 PCR 1 – General PCR ............................................................................. 45
2.2.2.2 Purification of PCR Products .................................................................. 46
xi
2.2.2.3 Restriction Enzyme Digestion................................................................. 46
2.2.2.4 Small-Scale Preparation of Plasmid DNA (‘mini’-prep) ........................ 46
2.2.2.5 Agarose Gel Electrophoresis ................................................................... 47
2.2.2.6 DNA Sequencing .................................................................................... 47
2.2.2.7 Determination of DNA Concentration .................................................... 47
2.2.3 Microbiological Techniques........................................................................... 48
2.2.3.1 Luria Bertani Medium ............................................................................. 48
2.2.3.2 Cloning of PCR Products ........................................................................ 48
2.2.3.3 Isolation and Culture of Positive Colonies ............................................. 48
2.2.4 Bioinformatics ................................................................................................ 49
2.2.4.1 Restriction Mapping ................................................................................ 49
2.2.4.2 Analysis of Sequence Data...................................................................... 49
CHAPTER 3 – ASSOCIATION OF SLC11A1 PROMOTER POLYMORPHISMS
WITH THE INCIDENCE OF AUTOIMMUNE AND INFLAMMATORY DISEASES:
A META-ANALYSIS .................................................................................................... 50
3.1 PREFACE ............................................................................................................. 51
3.2 INTRODUCTION ................................................................................................ 51
3.3 METHODS ........................................................................................................... 54
3.3.1 Data Collection............................................................................................... 54
3.3.2 Statistical Analyses ........................................................................................ 55
3.4 RESULTS ............................................................................................................. 57
3.5 DISCUSSION ....................................................................................................... 61
CHAPTER 4 – HIGH-THROUGHPUT GENOTYPING OF SLC11A1
MICROSATELLITE REPEATS BY HIGH RESOLUTION MELT CURVE
ANALYSIS ..................................................................................................................... 67
4.1 INTRODUCTION ................................................................................................ 68
4.1.1 High-Throughput Genotyping of SLC11A1 Microsatellite Repeats Using
High Resolution Melt Curve Analysis .................................................................... 71
4.2 MATERIALS AND METHODS .......................................................................... 74
4.2.1 Materials ......................................................................................................... 74
4.2.1.1 General Materials .................................................................................... 74
4.2.1.2 Oligonucleotides ..................................................................................... 74
4.2.2 Methods .......................................................................................................... 75
4.2.2.1 Genomic DNA Collection ....................................................................... 75
xii
4.2.2.1.1 Buccal Cell Collection ..................................................................... 75
4.2.2.1.2 FTA Card Immobilisation of Buccal Cells ...................................... 75
4.2.2.1.3 Collection of Blood Cells ................................................................. 76
4.2.2.2 Genomic DNA Extraction ....................................................................... 76
4.2.2.2.1 Preparation of FTA Card Immobilised gDNA for PCR Analysis.... 76
4.2.2.2.2 Elution of FTA Card Immobilised gDNA ....................................... 76
4.2.2.2.3 Direct Addition of Buccal Cells to the PCR .................................... 77
4.2.2.3 Cloning of SLC11A1 (GT)n and (CAAA)n Polymorphic Variants.......... 77
4.2.2.4 PCR Protocols ......................................................................................... 78
4.2.2.4.1 PCR 2 – Optimisation of Parameters for Real-Time PCR Analysis 78
4.2.2.4.2 PCR 3 – Optimised Real-Time PCR Protocol for the Genotyping of
SLC11A1 Microsatellite Repeats by HRM Analysis ...................................... 79
4.2.2.4.3 PCR 4 – Nested PCR Protocol to Increase Starting Template for
HRM Genotyping from FTA Card Immobilised gDNA ................................. 80
4.2.2.5 Genotyping of SLC11A1 Microsatellite Polymorphisms by HRM Curve
Analysis ............................................................................................................... 80
4.2.2.6 Software .................................................................................................. 81
4.2.2.6.1 Prediction of Amplicon Melting using Poland ................................ 81
4.2.2.6.2 Genotype Determination from Transformed Raw Melt Curve Data 81
4.3 RESULTS ............................................................................................................. 83
4.3.1 HRM Analysis Assay Design ........................................................................ 83
4.3.1.1 Oligonucleotide Design for Genotyping of the SLC11A1 (GT)n and
(CAAA)n Microsatellites by HRM Analysis ...................................................... 83
4.3.1.2 PCR Amplification using the Designed HRM Oligonucleotides Produced
Amplicons of the Correct Length and Sequence................................................. 86
4.3.2 Optimisation of Real-time PCR Parameters for HRM Analysis .................... 87
4.3.2.1 Optimisation of PCR Annealing Temperature ........................................ 87
4.3.2.2 Optimisation of Magnesium Chloride Concentration ............................. 88
4.3.2.3 Optimisation of Primer Concentrations by Real-time PCR .................... 89
4.3.2.4 Selection of Taq Polymerase and Optimisation of Real-time PCR
Cycling Parameters ............................................................................................. 92
4.3.3 HRM Genotyping of Simulated SLC11A1 (GT)n and (CAAA)n Genotypes . 93
4.3.3.1 Optimisation of HRM Parameters - Ramp Rate and HR-1 Software
Analysis Parameters ............................................................................................ 93
xiii
4.3.3.2 The Optimised HRM Genotyping Methodologies Successfully
Differentiates Simulated (GT)n and (CAAA)n Genotypes .................................. 97
4.3.3.3 Differentiation of the Common and Rare (GT)n Heterozygous Genotypes
using the Developed HRM Assay ....................................................................... 98
4.3.4 Validation of the SLC11A1 (GT)n and (CAAA)n HRM Genotyping
Methodologies ......................................................................................................... 99
4.3.4.1 Direct use of FTA Card Punches in the PCR .......................................... 99
4.3.4.2 HRM Genotyping of Samples after Elution of DNA from FTA Cards 101
4.3.4.3 Amplification from Buccal Cells Added Directly to the PCR .............. 102
4.3.4.4 Introduction of a Nested PCR Approach to Allow for the Validation of
the HRM Assay for the (CAAA)n Polymorphism ............................................ 103
4.3.4.5 Validation of the (GT)n HRM Genotyping Assay using gDNA Isolated
from Blood ........................................................................................................ 104
4.3.5 Genotypes of the SLC11A1 (GT)n and (CAAA)n Repeat can be Differentiated
using the Eppendorf realplex Real-Time PCR Instrument ................................... 106
4.4 DISCUSSION ..................................................................................................... 109
4.4.1 Introduction .................................................................................................. 109
4.4.2 Design and Optimisation of the HRM Genotyping Assays ......................... 109
4.4.3 Validation of the HRM Genotyping Assays ................................................ 111
4.4.4 Sample Spiking with a Known Genotype May Increase the Robustness of the
HRM Assays ......................................................................................................... 113
4.4.5 The HRM Genotyping Assays can Detect Novel Variants and Rare (GT)n
Alleles in a Heterozygous Form ............................................................................ 114
4.4.6 Conclusion ................................................................................................... 115
CHAPTER 5 – FUNCTIONAL ANALYSIS OF THE SLC11A1 PROMOTER ......... 117
5.1 INTRODUCTION .............................................................................................. 118
5.1.1 The SLC11A1 Promoter ............................................................................... 118
5.1.2 Mechanisms of Eukaryotic Transcription Initiation .................................... 120
5.1.2.1 The Basal Transcriptional Complex ..................................................... 120
5.1.2.2 Transcription from Non-Canonical (TATA-less) Promoters ................ 121
5.1.2.3 Transcriptional Activators and Repressors ........................................... 123
5.1.3 The SLC11A1 Promoter and Transcription .................................................. 124
5.1.4 SLC11A1 Promoter Polymorphisms Modulate SLC11A1 Expression ......... 126
xiv
5.1.4.1 The SLC11A1 (GT)n Microsatellite has Endogenous Enhancer Activity
........................................................................................................................... 126
5.1.4.2 Z-DNA Structure and Function ............................................................. 127
5.1.4.2.1 Z-DNA Formation May Modulate Allelic Differences in SLC11A1
Expression ..................................................................................................... 128
5.1.5 Aims ............................................................................................................. 129
5.2 MATERIALS AND METHODS ........................................................................ 130
5.2.1 Materials ....................................................................................................... 130
5.2.1.1 General Materials .................................................................................. 130
5.2.1.2 Oligonucleotides ................................................................................... 130
5.2.2 Methods ........................................................................................................ 131
5.2.2.1 Bioinformatic Analysis of the SLC11A1 Promoter ............................... 131
5.2.2.1.1 Bioinformatic Storage and Analysis using LaserGene .................. 131
5.2.2.1.2 ClustalW Alignment of the Promoter Regions of SLC11A1
Homologs ...................................................................................................... 132
5.2.2.1.3 Identification of Conserved SLC11A1 Promoter Elements by
WeederH Analysis ........................................................................................ 133
5.2.2.1.4 Analysis of SLC11A1 for Transcription Factor Binding Sites ...... 133
5.2.2.1.5 Identification of Z-DNA Forming Sequences in the SLC11A1
Promoter by Z-Hunt Analysis ....................................................................... 135
5.2.2.1.6 Dectection of Alu Elements and Other Repetitive Elements within
the SLC11A1 Promoter.................................................................................. 136
5.2.2.2 DNA Techniques ................................................................................... 136
5.2.2.2.1 PCR 5 – Amplification of Promoter Regions for Promoter Analysis
....................................................................................................................... 136
5.2.2.2.2 Gel Purification of DNA Fragments for Cloning........................... 137
5.2.2.2.3 Production of the 1A-bla(M) Plasmid ........................................... 137
5.2.2.2.4 In Vitro Site-Directed Mutagenesis ................................................ 138
5.2.2.2.5 Verification of the 1A-bla(M) Plasmids by Sequence Analysis .... 139
5.2.2.2.6 The pGeneBLAzer Cloning Protocol to Produce the 1A-bla(M)
Plasmid and Smaller SLC11A1 Promoter Constructs ................................... 140
5.2.2.2.7 Addition of A Overhangs for TOPO TA Cloning .......................... 141
5.2.2.2.8 Verification of SLC11A1 Promoter Constructs .............................. 141
5.2.2.2.9 Production of the Negative Control Plasmid emp-bla(M) ............. 142
xv
5.2.2.3 Microbial Techniques............................................................................ 143
5.2.2.3.1 Large Scale Preparation of Plasmid DNA (Maxi-prep) ................. 143
5.3 RESULTS ........................................................................................................... 145
PART 1: Discovery of Important SLC11A1 Promoter Elements by Bioinformatic
Analysis. ................................................................................................................ 145
5.3.1.1 A Model of Regulation of SLC11A1 Expression .................................. 145
5.3.1.2 Identification of Conserved Regions within the SLC11A1 Promoter ... 147
5.3.1.3 Identification of Conserved Elements within the SLC11A1 Promoter . 150
5.3.1.4 Identification of Transcription Factor Binding Sites within the SLC11A1
Promoter ............................................................................................................ 154
5.3.1.4.1 Bioinformatic Analysis Failed to Identify Consensus Sequences for
Core Proteins Involved in the Basal Transcriptional Complex ..................... 154
5.3.1.4.2 Identification of Putative TFBS in the SLC11A1 Promoter ........... 156
5.3.1.4.3 SLC11A1 Promoter Polymorphisms and Transcription Factor
Binding .......................................................................................................... 156
5.3.1.5 Multiple Regions of the SLC11A1 Promoter Display a Propensity to
Form Z-DNA..................................................................................................... 157
5.3.1.5.1 The (GT)n Microsatellite Alleles Differ in their Z-DNA Forming
Ability ........................................................................................................... 158
5.3.1.6 In Silico Identification of Transcription Factor Binding Sites and
Promoter Activity: GeneQuest Summary ......................................................... 159
5.3.1.7 Conclusions of the Bioinformatic Analysis .......................................... 163
PART 2: Design and Construction of SLC11A1 Promoter Constructs for Functional
Analysis. ................................................................................................................ 165
5.3.2.1 Primer Site Determination and Primer Design ..................................... 165
5.3.2.1.1 Optimisation of PCR Conditions for the Amplification of SLC11A1
Promoter Regions .......................................................................................... 167
5.3.2.2 Selection of SLC11A1 Promoter Regions for Cloning and Reporter
Analyses ............................................................................................................ 168
5.3.2.2.1 Identification of SLC11A1 Promoter Regions Containing Core
Elements for the Formation of the Basal Transcriptional Complex ............. 168
5.3.2.2.2 Determination of the Effect of Variants at the (GT)n and -237C/T
Polymorphisms on SLC11A1 Expression ..................................................... 170
xvi
5.3.2.2.3 Determination of the Ability of the SLC11A1 Promoter to Mediate
Bidirectional Transcription ........................................................................... 170
5.3.2.3 Construction of the Largest SLC11A1 Promoter Plasmid: 1A-bla(M) . 171
5.3.2.3.1 In Vitro Site-Directed Mutagenesis to Generate the -237 T Variant
....................................................................................................................... 172
5.3.2.3.2 Verification of 1A-bla(M) Clones by Sequence Analysis ............. 173
5.3.2.4 Production of the Smaller SLC11A1 Promoter Plasmids ...................... 174
5.3.2.5 Production of the Control Plasmids ...................................................... 175
5.3.2.6 Identification of Novel Sequence Variants within the SLC11A1 Promoter
........................................................................................................................... 177
5.4 DISCUSSION ..................................................................................................... 180
5.4.1 In Silico Identification of Putative Elements Involved in SLC11A1
Transcription ......................................................................................................... 180
5.4.2 Mechanism of Differential SLC11A1 Expression Mediated by the Functional
Promoter Polymorphisms ...................................................................................... 182
5.4.3 Conclusion ................................................................................................... 184
CHAPTER 6 – FUNCTIONAL ANALYSIS OF THE SLC11A1 PROMOTER ......... 185
6.1 INTRODUCTION .............................................................................................. 186
6.1.1 Detection of SLC11A1 Promoter Activity using the GeneBLAzer Reporter
System ................................................................................................................... 187
6.2 MATERIALS AND METHODS ........................................................................ 190
6.2.1 Materials ....................................................................................................... 190
6.2.1.1 Cell Lines .............................................................................................. 190
6.2.2 Methods ........................................................................................................ 191
6.2.2.1 Cell Culture Techniques........................................................................ 191
6.2.2.1.1 Sterility and Containment .............................................................. 191
6.2.2.1.2 Culture and Maintenance of Human Embryonic Kidney 293T Cells
....................................................................................................................... 191
6.2.2.1.3 Culture and Maintenance of U937 Cells ........................................ 191
6.2.2.1.4 Culture and Maintenance of THP-1 Cells ...................................... 191
6.2.2.1.5 Passaging of Cell Lines .................................................................. 192
6.2.2.1.6 Determination of Cell Viability ..................................................... 193
6.2.2.1.7 Reviving Mammalian Cell Lines ................................................... 193
6.2.2.1.8 Storage of Mammalian Cell Lines ................................................. 193
xvii
6.2.2.1.9 Differentiation and Cytokine Stimulation of THP-1 Cells ............ 193
6.2.2.2 Transfection Protocols .......................................................................... 194
6.2.2.2.1 Transfection of 293T Cells using Lipofectamine 2000.................. 194
6.2.2.2.2 Transfection of THP-1 Cells with Lipofectamine LTX ................. 194
6.2.2.2.3 Transfection of THP-1 Cells Using Nucleofection ........................ 195
6.2.2.2.4 Addition of Substrate (CCF2-AM) For Reporter Analysis ............ 195
6.2.2.3 Analyses of Human Cell Lines Transfected with SLC11A1 Promoter
Constructs.......................................................................................................... 197
6.2.2.3.1 Fluorescence/Light Microscopy Analysis of Human Cell Lines
Transfected with the SLC11A1 Promoter Constructs.................................... 197
6.2.2.3.2 Confocal Microscopy Analysis of Human Cell Lines Transfected
with the SLC11A1 Promoter Constructs ....................................................... 197
6.2.2.3.3 Fluorescence Plate Reader Analysis of Human Cell Lines
Transfected with the SLC11A1 Promoter Constructs.................................... 198
6.2.2.3.4 Flow Cytometric Analysis of Human Cell Lines Transfected with the
SLC11A1 Promoter Constructs ..................................................................... 199
6.2.2.4 Staining Techniques for the Characterisation of the THP-1 Cell Line . 200
6.2.2.4.1 Morphological Assessment of THP-1 Cells................................... 200
6.2.2.4.2 Slide Preparation for Cytochemical Analyses................................ 200
6.2.2.4.3 Periodic Acid-Schiff Staining ........................................................ 201
6.2.2.4.4 Sudan Black B Staining of THP-1 Cells ........................................ 201
6.2.2.4.5 Myeloperoxidase Staining of THP-1 Cells .................................... 202
6.2.2.4.6 Combined α-Naphthyl butyrate and AS-D Chloroacetate esterase
Staining of THP-1 Cells ................................................................................ 202
6.2.2.4.7 Analysis of THP-1 Cell Morphology and Cytochemistry by Light
Microscopy.................................................................................................... 203
6.2.2.5 Techniques for Quantiation of SLC11A1 Expression ........................... 203
6.2.2.5.1 RNA extraction .............................................................................. 203
6.2.2.5.2 Synthesis of cDNA......................................................................... 203
6.2.2.5.3 PCR 6 – Quantitation of SLC11A1 Expression by Real-time PCR 204
6.3 RESULTS ........................................................................................................... 205
PART 3: Analysis of the SLC11A1 Promoter using Promoter Assays. ................ 205
6.3.1 Determination of the Promoter Activity of SLC11A1 Constructs Transfected
into 293T Cells ...................................................................................................... 205
xviii
6.3.1.1 Characterisation of the 293T Cell Line ................................................. 205
6.3.1.2 Transfection of SLC11A1 Promoter Constructs into 293T Cells .......... 207
6.3.1.2.1 Determination of Important Promoter Regions Driving SLC11A1
Transcription in 293T Cells .......................................................................... 207
6.3.1.2.2 Assessment of the Ability of the SLC11A1 Promoter to Mediate
Bidirectional Transcription ........................................................................... 209
6.3.1.2.3 The Promoter Variants Allele 2 and Allele T Drive Higher Promoter
Activity Compared to the Allele 3 Variant in 293T Cells ............................ 211
6.3.2 Determination of the Promoter Activity of SLC11A1 Constructs Transfected
into THP-1 Cells ................................................................................................... 213
6.3.2.1 Selection of a Monocytic Cell Line with SLC11A1 Expression ........... 213
6.3.2.2 Characterisation of the THP-1 Cell Line .............................................. 215
6.3.2.2.1 Morphological/Cytochemical Characterisation of THP-1 Cells .... 215
6.3.2.2.2 Quantitation of SLC11A1 Expression in THP-1 Cells ................... 218
6.3.2.3 Optimisation of THP-1 Cell Transfection with the SLC11A1 Promoter
Constructs.......................................................................................................... 219
6.3.2.3.1 Detection of SLC11A1 Promoter Activity using a Fluorescence Plate
Reader ........................................................................................................... 219
6.3.2.3.2 Flow Cytometric Analysis Enabled the Selective Detection of
Transfected THP-1 Cells ............................................................................... 221
6.3.2.3.3 Nucleofection of THP-1 Cells Resulted in Increased Cell Viability
and Transfection Efficiency as Compared to Lipofectamine LTX ............... 223
6.3.2.4 Transfection of SLC11A1 Promoter Constructs into THP-1 Cells ....... 226
6.3.2.4.1 Determination of Important Promoter Regions Driving SLC11A1
Transcription in Monocyte-Like THP-1 Cells .............................................. 226
6.3.2.4.2 The SLC11A1 Promoter Shows Evidence of Bidirectional
Transcription ................................................................................................. 230
6.3.2.4.3 Promoter Constructs Containing Allele 3 Drive Higher Promoter
Activity Compared to Allele 2 and Allele T in THP-1 Cells ........................ 232
6.3.2.5 Further Bioinformatic Analysis of Important SLC11A1 Promoter Regions
Identified by the Reporter Assays ..................................................................... 234
6.3.2.5.1 The Basal Transcriptional Complex Assembles within a 148bp
Region (-99 to +49) of the SLC11A1 Promoter ........................................... 234
xix
6.3.2.5.2 Analysis of the 170bp Region (-532 to -362) Exerting the Highest
SLC11A1 Promoter Activity ......................................................................... 236
6.3.2.5.3 Binding of a Monocyte Specific Transcription Factor within the
-
362 to -197 Region Mediates Allelic Differences in SLC11A1 Expression . 238
6.4 DISCUSSION ..................................................................................................... 240
6.4.1 Overview ...................................................................................................... 240
6.4.2 THP-1 Cells are an Appropriate Model for the Investigation of SLC11A1
Expression ............................................................................................................. 240
6.4.3 SLC11A1 Promoter Analysis ....................................................................... 241
6.4.3.1 A 148bp Region of the SLC11A1 Promoter Defines the Minimal
Promoter Region ............................................................................................... 241
6.4.3.2 Mechanism of the Formation of the Basal Transcriptional Complex ... 242
6.4.3.3 The 5’UTR and First Intron do not Function to Enhance SLC11A1
Transcription in Monocytic Cells ..................................................................... 245
6.4.3.4 Identification of SLC11A1 Promoter Regions Important in the
Recruitment of Transcription Factors ............................................................... 246
6.4.3.4.1 Transcription Factors IRF and PU.1 are Candidates for the
Transcriptional Enhancement of the -532 to -362 SLC11A1 Promoter Region
....................................................................................................................... 248
6.4.3.4 The SLC11A1 Promoter Shows Evidence of Bidirectional Transcription
........................................................................................................................... 249
6.4.4 The Influence of SLC11A1 Promoter Polymorphisms on SLC11A1 Promoter
Activity.................................................................................................................. 251
6.4.4.1 The (GT)n Variants Mediate Differential Transcription Through the
Binding of a Monocyte-Specific Transcription Factor to the -362 to -197 Region
........................................................................................................................... 251
6.4.4.2 The -237C/T Polymorphism Functions Independently of the (GT)n
Microsatellite Repeat to Modulate SLC11A1 Expression ................................. 256
6.4.5 Conclusion ................................................................................................... 257
6.5 Future Directions ................................................................................................. 261
6.5.1 Assessment of the Minimal Promoter Region to Determine the Location of
Core Elements ....................................................................................................... 261
6.5.2 Analysis of the 170bp Promoter Region Driving High Promoter Activity.. 261
xx
6.5.3 Determination of the Monocyte-Specific Transcription Factor Interacting
with Allelic Variants to Modulate Differential Levels of SLC11A1 Expression .. 262
6.5.4 Analysis of Sequence Elements Identified by the WeederH Analysis ........ 263
6.5.5 Analysis of the Mechanisms of SLC11A1 Transcription at Different Stages of
Monocyte/Macrophage Differentiation and Stimulation ...................................... 263
6.5.6 Validation of Novel Sequence Variants of the SLC11A1 Promoter Identified
During the Preparation of the Promoter Constructs .............................................. 264
CHAPTER 7 - META-ANALYSES ASSESSING THE ASSOCIATION OF SLC11A1
POLYMORPHISMS WITH THE OCCURRENCE OF AUTOIMMUNE AND
INFECTIOUS DISEASE .............................................................................................. 265
7.1 INTRODUCTION .............................................................................................. 266
7.2 METHODS ......................................................................................................... 269
7.2.1 Criteria for Study Inclusion.......................................................................... 269
7.2.2 Statistical analysis ........................................................................................ 270
7.2.2.1 Determination of the Source of Heterogeneity using Logistic Regression
Analysis ............................................................................................................. 272
7.2.3 Detection of Bias using the Funnel Plot....................................................... 273
7.2.4 Continuity Corrections for Zero Observations ............................................. 274
7.3 RESULTS ........................................................................................................... 275
7.3.1 Associations of SLC11A1 Polymorphisms with the Incidence of Autoimmune
Disease .................................................................................................................. 276
7.3.1.1 Association of the (GT)n Promoter Alleles with the Incidence of
Autoimmune/Inflammatory Disease ................................................................. 278
7.3.1.1.1 (GT)n Allele 2 is Associated with Marginal Protection Against the
Occurrence of Autoimmune Disease ............................................................ 279
7.3.1.1.2 The (GT)n Allelic Variants are Associated with the Incidence of
Sarcoidosis and Type 1 Diabetes .................................................................. 279
7.3.1.2 The -237C/T, 274C/T and 469+14G/C Polymorphisms are Associated
with the Incidence of Autoimmune Disease ..................................................... 281
7.3.1.3 Polymorphisms Within the 3’ Region of SLC11A1 are Not Associated
with the Incidence of Autoimmune Disease ..................................................... 283
7.3.1.4 Logistic Regression Analysis to Determine the Source of Heterogeneity
Identified in the Meta-Analyses ........................................................................ 283
xxi
7.3.2 Associations of SLC11A1 Polymorphisms with the Incidence of Infectious
Disease .................................................................................................................. 284
7.3.2.1 SLC11A1 (GT)n Allele 2 and Allele 3 are Associated with Susceptibility
and Resistance to Infectious Disease and Tuberculosis Alone ......................... 285
7.3.2.1.1 The Association of the (GT)n Alleles with Infectious Disease
According to Ethnicity .................................................................................. 286
7.3.2.2 The 469+14G/C, 1730G/A and 1729+55del4 Polymorphisms are
Associated with the Incidence of Infectious Disease ........................................ 287
7.3.2.2.1 Association of SLC11A1 Polymorphisms with the Incidence of
Infectious Disease According to Geographical Location/Ethnicity .............. 288
7.3.2.3 The -237C/T, 274C/T, 1485-85G/A and 1729+271del4 Polymorhisms
are not Associated with the Incidence of Infectious Disease ............................ 289
7.3.2.4 Logistic Regression Analysis to Determine the Source of Heterogeneity
Identified in the Meta-Analyses ........................................................................ 289
7.3.3 Summary ...................................................................................................... 289
7.4 DISCUSSION ..................................................................................................... 292
7.4.1 Summary ...................................................................................................... 292
7.4.2 Functional Variants within the 5’ and 3’ LD Haplotype Regions of SLC11A1
Influence Autoimmune and Infectious Disease Susceptibility ............................. 294
7.4.2.1 The (GT)n and 1730G/A Polymorphisms are Functional Candidates
Altering the Cellular Phenotype of SLC11A1 to Influence
Autoimmune/Infectious Disease Susceptibility ................................................ 297
7.4.3 (GT)n Allele 2 Exerts the Selective Pressure at the 5’ End to Influence
Infectious and Autoimmune Disease Susceptibility ............................................. 298
7.4.3.1 (GT)n Allele 2 May Influence Disease Incidence Due to a Heightened
Anti-inflammatory Immune Response Mediated Through Increased IL-10
Expression ......................................................................................................... 300
7.4.4 Future Association Studies Should Complete Haplotype Analysis of the
SLC11A1 Locus ..................................................................................................... 301
7.4.5 Conclusion ................................................................................................... 302
CHAPTER 8 - GENERAL DISCUSSION ................................................................... 305
8.1 Introduction ......................................................................................................... 306
8.2 Association of (GT)n Alleles 2 and 3 with the Incidence of
Autoimmune/Inflammatory Diseases........................................................................ 307
xxii
8.3 Genotyping of SLC11A1 Microsatellite Polymorphisms Using HRM ............... 308
8.4 Localisation and Functional Evaluation of the SLC11A1 Promoter ................... 308
8.4.1 Characterisation of the SLC11A1 Promoter ................................................. 309
8.4.1.1 A 148bp Region of the SLC11A1 Promoter Defines the Minimal
Promoter Region ............................................................................................... 309
8.4.1.2 Transcription Factors IRF-8 and PU.1 are Candidates for the
Transcriptional Enhancement of the -532 to -362 Promoter Region of SLC11A1
........................................................................................................................... 310
8.4.1.3 The SLC11A1 Promoter Mediates Bidirectional Transcription ........... 310
8.4.2 The Influence of Variants at the (GT)n and -237C/T Promoter Polymorphisms
on SLC11A1 Promoter Activity ............................................................................ 310
8.4.2.1 The -362 to -197 Region Mediates Differential SLC11A1 Expression in
the Presence of Different (GT)n Alleles in Monocytes ..................................... 310
8.4.2.2 The -237C/T Polymorphism Alters SLC11A1 Promoter Activity
Independently of the (GT)n Microsatellite Repeat ............................................ 311
8.5 Association of SLC11A1 Polymorphisms with the Occurrence of Infectious and
Autoimmune Disease ................................................................................................ 312
8.5.1 Variants within the 5’ and 3’ LD Haplotype Regions of SLC11A1 Influence
Autoimmune and Infectious Disease Susceptibility ............................................. 313
8.5.2 (GT)n Allele 2 Influences Disease Incidence Through a Heightened AntiInflammatory Immune Response Mediated by Increased IL-10 Expression ........ 314
8.6 Conclusions ......................................................................................................... 314
APPENDIX ................................................................................................................... 317
Appendix 1 ................................................................................................................ 318
Appendix 2 ................................................................................................................ 319
Appendix 3 ................................................................................................................ 320
Appendix 4 ................................................................................................................ 321
Appendix 5 ................................................................................................................ 322
Appendix 6 ................................................................................................................ 324
Appendix 7 ................................................................................................................ 326
Appendix 8 ................................................................................................................ 327
Appendix 9 ................................................................................................................ 330
REFERENCES.............................................................................................................. 331
xxiii
LIST OF FIGURES
Figure 1.1 SLC11A1 gene structure, protein conformation and membrane
5
topology of Slc11a1.
Figure 1.2 Phagosome maturation and Slc11a1 recruitment.
8
Figure 1.3 Relative SLC11A1 expression levels during macrophage
10
differentiation and activation.
Figure 1.4 SLC11A1 functions as a divalent cation symporter.
13
Figure 1.5 Pleiotropic effects mediated by SLC11A1 expression.
15
Figure 1.6 Location and genomic organisation of the SLC11A1 locus.
22
Figure 1.7 Location of all annotated sequence variants throughout the
24
SLC11A1 locus.
Figure 1.8 SLC11A1 expression is differentially modulated by the different
29
promoter (GT)n microsatellite alleles.
Figure 1.9 The influence of SLC11A1 (GT)n allele 2 and allele 3 on
31
macrophage activation.
Figure 3.1 Funnel plots from the analysis of the association of (GT)n alleles
59
with the occurrence of autoimmune disease.
Figure 4.1 Molecular mechanism of melt curve analysis.
72
Figure 4.2 Molecular species formed during melting curve analysis of a sample
73
containing heterozygous and homozygous genotypes.
Figure 4.3 Oligonucleotide design for genotyping of the SLC11A1 (GT)n
84
promoter polymorphism by HRM.
Figure 4.4 Oligonucleotide design for genotyping the SLC11A1 3’UTR
85
(CAAA)n polymorphism by HRM analysis.
Figure 4.5 Validation of the oligonucleotides designed for HRM analysis for
86
the amplification of (GT)n and (CAAA)n microsatellite repeats.
Figure 4.6 Determination of the optimal annealing temperature by gradient
88
temperature PCR.
Figure 4.7 Determination of the optimal magnesium chloride concentration
89
using a magnesium concentration gradient PCR.
Figure 4.8 Determination of optimal primer concentrations by analysis of
different combinations of forward and reverse primer concentrations.
90
xxiv
Figure 4.9 HRM curve analysis is sensitive to subtle changes in reaction
91
conditions.
Figure 4.10 HR-1 software analysis of the raw melt curves of simulated (GT)n
94
genotypes.
Figure 4.11 Analysis of the (CAAA)n melting curves using the HR-1 software.
95
Figure 4.12 Optimisation of the HR-1 ramp rate to enable sensitive
96
differentiation of genotypes.
Figure 4.13 HRM analysis of simulated SLC11A1 (GT)n and (CAAA)n
97
genotypes.
Figure 4.14 Differentiation of rare and common simulated (GT)n genotypes
98
using HRM analysis.
Figure 4.15 Real-time PCR quantification profiles of amplified plasmid alleles
100
and FTA card immobilised gDNA samples.
Figure 4.16 PCR amplification of eluted gDNA from FTA cards using
101
different volumes of TE buffer.
Figure 4.17 PCR amplification of the SLC11A1 promoter region containing the
103
(GT)n microsatellite repeat from buccal cells.
Figure 4.18 Genotyping of the SLC11A1 (CAAA)n repeat using a nested PCR
104
protocol utilising FTA card immobilised gDNA from buccal cells.
Figure 4.19 Representative image of the gDNA isolated from whole blood
105
collected by diabetic lancet followed by extraction using a commercial spin
column system.
Figure 4.20 Validation of the HRM genotyping methodology using gDNA
106
extracted from blood.
Figure 4.21 First derivative melting profiles for genotyping the SLC11A1
108
(GT)n and (CAAA)n polymorphisms using the Eppendorf ep realplex real-time
PCR instrument.
Figure 5.1 SLC11A1 promoter organisation showing the positions of the
119
SLC11A1 (GT)n and -237C/T promoter polymorphisms.
Figure 5.2 Formation of the basal transcriptional complex.
121
Figure 5.3 Core elements involved in transcription from a non-canonical
122
TATA-less promoter.
xxv
Figure 5.4 Location of previously published putative transcription factor
125
binding sites located within the SLC11A1 promoter.
Figure 5.5 Comparison of the structure of right handed B-DNA to the left
127
handed Z-DNA.
Figure 5.6 Primers used to completely sequence cloned 1A-bla(M) plasmids
140
containing the different sequence variants in both the forward and reverse
orientation.
Figure 5.7 Hypothesised mechanism for the control of SLC11A1 expression
146
based on the findings of previously published studies.
Figure 5.8 ClustalW alignment of the nucleotide sequences of the promoter
148
regions of 8 SLC11A1 homologs.
Figure 5.9 The SLC11A1 promoter showing the location of conserved regions
151
identified from the WeederH analysis and clustalW alignment.
Figure 5.10 Summary of the most significant findings from the clustalW
153
alignment and WeederH analysis of the SLC11A1 promoter.
Figure 5.11 TFBS search of the SLC11A1 promoter centered on the TSS using
155
the program TESS.
Figure 5.12 Z-Hunt analysis of the SLC11A1 (GT)n microsatellite alleles.
159
Figure 5.13 Compilation of the findings of the bioinformatic analyses of the
160
SLC11A1 promoter and 5’UTR and comparison with previously published
theoretical and experimentally-determined promoter elements.
Figure 5.14 Compilation of findings of the bioinformatic analysis of the
164
SLC11A1 promoter.
Figure 5.15 Location of designed primers for the amplification of different
166
promoter regions for subsequent production of SLC11A1 promoter plasmids.
Figure 5.16 Designed SLC11A1 promoter regions for cloning into reporter
169
constructs to functionally test the different elements identified
bioinformatically.
Figure 5.17 Production of the SLC11A1 expression plasmid 1A-bla(M).
172
Figure 5.18 In vitro site directed mutagenesis for the production of the -237 T
173
variant in cis with (GT)n allele 3.
Figure 5.19 Production of the negative control emp-bla(M) plasmid.
176
xxvi
Figure 5.20 Sequencing electrophoregrams of novel SLC11A1 promoter
178
sequence variants.
Figure 6.1 GeneBLAzer detection of promoter activity.
188
Figure 6.2 Microscopic analysis of 293T cells.
206
Figure 6.3 Promoter activity of SLC11A1 constructs, containing different
208
lengths of the SLC11A1 promoter, after transfection into 293T cells.
Figure 6.4 Assessment of the ability of the SLC11A1 promoter region to
210
mediate bidirectional transcription in non-monocytic (293T) cells.
Figure 6.5 Effect of the SLC11A1 plasmid variants, allele 2, allele 3 and allele
212
T, on SLC11A1 promoter activity in 293T cells.
Figure 6.6 Analysis of THP-1 and U937 cell lines for suitability for use with
214
the Geneblazer technology.
Figure 6.7 Analysis of THP-1 cell morphology by May-Grunwald Giemsa
215
staining.
Figure 6.8 Cytochemical analyses of THP-1 cells.
216
Figure 6.9 Combined α-naphthyl butyrate and AS-D chloroacetate esterase
217
stain.
Figure 6.10 Lipofectamine LTX transfected THP-1 cells showing low cell
220
viability and low transfection efficiency.
Figure 6.11 Validation of flow cytometric analyses to quantitate promoter
222
activity driven by the different SLC11A1 promoter constructs using 293T cells.
Figure 6.12 Nucleofection of THP-1 cells increases cell viability and
224
transfection efficiency.
Figure 6.13 Gating protocol for determining promoter activity after
225
nucleofection of THP-1 cells with SLC11A1 promoter constructs.
Figure 6.14 Promoter activity of SLC11A1 constructs, containing different
227
lengths of the SLC11A1 promoter, after transfection into THP-1 cells.
Figure 6.15 Comparison of promoter activity of SLC11A1 constructs,
229
containing different lengths of the SLC11A1 promoter, in 293T cells and THP-1
cells.
Figure 6.16 Assessment of the ability of the SLC11A1 promoter region to
mediate bidirectional transcription.
231
xxvii
Figure 6.17 Analysis of the effect of the variants at the SLC11A1 promoter
233
(GT)n and -237C/T polymorphisms on promoter activity in THP-1 cells.
Figure 6.18 Identified SLC11A1 minimal promoter region and putative
235
mechanism of SLC11A1 expression.
Figure 6.19 Location of putative transcription factor binding sites within the
237
-520 to -340 region of the SLC11A1 promoter.
Figure 6.20 Location of putative monocyte-specific TFBS within the -360 to
239
-180 region of the SLC11A1 promoter.
Figure 6.21 SLC11A1 transcription appears to be initiated by a mechanism
242
different to that observed from canonical promoters.
Figure 6.22 Transfection of the promoter constructs into THP-1 cells revealed
247
that a 581bp region is involved in expression of SLC11A1 in monocytic cells.
Figure 6.23 Comparison of the promoter activity of the SLC11A1 promoter
253
constructs, containing the common allelic variants, in non-monocytic and
monocyte-like cells.
Figure 6.24 Monocytic-specific factor(s), binding within the -362 to -197
254
region, were identified as the mechanism controlling differences in promoter
activity in the presence of allelic variants at the (GT)n repeat.
Figure 6.25 Summary of the putative mechanisms of SLC11A1 expression and
258
location of experimentally determined transcription factors.
Figure 7.1 Location of SLC11A1 polymorphisms analysed in the meta-
267
analyses.
Figure 7.2 Flow chart outlining the methodology used to determine pooled OR
271
estimates for the association of SLC11A1 polymorphisms with the occurrence
of infectious or autoimmune disease.
Figure 7.3 Funnel plots of the meta-analyses assessing the association of the
278
(GT)n alleles with the incidence of autoimmune/inflammatory disease.
Figure 7.4 Funnel plots of the meta-analyses of the -237C/T, 274C/T and
282
469+14G/C polymorphisms with the occurrence of autoimmune disease.
Figure 7.5 Funnel plots of the meta-analyses of allelic variants at the (GT)n
repeat with the incidence of infectious disease.
286
xxviii
Figure 7.6 Summary of the results from the meta-analyses (pooled OR
291
estimates and 95% CI interval) assessing the association of the SLC11A1
polymorphisms with the incidence of autoimmune disease, infectious disease
and tuberculosis alone.
Figure 7.7 Linkage disequilibrium at the SLC11A1 locus and location of
polymorphisms associated with the incidence of autoimmune and infectious
disease.
295
xxix
LIST OF TABLES
Table 1.1 Homology Among Selected Nramp Family Members.
6
Table 1.2 The Location of Analysed Polymorphisms within SLC11A1.
23
Table 1.3 (GT)n Repeat Polymorphisms of the SLC11A1 Promoter.
27
Table 1.4 Studies Assessing the Association of the SLC11A1 (GT)n Promoter
33
Polymorphism with the Incidence of Infectious Disease.
Table 1.5 Studies Assessing the Association of the SLC11A1 (GT)n Promoter
35
Polymorphism with the Incidence of Autoimmune Disease.
Table 3.1 Details of Individual Association Studies of SLC11A1 (GT)n Promoter
55
Polymorphisms and Autoimmune/Inflammatory Disease.
Table 3.2 SLC11A1 Allele 3 Frequencies (Case Versus Controls) of all the
57
Individual Studies used in the Meta-Analysis.
Table 3.3 SLC11A1 Allele 2 Frequencies (Case Versus Controls) of all the
58
Individual Studies used in the Meta-Analysis.
Table 4.1 Oligonucleotides used for Genotyping of SLC11A1 (GT)n and
75
(CAAA)n Polymorphisms by HRM Analysis.
Table 4.2 Optimisation Steps for the Production of the SLC11A1 HRM Assays.
87
Table 4.3 Differentiation of Simulated Common SLC11A1 (GT)n Promoter
107
Genotypes using the Eppendorf Mastercycler ep realplex.
Table 5.1 Oligonucleotides Designed for SLC11A1 Promoter Analyses.
131
Table 5.2 Method of SLC11A1 Promoter Plasmid Verification Prior to
142
Functional Analysis.
Table 5.3 SLC11A1 Homologs Included in the ClustalW Analysis.
147
Table 5.4 Identified SLC11A1 Promoter Sequences with the Potential to Form Z- 158
DNA.
Table 5.5 Optimised PCR Conditions for the Amplification of the Different
167
SLC11A1 Promoter Amplicons for Subsequent Cloning.
Table 5.6 Description of Variants of the Manufactured SLC11A1 Reporter
175
Constructs.
Table 5.7 SLC11A1 Promoter Haplotypes at the G(T)n, Promoter (GT)n and 237C/T Polymorphic Sites.
179
xxx
Table 7.1 Summary of Identified Publications, Datasets Analysed and Number
275
of Cases and Controls.
Table 7.2 Meta-analyses of the Association of SLC11A1 Polymorphisms with
277
the Incidence of Autoimmune/Inflammatory Disease.
Table 7.3 Pooled OR Estimates of the Association of (GT)n Alleles 3 and 2 with
280
Disease Occurrence and Ethnicity.
Table 7.4 Meta-analyses of the Association of SLC11A1 Polymorphisms with
284
the Incidence of Infectious Disease.
Table 7.5 Analysis of the Association of (GT)n Allele 2 and 3 with the Incidence
287
of Infectious Disease According to Ethnicity.
Table 7.6 Analysis of the association of the 469+14G/C, 1730G/A and
288
1729+55del4 polymorphisms with the incidence of infectious disease based on
ethnicity.
Table 7.7 Comparison of Pooled OR Estimates between the Current and
Previously Completed Meta-analyses with the Incidence of Autoimmune Disease
and Tuberculosis.
293
xxxi
LIST OF APPENDICES
Appendix 1 ClustalW alignment of the promoter regions of 8 SLC11A1
318
homologs showing highly conserved regions.
Appendix 2 Allele frequency determination from carrier frequency.
319
Appendix 3 Publications identified for inclusion in the meta-analysis of
320
SLC11A1 polymorphisms with the incidence of autoimmune disease.
Appendix 4 Publications identified for inclusion in the meta-analysis of
321
SLC11A1 polymorphisms with the incidence of infectious disease.
Appendix 5
Appendix 5a SLC11A1 allele 3 frequencies (case versus controls) of all
322
the individual association studies included in the meta-analysis.
Appendix 5b SLC11A1 allele 2 frequencies (case versus controls) of all
323
the individual association studies included in the meta-analysis.
Appendix 6
Appendix 6a SLC11A1 frequencies (case versus controls) of all the
324
individual association studies included in the meta-analyses.
Appendix 6b SLC11A1 frequencies (case versus controls) of all the
325
individual association studies included in the meta-analyses.
Appendix 7
Appendix 7a SLC11A1 allele 3 frequencies (case versus controls) of all
326
the individual association studies included in the meta-analysis.
Appendix 7b SLC11A1 allele 2 frequencies (case versus controls) of all
326
the individual studies association included in the meta-analysis.
Appendix 8
Appendix 8a SLC11A1 469+14G/C frequencies (case versus controls) of
327
all the individual association studies included in the meta-analysis.
Appendix 8b SLC11A1 1730G/A frequencies (case versus controls) of all 328
the individual association studies included in the meta-analysis.
Appendix 8c SLC11A1 1729+55del4 frequencies (case versus controls)
329
of all the individual association studies included in the meta-analysis.
Appendix 9 SLC11A1 polymorphisms frequencies (case versus controls) of all
the individual association studies included in the meta-analysis of infectious
disease.
330
xxxii
LIST OF ABBREVIATIONS
γ-IRE
ALL
AML
AMML
AP1
ARNT
bp
BRE
BSA
CCF2-AM
C/EBP
CI
Ct
DCE
DMEM
DNA
DPE
EDTA
EMSA
FBS
GM-CSF
h
HBSS
HIF-1
HIV
Idd
IDDM
IECS
IFN-γ
IL
iNOS
Inr
IRF
ISRE
kb
KLF
l
Lamp1
LB
LD
LPS
MHC
min
MTE
NF-IL6
NF-κB
NO
interferon-γ response element
acute lymphocytic leukaemia
acute myeloid leukaemia
acute myelomonocytic leukaemia
Activator protein 1
aryl hydrocarbon receptor nuclear translocator
base pairs
TFIIB-recognition element
bovine serum albumin
coumarin cephalosporin fluorescein
CCAAT/enhancer binding protein
confidence interval
cycle threshold
downstream core element
Dulbecco’s modified eagle medium
deoxyribonucleic acid
downstream promoter element
ethylenediaminetetraacetic acid
electrophoretic mobility shift assays
fetal bovine serum
granulocyte macrophage colony-stimulating factor
hours
Hanks buffered salt solution
Hypoxia inducible factor 1
Human immunodeficiency virus
insulin dependant diabetes (murine)
insulin dependant diabetes mellitus (human)
IRF-Ets composite sequence
interferon-gamma
interleukin
inducible nitric oxide synthase
Initiator element
interferon regulatory factors
IFN-stimulated response element
kilobase
kruppel-like factor
litre
lysosome-associated membrane protein 1
Luria Bertani
linkage disequilibrium
lipopolysaccharide
major histocompatibility complex
minutes
motif ten element
nuclear factor IL-6
nuclear factor kappa-light-chain-enhancer of activated B cells
nitric oxide
xxxiii
Nramp
NTC
Oct-1
OR
PAS
PBS
PCR
PMA
PMN
pol II
PU.1
RES
RNA
RNase
RPMI
RT
s
SBB
SLC11A1
SLC11A1
Slc11a1
Slc11a1
SLC11A2
SLC11A2
SNP
Sp1
SPI-1
TAF
TBP
TESS
TFIID
TFBS
Th1
Th2
Tm
TNF-α
TSS1
TSS2
UV
XCPE1
YY1
ZBP-1
natural resistance-associated macrophage protein
no template control
octamer binding protein 1
odds ratio
periodic acid-schiff
phosphate buffered saline
polymerase chain reaction
phorbol myristate acetate
polymorphonuclear
RNA polymerase II
protein encoded by SPI-1 gene
reticuloendothelial system
ribonucleic acid
ribonuclease
Roswell Park Memorial Institute
room temperature
seconds
Sudan black B
Solute carrier family 11A member 1 (Human protein)
Solute carrier family 11A member 1 (Human gene)
Solute carrier family 11A member 1 (non-human protein)
Solute carrier family 11A member 1 (non-human gene)
Solute carrier family 11A member 2 (Human protein)
Solute carrier family 11A member 2 (Human gene)
single nucleotide polymorphism
Specificity protein 1
spleen focus by forming virus proviral integration 1
TBP associated factor
TATA binding protein
Transcription Element Search Software
transcription factor II D
transcription factor binding site
T helper 1
T helper 2
melting temperature
tumour necrosis factor-alpha
transcription start site 1
transcription start site 2
ultraviolet
X core promoter element 1
Ying-Yang 1
Z-DNA binding protein 1
1
CHAPTER 1 – INTRODUCTION
2
1.1 STRUCTURE AND FUNCTION OF SLC11A1
1.1.1 Historical Background
SLC11A1 was first discovered by three independent research groups after observations
of animal infection models. The first group designated the locus Lsh after the
observation that inbred strains of mice exhibited differential growth of Leishmania
donovani within macrophages (Bradley, 1977). A similar observation was made
following infection of inbred mice with the macrophage trophic pathogen Salmonella
typhimurium, where the resistance locus was named Ity (Plant and Glynn, 1974). The
third group found that strains of inbred mice separated into susceptible and resistant
groups when infected with Mycobacterium bovis (another macrophage trophic
organism) and the disease locus was named Bcg (Skamene et al., 1982). It was
hypothesised that susceptibility, or resistance, to the three infectious organisms was
controlled by a single locus, which encoded a protein that modulated macrophage
function (Blackwell, 1989). It was further shown that the gene had restricted expression
to reticuloendothelial organs; namely the spleen, liver and blood. Consequently, the
gene was named natural resistance-associated macrophage protein 1 or Nramp1 (Malo
et al., 1994, Vidal et al., 1993).
Using positional cloning to determine the location of the Bcg/Lsh/Ity locus on mouse
Chromosome 1, it was discovered that susceptibility to macrophage trophic pathogens
was the result of a point mutation in the coding region of Nramp1 (Vidal et al., 1993).
This mutation, leading to a single non-conservative amino acid substitution of a glycine
for an aspartic acid residue at position 169 (G169D) in trans-membrane domain 4,
produces a non-functional protein (Vidal et al., 1996). Sequence analysis of Nramp1
from 27 inbred mouse strains found concordance between the presence of the wild type
G or mutant D amino acid at position 169 and resistance or susceptibility to infection,
respectively (Malo et al., 1994).
Verification that the susceptibility to infection associated with the Bcg/Lsh/Ity locus was
due to the G169D mutation of Nramp1 was provided by two in vivo studies. In the first,
Vidal et al. (1995) took the normally resistant 129sv mouse strain and created a
homozygous Nramp1 knockout (Nramp1-/-), which, when infected with Mycobacterium,
3
Leishmania or Salmonella, exhibited the same pathogenesis as that observed in mice
carrying the G169D mutation. In the second study, Govoni et al. (1996) transfected
embryonal mouse cells, homozygous for the G169D mutation (Nramp1-/-), with the
resistant Nramp1 allele, along with a small region upstream and downstream of the
gene, and produced a mouse strain in which macrophages were able to control
infections comparable to the resistant (Nramp+/+) mouse strains. Thus, the candidacy of
Nramp1 as the locus controlling resistance or susceptibility to these macrophage-trophic
pathogens was established.
1.1.1.1 Discovery of the Human SLC11A1 Gene
The region of mouse Chromosome 1 in which Nramp1 is located is syntenic with
human Chromosome 2 (Schurr et al., 1990). The human NRAMP1 gene has been
isolated and sequenced (Cellier et al., 1994, Kishi, 1994), however, in humans, analysis
of the NRAMP1 sequence has failed to identify any mutations that produce a nonfunctional protein, similar to the G169D mutation found in mice (Vidal et al., 1996).
The human homologue, NRAMP1, is now known as Solute Carrier Family 11A
Member 1 (SLC11A1) due to a standardised naming system used to describe a range of
different transporters. The Solute Carrier Family 11 includes proteins that are involved
in the transport of divalent cations, of which there are two members, SLC11A1 and
SLC11A2. Solute Carrier Family 11A Member 2 (formerly NRAMP2) was discovered
due to the high degree of sequence homology with SLC11A1. The SLC11A2 protein is
ubiquitously expressed with localised expression to the plasma membrane of cells,
where it functions to transport iron and other divalent cations (Mackenzie and Hediger,
2004). In mouse models, Slc11a2 has been shown to play a role in the transportation of
dietary iron at the apical membrane from enterocytes lining the duodenal lumen and is
also expressed in erythroid precursors, where it transports iron out of transferrin cycle
endosomes. Substitution of a glycine to arginine at amino acid position 185 (G185R), in
murine and rat models, results in a loss of Slc11a2 function, resulting in the
development of microcytic anaemia, which is attributable to inefficient dietary iron
uptake (Canonne-Hergaux et al., 2000, Canonne-Hergaux et al., 2001) and an inability
to retain/utilise iron in erythroid precursors (Garrick et al., 1999, Gruenheid et al.,
1999).
4
1.1.2 Structure of SLC11A1
The SLC11A1 gene, located on chromosome 2q35, is approximately 14kb in length and
contains 15 exons (Figure 1.1A) (Cellier et al., 1994). The gene encodes a 550 amino
acid protein containing 12 transmembrane domains, two N-linked glycosylation sites
and a series of phosphorylation sites, resulting in a protein with a molecular weight
between 90 and 100 kDa (53kDa unglycosylated) (Vidal et al., 1996). The protein has a
serine/proline rich Src Homology 3 (SH3) binding domain, located proximal to the
amino terminus before the first transmembrane domain, which may interact with
cytoskeletal proteins and/or play a role in signal transduction (Figure 1.1B) (Barton et
al., 1994, Blackwell, 1996). The G169D mutation identified in murine models, which
results in a loss of Slc11a1 function, is located in the fourth transmembrane domain of
Slc11a1 (Figure 1.1B).
SLC11A1 is part of a highly conserved group of ion transporters, known as the Nramp
family, which are found in both eukaryotes and prokaryotes (Table 1.1). Proteins within
this family are characterised by the presence of 10 trans-membrane domains, a series of
highly conserved charged residues in thermodynamically unfavorable positions and the
presence of a 20 amino acid consensus sequence motif (known as the ‘binding proteindependent transport system inner membrane component signature’) located between
trans-membrane domains 8 and 9 (Figure 1.1B) (Gruenheid et al., 1995). There is a high
level of amino acid sequence homology among Nramp family members and all
members of the Nramp family play a role in the transport of divalent cations (Table
1.1). This sequence and functional conservation among evolutionarily diverse
organisms suggests an important physiological role for the Nramp group of proteins.
5
A
0
1
1
2
2
3
3
4 4a
4
5
5 6 78
6
7
8
9
9
10 11
10
11
12
12
13 14
13
14kb
15
B
Figure 1.1 SLC11A1 gene structure, protein conformation and membrane topology of
Slc11a1. (A) The SLC11A1 gene contains 15 exons and is approximately 14kb long. (B)
Slc11a1 shares 93% amino acid sequence homology with human SLC11A1. The 12
transmembrane domains, the two N-linked glycosyl chains attached to the
transmembrane loop between domains 7 and 8, and the 20 amino acid transport motif
(residues in bold) are shown. The G169D mutation is indicated by the dark green
residue in trans-membrane domain 4 (Gruenheid and Gros, 2000).
Slc11a1 (Nramp1)
Slc11a2 (Nramp2)
SLC11A1
SLC11A2
Nramp1
Nramp1
cdy/Nramp2
malvolio
Smf1
Smf2
Smf3
Mramp
MntH
Class I, Class II
M.musculus
H.Sapien
C.familiaris
G.gallus
D.rerio
D.melanogaster
S.cerevisiae
C.elegens
Mycobacterium spp
Gram -ve bacteria
Plants
40-50%
40-45%
40%
68%
42%
43%
79%
73%
83%
87%
93%
79%
100%
78%
Homology
1
2+
2+
2
2+
2+
2
2+
2+
2+
2+
2+
2+
2+
2+
2+
2+
2+
2+
2+
Mn , Fe , Zn , Cd
2+
Mn , Fe , Zn , Cd
2+
2+
Mn , Fe , Zn , Cu
NT
Mn , Co , Cu , Cd
2+
2+
2+
2+
Mn , Co , Cu , Cd
2+
Fe , Mn
2+
Fe
2+
NT
NT
NT
2+
2+
2+
2+
2+
2+
2+
Fe , Mn , Zn , Co , Cd , Ni , Pb
3
Mn , Fe , Zn , Co , Mg
2+
2+
2+
2+
2+
2+
2+
Fe , Mn , Zn , Co , Cd , Ni , Pb
2+
Substrate(s)
Percentages are based on amino acid sequence comparison with mouse Slc11a1
Substrate in bold is preferred substrate for transport
3
NT - Not tested
1
Protein
Organism
Table 1.1 Homology Among Selected Nramp Family Members
6
(Curie et al., 2000)
(Forbes and Gros, 2001)
(Forbes and Gros, 2001)
(Gruenheid et al., 1997)
(Gruenheid et al., 1997)
(Blackwell, 1996)
(Donovan et al., 2002)
(Hu et al., 1996)
(Altet et al., 2002)
(Cellier et al., 1994)
(Vidal et al., 1993)
(Gruenheid and Gros, 2000)
Reference
6
7
1.1.3 Tissue and Cellular Expression of SLC11A1
In humans, expression of SLC11A1 is restricted to the reticuloendothelial organs, with
the highest level of expression in the blood, lungs and spleen (Cellier et al., 1994,
Nishimura and Naito, 2008). The restricted expression of other SLC11A1 homolog’s to
the reticuloendothelial system (RES) is also observed in murine (Cellier et al., 1994),
bovine (Feng et al., 1996), ovine (Bussmann et al., 1998), and gallus species. However,
in gallus a high level of expression also occurs in the thymus (Hu et al., 1996).
The cellular expression of SLC11A1 is restricted to phagocytic cells. However, there
appears to be species specific differences in the cellular expression of SLC11A1
between mice and humans. In mice, Slc11a1 expression has been identified in the
monocyte/macrophage lineage (Cellier et al., 1994) and in dendritic cells (DC) (Stober
et al., 2007). In humans SLC11A1 expression has been localised to
monocytes/macrophages (Vidal et al., 1996), polymorphonuclear (PMN) leukocytes
(Canonne-Hergaux et al., 2002, Cellier et al., 1994) and DCs (Le Naour et al., 2001,
Lehtonen et al., 2007). Putatively, expression of SLC11A1 has also been identified in
peripheral blood lymphocytes, however, this has only been reported in a single study
(Kishi and Nobumoto, 1995).
1.1.3.1 SLC11A1 is Recruited to the Phagosomal Membrane in
Macrophages/Monocytes
Studies of resting macrophages and DCs have shown that Slc11a1 colocalises with
lysosome-associated membrane protein 1 (Lamp1) (Gruenheid et al., 1997, Stober et al.,
2007) and cathepsin L (Searle et al., 1998), both markers for the late endosomal and
early lysosomal compartment of the trans-golgi network. Activation of macrophages,
using inert spherical particles or pathogens (Leishmania donovani and Mycobacterium
avium), results in their uptake into a plasma membrane derived phagosome. This
phagosome is not bacteriocidal and requires a complex series of fusions with endosomes
and lysosomes that possess the various bacteriocidal properties (Figure 1.2)
(Niedergang and Chavrier, 2004).
8
Pathogen
(1)
Phagocytosis
Slc11a2
(2)
(3)
Early endosomes
H+ATPase
Phagosome
Slc11a1
Late endosomes
Cathepsin L
(4)
Lamp1
Early lysosomes
Phagolysosome
Lysosomes
(5)
Figure 1.2 Phagosome maturation and Slc11a1 recruitment. When a pathogen is
phagocytosed (1) it enters a plasma membrane derived phagosome (2). A complex
series of fusions with endosomes and lysosomes then occurs. Early endosomes,
containing H+ ATPases and Slc11a2, are first recruited to the phagosomal membrane
(3). Late endosome/early lysosome vesicles, where Slc11a1 is localised, as well as the
markers Lamp1 and cathepsin L, join the early phagolysosomal membrane (4).
Recruitment of endosomes and lysosomes containing bacteriocidal properties results in
the destruction of the pathogen (5).
During the course of maturation, phagosomes migrate along microtubules from the
periphery to a perinuclear location. The early endosomes are the first to fuse with the
phagosome, introducing H+ ATPases that transport hydrogen ions into the phagosome,
thereby creating an acidic environment (Niedergang and Chavrier, 2004). SLC11A2 is
also localised to the early endosomes where, after fusion with the phagosomal
membrane, it transports a range of divalent cations out of the phagosome down a proton
gradient (Gruenheid et al., 1999).
9
Next, the late endosomes and early lysosomes, where Slc11a1 (along with Lamp1 and
cathepsin L) is localised, fuse with the phagolysosomal membrane and Slc11a1
becomes concentrated around the phagosomal membrane where it is in close proximity
to phagocytosed pathogens (Gruenheid et al., 1997, Searle et al., 1998), and
phagosomal maturation is promoted (de Chastellier et al., 1993, Frehel et al., 2002,
Hackam et al., 1998) (Figure 1.2). Thus, Slc11a1 plays an important role in cells that
possess phagocytic ability.
1.1.3.2 SLC11A1 Expression and Monocyte/Macrophage Development
SLC11A1 has restricted localisation to late endosomes/lysosomes of phagocytic cells
where it is rapidly recruited to the phagosomal membrane after pathogen uptake.
SLC11A1 expression varies according to the developmental stage of
monocytes/macrophages (Figure 1.3). Gene expression profiling of bone marrow shows
no (to extremely low) levels of SLC11A1 expression (Nishimura and Naito, 2008),
suggesting that monocytic precursors lack SLC11A1 expression. As monocytes
differentiate, SLC11A1 expression increases. Realtime-PCR (RT-PCR) studies using
cultured cell lines, which represent different stages of monocytic development, showed
that the most immature monocytic cell lines (KG1 and HL-60) had no to low SLC11A1
expression. The highest expression was observed in the more differentiated monocytic
cell lines (U937 and THP-1 cells) (Cellier et al., 1994). Furthermore, when monocytes
migrate from the peripheral blood into tissues, SLC11A1 expression increases consistent
with monocyte to macrophage differentiation, which follows tissue residency (Cellier et
al., 1997).
SLC11A1 expression is further modulated by the activation status of macrophages.
Activation of resting macrophages can occur in two ways. Firstly, classical activation of
resting macrophages occurs in response to interferon (IFN)-γ and lipopolysaccharide
(LPS), resulting in an M1 pro-inflammatory macrophage phenotype. Classically
activated M1 macrophages have enhanced phagocytic ability, increased antigen
presentation by major histocompatibility complex (MHC) class II molecules and the
production of a range of cytokines, resulting in a Th1 mediated immune response
(Gordon, 2003). During classical macrophage activation, SLC11A1 expression is
upregulated (Searle and Blackwell, 1999, Zaahl et al., 2004). Secondly, alternative
10
activation of macrophages occurs through exposure to the cytokines, interleukin 4 (IL4) and IL-13, to produce an anti-inflammatory M2 macrophage phenotype and a
subsequent Th2 mediated immune response. This results in the down regulation of Th1
mediated macrophage function and the secretion of molecules associated with wound
healing and resolution of inflammation (Gordon, 2003, Ma et al., 2003). The expression
of SLC11A1 in alternatively activated macrophages is yet to be elucidated, however,
due to the pro-inflammatory effects of SLC11A1 (Section 1.1.5), it would be expected
that alternative activation of macrophages would result in decreased SLC11A1
expression.
Figure 1.3 Relative SLC11A1 expression levels during macrophage differentiation and
activation. The red and blue lines indicate the relative level of SLC11A1 expression in
the macrophage lineage and dendritic cells, respectively. The dotted lines designate the
different stages of maturation, while the background colours represent the different
tissues in which the cells are located.
Microarray analysis of monocyte differentiated mature DCs (stimulated with
granulocyte macrophage colony stimulating factor (GM-CSF), tumor necrosis factor
(TNF)-α and IL-4) identified a two to seven fold decrease in SLC11A1 expression in
11
DCs as compared to monocytes/macrophages (Le Naour et al., 2001, Lehtonen et al.,
2007). The lower expression of SLC11A1 in mature DCs is likely attributable to their
reduced endocytic/phagocytic ability as compared to the immature phenotype.
Due to the restricted localisation of SLC11A1 to endosomes/phagosomes and the role of
SLC11A1 in pathogen clearance, SLC11A1 expression occurs when monocytes gain
phagocytic or endocytic capabilities. Likewise, increasing SLC11A1 expression appears
to correlate with increased phagocytic ability, which is correlated with
monocyte/macrophage differentiation and activation.
1.1.3.3 SLC11A1 Expression in PMN Leukocytes
From the analysis of peripheral blood, Cellier et al. (1997) identified that the highest
level of SLC11A1 expression was found in PMN leukocytes, followed by monocytes.
Colocalisation studies have shown that SLC11A1 localised to gelatinase positive
tertiary granules in PMN leukocytes, similar to its localisation pattern observed in
macrophages (Canonne-Hergaux et al., 2002).
1.1.3.4 Expression of SLC11A1 in Other Tissues
In mice, Slc11a1 expression has also been found in neurons (Evans et al., 2001).
Expression profiling of all SLC family members in humans has failed to find expression
of SLC11A1 in the brain, however, low expression levels were found in the spinal cord
(Nishimura and Naito, 2008). This is consistent with findings presented in BioGPS that
indicate a low level of expression in neurons associated with the spinal column (dorsal
root ganglion, atrioventricular node and superior cervical ganglion) (Wu et al., 2009).
The role of SLC11A1 in neuronal activity is yet to be elucidated, however, it is thought
that SLC11A1 may function in the stress response (Blackwell, 2001, Evans et al.,
2001). Expression of SLC11A1 has also been found in endocrine tissues, including the
anterior pituitary, adrenal medulla and pancreatic islets of Langerhans (White et al.,
2004). However, the expression of SLC11A1 in these endocrine tissues may be due to
the presence of resident phagocytic cells rather than expression by the local organ
tissue. In summary, the majority of evidence indicates that SLC11A1 is principally
expressed in phagocytic cells, namely macrophages and PMN leukocytes.
12
1.1.4 Function of SLC11A1
SLC11A1 functions as a divalent cation symporter with murine studies showing that
Slc11a1 can mediate transportation of Fe2+, Mn2+, Zn2+, Mg2+ and Co2+ ions (Table 1.1)
(Forbes and Gros, 2003, Goswami et al., 2001).When recruited to the phagosomal
membrane, SLC11A1 transports ions out of the phagosome along the proton gradient
(Forbes and Gros, 2001, Frehel et al., 2002, Jabado et al., 2000). SLC11A1 appears to
have multiple functions, playing a role in both the resolution of infection and
erythrophagocytosis (Sections 1.1.4.1 and 1.1.4.2). However, both activities are
dependent upon, in part, transportation of divalent cations.
1.1.4.1 SLC11A1 Functions as a Symporter to Transport Cations Out
of the Phagosome
SLC11A1 has been shown to function as a pH dependent cation symporter, removing
ions from the phagosome into the cytosol in the direction of the proton gradient (Figure
1.4). This divalent cation transport is in direct competition with the pathogen’s
transporters (also members of the Nramp family displaying high homology with
SLC11A1) (Table 1.1), where they play an essential role in the survival of the pathogen
(Figure 1.4). Divalent cations are rate limiting for the metabolic activity of bacteria, for
example, iron is an important co-factor for many enzymes and manganese is essential
for the activity of the free radical scavenging enzyme, superoxide dismutase. Transport
of ions out of the phagosome would limit the availability of these ions, thereby
preventing the growth and replication of intraphagosomal pathogens, resulting in a
bacteriostatic effect. Ion depletion might also enhance the bacteriocidal activity of
macrophages by making the pathogen more susceptible to killing by oxygen radicals
(McDermid and Prentice, 2006).
13
Figure 1.4 SLC11A1 functions as a divalent cation symporter. Pathogen phagocytosis
results in the rapid recruitment of SLC11A1 to the phagosomal membrane where it
transports a range of divalent cations out of the phagosome down the proton gradient.
This transport of divalent cations is in direct competition with pathogen divalent cation
transporters (Nramp), where sequestration of the cations is required for the normal
metabolic activity of the pathogen.
1.1.4.2 Role of SLC11A1 in Resting Macrophages
Specialised macrophages, within the reticuloendothelial organs, phagocytose senescent
erythrocytes, thereby facilitating their removal from the circulation
(erythrophagocytosis) at a rate of ~ 2×10⁶ cells/s into plasma membrane derived
phagosomes. The breakdown of haemoglobin from these senescent erythrocytes
represents the greatest daily turnover of iron in the body, recycling approximately 25mg
of iron per day (Koay and Walmsley, 1996).
14
SLC11A1 may play a role in erythrophagocytosis by transporting ions out of the
phagosome of macrophages. It has been suggested that SLC11A1, when localised to the
phagosomal membrane, transports iron into the cytosol, thereby facilitating the export
of iron from the cell (Atkinson and Barton, 1999, Biggs et al., 2001, Knutson and
Wessling-Resnick, 2003, Knutson et al., 2003, Soe-Lin et al., 2009, Soe-Lin et al.,
2010). A study using COS-1 cells expressing wild type Slc11a1 found a 40% cellular
reduction in iron levels compared to Slc11a1 null cells suggesting that SLC11A1 plays
a role in modulating total cellular iron levels (Atkinson and Barton, 1998, Barton et al.,
1999).
The hypothesis that SLC11A1 plays a role in erythrophagocytosis has been
strengthened by a recent study showing that wild type RAW264.7 Slc11a1+/+
macrophages (RAW+) are more efficient at recycling iron derived from haemoglobin
than RAW264.7 Slc11a1-/- macrophages (RAW-). The study found that upon uptake of
hemin or opsonised erythrocytes, Slc11a1 expression was significantly increased (SoeLin et al., 2008), which is consistent with previous findings of a two-fold increase in
Slc11a1 mRNA after erythrophagocytosis (Knutson et al., 2003). RAW+ macrophages
also had a significant increase in the labile iron pool (“iron in transport”), which
constitutes the loosely bound cytosolic iron that is redox active and chelator sensitive, as
compared with RAW- cells, suggesting that the increased removal of iron from the
phagosome is due to the activity of Slc11a1 (Soe-Lin et al., 2008). Furthermore,
increased Slc11a1 expression was observed upon exposure of RAW+ cells to
erythropoietin (EPO) (Soe-Lin et al., 2008). The mechanism through which EPO
modulates Slc11a1 expression is yet to be elucidated.
15
1.1.5 Pleiotropic Effects of SLC11A1
In classically activated macrophages, membrane fusion between SLC11A1 positive
lysosomes and phagosomes, and consequent transport of divalent cations out of the
phagosome results in a range of pleiotropic effects, which initiate and perpetuate a
immune response that resolves infection (Figure 1.5). The studies used to define these
pleiotropic effects have been completed using murine models. Mice, which lack
functional Slc11a1, are susceptible to a range of macrophage-tropic pathogens (Section
1.1.1) due to the inadequate activation of a protective Th1 immune response.
Figure 1.5 Pleiotropic effects mediated by SLC11A1 expression. After phagocytosis of
the pathogen, SLC11A1 is recruited to the phagosomal membrane where it precipitates
a multitude of effects that operate in concert to mount a pro-inflammatory (Th1)
immune response, which facilitates clearance of the pathogen. TNF-α – tumour necrosis
factor alpha, IL – interleukin, iNOS – inducible nitric oxide synthase, NO – nitric oxide.
16
1.1.5.1 SLC11A1 Modulates Adaptive Immune Responses
SLC11A1 functions to initiate and perpetuate a Th1 immune response. Macrophages
and DCs from mice resistant to infection (i.e. express functional Slc11a1) express
higher levels of MHC class II than susceptible mice, which do not contain functional
Slc11a1 (Slc11a1-/-) (Barrera et al., 1997, Kaye and Blackwell, 1989, Kaye et al., 1988,
Lang et al., 1997, Stober et al., 2007, Wojciechowski et al., 1999, Zwilling et al., 1987).
It has also been shown that protein processing for presentation to T-cells by MHC class
II molecules is increased in both macrophages and DCs in resistant (Slc11a1+/+)
compared to susceptible (Slc11a1-/-) mice (Lang et al., 1997, Stober et al., 2007).
Additionally, the observed increase in antigen processing was independent of the
increase in MHC class II expression. Furthermore, T-cell activation by macrophages of
susceptible mice (Slc11a1-/-) infected with L.donovani were significantly lower than in
macrophages of resistant mice (Slc11a1+/+) (Kaye et al., 1988), with the decreased level
of T-cell activation attributable to lower MCH class II expression. Therefore, through
increased protein processing, up regulation of MHC class II molecules and increased Tcell activation, Slc11a1 plays an important role in the modulation of an adaptive
immune response (Figure 1.5).
1.1.5.2 SLC11A1 Modulates Cytokine Levels
Slc11a1 modulates the expression levels of a range of cytokines/chemokines (Figure
1.5). Expression of TNF-α, IL-1β and KC were upregulated in macrophages from
resistant mice (Slc11a1+/+), as compared to macrophages of susceptible mice (Slc11a1-/-)
(Blackwell, 1996, Blackwell et al., 1988, Formica et al., 1994, Roach et al., 1993,
Roach et al., 1994, Smit et al., 2004). The expression of TNF-α and IL-1β facilitate the
initiation/perpetuation of a Th1 immune response, while KC is a C-X-C chemokine
belonging to the IL-8 family, which is a chemoattractant for PMN leukocytes.
Slc11a1 also influences the ratio of the cytokines IL-10 and IL-12 (Figure 1.5). No
significant difference in the level of expression is found when IL-12 levels are
compared at different time points post stimulation (using LPS and IFN-γ) between
macrophages and DCs from susceptible and resistant mice (Jiang et al., 2009, Stober et
al., 2007). However, a significant trend is observed for a higher ratio of IL-10:IL-12
produced by macrophages and DCs from susceptible mice compared to resistant mice
17
(Rojas et al., 1999, Stober et al., 2007). Increased IL-10 expression is associated with
diminished pro-inflammatory immune responses. This cytokine also has stimulatory
effects on B-cells, but an inhibitory effect on macrophages and Th1 cells (Couper et al.,
2008). Therefore the bias for IL-10 production in mice expressing non-functional
Slc11a1 contributes to the inhibition of a Th1 pro-inflammatory response, and
polarisation to a Th2 immune response, which is inadequate to clear infection.
1.1.5.3 SLC11A1 Modulates Expression of Pro-Inflammatory Effector
Molecules
Slc11a1 mediates increased production of pro-inflammatory effector molecules, which
exert bacteriocidal properties to resolve infection (Figure 1.5). An increase in inducible
nitric oxide synthase (iNOS) expression, resulting in increased L-arginine flux, and
subsequent production of nitric oxide (NO) was identified in macrophages of
susceptible mice (Slc11a1-/-) transfected with functional Slc11a1, as compared to nontransfected macrophages (Barton et al., 1995). Slc11a1 also plays a role in the
production of a respiratory burst (rapid release of reactive oxygen species), as splenic
macrophages from resistant mice (Slc11a1+/+) showed increased production of hydrogen
peroxide (H2O2) and superoxide anion (O2-) as compared to macrophages of susceptible
mice (Slc11a1-/-) (Denis et al., 1988).
The range of pleiotropic effects mediated by Slc11a1, some of which occur as early as
thirty minutes post infection, suggests an important role for Slc11a1 in the early
signaling pathways during infection leading to the production of a Th1 proinflammatory immune response which is important for the destruction of a range of
intracellular pathogens (Dong and Flavell, 2000). In murine studies, macrophages with a
non-functional Slc11a1 produce a Th2 response and are therefore unable to clear the
infection (Lang et al., 1997, Soo et al., 1998). However, it is currently unclear as to how
recruitment of Slc11a1 to the phagosomal membrane and consequent divalent cation
transport out of the phagosome mediates the wide range of pleiotropic effects to elicit a
Th1 pro-inflammatory immune response.
18
1.1.6 SLC11A1 and Autoimmune Disease
While the range of pleiotropic effects exerted by SLC11A1 modulate the elicitation of
pro-inflammatory immune responses to clear infection, many of these effects are also
involved in the induction and perpetuation of autoimmune/inflammatory diseases.
There is increasing evidence, from both human and mouse studies, to support a role for
SLC11A1 in the development of Type 1 diabetes (T1D). The non obese diabetic (NOD)
mouse is a spontaneous model of TID. The pathogenesis of disease development
mimics, in many respects, that seen in humans, therefore the NOD mouse is the most
widely used model by which to elucidate immune mechanisms of autoimmune diabetes
in humans. The NOD mouse possesses a functional Slc11a1 protein (Slc11a1+/+). A
congenic mouse strain that is derived from the NOD strain, the NOD.B10, which has a
low incidence of T1D, possesses a non-functional Slc11a1 protein (Slc11a1-/-) (Wicker
et al., 2004). This observation corroborates the hypothesis that Slc11a1 may play a role
in the pathogenesis of T1D.
The region of mouse chromosome 1 in which Slc11a1 is located has been identified as
an insulin dependent diabetes (Idd5.2) locus. Over 20 of these loci have been identified,
which have been shown to be protective for disease development in NOD mice (Kissler
et al., 2006). Of the 42 genes located in the Idd5.2 locus, Slc11a1 is the most likely
candidate, due to its important immunomodulatory role, as well as the presence of the
inactivating point mutation (G169D) in the coding region of Slc11a1 (Hill et al., 2000).
Kissler et al. (2006) has provided significant evidence to suggest Slc11a1 is responsible
for the protection afforded at the Idd5.2 locus. Mice heterozygous for the Slc11a1
G169D mutation (Slc11a1+/-) were found to have a reduced frequency of disease
compared to the homozygous NOD mice (Slc11a1+/+). However, the reduced frequency
of disease incidence was not as low as that observed with the NOD.B10 mice
(Slc11a1-/-), showing a dose dependant effect of Slc11a1 on the initiation and
perpetuation of autoimmunity, and T1D development.
Further evidence that Slc11a1 is the candidate responsible at the Idd5.2 locus was
provided by the production of a transgenic NOD mouse line expressing a short hairpin
19
RNA (shRNA) targeted against Slc11a1, resulting in the degradation of Slc11a1 mRNA
and generation of a phenotype analogous to that of Slc11a1-/- mice. When compared to
their non-transgenic littermates, the transgenic mice exhibited a significant reduction in
the incidence of T1D. This reduction in disease occurrence was comparable to the
protective effect reported for congenic mice that carried the disease-protective Idd5.2
locus. Furthermore, silencing of Slc11a1 resulted in a significant reduction in disease
incidence in experimental autoimmune encephalomyelitis, a murine model of multiple
sclerosis (Kissler et al., 2006).
Additionally, using a murine model of colitis, resembling the human disease of
ulcerative colitis, Jiang et al. (2009) observed that resistant mice (Slc11a1+/+) had lower
body weights, higher mortality rates and shorter colon lengths, as compared to
susceptible mice (Slc11a1-/-). These differences were attributable to differing cytokine
profiles, where the resistant mice produced a pro-inflammatory immune response
resulting in tissue destruction, in contrast to the anti-inflammatory immune response
mounted by the susceptible mice (Jiang et al., 2009). Thus Slc11a1 modulated
susceptibility to autoimmunity in three disease models (T1D, experimental autoimmune
encephalomyelitis and colitis) providing further support for the premise Slc11a1 is the
gene responsible for the protective effect of the Idd5.2 locus, and the involvement of
Slc11a1 in the development of autoimmune disease per se.
The genetic region of mouse chromosome 1 containing Slc11a1 and the protective
Idd5.2 locus, is syntenic with human chromosome 2q35 (Schurr et al., 1990), which has
also been mapped as an insulin-dependent diabetes mellitus (IDDM) susceptibility
locus, containing IDDM13, which has been shown to confer resistance to T1D (Esposito
et al., 1998, Fu et al., 1998, Morahan et al., 1996).
In addition to the pleiotropic effects of SLC11A1, the function of SLC11A1 as an iron
transporter may contribute directly to the onset of autoimmune diseases. Increasing
evidence suggests that dysregulation of iron metabolism occurs in many autoimmune
diseases (Bowlus, 2003, Nielsen et al., 1994, Weber et al., 1988). For example, iron
deposition and subsequent iron catalysed oxidative damage has been associated with
tissue destruction in multiple sclerosis (Bakshi et al., 2002, Bakshi et al., 2001). Iron
has also been shown to contribute to the pathogenesis of rheumatoid arthritis, whereby
20
patients have been shown to have significantly higher concentrations of iron deposited
in their synovial membranes (Fritz et al., 1996). Furthermore, SLC11A1 has been
shown to be located within macrophages and neutrophils in the synovial membrane of
individuals with rheumatoid arthritis (Bayele et al., 2007, Rioja et al., 2005). Due to the
role of SLC11A1 in erythrophagocytosis (Section 1.1.4.2), SLC11A1 may orchestrate
the deposition of iron to the synovium (Telfer and Brock, 2002). The presence of iron in
the synovial membrane would then result in the generation of oxygen radicals leading to
the tissue inflammation and destruction associated with rheumatoid arthritis.
Therefore, the use of murine models showing resistance (Slc11a1+/+) and susceptibility
(Slc11a1-/-) to infection has established that Slc11a1 plays a significant role in the
development of infectious and autoimmune/inflammatory disease, attributable to the
role Slc11a1 plays in initiating and perpetuating Th1 pro-inflammatory immune
responses.
21
1.2 SLC11A1 POLYMORPHISMS
1.2.1 Genomic Organisation of the SLC11A1 Locus
Located at chromosome 2q35, the SLC11A1 gene is approximately 14kb in length, is
composed of 15 exons (Figure 1.6) and produces an mRNA transcript of 3865 bases,
with a coding sequence 1653 base pairs in length (NCBI NM_000578.3). An
alternatively sized mRNA transcript of 2.0kb has also been identified in conjunction
with the 3865bp transcript. The two transcripts differ at the 3’UTR and polyadenlyated
tail. SLC11A1 is located in a locus containing genes encoding proteins with immune
functions (IL-8 receptors, IL8RA and IL8RB) (Figure 1.6).
The SLC11A1 exon designated 4a, within the 4th intron, is an alternatively spliced
variant produced by the replication of an Alu element (Figure 1.6). This splice variant
has been shown to be transcribed in vivo, resulting in the introduction of a termination
codon in exon 5 due to a frame-shift in the coding sequence. Due to the frame-shift, and
early termination, this splice variant produces a truncated, functionally null protein. At
the mRNA level, the ratio of truncated to functional transcripts in macrophages is
relatively low (approximately 1:5) (Cellier et al., 1994).
1.2.2 SLC11A1 Polymorphisms
To date, 17 polymorphisms within SLC11A1 have been extensively studied (Figure 1.6)
(Table 1.2). Three polymorphisms have been identified in the SLC11A1 promoter,
which include two single nucleotide polymorphisms (SNP) and a polymorphic
microsatellite (GT)n repeat polymorphism. Additionally, two deletion mutations have
been identified in the 3’ UTR of SLC11A1 (Table 1.2). Within the SLC11A1 gene, four
SNPs exist in intronic areas along with a polymorphic (ATA)n repeat in intron 8. There
are seven reported mutations in the coding region of SLC11A1, with three of these being
silent mutations and 4 missense or insertion/deletion mutations, which alter the amino
acid sequence. These include two SNPs that result in an amino acid substitution
(1029C/T [A316V] and 1730G/A [D543N]) and two insertion/deletion polymorphisms
located in exon 2 (136del9 and 157ins11) (Figure 1.6) (Table 1.2).
22
A
B
218,950 K
219,000 K
219,050 K
IL8RB
219,100 K
IL8RA
219,150 K
AAMP
ARPC2
219,200 K
PNKD
219,250 K
C2orf62
219,300 K
NLI-IF
VIL
219,250 K
USP37
C
0
1
1
2
2
3
3
4 4a
4
5
6
7
5 6 78
8
9
274C/T
(GT)n
469+14G/C
-8G/A
823C/T
577-18G/A
IVS1-28C/T
112G/A
10 11
10
11
12
12
13 14
13
14kb
15
1465 -85G/A
2
-237C/T
9
(ATA)n
1029C/T
(A318V)
1730G/A
(D543N)
(CAAA)n
1729+55del4
157ins11
136del9
Figure 1.6 Location and genomic organisation of the SLC11A1 locus. (A) The
SLC11A1 gene is located on Chromosome 2q35. (B) Genomic organisation around the
SLC11A1 gene showing the relative positions of immune (IL8RA and IL8RB) and nonimmune related (PNKD and VIL) genes. 50kb separates each major marking on the
scale bar at the top of the image. (C) Genomic organisation and location of studied
sequence variants in SLC11A1. The 15 exons of the gene are shown as black boxes with
their respective numbers and the corresponding scale above indicates the length (kb) of
the gene. The grey boxes indicate the 3’ and 5’ untranslated regions and the introns and
flanking regions are represented by a thin line. Arrows indicate the position of sequence
variants where numbering is relative to the transcription start site.
23
Table 1.2 The Location of Analysed Polymorphisms within SLC11A1.
Polymorphism
Location of variant
Type
Reference
(GT)n microsatellite repeat
Promoter
Microsatellite
Liu et al ., 1995
-237C/T
Promoter
Base substitution
Lewis et al ., 1996
-8G/A
Promoter
Base substitution
Mohamed et al ., 2004
IVS1-28C/T
Intron 1
Base substitution
Zaahl et al ., 2005
112G/A
Coding
Base substitution (Silent)
Zaahl et al ., 2005
136del9
Coding
Missense - deletion of 9bp
White et al ., 1994
157ins11
Coding
Missense - insertion of 11bp
Zaahl et al ., 2005
274C/T
Coding
Base substitution (Silent)
Liu et al ., 1995
469+14G/C (INT4)
Intron 4
Base substitution
Liu et al ., 1995
577-18G/A
Intron 5
Base substitution
Liu et al ., 1995
823C/T
Coding
Base substitution (Silent)
Liu et al ., 1995
(ATA)n
Intron 8
Microsatellite
Awomoyi et al ., 2006
1029C/T (A318V)
Coding
Base substitution (Missense)
Liu et al ., 1995
1465-85G/A
Intron 13
Base substitution
Liu et al ., 1995
1730G/A (D543N)
Coding
Base substitution (Missense)
Liu et al ., 1995
1729+55del4 (TGTG)
3'UTR
Deletion of 4bp
Liu et al ., 1995
1729+271del4 (CAAA)n
3'UTR
Microsatellite
Buu et al .,1995
While 17 polymorphisms have been analysed extensively within the SLC11A1 locus
(Table 1.2), a large number of polymorphisms have been identified throughout the
SLC11A1 promoter and gene region which have not been studied (Figure 1.7). The
majority of these polymorphisms are silent mutations in coding regions or are located in
non-coding regions and therefore, are thought to exert no effect on the expression of the
gene or the function of the protein.
24
A
B
Figure 1.7 Location of all annotated sequence variants throughout the SLC11A1 locus.
(A) The bar at the top shows the location of the gene/variants respective to
Chromosome 2. SLC11A1 is shown below with the boxes and lines depicting the exon
and intron structure, respectively. Each arrow represents a different sequence variant,
with the respective accession number. (B) Close-up of the SLC11A1 5’UTR showing a
lack of sequence variants. Annotated variants are from the NCBI SNP database
(dbSNP) with the image from Hapmap (http://www.hapmap.org/).
1.2.3 SLC11A1 Functional Polymorphisms
Of the SLC11A1 polymorphisms identified to date, a single nucleotide polymorphism
similar to that found in mice that produces a functionally null protein (G169D) has not
been identified in humans (Vidal et al., 1996). SLC11A1 appears to be essential to
macrophage function, and therefore, directly influences innate immunity and, through
modulation of antigen presentation and cytokine production, also impacts adaptive
immunity (Section 1.1.7). Consequently, coding region mutations are predicted to be
rare.
However, some coding region mutations, which result in a putative alteration of
SLC11A1 function, have been identified. A putative functional coding region mutation
25
has been identified in exon 2 at nucleotide position 136 of the open reading frame of
SLC11A1 and consists of a deletion of 9 nucleotides (136del9) in a 3 × 9 nucleotide
repeat in the region encoding the N-terminal proline/serine rich SH3 binding domain
and is analogous to another reported polymorphism termed 148del9 (Figure 1.6) (Barton
et al., 1994, Blackwell et al., 1995, White et al., 1994, Zaahl et al., 2005). However,
this polymorphism only occurs at a frequency of 0-4% (Searle and Blackwell, 1999,
White et al., 1994), and has never been observed in the homozygous condition, further
corroborating the important role played by SLC11A1.
The 157ins11 is another coding region mutation in exon 2, near the region encoding the
SH3 binding domain, that results in the insertion of 11 bases (GACCAGCCCAG)
(Figure 1.6). The insertion has only been observed in one individual in a heterozygous
form (Zaahl et al., 2005). The functional significance of this polymorphism is unknown,
however insertion of 11bp would result in a shift in the reading frame, and therefore
may result in a truncated, functionally null, protein. The low frequencies and the fact
that the 136del9 and 157ins11 polymorphisms have only been found in a heterozygous
state suggests that these polymorphisms would be fatal in the homozygous state.
Another mutation, occurring in exon 15, results in an amino acid substitution of a
negatively charged aspartic acid residue for a neutral asparagine residue at position 543
(D543N) in the cytoplasmic carboxyl terminus of the SLC11A1 protein (Table 1.2).
Due to the positioning of this polymorphism at the carboxy terminal end of the protein
(and not the pore channel), the functional effects of this polymorphism are unknown
(Figure 1.6). However, it is thought that this substitution may result in altered SLC11A1
protein function, thereby altering the kinetics of transport of the divalent cations when
localised to the phagosomal membrane (Liu et al., 1995).
1.2.4 SLC11A1 Polymorphisms Affecting Expression Levels
While coding region mutations like the 136del9 and D543N putatively affect the
functionality of SLC11A1, polymorphisms located in the regulatory regions of the gene
(5’UTR, 3’UTR and promoter region) may affect the level of expression of SLC11A1
leading to different levels of functional SLC11A1 protein. Polymorphisms located in the
promoter region may alter expression by increasing or decreasing the rate of
26
transcription, while polymorphisms located in the 3’UTR may alter protein levels at the
translational level. These polymorphisms are therefore a more subtle way, as compared
to coding region mutations, of altering the amount of functional protein expressed.
1.2.4.1 SLC11A1 Promoter Polymorphisms
The SLC11A1 promoter region contains several polymorphisms. The most studied of
these are the (GT)n microsatellite repeat and -273C/T polymorphism, which have been
shown to alter SLC11A1 expression (Sections 1.3.2 and 1.3.3). Other promoter
polymorphisms have been identified, however, these have not been shown to have an
effect on SLC11A1 expression in cells of monocytic origin (Donninger et al., 2004,
Mohamed et al., 2004).
1.2.4.2 SLC11A1 UTR Polymorphisms
No polymorphisms have been identified in the 5’UTR of SLC11A1. While there are a
high number of polymorphisms located both before and after the 5’UTR, none have
been identified within this region (Figure 1.7). The lack of polymorphisms in the 5’UTR
compared to the large number of polymorphisms in the surrounding regions, suggests
that this 5’UTR region plays an important role in SLC11A1 expression as sequence
conservation is well maintained.
Several microsatellite repeats have been identified within the 3’UTR of SLC11A1. The
1729+271del4, also known as the (CAAA)n polymorphism, is a polymorphic
microsatellite repeat located in the 3’UTR. Two alleles of the polymorphism have been
described, (CAAA)2 [CAAAAA(CAAA)2CGAAAAA] and (CAAA)3
[CAAAAA(CAAA)3CAAAAAA] (Buu et al., 1995), which differ by a single 4bp
CAAA repeat and a single C to G nucleotide polymorphism. The (CAAA)3 variant is
more common than the (CAAA)2 variant with frequencies of approximately 63 and
37%, respectively. Another microsatellite repeat in the 3’UTR is the 1729+55del4 also
known as the TGTG insertion/deletion (Liu et al., 1995). Two variants of this
polymorphic microsatellite repeat have been identified, which differ by a 4bp TGTG
repeat. These 3’UTR polymorphisms may affect the stability of the mRNA transcript,
therefore indirectly modulating SLC11A1 expression. However, there are currently no
published reports to support this hypothesis.
27
1.3 SLC11A1 PROMOTER POLYMORPHISMS AND
DISEASE OCCURRENCE
1.3.1 The SLC11A1 (GT)n Microsatellite Promoter
Polymorphism
The SLC11A1 promoter contains a complex polymorphic (GT)n microsatellite repeat,
which is located approximately 240bp upstream of the transcription start site (Figure
1.6). To date, nine different polymorphic variants of the (GT)n promoter, which vary in
the number or composition of GT repeats, have been identified (Table 1.3) (Searle and
Blackwell, 1999).
Table 1.3 (GT)n Repeat Polymorphisms of the SLC11A1 Promoter.
Allele
Allele 1
Allele 2
Allele 3
Allele 4
Sequence
t(gt)5ac(gt)5ac(gt)11ggcaga(g)6
t(gt)5ac(gt)5ac(gt)10ggcaga(g)6
t(gt)5ac(gt)5ac(gt)9ggcaga(g)6
t(gt)5ac(gt)9ggcaga(g)6
Allele 5 t(gt)4ac(gt)5ac(gt)10ggcaga(g)6
Allele 6 t(gt)5ac(gt)5ac(gt)4at(gt)4ggcaga(g)7
Allele 7 t(gt)5ac(gt)5at(gt)11ggcaga(g)6
Allele 8 t(gt)5ac(gt)5ac(gt)6ggcaga(g)6
Allele 9 t(gt)5ac(gt)5ac(gt)8ggcaga(g)6
Length (bp)
59
57
55
43
Frequency (%)
>1
15-30
65-85
>1
55
56
59
2-5 ,18
>1
49
53
*
5†
>1
>1
#
Reference
Blackwell et al. , 1995
Blackwell et al. , 1995
Blackwell et al. , 1995
Blackwell et al. , 1995
Graham et al. , 2000
Graham et al. , 2000
Kojima et al. , 2001
Zaahl et al. , 2006
Zaahl et al. , 2006
*
European population (Kotze et al ., 2001)
Greek population (Gazouli et al ., 2007)
†
Japanese population (Kojima et al ., 2001)
#
Originally, four promoter (GT)n alleles were identified and designated alleles 1-4
(Blackwell et al., 1995). However, to date, the number of alleles identified has increased
to nine (Table 1.3). Alleles 5 and 6 were discovered in a study of the inflammatory
condition, primary biliary cirrhosis (Graham et al., 2000). Allele 7 was found in an
investigation of inflammatory bowel disease in a Japanese population (Kojima et al.,
2001). The most recently discovered alleles, 8 and 9, were identified during a study of
inflammatory bowel disease within a South African population (Zaahl et al., 2006).
Several of the alleles have the same repeat length, with alleles 1 and 7 (both 59bp)
differing by a single C to T base substitution between repetitive GT repeats while alleles
3 and 5 (both 55bp) differ in the composition of the GT repeats.
28
In all populations studied to date, SLC11A1 (GT)n promoter allele 3 is the most
commonly occurring variant, followed by allele 2, with frequencies of approximately
60-70% and 20-30%, respectively (Searle and Blackwell, 1999). In most populations,
the combined (GT)n allele 2 and 3 frequencies account for greater than 95% of all
alleles (Table 1.3). However, the frequencies of the SLC11A1 promoter alleles vary with
ethnicity (Awoymi, 2007). The incidence of allele 3 varies between different
populations where it is found with lower frequencies (60%) in South American
populations and higher frequencies (83%) in Asian populations. Likewise, the frequency
of (GT)n allele 2 varies from 39% in South American populations to 12% in Asian
populations.
(GT)n alleles 1 and 4-9 occur at very low frequencies, however, these less commonly
occurring (GT)n promoter alleles also vary in frequencies depending on the population
studied. Allele 7 has only been identified in Asian populations where it has a frequency
of approximately 5% (Kojima et al., 2001). Likewise, allele 5 has been found
predominantly in Caucasian/European populations, while the highest frequency of allele
4 is found in South American populations (Table 1.3) (Calzada et al., 2001, Ferreira et
al., 2004, Gazouli et al., 2007, Kotze et al., 2001).
29
1.3.2 The (GT)n Promoter Polymorphisms Modulate SLC11A1
Expression
The (GT)n microsatellite repeat functions as an endogenous enhancer of SLC11A1
expression (Searle and Blackwell, 1999). The nine known alleles of the (GT)n promoter
polymorphism vary in the number and sequence composition of the GT repeats, and
alteration of this important promoter motif alters the enhancement of SLC11A1
promoter activity mediated by the (GT)n microsatellite repeat (Figure 1.8). Reporter
assays have been used to determine the level of SLC11A1 gene expression for the
different (GT)n promoter alleles in monocytic cell lines (Searle and Blackwell, 1999,
Zaahl et al., 2004). Analysis of the basal level of expression in resting macrophages
shows that alleles 1, 2 and 4 function as poor promoters, resulting in a low level of
SLC11A1 expression, while allele 3 drives high SLC11A1 gene expression, showing
endogenous enhancer activity (Blackwell et al., 1995, Searle and Blackwell, 1999)
(Figure 1.8). Alleles 5 and 8 also result in a decreased SLC11A1 expression, as
compared to allele 3 (Zaahl et al., 2004). The mechanism surrounding differences in the
basal level of SLC11A1 expression between the different alleles of the (GT)n promoter
polymorphism is unknown.
200
Basal
180
IFN-γ
LPS/IFN-γ
Mean Luciferase Activity
160
140
120
100
80
60
40
20
0
1
2
3
(GT)n Alleles
4
Figure 1.8 SLC11A1 expression is differentially modulated by the different promoter
(GT)n microsatellite alleles. Reporter constructs containing the different (GT)n alleles
(x-axis) were transfected into the U937 cell line with or without the addition of the
exogenous stimuli IFN-γ or LPS/IFN- γ (Adapted from Searle and Blackwell, 1999).
30
The addition of the exogenous stimulus, IFN-γ, in the luciferase reporter assays resulted
in a similar percent increase in promoter activity of alleles 1 through to 4, compared to
the basal level of expression observed without IFN- γ stimulation for each allele (Figure
1.8) (Searle and Blackwell, 1999). This finding is consistent with the presence of
multiple putative IFN-γ response elements, located both upstream and downstream of
the promoter (Blackwell, 1996). When LPS was added as a second exogenous stimulus
in combination with IFN-γ, there was no significant difference in promoter activity of
alleles 1 and 4 as compared with stimulation by IFN- γ alone. However, in the presence
of both stimuli, there was a significant increase in SLC11A1 expression in the presence
of allele 3, while the presence of allele 2 resulted in a significant decrease in promoter
activity (Figure 1.8) (Searle and Blackwell, 1999). The mechanism for the differential
expression levels of SLC11A1, mediated by (GT)n alleles 2 and 3, in the presence or
absence of exogenous stimuli, remains unknown.
1.3.3 The SLC11A1 -237C/T Promoter Polymorphism
The -237C/T polymorphism, first discovered by Lewis et al. (1996) (Figure 1.6), is
located 237 bases upstream of the transcription start site, and just downstream from the
polymorphic (GT)n microsatellite repeat (Figure 1.6). This polymorphism consists of a
single base substitution of a C to T, with the T variant frequency varying from 0-20%
depending on the population analysed. Along with the SLC11A1 (GT)n promoter
polymorphism, the -237C/T polymorphism has also been shown to affect the level of
expression of SLC11A1 (Zaahl et al., 2004). The less frequent -237 T variant is
consistently detected in combination with allele 3 and has not been detected
concurrently with allele 2. The more frequent -237 C variant has been shown to occur
with all (GT)n alleles. It has been shown that the high basal level of SLC11A1
expression driven by (GT)n allele 3 (Section 1.3.2, Figure 1.8), is significantly reduced
to a level comparable to that of allele 2 when this allele is in cis with the less frequent
-237 T variant (Zaahl et al., 2004). Likewise, with the addition of the exogenous stimuli
IFN-γ and LPS, expression levels of (GT)n allele 3 in association with the -237 T variant
are reduced to levels comparable with those observed when these exogenous stimuli act
in the presence of SLC11A1 (GT)n allele 2. The reason for the decreased expression of
SLC11A1 by (GT)n allele 3 in association with the -237 T variant is unknown.
31
1.3.4 The Association of SLC11A1 (GT)n Promoter Variants
with Infectious and Autoimmune Diseases
From the aforementioned gene expression studies (Section 1.3.2), Blackwell, (1996)
hypothesised that over-expression of SLC11A1, due to the presence of allele 3, would
result in an enhanced Th1 pro-inflammatory immune response due to the pleiotropic
effects of SLC11A1 leading to a chronic hyperactivation of macrophages. This
hyperactivation would lead to an increased rate of pathogen clearance resulting in
resistance to infection. However, this increase in activation of macrophages would lead
to an enhanced Th1 pro-inflammatory immune response putatively causing an increased
susceptibility to autoimmune diseases (Figure 1.9).
Allele 2
Allele 3
Low activation of
macrophages
Chronic hyperactivation of
macrophages
– Susceptibility to infection
– Resistance to autoimmunity
– Resistance to infection
– Susceptibility to autoimmunity
Figure 1.9 The influence of SLC11A1 (GT)n allele 2 and allele 3 on macrophage
activation. Allele 2 causes low activation of macrophages resulting in susceptibility to
infection but resistance to autoimmune disease. Allele 3 results in over expression of
SLC11A1 causing chronic hyperactivation of macrophages. This leads to resistance to
infection, but an increased susceptibility to autoimmune diseases (Modified from
Blackwell et al., 2003).
Likewise, low expression levels of SLC11A1, driven by allele 2, would result in a lower
activation of macrophages, conferring resistance to autoimmune diseases. However, the
32
lower activation state of macrophages would result in an increased susceptibility to
infection (Figure 1.9). Analogous to the wild type 169G (Slc11a1+/+) mice, upon
infection, (GT)n alleles 3 would elicit a range of pleiotropic effects, which collectively
facilitate a Th1 mediated immune response to resolve infection. Alternatively, lower
SLC11A1 expression driven by (GT)n allele 2 would elicit a low activation of
macrophages and an inability to mount an effective Th1 mediated immune response to
clear the infection, similar to the mice carrying the 169D mutation (Slc11a1-/-). The
SLC11A1 alleles putatively conferring susceptibility to autoimmune disease may have
been maintained in the population due to improved survival rates following infectious
disease challenge (Smit et al., 2004).
1.3.4.1 SLC11A1 (GT)n Promoter Polymorphism and Infection
Due to the ability of the different alleles at the (GT)n promoter polymorphism to
modulate differential expression of SLC11A1, numerous studies have investigated the
association of specific (GT)n promoter alleles with the incidence of a range of infectious
diseases to determine if specific alleles modulate disease susceptibility/resistance. These
have included diseases caused by bacterial pathogens (M. tuberculosis, M. leprae and S.
typhi), protozoan parasites (Trypanosoma cruzi and Leishmania donovani) and viruses
(human immunodeficiency virus [HIV]). Table 1.4 summarises all familial and
association studies completed to date that have assessed the association of the (GT)n
promoter polymorphisms with the incidence of infectious disease. A common feature of
all of the different diseases is the inconsistent associations between studies. While some
studies show an association of a specific (GT)n allele with disease occurrence, other
studies find no evidence of an association.
The majority of the studies which assess infectious disease susceptibility have examined
the association of the SLC11A1 (GT)n alleles with tuberculosis susceptibility and
progression to clinical disease. A meta-analysis, compiled of association studies (from
1995-2004) assessing the association of variants of the (GT)n promoter polymorphism
with pulmonary tuberculosis susceptibility, revealed that (GT)n allele 3 was
33
Table 1.4 Studies Assessing the Association of the SLC11A1 (GT)n Promoter
Polymorphism with the Incidence of Infectious Disease.
Study
Disease
Population
(GT)n allele associated
Liu et al ., 1995
Newport et al ., 1995
Roger et al ., 1997
Shaw et al ., 1997b
Bellamy et al ., 1998
Huang et al ., 1998
Marquet et al ., 1999
Roy et al ., 1999
Cervino et al ., 2000
Gao et al ., 2000
Greenwood et al ., 2000
Selvaraj et al ., 2000
Calzada et al ., 2001
Dunstan et al ., 2001
Meisner et al ., 2001
Awomoyi et al ., 2002
Ma et al ., 2002
Selvaraj et al ., 2002
Soborg et al ., 2002
Blackwell et al ., 2003
Bucheton et al ., 2003
El Baghdadi et al , 2003
Ouchi et al ., 2003
Donninger et al ., 2004
Ferreria et al ., 2004
Fitness et al ., 2004a
Fitness et al ., 2004b
Hoal et al ., 2004
Mohamed et al ., 2004
Dubaniewicz et al ., 2005
Bravo et al ., 2006
Hsu et al ., 2006
Hsu et al ., 2006
Li et al ., 2006
Leung et al ., 2007
Soborg et al ., 2007
Takahashi et al ., 2008
Tanaka et al ., 2007
Ates et al ., 2009b
Chen et al ., 2009
McDermid et al ., 2009
Velez et al ., 2009
de Wit et al ., 2010
Motsinger-Reif et al ., 2010
Tuberculosis
Tuberculosis
Leprosy
Tuberculosis
Tuberculosis
MAI
HIV
Leprosy
Leprosy
Tuberculosis
Tuberculosis
Tuberculosis
Chagas' disease (T. Cruzi )
Typhoid Fever
Leprosy
Tuberculosis
Tuberculosis
Tuberculosis
Tuberculosis
Meningococcal meningitis
Visceral leishmaniasis
Tuberculosis
Kawasaki
HIV
Leprosy & Mitsuda reaction
Tuberculosis
Leprosy
Tuberculosis
Visceral leishmaniasis
Tuberculosis
Brucellosis
Tuberculosis
Tuberculosis
Tuberculosis
Tuberculosis
Tuberculosis
MDR-TB
MAC
Tuberculosis
Tuberculosis
HIV
Tuberculosis
Tuberculosis
Tuberculosis
Combined Hong Kong & Canadian
Maltese
French Polynesian
Brazil
Gambian
American
Columbian
Indian
Guinea-Conakry
Japanese
Aboriginal Canadian
Indian
Peru
Vietnam
Mali (West African)
Gambia
American
Indian
Danish
English
Sudanese
Moroccan
Japansese
African/European
Brazil
Malawi
Malawi
South African (SA coloured)
Sudanese
Polish
Spanish
Taiwanese (aboriginals)
Han (Taiwan)
Meta analysis
Chinese
Tanzanian
Japanese
Japanese
Dutch
Tibetan
Gambia
Argentinian/American & African American
South African (SA coloured)
American
No association
No association
No association
b
Allele 2
b
3/other
No association
Allele 2
No association
No association
Allele 3
c
N/A
No association
No association
No association
No association
Allele 3
Allele 3
No association
No association
Allele 3
e
No association
No association
d
Allele 1
No association
b
Allele 2
No association
No association
Allele 3
e
Allele 3
No association
No association
Allele 3
No association
Allele 3
No association
Allele 3
Allele 3
No association
No association
Allele 3f
No association
No association
Allele 3
No association
a
Unless otherwise stated, the specified allele is associated with disease resistance.
Allele found to confer susceptibility.
c
Minor allele frequency too low to determine an association.
d
Allele 1 is most likely to represent allele 7 in this population.
e
Additionally, significant linkage was obtained with (GT) n polymorphism and disease occurrence.
f
Haplotype containing (GT)n polymorphism in association with other SLC11A1 polymorphisms.
MAI, Mycobacterium avium intracellulare ; MAC, Mycobacterium avium complex; MDR, Multi-drug resistant Mycobacterium tuberculosis
b
a
34
significantly associated with resistance to pulmonary tuberculosis infection (Li et al.,
2006). When the studies were stratified according to the origin of the population
assessed, a significant association was identified in African and Asian populations, but
not in European populations. The latter cohorts consisted of two sample sizes of 47 and
101 in which the incidence of allele 3 was associated with both susceptibility and
resistance to pulmonary tuberculosis infection, thus highlighting the inconsistent
associations between studies (Ma et al., 2002, Soborg et al., 2002).
1.3.4.2 SLC11A1 (GT)n Promoter Polymorphisms and Autoimmune
Disease
Increasing evidence suggests that SLC11A1 may play a role in susceptibility/resistance
to autoimmune disease (Section 1.1.6) due to the immunomodulatory role of SLC11A1
in polarising a Th1 immune response. Thus, it has been hypothesised that increased
SLC11A1 expression by (GT)n allele 3, compared to the other (GT)n alleles, would
predispose an individual to autoimmune disease (Section 1.3.4). Table 1.5 displays all
of the association and familial studies which have assessed the presence of specific
(GT)n alleles with the incidence of autoimmune diseases.
Numerous studies assessing the association of the (GT)n promoter alleles with
rheumatoid arthritis (Rodriguez et al., 2002, Sanjeevi et al., 2000, Shaw et al., 1996),
T1D (Bassuny et al., 2002, Esposito et al., 1998, Nishino et al., 2005, Takahashi et al.,
2004), inflammatory bowel disease/Crohns’s disease (Gazouli et al., 2008a, Zaahl et al.,
2006), sarcoidosis (Dubaniewicz et al., 2005, Gazouli et al., 2007) and multiple
sclerosis (Gazouli et al., 2008b) support the hypothesis that the presence of allele 3
predisposes to autoimmune disease (or conversely that the presence of allele 2 is
protective against the occurrence of autoimmune disease). However, analogous to
studies investigating the association of the (GT)n promoter alleles with the incidence of
infectious diseases, other studies have failed to show the hypothesised association
between the presence of allele 2 or 3 and resistance or susceptibility to autoimmune
disease, respectively.
35
Table 1.5 Studies Assessing the Association of the SLC11A1 (GT)n Promoter
Polymorphism with the Incidence of Autoimmune Disease.
Study
Shaw et al ., 1996
John et al ., 1997
Esposito et al ., 1998
Graham et al ., 2000
Maliarik et al ., 2000
Sanjeevi et al ., 2000
Singal et al ., 2000
Yang et al ., 2000a
Kojima et al ., 2001
Kotze et al ., 2001
Bassuny et al ., 2002
Rodriguez et al ., 2002
Comabella et al ., 2004
Takahashi et al ., 2004
Crawford et al ., 2005
Dubaniewicz et al ., 2005
Maier et al ., 2005
Nishino et al ., 2005
Runstadler et al ., 2005
Kim et al ., 2006
Sechi et al ., 2006
Zaahl et al ., 2006
Chermesh et al ., 2007
Gazouli et al ., 2007
Ates et al ., 2008
Gazouli et al ., 2008a
Gazouli et al ., 2008b
Kotlowski et al ., 2008
Ates et al ., 2009a
Ates et al ., 2009b
Paccagnini et al ., 2009
Ates et al ., 2010
a
Disease
Rheumatoid arthritis
Rheumatoid arthritis
Type 1 diabetes
Primary biliary cirrhosis
Sarcoidosis
Juvenile rheumatoid arthritis
Rheumatoid arthritis
Rheumatoid arthritis
Inflammatory bowel disease
Multiple sclerosis
Type 1 diabetes
Rheumatoid arthritis
Multiple sclerosis
Type 1 diabetes
Inflammatory bowel disease
Sarcoidosis
Type 1 diabetes
Type 1 diabetes
Juvenile rheumatoid arthritis
Behcet disease
Crohn's disease
Inflammatory bowel disease
Crohn's disease
Sarcoidosis
Systemic sclerosis
Crohn's disease
Multiple sclerosis
Inflammatory bowel disease
Behcet disease
Rheumatoid arthritis
Type 1 diabetes
Multiple sclerosis
Population
English
English
English
English
African Americans
Latvian/Russian
Canadian
Korean
Japanese
South African
Japanese
Spanish
Spanish
Japanese
Caucasian
Polish
English
Japanese
Finnish
Korean
Sardinians
South African (mixed)
Ashkenazi Jews
Greek
Turkish
Greek
Sardinians
Canadian
Turkish
Dutch
Italian
Turkish
a
(GT)n Allele Associated
Allele 3b
No association
Allele 3
Allele 5
Allele 3 (allele 2 protective)
Allele 3 (allele 2 protective)
No association
No association
Allele 7
Allele 5
c
Allele 2 protective
d
Allele 2 protective
No association
e
Allele 7 (allele 2 protective)
No association
Allele 3
No association
f
Allele 2 protective
No association
Allele 3 protective
No association
g
Allele 3
No association
Allele 3
h
Allele 2 (allele 3 protective)
Allele 3
Allele 3
i
j
Allele 1 and 2 , Allele 3
No association
No association
No association
No association
Unless otherwise stated, the specified allele was positively associated with the incidence of disease.
b
Allele 3 is transmitted in preference to allele 2 in affected sib-pairs.
c
Frequency of allele 2 slightly lower, albeit not significantly, in the early onset (2-10 years) cohort than in controls.
d
Only when patients and controls stratified according to MHC risk alleles.
An increase in 2/2 genotype frequency among patients carrying MHC risk alleles compared to controls.
Frequency of patients with allele 3 significantly decreased among patients without MHC risk alleles compared to controls also not carrying MHC risk.
e
Allele 2 significantly lower when data analysed using c 2 test, but not after Bonferroni multiple adjustment.
f
In all diabetic patients, allele 2 was less frequent and allele 3 was more frequent, albeit not significantly, than in controls.
Decreased frequency of allele 2 only among patients with early-onset (<11 years) compared to late onset (>11 years) patients and control subjects.
g
No statistically significant differences when comparing (GT) n promoter alleles in patients and controls, except when data stratified according to the
h
Evidence of a role of infection in the onset of systemic sclerosis.
presence of the -237C/T polymorphism in association with allele 3.
i
Associated with Crohn's disease.
j
Associated with ulcerative colitis.
k
Allele 2 shows a slight protective effect.
36
Nishino et al. (2005) completed a small meta-analysis that examined the association of
the SLC11A1 promoter polymorphisms with Type 1 diabetes as well as several other
autoimmune diseases. These researchers did not find an association between allele 3 and
the incidence of autoimmune diseases, but did find that allele 2 was negatively
associated with the incidence of autoimmune diseases. However, this meta-analysis did
not include all the available data that has examined an association of variants at the
SLC11A1 (GT)n promoter polymorphism with Th1 autoimmune/inflammatory diseases,
as only seven studies were included in the analysis.
The development of autoimmune and infectious diseases are complex multifactorial
processes, which depend upon a wide range of factors, including environmental
influences, ethnicity and geographical variations, and the presence of predisposing
alleles, especially those in the MHC loci (Azar et al., 1999). Therefore, in populations
lacking additional and/or environmental susceptibility factors SLC11A1 may not play a
major role in disease development and this may account for some of the inconsistent
findings from the different studies.
37
1.3.5 Limitations of Association Studies Analysing the
SLC11A1 (GT)n Polymorphism and Disease Occurrence
Due to the inconsistent findings of studies assessing the association of the SLC11A1
(GT)n alleles with infectious and autoimmune disease incidence (Section 1.3.4), no clear
role for the (GT)n microsatellite in disease occurrence has been established. To date, a
major limitation of the studies attempting to establish an association between different
(GT)n promoter alleles and disease incidence has been the sample sizes of the individual
studies. The majority of association studies completed to date have included less than
200 cases, and consequently, the power to detect authentic allelic associations is low.
This means that these studies will not be able to establish significant associations, even
if they exist. The issue of small sample sizes is further confounded when other
environmental or genetic factors, which modulate the incidence of infectious and
autoimmune diseases, are factored into a study. Such two-way interactions require
sample sizes of 105 individuals if genuine associations are to be established (McDermid
and Prentice, 2006). The use of small sample sizes also generates genetic bias, as such
studies have a tendency to over-report the frequency of the minor allele, resulting in
type I (false positive) or II (false negative) errors in the finding of an association study.
Therefore, there is a need for the completion of studies with larger sample sizes to
determine the association between specific alleles of the (GT)n repeat with disease
incidence. However, the ability to complete studies with large sample sizes is hindered
by current genotyping methods. The methods used to genotype the SLC11A1 (GT)n
promoter polymorphism in previous studies have all followed a limited number of
techniques. However, due to the complexity of the microsatellite repeat and the
common microsatellite lengths of several alleles (Table 1.3), these methods, which
include PCR amplicon size determination, restriction fragment length polymorphisms
and sequencing, are unable to accurately discriminate all (GT)n alleles/genotypes
(Kojima et al., 2001). The inability to differentiate all alleles has resulted in the misreporting of allele frequencies. Likewise, cloning and sequencing, which is the only
method that allows for accurate discrimination of all (GT)n genotypes, is laborious, time
consuming and expensive. Therefore, there is a need for a specific, rapid and highthroughput methodology to genotype the SLC11A1 (GT)n repeat to determine if specific
alleles are associated with disease incidence.
38
1.4 BACKGROUND TO THE PROJECT AND AIMS
1.4.1 Background to Project
SLC11A1 has restricted expression to phagocytic cells, where it is localised to the late
endosomal/early lysosomal compartment of the trans-golgi network. Upon pathogen
phagocytosis, SLC11A1 is rapidly recruited to the phagosomal membrane where it
transports divalent cations out of the phagosome. Recruitment of SLC11A1 to the
phagosomal membrane results in the modulation of the adaptive immune system,
increased expression of Th1 pro-inflammatory cytokines and effector molecules. These
pleiotropic effects elicit a Th1 pro-inflammatory immune response to effectively clear
an infection.
The SLC11A1 promoter contains a polymorphic (GT)n microsatellite repeat, which
modulates expression of the gene. Several alleles, differing in the number of (GT)n
repeats, have been identified in the general population. A total of nine alleles have been
characterised to date (designated alleles 1 to 9) of which alleles 2 and 3 are the most
frequently occurring. Allele 3 drives high SLC11A1 expression with a putative
heightened Th1 pro-inflammatory immune response leading to a chronic
hyperactivation of macrophages. While this is beneficial to the process of pathogen
clearance, the increased levels of SLC11A1 expression are thought to predispose
individuals carrying allele 3 to autoimmune disease. In contrast, the presence of allele 2
drives decreased SLC11A1 expression, as compared to allele 3, and thus a decreased
pro-inflammatory immune response. Individuals carrying allele 2 would putatively
exhibit increased susceptibility to infectious disease, but would be protected against
autoimmune disease, as macrophages would be at a lower level of activation. The
-237C/T polymorphism is another SLC11A1 promoter variant which has been shown to
modulate promoter activity. The mechanism for the differential expression levels of
SLC11A1 mediated by different variants at the (GT)n and -237C/T polymorphisms is
currently unknown.
A large number of studies assessing the association between the presence of the specific
(GT)n promoter alleles with the incidence of infectious and autoimmune disease have
39
produced inconsistent associations. These inconsistent associations are attributable to
non-optimal genotyping methods that are time consuming or unable to detect all
variants resulting in the completion of association studies with small sample sizes. In
addition to the small sample sizes, these association studies try to determine whether an
association exists between specific (GT)n alleles and disease incidence without
knowledge of the mechanisms surrounding SLC11A1 transcription. Currently there is a
lack of functional knowledge about the mechanism of SLC11A1 transcription initiation
and transcription factors which regulate SLC11A1 expression. A greater understanding
of SLC11A1 transcription will help to elucidate the mechanism by which different
promoter variants at the (GT)n and -237C/T polymorphisms result in altered SLC11A1
promoter activity to influence disease incidence.
1.4.2 Aims of the Project
The overall aim of this project was to characterise the SLC11A1 promoter and the
mechanisms by which variants at the (GT)n and -237C/T promoter polymorphisms
regulate SLC11A1 expression to influence the incidence of autoimmune and
infectious disease.
This overall aim was addressed through the completion of the following specific aims.
Aim 1: To conduct meta-analyses to determine the strength of the association between
the SLC11A1 polymorphisms and the incidence of autoimmune and infectious diseases.
A large number of studies have assessed the association of specific (GT)n alleles with
the incidence of autoimmune disease. A meta-analysis completed by Nishino et al.
(2005), which found no association with allele 3, but a protective effect of allele 2, only
analysed a small number of the association studies which had been completed. Since
this report, a number of new studies have been published and therefore, a more robust
meta-analysis of the association of the (GT)n promoter polymorphisms with Th1
mediated autoimmune/inflammatory disease was completed. The work presented in
Chapter 3 analyses the association of specific (GT)n alleles with the incidence of
autoimmune/inflammatory disease of studies published between 1991-2006.
40
Since the publication of the meta-analysis assessing the association of the SLC11A1
polymorphisms with tuberculosis incidence (Li et al., 2006), as well as the publication
of the results presented in Chapter 3 assessing the association of specific (GT)n alleles
with the incidence of autoimmune/inflammatory disease, a significant number of new
studies had been completed. Therefore a more inclusive meta-analysis assessing the
association of the SLC11A1 polymorphisms with the occurrence of both infectious and
autoimmune disease was completed (Chapter 7). In addition to the (GT)n promoter
polymorphism, a large number of publications have analysed the association of other
SLC11A1 polymorphisms with the incidence of infectious and autoimmune diseases.
Where a significant number of studies were completed, the association of the
occurrence of these other SLC11A1 polymorphisms with infectious and autoimmune
disease incidence was assessed (Chapter 7).
Aim 2: To develop a specific, rapid and high-throughput methodology to genotype the
SLC11A1 (GT)n and (CAAA)n microsatellite repeats.
Current methods for genotyping the (GT)n promoter microsatellite repeat are timeconsuming, inaccurate, and are not amenable to high throughput analysis, which is
essential for conducting large association studies to determine if an association exists
between the presence of specific SLC11A1 promoter alleles and the incidence of
infectious or autoimmune diseases. The difficulty in developing an accurate, high
throughput methodology for the genotyping of the promoter alleles is due to the subtle
sequence differences between the alleles. Therefore, a high-resolution melt curve
analysis methodology was designed and optimised to enable accurate and highthroughput genotyping of SLC11A1 microsatellite repeats. The design and optimisation
of the high-resolution melt curve analysis methodology is presented in Chapter 4.
Aim 3: To determine the mechanisms by which SLC11A1 is regulated at the level of
transcription initiation.
Aim 4: To determine the mechanism mediating the variation in SLC11A1 expression by
the different SLC11A1 promoter (GT)n microsatellite and -237C/T polymorphisms.
A large number of association and linkage studies have been completed to assess the
association of the SLC11A1 promoter (GT)n and -237C/T polymorphisms with the
occurrence of infectious and autoimmune diseases. A major problem with these studies
is that they try to determine what association exists between the presence of specific
41
functional promoter variants and disease incidence in a blinded fashion. These
association and linkage studies lack fundamental information pertaining to the
mechanisms which influence and regulate SLC11A1 expression, and ultimately the
mechanisms modulating differences in SLC11A1 expression by promoter variants. Thus
there is a basic lack of fundamental understanding regarding the functionality of the
SLC11A1 promoter region.
Using a range of in silico programs, bioinformatic analysis of the SLC11A1 promoter
was completed to define putative important regions involved in SLC11A1 transcription.
Different lengths of the SLC11A1 promoter were then cloned into reporter vectors to
functionally determine the importance of bioinformatically identified putative
transcriptional regulatory regions. Additionally, multiple reporter constructs containing
the same SLC11A1 promoter region were prepared, which differed only by the
functional variants at the (GT)n and -237C/T polymorphisms. The in silico analysis of
the SLC11A1 promoter and the design and preparation of the SLC11A1 promoter
constructs are presented in Chapter 5.
The promoter activity, driven by the different promoter lengths cloned into the reporter
constructs, was determined by transfection into human cells lines, enabling the
identification of important regulatory regions involved in transcription initiation and
expression of SLC11A1 (Aim 3). Furthermore, transfection of promoter constructs
containing the different functional promoter variants enabled the elucidation of the
mechanisms involved in the modulation of SLC11A1 expression by different functional
promoter variants (Aim 4). The important SLC11A1 promoter regions identified were
then further analysed bioinformatically to determine candidate transcription factors
which may be involved in controlling SLC11A1 expression. Analysis of the promoter
activity of the different SLC11A1 promoter constructs transfected into human cell lines
is presented in Chapter 6.
42
CHAPTER 2 – GENERAL MATERIALS &
METHODS
43
2.1 MATERIALS
2.1.1 General Materials and Reagents
Agarose, sodium chloride (NaCl) and Tris base were purchased from Amresco (Ohio,
USA). 5-Bromo-4-Chloro-3-Indolyl B-D-galactopyranoside (X-gal) was obtained from
Astral Scientific (Sydney, Australia). Bacto-tryptone was purchased from BD
Bioscience (New Jersey, USA) and yeast extract was purchased from Fluka (Buchs,
Switzerland). Glacial acetic acid was supplied by Merck (Darmstadt, Germany).
Ammonium persulfate, ampicillin, bromophenol blue, ethidium bromide,
ethylendiaminetetraacetic acid (EDTA), sodium dodecyl sulphate (SDS), spectinomycin
and xylene cyanol were purchased from Sigma-Aldrich (Missouri, USA). The 2X PCR
Master Mix was purchased from Promega (Wisconsin, USA). Purelink PCR Purification
and Quick Plasmid Miniprep kits were purchased from Invitrogen (California, USA).
2.1.2 DNA Size Standards
DNA size standards used in agarose gel electrophoresis (Section 2.2.2.5) consisted of
Hyperladder IV, Hyperladder V (Bioline, London, UK), 100bp and 1Kb ladders (New
England Biolabs, Massachusetts, USA). The sizes of each of the size standards is shown
below (all sizes are in base pairs).
Hyperladder IV
1000, 800, 700, 600, 500, 400, 300, 200, 100
Hyperladder V
500, 400, 300, 250, 200, 175, 150, 125, 100, 75, 50, 25
100bp Ladder
1517, 1200, 1000, 900, 800, 700, 600, 517, 500, 400, 300, 200,
100
1KB Ladder
10002, 8001, 6001, 5001, 4001, 3001, 2000, 1000, 517, 500
44
2.1.3 Oligonucletides
All oligonucleotides were purchased from Sigma Genosys or Invitrogen and obtained in
the lyophilised state. Oligonucleotides were resuspended in TE Buffer (10mM Tris HCl
pH 7.5, 0.1mM EDTA) to produce 200μM stock solutions. Unless otherwise stated,
stock primer solutions were diluted to 20μM working solutions in sterile water. Primer
stock and working solutions were stored at -20oC.
Oligonucleotides, for the amplification of SLC11A1 regions for high resolution melt
curve analysis (Section 4.2.1.2) and the amplification of promoter regions for the
generation of constructs for functional analyses (Section 5.2.1.2), or for the
quantification of SLC11A1 expression levels (Section 6.2.2.5.3), were designed using
the sequence available in the Genbank database under the accession number AF229613.
Primers specific for SLC11A1 were designed using Oligo Version 4 (Molecular Biology
Insights, Colorado, USA) or the Primer program of Lasergene (DNAStar, California,
USA). Where possible, candidate primer sequences were designed to have a GC content
of approximately 50%, no potential primer-primer interactions and no putative
secondary structure. The specific oligonucleotide sequences are reported within the
relevant chapters in which they are used.
45
2.2 METHODS
2.2.1 Sterility and Containment
To prevent contamination and nuclease digestion of genomic DNA (gDNA) and RNA,
all surfaces were washed with 70% ethanol before and after use and all experimental
work was completed wearing gloves. Separate areas were established for DNA
extraction, reagent pipetting and general post-PCR work. A separate set of clean DNAfree pipettes were used for all work to prevent sample cross contamination. All PCRs
were set up using filtered pipette tips to avoid aerosol contamination. All glassware,
pipette tips, centrifuge tubes and solutions were autoclaved before use, or purchased as
certified DNase/RNase free.
2.2.2 DNA Techniques
2.2.2.1 PCR 1 – General PCR
The general PCR amplification protocol was used to produce SLC11A1 fragments
containing the (GT)n and (CAAA)n alleles for cloning into plasmids used for high
resolution melt analysis (Section 4.2.2.3), verification of designed HRM amplicons
(Section 4.3.1.2), validation of gDNA collection methods (Section 4.3.4.2 and 4.3.4.3),
and validation of the introduction of the mutant -237 T nucleotide after in vitro sitedirected mutagenesis (Section 5.2.2.2.4). PCR amplification was carried out in a total
volume of 50μl, which contained 1X PCR mix (1.25U Taq polymerase, 200μM dNTP
and 1.5mM MgCl2), 20μM of each of the forward and reverse primers, and 0.1ng
plasmid DNA or a 2mm micropunch from an FTA card carrying immobilised gDNA.
Each PCR experiment included a negative control in which sterile water or a
micropunch from an unused FTA card replaced template DNA. The reactions were
mixed well and briefly centrifuged. The PCR was carried out using an Eppendorf
Mastercycler Gradient instrument (Eppendorf). The PCR was initiated by denaturation
(95oC, 5min), followed by 34 cycles of denaturation (95oC, 30s), primer annealing
(56oC, 30s) and extension (72oC, 40s), followed by a final extension step (72oC, 10min).
After the completion of the PCR, the efficiency and fidelity of amplification was
assessed by agarose gel electrophoresis (Section 2.2.2.5) of an aliquot (10-15μl) of the
PCR product in a 1.2% (w/v) agarose gel.
46
2.2.2.2 Purification of PCR Products
PCR products to be used for cloning (Sections 4.2.2.3, 5.2.2.2.1 and 5.2.2.2.6),
restriction digestion (Section 5.2.2.2.8), or sequencing (Section 2.2.2.6) were purified
using the Purelink PCR Purification kit, according to the manufacturer’s instructions.
DNA was eluted in 50μl of elution buffer. After purification, 5μl of the purified DNA
was electrophoresed in 1.5% (w/v) agarose gels (Section 2.2.2.5). The concentration of
DNA was determined using the NanoDrop 1000 (Thermo Scientific, Massachusetts,
USA) (Section 2.2.2.7). Purified PCR products were stored at -20oC, until required.
2.2.2.3 Restriction Enzyme Digestion
Restriction enzyme digestion was used to verify cloned plasmid inserts (Sections 4.2.2.3
and 5.2.2.2.8), verify base changes after in vitro site-directed mutagenesis (Section
5.2.2.2.4), and for the production of the plasmid emp-bla(M) (Section 5.2.2.2.9).
Bioinformatic analyses of known restriction sites were conducted to select appropriate
restriction enzymes (Section 2.2.4.1). Restriction enzyme digestions were carried out in
a total volume of 20μl, which contained the appropriate restriction buffer and 1-5U of
the relevant restriction enzyme, according to the manufacturer’s instructions. Each
digest contained either 15μl of PCR product, or 1μg of purified cloned plasmid DNA.
Restriction digests were allowed to proceed at 37oC for 3-5h. Restriction fragments
were separated by agarose gels electrophoresis (Section 2.2.2.5).
2.2.2.4 Small-Scale Preparation of Plasmid DNA (‘mini’-prep)
After overnight (O/N) growth (37oC, with agitation [220rpm]) of isolated transformants
containing recombinant plasmids (Sections 2.2.3.2 and 2.2.3.3), plasmid DNA was
extracted from 3ml of the cell culture. Cells were collected by centrifugation (10000g,
2min) and plasmid DNA was isolated and purified from the cells using the Purelink
Quick Plasmid Miniprep kit, following the manufacturer’s instructions. The plasmid
DNA was eluted from the spin column in 75μl of TE buffer. Plasmid yield and quality
was determined by electrophoresis of the purified plasmid in 1.4% (w/v) agarose gels
(Section 2.2.2.5) and NanoDrop quantitation (Section 2.2.2.7). Isolated recombinant
plasmids were stored at -20oC, until required.
47
2.2.2.5 Agarose Gel Electrophoresis
Horizontal agarose gel electrophoresis was carried out to determine the concentration
and quality of purified PCR products (Section 2.2.2.2) and isolated gDNA (Section
4.2.2.1.3), to confirm the size of PCR products (Section 2.2.2.1) or cloned fragments
(Section 2.2.2.4), and to resolve restriction enzyme digestion products (Section 2.2.2.3).
Agarose gels varied from 0.8% (w/v) to 1.6% (w/v), depending on the expected size of
the products to be separated. Gels were electrophoresed submerged in 1X Tris acetic
acid EDTA (TAE) buffer (40mM Tris, 20mM glacial acetic acid, 1mM EDTA) and
contained 0.5μg/ml ethidium bromide. Loading buffer (0.2-0.3 vol) (60% sucrose,
50mM Tris-HCl pH 8.0, 10mM EDTA and 0.01% (w/v) bromophenol blue) was added
to all samples prior to electrophoresis. A molecular weight standard (Section 2.1.2) was
electrophoresed with all samples to determine the sizes of fragments. Gels were
electrophoresed at 70-80V for 30-60min and DNA fragments visualised by UV
transillumination using a Uvitech UV transilluminator. Images were captured using a
Kodak EDAS 290 digital camera.
2.2.2.6 DNA Sequencing
Sequencing was completed to verify PCR amplicons (Sections 4.3.1.2 and 5.3.2.1.1)
and recombinant plasmid DNA (Sections 5.2.2.2.5 and 5.2.2.2.8), and for the
determination of genotypes of the SLC11A1 (GT)n and (CAAA)n microsatellite
polymorphisms (Section 4.3.4.5). Purified PCR product (Sections 2.2.2.2 and 5.2.2.2.2)
or plasmid DNA samples (Section 2.2.2.4) were sequenced at the Sydney University
and Prince Alfred Molecular Analysis Centre (SUPAMAC, University of Sydney). All
samples were completely sequenced on both strands. DNA and primer quantities were
prepared for sequencing according to the instructions of SUPAMAC. Sequencing data
was analysed using Chromas Version 2.13 and the Lasergene program Seqman (Section
2.2.4.2).
2.2.2.7 Determination of DNA Concentration
The concentration of PCR amplicons (Sections 2.2.2.1, 4.2.2.4.3 and 5.2.2.2.2),
recombinant plasmids (Sections 2.2.2.4 and 5.2.2.3.1), gDNA (Section 4.2.2.1.3), and
RNA (Section 6.2.2.5.1) was determined by spectrophotometry using the NanoDrop
48
1000 (Thermo Scientific, Massachusetts, USA). The concentration was determined from
a 1μl aliquot, according to the manufacturer’s protocol.
2.2.3 Microbiological Techniques
2.2.3.1 Luria Bertani Medium
Luria Bertani (LB) medium consisted of 5g/l yeast extract, 10g/l bacto-tryptone and
10g/l NaCl. Media for plates contained 15g/l agarose, which was added prior to
autoclaving. Media for antibiotic selection plates contained 100μg/ml spectinomycin or
ampicillin, which was added after the autoclaved media was cooled to less than 55oC.
Set media plates were stored at 4oC, until required. Liquid cultures contained 70100μg/ml spectinomycin or ampicillin.
2.2.3.2 Cloning of PCR Products
Purified PCR products (Sections 2.2.2.2 and 5.2.2.2.2) were cloned using the TOPO TA
cloning system (Invitrogen) using the relevant plasmid (pCR8/GW/TOPO or
pGeneBLAzer-TOPO), following the manufacturer’s instructions. Purified PCR
products were cloned into the appropriate TOPO vector. Topoisomerase-mediated
ligation was carried out in a 5μl reaction volume, of which 3μl was subsequently
transformed into E.coli TOP10 or MAX Efficiency DH5α-T1R competent cells,
according to the manufacturer’s instructions. A pUC19 (10pg) transformation was
always included as a control to determine viability of the competent cells. Transformed
cells were plated on LB plates containing 100μg/ml spectinomycin or ampicillin and Xgal (1mg/plate). Cells were plated at 4 different volumes (10, 25, 50 and 100μl). Cells
were grown by O/N incubation at 37oC, after which positive colonies, containing
recombinant plasmids, were selected for growth (Section 2.2.3.3) and plasmid DNA
isolation (Section 2.2.2.4).
2.2.3.3 Isolation and Culture of Positive Colonies
After O/N growth of plated transformants (Section 2.2.3.2), 6-10 white (insertcontaining) individual colonies were selected for each sample and grown in 5ml of LB
medium (Section 2.2.3.1), containing 100μg/ml of spectinomycin or amplicillin. Cells
49
were grown O/N at 37oC with agitation (220rpm). Recombinant plasmid DNA was then
isolated from 3ml of cultured cells (Section 2.2.2.4).
2.2.4 Bioinformatics
2.2.4.1 Restriction Mapping
Restriction mapping was completed for the selection of appropriate restriction enzymes
for the verification of recombinant plasmids produced (Sections 4.2.2.3 and 5.2.2.2.8),
verification of base changes induced by in vitro site-directed mutagenesis (Section
5.2.2.2.4), and production of the emp-bla(M) plasmid (Section 5.2.2.2.9). Restriction
maps of the SLC11A1 nucleotide sequence (accession number AF229163) were
generated using the SeqBuilder program (Lasergene, DNAStar) or SLC11A1 SeqBuilder
cloning file (Section 5.2.2.1.1). Appropriate restriction enzyme(s) were then selected for
restriction enzyme digestion (Section 2.2.2.3).
2.2.4.2 Analysis of Sequence Data
Sequencing data (Section 2.2.2.6) was obtained in the form of raw sequence data and
sequencing electrophoregrams. The electrophoregrams were analysed using the program
Chromas Version 2.13. Both the forward and reverse sequences of PCR amplicons, or
recombinant plasmid DNA, were imported into the Lasergene program SeqMan
(DNAstar, Wisconsin, US), and aligned with a known sequence which was included for
comparison (generated from AF229163). Any discrepancies in the alignments of the
sample sequences with the known sequence were resolved by analysing the
corresponding electrophoregrams.
50
CHAPTER 3 – ASSOCIATION OF SLC11A1
PROMOTER POLYMORPHISMS WITH THE
INCIDENCE OF AUTOIMMUNE AND
INFLAMMATORY DISEASES: A METAANALYSIS
51
3.1 PREFACE
The work completed in this chapter describes details of a published meta-analysis
assessing the association of the (GT)n alleles with the incidence of
autoimmune/inflammatory disease, of which I was a major contributor to the conception
and completion of the study. The findings presented in this chapter were published in
2008 in the Journal Autoimmunity (issue 31 pgs 42-51) of which I was a co-author. This
meta-analysis was conducted to indicate the effect of the SLC11A1 (GT)n repeat on
disease occurrence (using all available data at the time of completion), to determine
whether it was worthwhile to conduct further functional analyses on how SLC11A1
promoter variants may influence disease incidence.
3.2 INTRODUCTION
The solute carrier family 11a member 1 (SLC11A1) protein, formerly known as
NRAMP1 (natural resistance associated macrophage protein 1), is localised within the
acidic endosomal and lysosomal compartment of resting macrophages (CanonneHergaux et al., 2002, Govoni et al., 1999, Gruenheid et al., 1997, Searle et al., 1998).
SLC11A1 functions as a divalent cation transporter, which regulates (Atkinson et al.,
1997), and is regulated by (Atkinson et al., 1997), intracellular ion concentrations,
notably iron. The pathogenicity of a broad range of intracellular parasites is dependent
upon the availability of iron (Bullen, 1981, Payne, 1993), and phagosomal proteins that
are associated with susceptibility or resistance to infections with intracellular pathogens,
often function as iron transporters. SLC11A1 contributes to the antimicrobial functions
of macrophages by extruding essential metal ions from the phagosome, through
H+/metal ion co-transport to directly influence the microenvironment of the phagosome,
thereby depriving micro-organisms of essential growth factors (Atkinson and Barton,
1999, Biggs et al., 2001, Forbes and Gros, 2001, Forbes and Gros, 2003, Gomes and
Appelberg, 1998, Jabado et al., 2000, Mulero et al., 2002, Supek et al., 1997, Wyllie et
al., 2002). The competition for divalent metal cations between host and pathogen may
ultimately regulate host susceptibility to infection (Agranoff and Krishna, 1998).
SLC11A1 exerts pleiotropic effects on macrophage function, including increased
expression of inducible nitric oxide synthase (iNOS) and subsequent generation of nitric
oxide (NO), upregulation of MHC class II expression and enhanced antigen presentation
52
to T cells, increased production of pro-inflammatory cytokines (notably IL-1E and TNFD), production of reactive species involved in oxidative burst, and upregulation of KC (a
C-X-C chemokine, belonging to the IL-8 family, that is chemotactic for neutrophils)
(Blackwell, 1996, Blackwell et al., 1994, Karupiah et al., 2000, Radzioch et al., 1994,
Roach et al., 1994, Skamene, 1994, Zwilling et al., 1987). Expression of Slc11a1 in the
late endosomal/lysosomal compartments of murine DCs has been recently reported
(Stober et al., 2007). Within DCs, Slc11a1 modulates cytokine (IL-10 and IL-12) and
MHC class II expression and antigen processing for presentation to T cells.
Collectively, these pleiotropic effects generate a Th1 immune response bias, which is
important for both resistance to infection as well as the induction and maintenance of
autoimmunity and inflammation.
The SLC11A1 gene, located on chromosome 2q35, is approximately 14 kb in length and
contains 15 exons (Figure 1.6). In humans, a (GT)n microsatellite repeat polymorphism,
with a high potential for Z-DNA formation (Bayele et al., 2007), exists in the promoter
region. The Z-DNA conformation is thought to modulate chromatin structure and, as a
consequence, accessibility of transcription factors to gene sequences (Ha et al., 2005,
Liu et al., 2006). A total of 9 SLC11A1 (GT)n promoter alleles have been described
(designated alleles 1-9) (Blackwell et al., 1995, Graham et al., 2000, Kojima et al.,
2001, Zaahl et al., 2004) and expression of SLC11A1 is modulated by the number of
(GT)n repeats in the promoter. Of the 9 alleles identified, alleles 2 and 3 predominate
and exert opposing effects on SLC11A1 expression levels (Searle and Blackwell, 1999,
Zaahl et al., 2004). Allele 3, the most common promoter allele with a variable
frequency of 0.65-0.85, depending upon geography and ethnicity (Awomoyi, 2007), has
9 GT repeats [t(gt)5ac(gt)5ac(gt)9g] and drives high SLC11A1 expression [41, 42]. Allele
2, containing 10 repeats [t(gt)5ac(gt)5ac(gt)10g], occurs at a frequency of 0.10-0.30
(Awomoyi, 2007). This allele drives low expression of SLC11A1.
This sequence-dependent modulation of gene expression is further influenced by proinflammatory cytokine stimuli. In the presence of the pro-inflammatory stimulus LPS, a
significant reduction in the expression driven by allele 2, and enhancement of
expression driven by allele 3, is observed (Searle and Blackwell, 1999). This suggests
that the juxtaposition of LPS response elements (nuclear factor kappa B, activator
protein 1 like or NF-IL-6) may be differentially affected by the two most commonly
53
occurring alleles. Consistent with these functional effects and given the important role
of macrophage function in the modulation of adaptive immune responses, alleles 2 and
3 have been inversely associated with susceptibility to autoimmune or infectious
disease. It has been proposed that the presence of allele 3, which drives high SLC11A1
expression with consequent classical (M1) activation of macrophages and proinflammatory responses, promotes efficient resolution of infection, but is associated
with autoimmunity and inflammation (Dubaniewicz et al., 2005, Kotze et al., 2001,
Maliarik et al., 2000, Sanjeevi et al., 2000, Zaahl et al., 2005). In driving low
expression levels of SLC11A1, allele 2 has been functionally linked to infectious disease
susceptibility (Awomoyi et al., 2002, Bellamy et al., 1998, Gao et al., 2000, Hoal et al.,
2004, Ma et al., 2002), but putatively affords protection against autoimmunity and
inflammation (Nishino et al., 2005, Sanjeevi et al., 2000, Takahashi et al., 2004).
Therefore, polymorphic variants of SLC11A1 may provide an important link between
gene expression, function and susceptibility to disease. In addition to its functional
candidacy as a disease marker, SLC11A1 is also a positional candidate for some
autoimmune diseases, such as T1D, due to its location within a disease susceptibility
locus (Esposito et al., 1998, Todd et al., 1996).
At the time of completion of this meta-analysis, studies of the association of SLC11A1
polymorphisms and disease susceptibility showed inconsistent relationships between the
presence of a given SLC11A1 (GT)n promoter allele and the incidence of autoimmune or
inflammatory diseases. The contradictions were determined to be attributable, in part, to
limited statistical power (associated with small sample sizes), selection bias and/or
population diversity. Meta-analyses are powerful and robust analytical tools for the
estimation of genetic effects as they increase the effective sample size under
investigation, thereby reducing the effects of some of the methodological limitations
associated with individual studies (Lohmueller et al., 2003). In this study, the literature
was systematically reviewed to provide quantitative and summary estimates of the
association between SLC11A1 (GT)n promoter alleles 2 and 3 and the incidence of
autoimmune and inflammatory diseases.
54
3.3 METHODS
3.3.1 Data Collection
Relevant publications were identified through a literature search using the keywords
(“NRAMP1” or “SLC11A1”) and (“autoimmune”or “autoimmunity” or “inflammation”
or “inflammatory”) in the Medline, Pubmed and Ovid literature databases. Additional
literature was collected from cross-references within both original and review articles.
Publication dates were restricted to the period from January 1991 to December 2006,
inclusive. Criteria for the inclusion of papers were that publications analysed
polymorphisms within the SLC11A1 gene in patients diagnosed with specific
autoimmune or inflammatory diseases according to clinical criteria, with non-familial
subjects used as study controls. For each publication, total study numbers (individuals
and alleles) and allelic frequencies (numbers and percentages) were tabulated according
to case and control groups. Data regarding the geographical location, disease
investigated, diagnostic criteria, sources of control subjects, SLC11A1 polymorphisms
analysed, genotyping methodology, and identified associations with specific SLC11A1
polymorphisms and the incidence of disease were also extracted from each publication
(Table 3.1).
If original genotype frequency data was unavailable in relevant articles, a request for
additional data, to enable calculation of odds ratios (ORs), was sent to the
corresponding author. The suitability of each publication for inclusion against the
selection criteria was assessed and data was extracted. One study, investigating the
association of polymorphic (GT)n promoter alleles with the incidence of rheumatoid
arthritis in Canadian (Caucasoid) subjects (Singal et al., 2000), was excluded as
additional data to allow calculation of ORs was unavailable. This study analysed 88
cases and 92 controls and found no association between the frequency of any of the
(GT)n promoter alleles and disease incidence. Data from one study investigating an
association between the incidence of T1D and the presence of specific SLC11A1
promoter alleles (Bassuny et al., 2002) were only suitable for allele 2 analyses as
insufficient data pertaining to the frequencies of allele 3 was provided and the necessary
data was not forthcoming. However, Bassuny et al. (2002) reported that the frequency
of (GT)n allele 3 was not significantly different between cases and controls.
55
Table 3.1 Details of Individual Association Studies of SLC11A1 (GT)n Promoter
Polymorphisms and Autoimmune/Inflammatory Disease.
Study
Graham et al ., 2000
Maliarik et al ., 2000
Sanjeevi et al ., 2000
Yang et al ., 2000a
Kojima et al ., 2001
Kotze et al ., 2001
Bassuny et al ., 2002
Rodriguez et al ., 2002
Comabella et al ., 2004
Takahashi et al ., 2004
Crawford et al ., 2005
Dubaniewicz et al ., 2005
Nishino et al ., 2005
Zaahl et al ., 2006
Disease
Primary biliary cirrhosis
Sarcoidosis
Juvenile rheumatoid arthritis
Rheumatoid arthritis
Inflammatory bowel disease
Multiple sclerosis
Type 1 diabetes
Rheumatoid arthritis
Multiple sclerosis
Type 1 diabetes
Inflammatory bowel disease
Sarcoidosis
Type 1 diabetes
Inflammatory bowel disease
Population
English
African Americans
Latvian/Russian
Korean
Japanese
South African
Japanese
Spanish
Spanish
Japanese
Caucasian
Polish
Japanese
South African (mixed)
(GT)n Allele Associated
Allele 5
Allele 3 (allele 2 protective)
Allele 3 (allele 2 protective)
No association
Allele 7
Allele 5
Allele 2 protectiveb
c
Allele 2 protective
No association
Allele 7 (allele 2 protective)d
No association
Allele 3
Allele 2 protectivee
Allele 3f
a
Unless otherwise stated, the specified allele was positively associated with the incidence of disease.
Frequency of allele 2 slightly lower, albeit not significantly, in the early onset (2-10 years) cohort than in controls.
c
Only when patients and controls stratified according to MHC risk alleles.
An increase in 2/2 genotype frequency among patients carrying MHC risk alleles compared to controls.
Frequency of patients with allele 3 significantly decreased among patients without MHC risk alleles compared to controls also not carrying MHC risk.
d
Allele 2 significantly lower when data analysed using 2 test, but not after Bonferroni multiple adjustment.
e
In all diabetic patients, allele 2 was less frequent and allele 3 was more frequent, albeit not significantly, than in controls.
Decreased frequency of allele 2 only among patients with early-onset (<11 years) compared to late onset (>11 years) patients and control subjects.
f
No statistically significant differences when comparing (GT) n promoter alleles in patients and controls,
except when data stratified according to the presence of the -237C/T polymorphism in association with allele 3.
b
3.3.2 Statistical Analyses
Using data for the (GT)n promoter polymorphisms extracted from the relevant
publications (or obtained by personal communication with authors), the ORs and 95%
confidence intervals (CIs) were calculated. Although nine different alleles of the (GT)n
promoter polymorphism have been reported (Blackwell et al., 1995, Graham et al.,
2000, Kojima et al., 2001, Zaahl et al., 2004), 7 of these alleles (alleles 1 and 49)
occur at extremely low frequencies among all populations studied. Accordingly, studies
have focused on the association of allele 2 or 3 with disease incidence. Therefore,
frequency data for alleles 1, 2 and 49 were pooled and compared to frequencies for
allele 3 among cases and controls. Similarly, data for the frequencies of alleles 1 and
39 were pooled and compared to frequencies for allele 2 among cases and controls.
Odds ratios were used as the measure of disease risk associated with the presence of
particular alleles and all data were corrected for consistency in the direction of the
ratios. For example, an OR > 1 indicated that an increased disease risk was associated
with the presence of the particular (GT)n promoter repeat (allele 3 or allele 2).
Conversely, an OR < 1 was indicative of reduced disease risk in the presence of the
specific allele. Pooled OR values were first calculated by the fixed effects model
56
(inverse variance method) in which the estimated OR is a weighted average of the
individual study values (Zhao et al., 2006). The Q statistic was used to test for
homogeneity in the data set (Zhao et al., 2006). If the Q statistic was statistically
significant (p < 0.05) for a data set, then the random effects pooled OR, which is more
representative of the true biological effect, was calculated (Sterne et al., 2001).
Alternatively, if the data set was not significantly heterogeneous (Q statistic; p > 0.05),
then the fixed effects pooled OR was used.
To test for publication, small-study and other biases in the data set (Egger et al., 1997),
a funnel plot was constructed using the log-base-10 of the ORs versus the reciprocal of
their standard errors. Asymmetry in the resulting plot was confirmed by Egger’s linear
regression test of funnel plot asymmetry (Egger et al., 1997). Whilst this test can have a
high Type I error rate under certain circumstances (Deeks et al., 2005), it is generally
advised that a test of bias be routinely performed on meta-analyses, whilst treating the
results of such tests with caution due to this tendency for false positive findings (Sterne
et al., 2001). Although the funnel plot-based test performed in the present study is
commonly used to indicate literature bias in data sets, claims resulting from this analysis
were only considered indicative of asymmetry rather than publication bias (Terrin et al.,
2005). The rank correlation method (Begg and Mazumdar, 1994) was not used due to its
demonstrated low power to detect bias (Sterne et al., 2001).
The trim-and-fill method was used to estimate the number of hypothetical studies that
were not present in the data set, due to publication bias, and to estimate what the pooled
ORs would be if these additional studies had been available (Duval and Tweedie,
2000a). The procedure used was based on an iterative procedure using a consensus of
the three estimators of additional relevant studies presented by the authors. It is
acknowledged that the use of this technique can lead to overestimation of ‘missing’
studies in some instances (Duval and Tweedie, 2000b), however its inclusion in the
present study was valuable to provide an estimate of the ORs should symmetrical data
sets have been available. Whilst no claims are made regarding the potential accuracy or
otherwise of these estimates, they are presented as an indication of the magnitude of the
change that occurs in the ‘uncorrected’ ORs when asymmetry is minimised in the
datasets. Thus, either fixed or random effects pooled ORs, both before and after the
trim-and-fill procedure are presented for comparison.
57
3.4 RESULTS
A total of 15 data sets were used in this meta-analysis to determine the likely
association of the two predominant SLC11A1 (GT)n promoter alleles with autoimmune
or inflammatory disease (Table 3.1). An analysis of all the available allele 3 data
produced an OR < 1.0 (pooled OR = 0.88, 95% = 0.65) (Table 3.2), suggesting that the
presence of allele 3 is unlikely to be associated with an increased risk of autoimmune or
inflammatory disease. Analysis of the allele 2 data also showed an OR < 1.0 (fixed
effects pooled OR = 0.90, 95% CI = 0.24) (Table 3.3), indicating that the presence of
allele 2 may exert a weak protective effect against the development of autoimmune or
inflammatory disease. A protective effect of SLC11A1 promoter allele 2 against
autoimmune disease has been previously observed in a smaller meta-analysis
incorporating 7 individual case-control studies (Nishino et al., 2005). The findings of
the present meta-analysis corroborate this study, which reported a fixed effects pooled
OR of 0.71 (95% CI = 0.53-0.96) for allele 2. However, statistical estimates of
publication bias were not included in this study and not all of the available data
examining an association between SLC11A1 (GT)n promoter polymorphisms and
autoimmune disease were included (Nishino et al., 2005).
Table 3.2 SLC11A1 Allele 3 Frequencies (Case Versus Controls) of all the Individual
Studies used in the Meta-Analysis.
Population
Inflammatory bowel disease
Crawford et al ., 2005
Kojima et al ., 2001
Zaahl et al ., 2006
Zaahl et al ., 2006
Zaahl et al ., 2006
Multiple sclerosis
Comabella et al ., 2004
Kotze et al ., 2001
Primary biliary cirrhosis
Graham et al ., 2000
Rheumatoid Arthritis
Rodriguez et al ., 2002
Yang et al ., 2000a
Juvenile rhumatoid arthritis
Sanjeevi et al ., 2000
Sarcoidosis
Dubaniewicz et al ., 2005
Maliarik et al ., 2000
Type 1 diabetes
Nishino et al ., 2005
Takahashi et al ., 2004
Study Numbers
Allele Frequencies
n (# people)
2n (# alleles)
Case Control
Case Control
Allele 3 +
Case Control
Allele Frequencies
Allele 3 -
Allele 3 +
Case Control
Case Control
OR (95% CI)
Allele 3 Case Control
Caucasian
Japanese
European/African
European
African
277
215
77
16
9
90
324
110
57
25
554
430
154
32
18
180
648
220
114
50
423
317
118
27
16
136
520
176
89
42
131
113
36
5
2
44
128
44
25
8
76
74
77
84
89
76
80
80
78
84
24
26
23
16
11
24
20
20
22
16
0.96 (0.65-1.42)
1.45 (1.08-1.93)
1.22 (0.74-2.01)
0.66 (0.23-1.89)
0.66 (0.13-3.43)
Spanish
African
195
104
125
329
390
208
250
658
260
160
178
434
130
48
72
224
67
77
71
66
33
23
29
34
1.24 (0.88-1.75)
0.58 (0.41-0.83)
53
78
106
156
70
110
36
46
66
71
34
29
1.23 (0.72-2.09)
Spanish
Korean
141
74
194
50
282
148
388
100
189
115
277
80
93
33
111
20
67
78
71
80
33
22
29
20
1.23 (0.88-1.71)
1.15 (0.61-2.14)
British
Latvian/Russian
119
111
238
222
201
155
37
67
84
70
16
30
0.43 (0.27-0.67)
Polish
African American
86
157
91
112
172
314
182
224
144
253
136
157
28
61
46
67
84
81
75
70
16
19
25
30
0.57 (0.34-0.97)
0.57 (0.38-0.84)
Japanese
Japanese
114
95
130
224
228
190
260
448
187
150
205
359
41
40
55
89
82
79
79
80
18
21
21
20
0.82 (0.52-1.28)
1.08 (0.71-1.64)
"+" and "-" indicate the presence of allele 3 or the absence of allele 3, respectively.
58
Table 3.3 SLC11A1 Allele 2 Frequencies (Case Versus Controls) of all the Individual
Studies used in the Meta-Analysis.
Population
Inflammatory bowel disease
Crawford et al ., 2005
Kojima et al ., 2001
Zaahl et al ., 2006
Zaahl et al ., 2006
Zaahl et al ., 2006
Multiple sclerosis
Comabella et al ., 2004
Kotze et al ., 2001
Primary biliary cirrhosis
Graham et al ., 2000
Rheumatoid Arthritis
Rodriguez et al ., 2002
Yang et al ., 2000a
Juvenile rhumatoid arthritis
Sanjeevi et al ., 2000
Sarcoidosis
Dubaniewicz et al ., 2005
Type 1 diabetes
Bassuny et al ., 2002
Nishino et al ., 2005
Takahashi et al ., 2004
Study Numbers
Allele Frequencies
n (# people)
2n (# alleles)
Case Control
Case Control
Allele 2 +
Case Control
Allele Frequencies
Allele 2 -
Allele 2 +
Case Control
Case Control
OR (95% CI)
Allele 2 Case Control
Caucasian
Japanese
European/African
European
African
277
215
77
16
9
90
324
110
57
25
554
430
154
32
18
180
648
220
114
50
131
65
34
5
2
42
96
42
23
8
423
365
120
27
16
138
552
178
91
42
24
15
22
16
11
23
15
19
20
16
76
85
78
84
89
77
85
81
80
84
0.98 (0.66-1.46)
0.98 (0.69-1.37)
0.83 (0.50-1.38)
1.36 (0.47-3.93)
1.52 (0.29-7.96)
Spanish
African
195
104
125
329
390
208
250
658
127
41
71
223
263
167
179
435
33
20
28
34
67
80
72
66
0.82 (0.58-1.16)
2.09 (1.43-3.05)
53
78
106
156
28
42
78
114
26
27
74
73
1.03 (0.59-1.79)
Spanish
Korean
141
74
194
50
282
148
388
100
91
25
108
18
191
123
280
82
32
17
28
18
68
83
72
82
0.81 (0.58-1.13)
1.08 (0.55-2.10)
Latvian/Russian
119
111
238
222
37
65
201
157
16
29
84
71
2.25 (1.43-3.54)
86
91
172
182
28
46
144
136
16
25
84
75
1.74 (1.03-2.94)
206
114
95
200
130
224
412
228
190
400
260
448
49
21
22
65
36
69
363
207
168
335
224
379
12
9
12
16
14
15
88
91
88
84
86
85
1.44 (0.96-2.14)
1.58 (0.90-2.80)
1.39 (0.83-2.32)
British
Polish
Japanese
Japanese
Japanese
"+" and "-" indicate the presence of allele 2 or the absence of allele 2, respectively.
Use of the Q statistic (Zhao et al., 2006) indicated that the data available for allele 2
(Table 3.3) was not significantly heterogeneous (p > 0.05). Consequently, random
effects analysis was not required and the fixed effects pooled OR was determined for
the data set (Zhao et al., 2006). However, unlike allele 2, the data for allele 3 was
determined to be significantly heterogeneous (Q statistic; p < 0.05).
Asymmetry in the data set was determined by both the empirical assessment of the
funnel plot of this data (Figure 3.1) and the application of Egger’s linear regression test.
Examination of the funnel plots generated revealed asymmetry in the allele 2 data set
(Figure 3.1A). While a significant number of association studies have reported an OR >
1.0 (Table 3.3, Figure 3.1A), the fixed effects pooled OR determined here was < 1.0.
This result is likely attributable to the weighting factor, which takes into account sample
size. The trim-and-fill analysis indicated that there were 4 hypothetical studies ‘missing’
from the allele 2 data set. When these hypothetical studies were ‘filled’ into the data set,
the resulting fixed effects pooled OR was still < 1 (0.80 with 95% CI = 0.22).
In the present meta-analysis, the random effects pooled OR for allele 3 (Table 3.2),
before the trim-and-fill analysis was applied, was 1.04 (95% CI = 0.20). This suggested
that the presence of SLC11A1 (GT)n promoter allele 3 was weakly associated with a
higher incidence of autoimmune and inflammatory disease, albeit with a 95% CI that
included 1.0. However, the data for allele 3 was significantly heterogeneous (Q statistic;
59
6
(A)
6
(B)
5
3
4
1/SEM
1/SEM
4
3
2
2
1
1
0
0
0.1
5
1
OR
10 0.1
1
OR
10
Figure 3.1 Funnel plots from the analysis of the association of (GT)n alleles with the
occurrence of autoimmune disease. Funnel plots of allele 2 (A) and allele 3 (B), in
which the odds ratio (OR) for each study was plotted against the reciprocal of its
standard error (SEM). The dashed lines indicate the fixed (A) and random (B) effects
pooled ORs, and the bars under the horizontal axis represent the 95% confidence
intervals (CIs) of the ORs.
p < 0.05) and asymmetric (Figure 3.1B). It was further determined, using the trim-andfill method, that the asymmetry in the data set for allele 3 was largely attributable to 6 of
the 15 studies available. These 6 studies were then used in the trim-and-fill method to
estimate the OR, in the absence of asymmetry in the data set, when the ‘mirror images’
of these studies were returned to the data set. When the hypothetical studies were
‘filled’ into the data set, this analysis resulted in a random effects pooled OR of 0.88
(95% CI = 0.66), thus substantially reversing the conclusion drawn from the unmodified
data set. The results of the trim-and-fill procedure indicated the presence of substantial
asymmetry in the available data related to the relationship between the presence of this
allele and disease, which may lead to misinterpretation of any influence present. The
existing data related to the association of SLC11A1 promoter allele 3 with autoimmune
and inflammatory diseases cannot conclusively support or refute the claim that this
(GT)n microsatellite is associated with a higher risk of disease. It is unknown whether
this asymmetry is related to publication bias, ‘small study’ bias or some other effect,
and no speculation will be made in this regard. However, it can be concluded that if the
allele 3 (GT)n microsatellite does exert an effect on the incidence of disease, then the
magnitude of that effect will be small. Even if the assumption is made that there is no
bias present in the data, which appears unlikely given the asymmetric funnel plot
(Figure 3.1B), the 95% CI for the pooled OR includes 1, thus indicating that any effect
present is of minor magnitude.
60
At the time this study was conducted, individual association studies investigating
SLC11A1 polymorphism frequencies other than the (GT)n promoter microsatellite were
very few in number and there was insufficient power to yield statistically valid analyses.
Whilst there was insufficient data for any of these polymorphisms to allow meaningful
meta-analyses, it is worthwhile noting that a high degree of inconsistency was observed
in the direction of the ORs in the different study populations for each of the
polymorphisms analysed. What is explicit after examination of this data is that the
knowledge base on the effects of these polymorphisms is far from at a stage where
generalisations can be made with any degree of accuracy.
61
3.5 DISCUSSION
Due to their opposing effects on SLC11A1 expression, promoter alleles 2 and 3 have
been hypothesised to be associated with influencing the occurrence of autoimmune or
infectious disease. The presence of allele 3, which drives high SLC11A1 expression and
consequent increased activation of macrophages, is thought to be associated with the
development of autoimmunity and inflammation (Dubaniewicz et al., 2005, Kotze et al.,
2001, Maliarik et al., 2000, Sanjeevi et al., 2000). Conversely, in driving low
expression levels of SLC11A1, allele 2 has been linked to protection against
autoimmunity/inflammatory disease (Nishino et al., 2005, Sanjeevi et al., 2000,
Takahashi et al., 2004). A number of association studies have been conducted to test
this hypothesis, but the associations observed have been variable. Meta-analyses are a
means of increasing the effective sample size under investigation through the pooling of
data from individual association studies, thus enhancing the statistical power of the
analysis for the estimation of genetic effects. At the time of completion, this metaanalysis represented the largest body of data analysed (15 data sets) analysing the
association between variants at the (GT)n repeat and the incidence of
autoimmune/inflammatory disease.
The results of the present meta-analysis suggest that, given the current published
association studies, the presence of allele 3 is unlikely to be strongly associated with an
increased incidence of autoimmune and inflammatory diseases. In fact, when the data
was analysed to account for heterogeneity within the data set, the random effects pooled
OR was reduced to a value that was less than 1.0 (0.88), indicating a decreased
incidence of autoimmune and inflammatory diseases in the presence of allele 3. This
substantially reverses the original hypothesis that the presence of SLC11A1 promoter
allele 3 would confer increased risk of autoimmunity and inflammation. It would appear
that allele 3 may, under certain circumstances, possibly exert a protective effect against
disease development. Interestingly, the allele 2 data indicated a predominance of disease
in the absence of allele 2 among cases, suggesting that the presence of allele 2 may be
associated, albeit weakly, with decreased susceptibility to autoimmune and
inflammatory diseases. These findings corroborate those of a smaller meta-analysis in
which no association between allele 3 and the incidence of autoimmune disease was
reported (Nishino et al., 2005).
62
While a pro-inflammatory milieu, generated by macrophages that become
hyperactivated due to increased SLC11A1 expression driven by promoter allele 3, will
facilitate the efficient clearance of pathogens, it may increase susceptibility to chronic
inflammation and autoimmune disease. Conversely, it has been argued that low levels of
SLC11A1 expression, driven by allele 2, may contribute to resistance to autoimmunity
and inflammation by decreasing the level of macrophage activation. The hypothesised
increased susceptibility to autoimmune and inflammatory diseases in the presence of
allele 3 is not supported in this meta-analysis, and the results of a previous metaanalysis do not wholly support the hypothesis that the presence of allele 3 is associated
with an increased incidence of autoimmune and inflammatory disease (Nishino et al.,
2005). The hypothesis is supported by empirical data from only 3 of the 13 studies used
in the current analysis (Dubaniewicz et al., 2005, Maliarik et al., 2000, Sanjeevi et al.,
2000). Similarly, some individual association studies have found a negative association
between the presence of allele 3 and the incidence of infectious diseases. However, an
investigation of the association between (GT)n polymorphisms in the promoter region of
SLC11A1 and infectious diseases identified a predominance of allele 3 in the absence of
infectious disease (tuberculosis) among cases (Li et al., 2006). A significant negative
association between the presence of allele 2 and the incidence of autoimmune disease
was reported in only 3 of the 13 association studies (Maliarik et al., 2000, Rodriguez et
al., 2002, Sanjeevi et al., 2000) conducted to date, while an additional 3 individual
studies reported that the frequency of allele 2 was lower, albeit not significantly, among
cases (Bassuny et al., 2002, Nishino et al., 2005, Takahashi et al., 2004). The present
study and that of Nishino et al. (2005) suggest that the presence of the SLC11A1
promoter allele 2 may exert a weak protective effect for the development of
autoimmune disease.
The failure of this analysis, and the majority of individual association studies, to show
an association of allele 3 with disease susceptibility may be attributable to a number of
factors. Firstly, the presence of other functional SLC11A1 promoter polymorphisms,
which may also modulate the expression levels specified by promoter alleles 2 and 3,
may further influence predisposition to autoimmunity and chronic inflammation. One
likely candidate is the -237C/T promoter polymorphism, which is a single base pair
substitution of a C for a T at position -237 (Zaahl et al., 2004). Interestingly, the
presence of a T at position -237 appears to further modify the expression of the
63
promoter microsatellite repeat when in the cis position with allele 3, resulting in lower
levels of SLC11A1 expression, comparable to levels observed in the presence of allele 2
(Zaahl et al., 2004). Thus, the -237C/T polymorphism, through modulation of
expression from the promoter alleles, may further modulate disease risk. An example of
this is seen in the association of allele 3 with Crohn’s disease only in the absence of
-237 T variant (Zaahl et al., 2006). The presence of the combination of allele 3 with a T
at position -237 exerts a protective effect against chronic inflammation. Given the
multitude of SLC11A1 polymorphisms identified to date (Figure 1.6), the probability
exists that SLC11A1 expression may not be directly related to the presence of allele 3 or
allele 2, due to the existence of additional modulators of gene expression. If multiple
SLC11A1 polymorphisms operate synergistically or antagonistically to modulate
SLC11A1 expression levels, then any potential association of SLC11A1 with disease will
be masked in association studies investigating only a single polymorphism.
Secondly, it is possible that alleles of another gene(s), in tight linkage disequilibrium
(LD) with SLC11A1, could be the underlying cause of the non-random disease
associations reported (White et al., 1994, Yip et al., 2003). The association of SLC11A1
promoter allele 3 or 2 with protection against autoimmune and inflammatory disease
may be attributable, in part, to LD of allele 3 or 2 with the authentic disease-causing
variant(s). SLC11A1 is located in a gene-rich region of chromosome 2 and complex LD
occurs within and around the SLC11A1 locus (2q35) (Shaw et al., 1997a, Yip et al.,
2003). The IL-8RD and IL-8RE genes are two such likely candidate genes, given that
the IL-8 receptor gene cluster lies approximately 130 kb downstream of the SLC11A1
gene (Shaw et al., 1996) and these receptors play an important role in immune
responses.
Thirdly, the variable associations observed between individual studies may also be
attributed to the effect of other genes, which may modulate SLC11A1 function.
Associations of individual SLC11A1 polymorphisms with disease may be weak and/or
inconsistent across patient populations because additional genes, which may modulate
disease risk, will vary among case/control groups being compared. While the clinical
manifestations of autoimmune diseases are distinct, the underlying genetics are often
similar; namely most show associations with the major histocompatibility complex
(MHC) region on chromosome 6, especially MHC class II loci, which confer as much as
64
50% of disease risk. Interestingly, among patients carrying susceptibility MHC alleles
for Type 1 diabetes the frequency of allele 2 has been shown to be lower (Nishino et al.,
2005). Furthermore, evidence suggesting that SLC11A1 promoter polymorphisms
modulate both susceptibility to and severity of rheumatoid arthritis in individuals
lacking MHC-associated risk factors has also been reported (Rodriguez et al., 2002).
Other studies have shown that the susceptibility (and protective) effects of allele 3 (and
allele 2) were additive when co-occurring with identified MHC alleles conferring
susceptibility (and resistance) to disease development (Sanjeevi et al., 2000). To date,
most studies of the association of SLC11A1 polymorphisms and disease incidence have
not investigated the modulating effect of MHC haplotypes that have been correlated
with either resistance or susceptibility to disease.
SLC11A1 is an iron-regulated gene and, as such, association studies may show varying
results due to the variability in the iron status of the individuals included in the study
population, which will likely confound the genetic effect (Atkinson and Barton, 1998,
Atkinson et al., 1997). For example, high SLC11A1 expression in the presence of allele
3 may lead to the depletion of iron from the macrophage, and therefore provide
protection against infection. This protective influence of allele 3 will be most potent
under conditions of low iron concentration, and increasing iron concentration may
negate the effect. Increased iron levels exert many effects on macrophage function
resulting in the inhibition of a Th1 pro-inflammatory immune response (Carrasco-Marín
et al., 1996, Theurl et al., 2005). Furthermore, while increased stores of iron may
unfavourably alter the immunoregulatory balance to facilitate increased growth rates of
microbes, they may also operate to decrease susceptibility to autoimmune and
inflammatory disease (Kotze et al., 2001, Valberg et al., 1989).
Only one of the association studies included in the present meta-analysis considered the
possible environmental influence of iron status among case and controls when
determining associations of SLC11A1 variants and disease incidence (Kotze et al.,
2001). Therefore, iron status, which will be heterogeneous across a single population,
may determine the probability of identifying associations by modulating the pure
genetic effect. To incorporate the confounding factor of iron status in association studies
represents a major challenge because hypothetical power calculations indicate that
65
sample sizes in excess of 105 individuals are required when studying such a two-way
interaction (McDermid and Prentice, 2006).
Finally, associations may be influenced by the ethnic makeup of the individuals
included in the association studies. There are variable frequencies of allele 3 and the
incidence of infectious and autoimmune/inflammatory diseases throughout the world. In
regions where infectious disease is endemic, allele 3 is maintained at a higher
frequency, presumably due to positive selection pressure exerted by conferring
enhanced survival of carriers. Thus, associations of SLC11A1 with the incidence of
autoimmune and inflammatory disease may appear stronger depending on the ethnicity
of individuals included in the studies. Indeed, SLC11A1 polymorphic variants have been
associated with susceptibility or resistance to multiple autoimmune and inflammatory
diseases and ethnic variations have been reported; for example, multiple sclerosis in
South African Caucasians, sarcoidosis in African Americans, rheumatoid arthritis in
Canadian Caucasians and Koreans, juvenile rheumatoid arthritis in Latvians, T1D in the
United Kingdom, and inflammatory bowel disease in Japanese populations. The current
data related to the association of SLC11A1 promoter allele 3 with the incidence of
autoimmune and inflammatory disease cannot conclusively support or refute the claim
that this allele is associated with resistance to disease.
The results of the present meta-analysis do not wholly corroborate the hypothesis that
allele 3 of the SLC11A1 promoter would be associated with susceptibility to
autoimmune and inflammatory disease. Environmental factors, such as infection
prevalence and iron status, as well as additional genetic markers, both within (such as
-237C/T) and outside (especially MHC class II) of SLC11A1 will vary among studies
and will likely operate to create a complex milieu, which ultimately modulates disease
susceptibility.
The present meta-analysis emphasises that caution must be exercised when interpreting
association studies using small sample sizes that have low power to detect authentic
allelic association, establishing the need for the completion of large, unbiased studies on
the relationships between these polymorphisms and autoimmune/inflammatory diseases.
However, completion of large studies are hindered by the current genotyping methods
which are either time consuming or unable to detect all (GT)n alleles. Therefore, a
66
sensitive high-throughput methodology to genotype the (GT)n promoter polymorphism
would facilitate the completion of larger studies (Chapter 4) to enable conclusions to be
determined regarding the association of variants at the (GT)n polymorphisms with
disease occurrence.
Additionally, the current study presents evidence that a link between the presence of
variants of the (GT)n microsatellite repeat and the incidence of
autoimmune/inflammatory disease exists (i.e. a weak predominance of allele 2 in the
absence of disease). The observed association of the current study and the findings of
another meta-analysis, which identified an association of (GT)n allele 3 with pulmonary
tuberculosis (Li et al., 2006), suggests that functional analyses on how SLC11A1
promoter variants may influence disease incidence are warranted (Chapter 5 and 6).
67
CHAPTER 4 – HIGH-THROUGHPUT
GENOTYPING OF SLC11A1
MICROSATELLITE REPEATS BY HIGH
RESOLUTION MELT CURVE ANALYSIS
68
4.1 INTRODUCTION
Solute carrier family 11A member 1 (SLC11A1) has restricted expression to
macrophages, in which it is localised to the phagosomal membrane where it functions as
a divalent cation transporter (Sections 1.1.3 and 1.1.4). SLC11A1 classically activates
macrophages, which facilitates elimination of macrophage-trophic pathogens
(Blackwell et al., 2001). SLC11A1 exerts potent, pleiotropic effects, including
increased expression of iNOS and subsequent generation of NO, upregulation of MHC
class II expression and enhanced antigen presentation to T cells, increased production of
pro-inflammatory cytokines (notably IL-1E and TNF-D), production of reactive species
involved in oxidative burst, and upregulation of KC. Collectively, these responses
initiate and perpetuate Th1 (pro-inflammatory) immune reactions, which efficiently
clear infections. However, these potent Th1 responses putatively increase susceptibility
to autoimmune/inflammatory diseases (Section 1.1.6).
Expression of SLC11A1 is modulated by a complex polymorphic (GT)n microsatellite
promoter repeat. Nine (GT)n alleles, which differ in both repeat length and sequence
composition, have been identified to date (Table 1.3). Alleles 2 and 3, which differ by
only a GT repeat, account for over 95% of all SLC11A1 (GT)n promoter alleles within
populations. The remaining alleles occur at extremely low frequencies, which vary
according to ethnicity. Promoter assays using monocytes have shown that allele 3 drives
significantly higher SLC11A1 expression compared to allele 2. Furthermore, classical
activation of macrophages by the exogenous stimuli, IFN-γ and LPS, results in a
significant increase in SLC11A1 expression driven by allele 3, but leads to decreased
SLC11A1 expression in the presence of allele 2 (Section 1.3.2). From the gene
expression studies it was hypothesised that higher SLC11A1 expression, driven by allele
3, produces a macrophage phenotype which facilitates pathogen clearance, however,
may also increase susceptibility to autoimmune/inflammatory diseases in genetically
permissive individuals. Conversely, in the presence of allele 2, resultant low SLC11A1
expression increases susceptibility to infection, but may confer resistance to
autoimmune/inflammatory disease (Searle and Blackwell, 1999)
Association studies have been conducted to assess the strength of association between
the occurrence of SLC11A1 alleles 2 and 3 and the incidence of infectious and
69
autoimmune/inflammatory diseases (Section 1.3.4, Tables 1.4 and 1.5). However,
results of such studies have been inconsistent (Section 1.3.4) and meta-analyses of these
case/control association studies highlight these inconsistencies (Li et al., 2006, Nishino
et al., 2005, O'Brien et al., 2008) (Chapter 7). A meta-analysis, completed by Li et al.
(2005), revealed that allele 3 was associated with resistance to pulmonary tuberculosis
infection in African and Asian populations, but not in European populations. The latter
cohorts comprised sample sizes of 47 and 101 in which the incidence of allele 3 was
associated with both susceptibility and resistance to pulmonary tuberculosis infection.
In another meta-analysis, which investigated the association of SLC11A1 alleles 2 and 3
with the occurrence of autoimmune/inflammatory disease, O’Brien et al. (2008)
(Chapter 3) did not find an association between allele 3 and disease incidence, however,
a marginal protective effect in the presence of allele 2 was reported. This finding
corroborates the results of another smaller meta-analysis (Nishino et al., 2005) and
observations from a more comprehensive meta-analysis which is presented in Chapter 7
of this thesis.
The majority of association studies conducted to date have included less than 200 cases,
and consequently, the power to detect authentic allelic associations is low (Section
1.3.5). The issue of small sample sizes is further confounded when environmental
factors, which modulate the incidence of infectious/autoimmune disease, are considered.
Such two-way interactions require sample sizes of 105 individuals if genuine
associations are to be established (McDermid and Prentice, 2006). Other limitations of
studies analysing small sample sizes include genetic bias, as such studies tend to over
report the frequency of the less frequent variants (Section 1.3.5).
Although PCR amplicon size determination (Blackwell et al., 1995, Liu et al., 1995)
and restriction fragment length polymorphisms (Graham et al., 2000, Kotze et al., 2001)
are commonly used to genotype the SLC11A1 (GT)n microsatellite, these methodologies
are unable to accurately distinguish all alleles. Genotyping based on PCR amplicon size
is the most common methodology used, however it cannot differentiate alleles 3 and 5
or alleles 1 and 7, which have identical lengths, but varying sequence composition
(Table 1.3). The inability to differentiate alleles has resulted in significant mis-reporting
of allelic frequencies by studies relying solely on PCR amplicon size to distinguish
alleles. One example is the mis-reporting of allele 7 as allele 1 among Asian cohorts.
70
Allele 7 has only been identified in Asian populations and is the same length as allele 1.
Prior to the identification of allele 7, (GT)n microsatellite repeat genotyping studies
conducted in Asian populations had only reported allele 1. However, cloning and
sequencing of PCR amplicons revealed that allele 1 is not present in Asian populations,
suggesting that these studies may have mis-reported allele 7 as allele 1 (Kojima et al.,
2001).
Collectively, the putative importance of the SLC11A1 promoter microsatellite in
modulating disease susceptibility, coupled with the inconsistent results of association
studies and the inability to rapidly and reliably detect all alleles using current
genotyping methods, highlights the need for an accurate, rapid, high-throughput
genotyping methodology. However, the complexity of the GT repeat polymorphism
(Table 1.3) has made this objective difficult to achieve. Prior to this study, cloning and
sequencing (Kojima et al., 2001) was the only method sensitive enough to detect all
(GT)n promoter alleles. However, this method is labour intensive, time-consuming, and
is therefore is not amenable to the analysis of large sample sizes which are required for
association studies.
The (CAAA)n/1729+271del4 polymorphism is another polymorphic microsatellite
repeat, located in the 3’UTR of SLC11A1, which has not been well characterised. To
date, two polymorphic variants have been identified, which differ by a single CAAA
repeat and a G to A SNP (Section 1.2.4.2; Figure 1.6). This polymorphism was recently
shown to be a marker of mortality after infection with human immunodeficiency virus
(HIV) (McDermid et al., 2009) and has been associated with susceptibility to infectious
(Mycobacterium tuberculosis) (Fitness et al., 2004a) and inflammatory disease (Crohn’s
disease) (Kotlowski et al., 2008). Although the functional role of the (CAAA)n
polymorphism is yet to be elucidated, it is hypothesised that this polymorphism may
modulate mRNA transcript stability, thereby modulating expression levels of SLC11A1
at the translational level (Section 1.2.4.2). Genotyping of the (CAAA)n microsatellite is
currently carried out by amplicon size determination after capillary electrophoresis of
radio- or fluorescently-labeled PCR products (Fitness et al., 2004a, Kotlowski et al.,
2008). The aim of this study was to develop a specific, rapid, high throughput
methodology to genotype the SLC11A1 (GT)n promoter polymorphisms and 3’UTR
(CAAA)n microsatellite repeats using high resolution melt curve analysis.
71
4.1.1 High-Throughput Genotyping of SLC11A1
Microsatellite Repeats Using High Resolution Melt Curve
Analysis
The conventional methods for differentiating between wild type and mutant alleles
using real time PCR have relied upon allele specific fluorescence using fluorescentlylabelled primers, probes, or molecular beacons (Mhlanga and Malmberg, 2001).
However, these approaches require expensive fluorescently-labeled oligonucleotide
probes or primers (Liew et al., 2004). Additionally, the ability to genotype using these
methods relies upon the specificity of the primer or probe for the target sequence. The
use of fluorescently-labeled primers/probes to genotype the SLC11A1 microsatellite is
therefore unfeasible due to the complex repetitive nature of the (GT)n microsatellite
repeat.
High resolution melt (HRM) curve analysis is a fast and cost effective real-time PCRbased technique with a range of applications, including genotyping and mutation
discovery. HRM curve analysis allows post-PCR analysis using unlabelled
oligonucleotides coupled with an inexpensive saturating DNA intercalating dye. Ririe et
al. (1997) were the first to show that melt curve analysis could be used to assess the
quality of amplicons after real-time PCR, while HRM using unlabeled oligonucleotides
with a saturating DNA dye was first described by Grundry et al. (2003) and Wittwer et
al. (2003). The melting curve is obtained after PCR amplification by monitoring the
fluorescence of the intercalating dye as the temperature passes through the denaturation
temperature of the PCR product. Upon denaturation, the intercalating dye is released,
resulting in a rapid loss of fluorescence (Figure 4.1). Because the melting curve of an
amplicon is dependent upon its length, sequence and CG content, PCR products with
different lengths and/or base compositions will have different melting characteristics,
and therefore different melting temperatures, which can be exploited to distinguish
different genotypes (Lay and Wittwer, 1997, Ririe et al., 1997, Wittwer et al., 1997).
72
Figure 4.1 Molecular mechanism of melt curve analysis. A double stranded DNA
intercalating dye (green circles) binds between the DNA bases. The sample is heated at
a fixed rate and denaturation of the double stranded DNA results in a rapid loss of
fluorescence.
In the genotyping of SNPs or insertion/deletion mutations by HRM, homozygous
samples produce a single melting curve, while heterozygous samples produce more
complex melting curves, which arise from the formation of both homoduplexes and
heteroduplexes (Figure 4.2) (Liew et al., 2004). Heteroduplexes are formed by the
annealing of non-complementary strands of DNA, causing mispairing of the DNA in the
non-complementary regions. Such mispairing decreases the stability of heteroduplexes
as compared to that of homoduplexes, and therefore the former dissociate earlier in the
melting profile (Gundry et al., 2003). The melt curve analysis of heterozygous samples
yields four molecular species (two homoduplexes and two heteroduplexes), each
possessing unique melting temperatures (Figure 4.2). Because of the formation of these
heteroduplex species, heterozygous samples are not genotyped according to their
melting temperature, but rather by the shape of the dissociation profile. Liew et al.
(2004) tested the melting profile of all possible heteroduplexes formed when a single
nucleotide polymorphism is introduced and found that each heterozygote generated a
unique melting curve, thereby allowing each heterozygote genotype to be distinguished.
73
Figure 4.2 Molecular species formed during melting curve analysis of a sample
containing heterozygous and homozygous genotypes. Homozygous samples result in the
formation of homoduplexes while heterozygous samples result in the formation of a
mixture of homoduplexes and heteroduplexes. Heteroduplexes contain regions of base
mispairing, which lowers the denaturation temperature as compared to that of
homoduplex samples.
Unlike agarose or polyacrylamide gel electrophoresis, melting curve analysis can also
distinguish products of equal length but different sequence compositions (Ririe et al.,
1997). In the case of the (GT)n repeat, HRM offers a novel method by which to detect
alleles with the same (GT)n promoter length but different GT sequence compositions,
such as alleles 1 and 7 and alleles 3 and 5. Also, HRM analysis should be sufficiently
sensitive to detect novel alleles, as these would produce distinct melting profiles.
74
4.2 MATERIALS AND METHODS
4.2.1 Materials
4.2.1.1 General Materials
FTA Mini Cards and the 2mm Harris Micro Punch were obtained from Whatman
International Ltd (Middlesex, United Kingdom). The Twin.tec skirted PCR plates and
heat sealing film were purchased from Eppendorf (Hamburg, Germany). The PureLink
Genomic DNA Mini Kit, pCR8/GW/TOPO vector, Platinum Taq DNA polymerase and
High-Fidelity Platinum Taq DNA polymerase were purchased from Invitrogen
(California, USA), while the Accu-Chek Softclix lancets were purchased from
Hoffmann-La Roche Ltd (Basel, Switzerland). The LC Green 1 master mix and the
Lightcycler capillary tubes were purchased from Idaho Technologies (Salt Lake City,
USA) and Roche Applied Science (Penzberg, Germany), respectively.
4.2.1.2 Oligonucleotides
Multiple primer sets were designed to flank both the (GT)n promoter (rs34448891) and
3’UTR (CAAA)n (rs17229009) polymorphisms based on the sequence file AF229613.
Primers were designed following the previously described parameters (Section 2.1.3).
Table 4.1 lists all of the oligonucleotides designed for the genotyping of the SLC11A1
polymorphisms by HRM analysis.
The primer sequences that were optimal for genotyping the SLC11A1 (GT)n promoter
and (CAAA)n polymorphisms were the HSNRAMPC-F/HSNRAMPC-R (127bp
amplicon) and the HSLC11A1-CAAAhr1-F/HSLC11A1-CAAAhr1-R (110bp
amplicon) primer pairs, respectively.
75
Table 4.1 Oligonucleotides used for Genotyping of SLC11A1 (GT)n and (CAAA)n
Polymorphisms by HRM Analysis.
Primer name
Sequence
Length
(GT)n promoter polymorphism
HSNRAMPA-F
HSNRAMPA-R
HSNRAMPC-F
HSNRAMPC-R
HSNRAMPD-R
HSNRAMPE-F
(CAAA)n polymorphism
HSNRAMP1-CAAA-F
HSNRAMP1-CAAA-R
HSLC11A1-CAAAhr1F
HSLC11A1-CAAAhr1R
HSLC11A1-CAAAhr2R
TGAAGACTCGCATTAGGCCAACG
CCGTGTTCTGTGCCTCCCAAGT
CCAGATCAAAGAGAATAAGAAAGACC
CCTGCCCCTTGCGTATTCATGTCA
CCGTGTTCTGTGCCTCCCAAGTT
GCATTAGGCCAACGAGGGGTCTT
23
22
26
24
23
23
CCTAGCGCAGCCATGTGATTACC
CCCAAGTCCTCAAGCCCTCACC
CCACCCTTGCCATGGAGGTTAAG
CACGCCTGCAGGTGCTCAATAAA
CACCCTTGGGCTGTCAGGTCAC
23
22
23
23
22
4.2.2 Methods
4.2.2.1 Genomic DNA Collection
4.2.2.1.1 Buccal Cell Collection
Participants were instructed to chew the inside of their cheeks for 20-30s and then to
vigorously swill 10ml of mouthwash (Gatorade Bluebolt) for 30s. The liquid was then
expelled into a 50ml centrifuge tube. In the laboratory, all samples were vortexed to
obtain a homogenous suspension. Mouthwash samples were either immobilised on FTA
cards (Section 4.2.2.1.2) or directly added to PCR reactions (Section 4.2.2.2.3).
4.2.2.1.2 FTA Card Immobilisation of Buccal Cells
FTA card immobilisation of buccal cells was carried out in accordance with a protocol
approved by the UTS Human Research Ethics Committee. Mouthwash samples (from
30 participants) were first collected following the buccal cell collection methodology
(Section 4.2.2.1.1). FTA cards were dipped into the mouthwash sample and allowed to
air-dry. Collected FTA card samples were stored in separate envelopes at RT and gDNA
was extracted for PCR amplification when required (Sections 4.2.2.2.1, 4.2.2.2.2 and
4.2.2.3).
76
4.2.2.1.3 Collection of Blood Cells
Blood (50-100μl) was collected from the finger tip using an Accu-Chek Softclix lancet
(10 participants) (Hoffmann-La Roche Ltd, USA). Blood was placed into a sterile 1.7ml
centrifuge tube containing 20μl Proteinase K and gDNA was extracted using the
PureLink Genomic DNA Mini Kit, according to the manufacturer’s instructions. The
quality and quantity of extracted gDNA was assessed by agarose gel electrophoresis
(Section 2.2.2.5) and NanoDrop quantification (Section 2.2.2.7). The gDNA samples
were stored at -20oC until required for PCR amplification (Section 4.2.2.4.2).
4.2.2.2 Genomic DNA Extraction
4.2.2.2.1 Preparation of FTA Card Immobilised gDNA for PCR Analysis
Sample punches of FTA cards containing immobilised gDNA from mouthwash samples
(Section 4.2.2.1.1 and 4.2.2.1.2) were prepared using a 2mm Harris Micro punch
(Whatman) ensuring the sample area of the card was the only part in direct contact with
the cutting mat. Sample punches were then transferred to sterile 1.7ml centrifuge tubes.
The 2mm Harris Micro Punch was cleaned after each sample by punching out five 2mm
disks from a blank FTA card. The cutting mat was cleaned with 70% (v/v) ethanol
between each sample. A simplified method of washing the FTA punches was employed
to remove any potential PCR inhibitors and contaminants (Makowski et al., 1995). This
involved using sterile H2O to wash the punches, instead of the manufacturer’s protocol
of a single wash with FTA purification reagent, followed by two washes in TE buffer
(Whatman FTA protocol BD08). Sample punches were washed in 0.5ml of sterile H2O
for 5min (with constant inversion) and were then dried in a heating block (55oC for
15min). The 2mm card punches were then transferred directly to a PCR reaction
(Section 4.2.2.4) or stored at 4oC O/N.
4.2.2.2.2 Elution of FTA Card Immobilised gDNA
It was found that the FTA card punches could not be added directly to real-time PCR
amplification reactions due to interference with fluorescence measurements. Therefore,
elution of gDNA from the FTA card was trialed for use in the PCR. Seven FTA card
sample punches (2mm) (Section 4.2.2.2.1) containing immobilised buccal cell gDNA
from a single mouthwash sample (Section 4.2.2.1.1 and 4.2.2.1.2), were washed once in
500μl of sterile H2O and then inverted for 5min. The water was completely removed
77
and the sample punches were dried in a heating block (55oC for 15min). For the elution
of gDNA using TE buffer, sample punches were transferred to a tube containing
different volumes (25, 50, 75, 100, 150 and 200μl) of TE buffer and heated at 99oC for
15min to elute the DNA. An aliquot (5μl) of the eluted DNA was then used for PCR
(Section 4.2.2.4).
Genomic DNA was also eluted from the FTA cards by RT elution with pH treatment
following the published protocol (Whatman application note, 2004 – Eluting genomic
DNA from FTA cards using room temperature and pH treatment). Briefly, 35μl of
solution 1 (0.1M NaOH, 0.3mM EDTA, pH13) was added to a single or double FTA
card punch (Section 4.2.2.2.1) and incubated at RT for 5 min. Following this, 65μl of
solution 2 (0.1M Tris-HCl, pH 7.0) was added, the tube vortexed 5 times and then
incubated for a further 10min. The FTA card was removed and 5μl of the solution was
used for PCR (Section 4.2.2.4), or stored at -20oC until used.
4.2.2.2.3 Direct Addition of Buccal Cells to the PCR
Buccal cells, from frozen (-20oC) or fresh mouthwash samples (Section 4.2.2.1.1), were
collected by centrifugation (3min at 10000rpm) and the supernatant was discarded. The
cells were washed twice in 4ml of low EDTA TE buffer (0.1mM EDTA) and the buccal
cell pellet was resuspended in 1ml of low EDTA TE buffer and transferred to a fresh
1.7ml centrifuge tube. Cells were added directly (5μl) into a PCR (Section 4.2.2.4), or
stored at -20oC until needed.
4.2.2.3 Cloning of SLC11A1 (GT)n and (CAAA)n Polymorphic Variants
PCR fragments containing different SLC11A1 (GT)n promoter variants (alleles 2, 3, 5
and 9) and (CAAA)n variants [(CAAA)2 and (CAAA)3] were amplified from FTA card
bound buccal cells using oligonucleotides HSNRAMPA-F/R and HSNRAMPCAAAF/R (Section 2.2.2.1), producing amplicon sizes of 208bp [for (GT)n allele 3] and 220bp
[for (CAAA)3]. PCR products were purified (Section 2.2.2.2) and cloned into the
pCR8/GW/TOPO vector (Section 2.2.3.2). Plasmid DNA was extracted (Section
2.2.2.4) and sequenced to identify the cloned alleles (Sections 2.2.2.6 and 2.2.4.2). The
plasmids containing the allelic variants of the (GT)n and (CAAA)n polymorphisms were
used to optimise parameters of the genotyping methodologies (Section 4.3.2 and 4.3.3).
78
4.2.2.4 PCR Protocols
4.2.2.4.1 PCR 2 – Optimisation of Parameters for Real-Time PCR Analysis
PCRs, for the optimisation of the real-time PCR parameters (Section 4.3.2), were
carried out in a 25μl reaction volume, which contained 1U Platinum Taq polymerase,
1X LCGreen I Mix (1X LCGreen I, 0.25mg/ml BSA, 0.2mM dNTPs and 1-3mM Mg
Buffer), and forward and reverse primers (0.5-9.0μM). Each reaction contained 0.1ng
plasmid DNA (Section 4.2.2.3).
PCRs for the optimisation of primer annealing temperature (Section 4.3.2.1) and
magnesium chloride concentration (Section 4.3.2.2) were carried out in an Eppendorf
Mastercycler Gradient instrument (Eppendorf) using FTA card immobilised gDNA
from buccal cells isolated from the same sample card (Sections 4.2.2.1.1, 4.2.2.1.2 and
4.2.2.2.1). The quality of PCR products was assessed by agarose gel electrophoresis
(Section 2.2.2.5). The annealing temperature was varied from 56-72oC, while the
magnesium chloride concentration was varied from 1.0-3.0mM. The optimal annealing
temperature was determined as the temperature which produced a single amplicon with
the highest intensity. The optimal magnesium chloride concentration for the different
primer sets was the magnesium concentration which produced the most intense band
without the presence of additional non-specific bands. All other optimisation steps
(Sections 4.3.2.3, 4.3.2.4 and 4.3.3) were carried out by real-time PCR using the
Mastercycler ep realplex2 (Eppendorf).
Primer matrices were completed to determine the optimal primer concentration (Section
4.3.2.3). The primers were tested in all combinations of forward and reverse primer
concentrations of 9.0, 6.0, 3.0 and 0.5μM. Cloned and sequenced plasmid DNA,
containing the (GT)n or (CAAA)n microsatellite repeat region (containing allelic
variants (GT)n allele 3 and (CAAA)3, respectively), were used as the template for the
real-time PCR amplification for the determination of optimal primer concentrations
(Section 4.2.2.3). Optimal primer concentrations were determined after real-time PCR
amplification by analysis of the quantification curves (i.e. low Ct value, steep
amplification plot and the absence of an early plateau phase) and the melting profiles
(presence of a smooth single peak), on the realplex PCR instrument.
79
To determine the appropriate polymerase for the HRM genotyping methodologies,
plasmid DNA, containing the (GT)n and (CAAA)n microsatellite regions (Section
4.2.2.3), were amplified with both polymerases (Platinum Taq and Platinum Taq DNA
polymerase High Fidelity) in parallel, and the generated amplicons were then analysed
by HRM curve analysis using the HR-1 melting instrument (Section 4.2.2.5).
For all optimisation steps, PCR was initiated by an initial denaturation (95oC, 5min),
followed by 40 cycles of 95oC for 15-30s, 56-72oC for 15-30s and 72oC for 15-60s.
Real-time PCR included a dissociation/melting step, which consisted of denaturation at
95oC for 15s, rapid cooling to 60oC for 15s, followed by heating at a rate of 0.4oC up to
95oC with fluorescence acquisition. Real-time PCR amplification was assessed using
the quantification plots and melting curves.
4.2.2.4.2 PCR 3 – Optimised Real-Time PCR Protocol for the Genotyping
of SLC11A1 Microsatellite Repeats by HRM Analysis
Real-time PCR was carried out in a 25μl reaction volume, which contained 1U Platinum
Taq polymerase (Invitrogen); 1X LCGreen I Mix (1X LCGreen I, 0.25mg/ml BSA,
0.2mM dNTPs and 2mM Mg Buffer) (Idaho Technologies, USA), and forward and
reverse primer concentrations of 6.0/9.0μM for the (GT)n repeat and 3.0/6.0μM for the
(CAAA)n repeat. The template added to each reaction consisted either of plasmid DNA
(0.1ng), diluted PCR product (10pg) or extracted gDNA (10-25ng). A minimum of four
replicates were completed for each sample. Amplification of the (GT)n repeat region
was initiated by an initial denaturation (95oC, 5min), followed by 40 cycles of 95oC for
15s, 64.5oC for 15s and 72oC for 15s. The (CAAA)n PCR utilised a 2-step PCR
consisting of an initial denaturation (95oC, 5min) followed by 40 cycles of 95oC for 15s
and 72oC for 30s. Amplification of both the (GT)n and (CAAA)n repeat regions were
followed by a dissociation step consisting of a denaturation step of 95oC for 15s,
cooling to 60oC for 15s, and then heating at a rate of 0.4oC/s up to 95oC with
fluorescence acquisition. Real-time PCR amplification was assessed using the
quantification plot and the melting curves from the realplex mastercyler software.
Replicate samples were then analysed by HRM curve analysis using the HR-1 (Section
4.2.2.5). Replicate samples, which did not result in efficient amplification or a high Ct
value from the analysis of quantification plots and melt curves from the realplex
80
mastercycler software, were not analysed further by HRM analysis with the HR-1. The
raw curves, obtained by high-resolution melting of the samples using the HR-1, were
further analysed (Section 4.2.2.6.2) to allow the determination of a samples genotype.
4.2.2.4.3 PCR 4 – Nested PCR Protocol to Increase Starting Template for
HRM Genotyping from FTA Card Immobilised gDNA
Direct addition of washed FTA card punches (containing bound gDNA from buccal
cells) to the real-time genotyping PCR did not provide adequate starting template for
optimal amplification that was required for HRM analysis (Section 4.3.4.1). Therefore,
a nested PCR approach was used, which consisted of two rounds of amplification, to
increase the starting template concentration for the real-time genotyping PCR (Section
4.2.2.4.2). The first amplification step involved the amplification of the region of
interest, and after amplification, the PCR product was diluted and used as the starting
template for the second, genotyping PCR (Section 4.2.2.4.2).
The first PCR amplification step was carried out in a final volume of 50μl containing
1U Platinum Taq polymerase (Invitrogen); 1X PCR Buffer; 2.5mM MgCl2; 0.25mM
dNTPs and 20μM HSNRAMPA-F/R or HSNRAMPCAAA-F/R primers (Table 4.1).
Sample punches were added directly to the PCR reaction. PCR consisted of an initial
denaturation (95oC for 5min); followed by 34 cycles of denaturation (95oC for 30s),
annealing (59oC [for (GT)n repeat] or 58oC [for (CAAA)n repeat] for 30s) and extension
(72oC for 40s), with a final extension at 72oC for 10min. After PCR purification
(Section 2.2.2.2), amplified DNA was diluted to 2pg/μl and 10pg was added to the
second amplification reaction (real-time PCR genotyping reaction) (Section 4.2.2.4.2).
Following real-time PCR amplification (Section 4.2.2.4.2), genotypes were determined
by HRM analysis (Section 4.2.2.5 and 4.2.2.6.2).
4.2.2.5 Genotyping of SLC11A1 Microsatellite Polymorphisms by
HRM Curve Analysis
After amplification by real-time PCR using the Mastercycler ep realplex2 (Section
4.2.2.4.2), the samples were analysed by HRM curve analysis to genotype samples. The
PCR products (15μl) were transferred to LightCycler capillary tubes and HRM was
completed using the HR-1 dedicated high resolution melter (Idaho Technologies). For
81
both the (GT)n and (CAAA)n protocols, samples were heated at a rate of 0.1oC/s with
fluorescence acquisition between 75oC and 95oC. The raw melting curves were then
analysed using the HR-1 Melt Tool Analysis software (Section 4.2.2.6.2) to genotype
samples.
4.2.2.6 Software
4.2.2.6.1 Prediction of Amplicon Melting using Poland
Amplicons to be generated by primers designed for real-time PCR amplification and
subsequent genotyping by HRM analysis were assessed using the program Poland
(http://www.biophys.uni-duesseldorf.de/local/POLAND/poland.html) (Poland, 1974,
Steger, 1994). Poland calculates the thermal denaturation profile of double-stranded
nucleic acids using nearest-neighbor stacking interactions and loop entropy functions to
predict the melting profile of the input sequence. The designed SLC11A1 amplicons,
containing the (GT)n and (CAAA)n polymorphisms, were analysed using the standard
parameters. The plots obtained (temperature of 50% probability vs. sequence and base
pair vs. sequence vs. temperature) were used to determine if the amplicons generated
using the designed primers melted as a single transition or if a more complex melting
pattern, due to several melting transitions, existed.
4.2.2.6.2 Genotype Determination from Transformed Raw Melt Curve Data
The raw melting curves, obtained by HRM curve analysis (using the HR-1) of real-time
PCR amplified samples (Sections 4.2.2.4.2 and 4.2.2.5), were analysed to genotype
samples. The raw melting curves were analysed using the HR-1 Melt Analysis Tool
software (Idaho Technologies). Raw curves were first normalised by placing the cursor
bars in the flat regions above and below the melting transitions. The first cursor bar set,
representing 100% fluorescence (every amplicon is double stranded), was placed just
prior to the point where the samples started to melt, while the second cursor set,
representing 0% fluorescence (all amplicons single stranded), was placed immediately
after the melting transition. The distance within each cursor bar set was approximately
0.5-1.0oC apart. Further analysis of the (GT)n samples was completed by temperature
shifting the normalised melt curves, where the green horizontal cursor was placed at the
lowest point of the melting curves and the red bar then placed as close as possible to the
green bar. The (CAAA)n melt curves were not temperature shifted. To further enhance
82
the difference between each genotype, the normalised and temperature shifted (GT)n
melt curves and the normalised (CAAA)n melt curves were converted to difference
plots. Genotypes were assigned to each sample manually based on their difference plots,
after comparison to standards of known genotype that were analysed simultaneously.
83
4.3 RESULTS
4.3.1 HRM Analysis Assay Design
4.3.1.1 Oligonucleotide Design for Genotyping of the SLC11A1 (GT)n
and (CAAA)n Microsatellites by HRM Analysis
Assay design and optimisation are essential in producing a HRM assay that will enable
differentiation of genotypes. Optimisation is essential as the intercalacting dye used is
not specific. Thus, any non-specific amplification, primer dimers or contaminating
DNA will bind the intercalating dye, lowering the resolution and sensitivity of the
melting profile, thereby preventing the differentiation of alleles.
Primers for HRM genotyping were designed to allow amplification of the SLC11A1
promoter region encompassing the (GT)n microsatellite polymorphism and the 3’UTR
surrounding the (CAAA)n microsatellite polymorphism (Section 4.2.1.2). The design of
oligonucleotides within the SLC11A1 promoter for genotyping of the (GT)n repeat by
HRM analysis was challenging due to the repetitive nature of both the GT tract and the
surrounding DNA. Therefore, primers were placed in suitable regions as close as
possible to the polymorphic GT tract (Figure 4.3). Three oligonucleotide primer pairs
that flanked each of the SLC11A1 (GT)n promoter polymorphism and 3’UTR (CAAA)n
polymorphism were designed (Figure 4.3A and 4.4A).
Several studies suggest that shorter amplicons allow for better discrimination of
genotypes as the polymorphic region accounts for a larger portion of the amplicon
(Liew et al., 2004, Reed and Wittwer, 2004, Wittwer et al., 2003). However, other
studies have shown that longer PCR products may be more beneficial due to the
presence of multiple melting domains, which yield more complex melting profiles
(Gundry et al., 2003, Ririe et al., 1997). Therefore, oligonucleotides were designed to
be interchangeable, to allow the production of amplicons of varying length (110-220 bp)
to determine the optimal amplicon length that allowed the greatest discrimination
between SLC11A1 (GT)n and (CAAA)n genotypes (Figure 4.3B and 4.4B).
84
Figure 4.3 Oligonucleotide design for genotyping of the SLC11A1 (GT)n promoter
polymorphism by HRM. (A) Location of the designed oligonucleotides (red arrows) in
relation to the polymorphic GT repeat (thin black line). The primer sets were designed
to be interchangeable to allow the production of different amplicon sizes. (B) The
different amplicon sizes which can be produced with the designed HRM
oligonucleotides and the location of the (GT)n microsatellite (black box) within each
amplicon. Amplicon sizes are based on the presence of (GT)n allele 3.
The location of the polymorphic region within the amplicon may also influence the
ability to discriminate genotypes as the nearest neighbour interactions (Breslauer et al.,
1986) around the polymorphism may cause no change in the melting temperature
between alleles in the same amplicon. Therefore, the primer sets were designed to
produce various fragment sizes in which the location of the polymorphic region within
the amplicon varied (Figure 4.3B and 4.4B).
The melting characteristics of all amplicons produced by the designed primer sets were
analysed using the program Poland (Section 4.2.2.6.1) (Poland, 1974, Steger, 1994)
which showed that all of the designed amplicons for the genotyping of the (GT)n and
(CAAA)n microsatellites melted in a single transition, and therefore, should result in
simple melting curves.
85
Figure 4.4 Oligonucleotide design for genotyping the SLC11A1 3’UTR (CAAA)n
polymorphism by HRM analysis. (A) Location of the designed oligonucleotides (red
arrows) in relation to the polymorphic (CAAA)n repeat (thin black line). The primer sets
were designed to be interchangeable to allow the production of a range of different
amplicon sizes. (B) The different amplicon sizes which can be produced with the
designed HRM oligonucleotides, showing the location of the (CAAA)n microsatellite
(black box) within each amplicon. Amplicon sizes are based on the presence of the
allelic variant (CAAA)3.
86
4.3.1.2 PCR Amplification using the Designed HRM Oligonucleotides
Produced Amplicons of the Correct Length and Sequence
The designed oligonucleotides, for the amplification of SLC11A1 regions containing the
(GT)n and (CAAA)n polymorphisms, were analysed to ensure that the correct size
fragments were amplified (Section 2.2.2.1). An initial annealing temperature of 56oC
was employed. Each of the primer combinations, for the amplification of the (GT)n and
(CAAA)n regions, resulted in the production of a single product of the correct size
(Figure 4.5). The PCR products from the different primer combinations were also
purified (Section 2.2.2.2) and sequenced (Section 2.2.2.6). Alignment of the amplicon
sequences against the predicted amplified sequence using SeqMan (Lasergene) (Section
2.2.4.2) showed that all primer sets had amplified the correct sequence.
Figure 4.5 Validation of the oligonucleotides designed for HRM analysis for the
amplification of (GT)n and (CAAA)n microsatellite repeats. Representative (GT)n
amplification results, carried out in duplicate (1 and 2), of the (GT)n primer sets
HSNRAMPC-F/R (127bp), HSNRAMPE-F/D-R (199bp), HSNRAMPC-F/D-R (170bp)
and HSNRAMPE-F/C-R (156bp) show the amplification of the correct size fragments.
NTC denotes the no template control.
87
4.3.2 Optimisation of Real-time PCR Parameters for HRM
Analysis
All primer combinations for the amplification of the SLC11A1 regions containing the
(GT)n and (CAAA)n microsatellite repeats were initially optimised, allowing for the
selection of the amplicons which will enable the accurate identification of sample
genotypes. All parameters of the real-time genotyping PCR (Section 4.3.2) and the postPCR HRM analysis (Section 4.3.3.1) were optimised (Table 4.2).
Table 4.2 Optimisation Steps for the Production of the SLC11A1 HRM Assays.
Optimisation Step
Method
Reason
Annealing temperature of
oligonucleotides
(Section 4.3.2.1)
Temperature gradient PCR
MgCl2 concentration
(Section 4.3.2.2)
MgCl2 gradient PCR
(1-3mM)
Magnesium is an essential cofactor for Taq polymerase and a
concentration too low or high will result in no amplification or
aberrant amplification, respectively.
Primer concentration
(Section 4.2.2.3)
Primer matrices
(0.5μM-9.0μM)
Primer concentrations too high result in the formation of nonspecific products or primer-dimers, lowering the efficiency of
the amplification and sensitivity of the HRM procedure.
Taq polymerase selection
(Section 4.2.2.4)
Trial of Platinum Taq and
High Fidelity Platinum Taq
Polymerase
A high fidelity polymerase is essential to minimise replication
errors during replication to ensure sensitivity of the genotyping
methodology to discriminate different genotypes
Cycling parameters
(Section 4.2.2.4)
Minimise cycling times
Shorter cycling times reduce the amplification of non-specific
products and reduces the time of the genotyping PCR, aiding in
the production of a high-throughput genotyping methodology.
(56-72oC)
Increases the stringency of the PCR reaction as the increased
annealing temperature reduces non-specific binding of the
primers.
Ramp rate of HR-1 instrument Ramp rate of
(Section 4.3.3.1)
0.4oC/s and 0.1oC/s
To determine the optimal rate of heating for the differentiation of
genotypes.
Optimisation of HR-1 HRM
software analysis parameters
(Section 4.3.3.1)
The HRM analysis tool will allow for a greater differentiation
between subtle differences in raw melt curves, resulting in greater
sensitivity of the HRM genotyping assay.
Normalisation and/or
temperature shifting
4.3.2.1 Optimisation of PCR Annealing Temperature
The optimal annealing temperature for PCR using the designed HRM oligonucleotides
was determined using a gradient temperature PCR for all primer combinations (Section
4.2.2.4.1). The addition of an intercalating DNA dye for real-time PCR analysis or
HRM genotyping, results in a higher stability of double stranded DNA (Gundry et al.,
2003). Therefore, the optimal annealing temperature for all primer sets was determined
with the inclusion of the saturating double stranded DNA intercalating dye LCGreen1
(Section 4.2.2.4.1). The optimal annealing temperature for the amplification of the
(GT)n repeat was 64.5oC and 66.4oC for the HSNRAMPC-F/R (Figure 4.6) and
88
HSNRAMPD-F/C-R primer combinations, respectively. The remaining primer
combinations for the amplification of the (GT)n repeat all had optimal amplification
with an annealing temperature of 65oC. The optimal annealing temperature for all of the
primer sets used for the amplification of the (CAAA)n polymorphism was 72oC and thus
a 2-step PCR protocol was developed.
Figure 4.6 Determination of the optimal annealing temperature by gradient temperature
PCR. Representative results of the amplification of the primer combination
HSNRAMPC-F/R for the amplification of the (GT)n repeat. The PCR contained buccal
cell gDNA immobilised on FTA card, with a temperature gradient of 59-66.4oC and
post-PCR analysis of amplicons by agarose gel electrophoresis. NTC denotes the no
template control.
4.3.2.2 Optimisation of Magnesium Chloride Concentration
Optimisation of the magnesium chloride concentration was conducted with a
magnesium concentration ranging from 1-3mM (Section 4.2.2.4.1) in conjunction with
the previously determined optimal annealing temperature (Section 4.3.2.1) (Figure 4.7).
The optimal magnesium concentration for all of the primer sets, for the amplification of
the (GT)n and (CAAA)n repeats, was determined to be 2mM.
89
Figure 4.7 Determination of the optimal magnesium chloride concentration using a
magnesium concentration gradient PCR. Representative results of the amplification
using the HSNRAMPC-F/R primer set for the amplification of the (GT)n repeat. The
PCR contained buccal cell gDNA immobilised on FTA card, with a magnesium
gradient of 1-3mM with post-PCR analysis of amplicons by agarose gel electrophoresis.
NTC denotes the no template control.
4.3.2.3 Optimisation of Primer Concentrations by Real-time PCR
Once the optimal annealing temperature and magnesium concentration were
determined, different combinations of forward and reverse primer concentrations were
tested through 4x4 concentration primer matrices to determine the optimal primer
concentrations (Section 4.2.2.4.1). Previously cloned and sequenced plasmid DNA was
used in these PCRs (Section 4.2.2.3). Optimal primer concentrations were determined
after real-time PCR amplification by analysis of the quantification curves (i.e. low Ct
value, steep amplification plot and the absence of an early plateau phase) and the
melting profiles (presence of a smooth single peak) (Figure 4.8).
90
Figure 4.8 Determination of optimal primer concentrations by analysis of different
combinations of forward and reverse primer concentrations. Forward and reverse
primers were tested at different concentrations (9μM, 6μM, 3μM and 0.5μM). The
representative result shown, of the primer set HSNRAMPC-F/R for the amplification of
the (GT)n repeat, shows optimal amplification from forward and reverse primer
concentrations of 6μM and 9μM, respectively. (A) Quantification profile displaying
optimal amplification. The plot has a low Ct value, steep amplification plot and the
absence of an early plateau phase. (B) The melt curve profile displaying the presence of
a smooth single peak.
Testing of all combinations of forward and reverse primer concentrations found that the
HSNRAMPC-F/R and SLC11A1CAAAhr1-F/R primer sets, for the amplification of
regions containing the (GT)n and (CAAA)n microsatellite repeats, respectively,
produced the optimal and most efficient amplification from all of the primer
combinations tested. Furthermore, HRM analysis of post-PCR amplicons (Section
4.2.2.5) found that amplicons generated by the use of the aforementioned primers
produced the most consistent melting profiles. Therefore, the primer sets HSNRAMPCF/R and SLC11A1CAAAhr1-F/R, were selected for use in HRM genotyping of the
(GT)n and (CAAA)n microsatellites, respectively. The optimal forward and reverse
primer concentrations for the HSNRAMPC-F/R primer set were determined to be
6.0μM and 9.0μM (Figure 4.8), respectively, while the optimal SLC11A1CAAAhr1F/R forward and reverse primer concentrations were 3.0μM and 6.0μM, respectively.
91
After melting analysis on the realplex instrument (Section 4.2.2.4.1), the amplicons
generated from the different primer combinations of the selected HSNRAMPC-F/R and
SLC11A1CAAAhr1-F/R primer sets were further analysed by HRM using the HR-1
instrument (Section 4.2.2.5) (Figure 4.9). The change in the position of the melting
curve observed with different primer concentrations indicates the sensitivity of HRM to
subtle changes in reaction conditions. This highlights the importance of extensive
optimisation of amplification parameters to ensure the production of an assay with the
ability to accurately and consistently differentiate between genotypes. Furthermore, it
was identified that replicates containing inefficient amplification, or a significantly high
Ct value (greater than 30) resulted in melting profiles which differed significantly from
the expected melting path of that sample. Therefore, samples which did not result in
optimal amplification, based on the analysis of the quantification plots, were omitted
from HRM analysis.
Figure 4.9 HRM curve analysis is sensitive to subtle changes in reaction conditions.
The figure displays the first derivative melting profiles from three samples amplified
with the HSNRAMPC-F/R primer set, containing different primer concentrations (μM).
All samples were amplified from plasmid DNA containing (GT)n allele 3. Samples were
analysed by high resolution melting using the HR-1 instrument. The raw melting data
was first normalised before being converted to the negative first derivative plot.
92
4.3.2.4 Selection of Taq Polymerase and Optimisation of Real-time
PCR Cycling Parameters
Different Taq polymerases were assessed for use in the SLC11A1 HRM genotyping
assays. The repetitive structure of microsatellites results in a much higher replication
error rate than that seen with non-repetitive DNA sequences. Therefore, a high fidelity
Taq polymerase is essential to minimise replication errors during real-time PCR
amplification. Two high fidelity polymerases were trialled, the Platinum Taq DNA
polymerase and the Platinum Taq DNA polymerase High Fidelity (Hi-Fi Taq) (Section
4.2.2.4.1). The amplification and HRM curve profiles obtained using the Hi-Fi Taq
were not as optimal as those obtained with Platinum Taq. Therefore the Platinum Taq
polymerase was selected for use with the HRM genotyping methodologies.
Initial real-time PCR analysis utilised cycling parameters of 30s (denaturation,
annealing and extension steps) for the (GT)n promoter methodology and a 30s
denaturation step followed by 1min annealing/extension step for the (CAAA)n
methodology (Section 4.2.2.4.1). Optimisation of the cycling parameters was aimed at
shortening these times [15s for the (GT)n, and 15 and 30s for denaturation and
annealing/extension, respectively, for the (CAAA)n]. For amplification of (GT)n and
(CAAA)n promoter regions, no difference in the quality of the amplification was
observed between the different cycling times and, therefore, the cycling times were
reduced. This also enabled the real-time PCR to be completed faster, thereby
contributing to the production of an efficient, rapid high-throughput genotyping
methodology.
93
4.3.3 HRM Genotyping of Simulated SLC11A1 (GT)n and
(CAAA)n Genotypes
After the parameters of real-time PCR amplification were optimised (Section 4.3.2), the
ability of the optimised HRM methodology to genotype the (GT)n and (CAAA)n
polymorphisms was assessed. To do this, the three most common SLC11A1 (GT)n
promoter genotypes (homozygous allele 2, homozygous allele 3, heterozygous allele
2/3), which account for greater than 95% of the total promoter allele frequencies, and
the (CAAA)n genotypes (homozygous (CAAA)2/2, (CAAA)3/3, heterozygous
(CAAA)2/3) were simulated using the cloned and sequenced (GT)n and (CAAA)n alleles
(Section 4.2.2.3). The plasmid clones were used individually and in combination to
mimic homozygosity and heterozygosity, respectively, for both (GT)n and (CAAA)n
polymorphisms. All real-time PCRs used the optimised PCR protocol (Section
4.2.2.4.2) followed by HRM analysis (Section 4.2.2.5 and 4.2.2.6.2).
4.3.3.1 Optimisation of HRM Parameters - Ramp Rate and HR-1
Software Analysis Parameters
Initial genotyping experiments utilising the optimised real-time PCR protocol allowed
the optimisation of the melting parameters of the HR-1 instrument as well as the
software used to analyse the raw melting profiles.
Analysis of the raw melting curves using the HR-1 software is an integral part in
accentuating the differences in the melt profiles of the different genotypes (Figure 4.10).
Raw melt curves are first normalised, which alters each curve for the variance in the
fluorescence intensity of each sample. Normalised curves can then be temperature
shifted, which draws all the curves together, forcing the curves to separate based on the
shape of the curve. Temperature shifting helps to accentuate heterozygous samples (due
to an altered melting curve profile resulting from the presence of heteroduplex species),
thereby facilitating their differentiation from homozygous samples (Figure 4.2). These
differences are further accentuated by the use of the difference plot that subtracts the
fluorescence of all curves from a selected sample. The difference plot, which shows the
greatest differentiation between samples, can then be used to assign a genotype to a
sample.
94
Figure 4.10 HR-1 software analysis of the raw melt curves of simulated (GT)n
genotypes. The raw melt curves (A) are first normalised (B) which removes the variance
in fluorescence intensity. Normalised melt curves can then be temperature shifted (C),
forcing the samples to separate based on the shape of the curve. The difference plot (D)
subtracts the fluorescence intensity from a selected sample and is used to assign a
genotype to a sample. The red, black and blue lines represent samples homozygous for
alleles 3 and 2, and heterozygous for alleles 2 and 3, respectively.
Analysis of the raw melt curves indicated that normalisation and temperature shifting of
the raw melt curves allowed optimal differentiation of the (GT)n genotypes (Figure
4.10). However, for the (CAAA)n polymorphism, better differentiation was achieved
when the samples were normalised only (Figure 4.11). When the (CAAA)n melt curves
were temperature shifted (after normalisation) the homozygous samples no longer
separated as two distinct groups, but melted as one group (Figure 4.11).
95
Figure 4.11 Analysis of the (CAAA)n melting curves using the HR-1 software. (A)
Normalised melt curves and (B) normalised and temperature shifted melt curves.
The ramp rate at which the HR-1 instrument melts the post-PCR samples was also
optimised. The ramp rate was trialled at two different rates of 0.4oC/s and 0.1oC/s to
determine which temperature provided the best differentiation between genotypes.
Comparison of the curves obtained at the two resolutions indicated that a rate of 0.1oC/s
gave better differentiation between genotypes for both the (GT)n and (CAAA)n
polymorphisms (Figure 4.12). Therefore, the HR-1 ramp rate of 0.1oC/s was used for
the (GT)n and (CAAA)n genotyping methodologies.
96
0.4oC/s
0.1oC/s
Homozygous 2/2
Homozygous 3/3
Heterozygous 2/3
Homozygous 2/2
Homozygous 3/3
Heterozygous 2/3
Heterozygous 2/3
Homozygous 2/2
Homozygous 3/3
Figure 4.12 Optimisation of the HR-1 ramp rate to enable sensitive differentiation of
genotypes. Representative HRM results of the (GT)n microsatellite with a ramp rate of
0.4oC/s (left panel) and 0.1oC/s (right panel). The raw melt curves are shown at the top
of each panel, the normalised and temperature shifted melt curves in the middle and
their respective difference plot at the bottom. Greater differentiation of simulated
genotypes is observed in the plots of samples melted at 0.1oC/s compared to 0.4oC/s.
97
4.3.3.2 The Optimised HRM Genotyping Methodologies Successfully
Differentiates Simulated (GT)n and (CAAA)n Genotypes
Analysis of the simulated homozygote and heterozygote genotypes, using the optimised
real-time PCR conditions, in conjunction with the HR-1 HRM parameters, allowed
successful genotyping of the (GT)n and (CAAA)n polymorphisms. The melt profiles of
homozygous and heterozygous genotypes separated into clearly defined groups (Figure
4.13). The optimised HRM genotyping methodology was consistently able to
discriminate each of the simulated SLC11A1 (GT)n promoter and (CAAA)n genotypes.
Figure 4.13 HRM analysis of simulated SLC11A1 (GT)n and (CAAA)n genotypes.
Plasmids containing different (GT)n and (CAAA)n alleles were used individually, or
mixed, to represent the various homozygous and heterozygous (GT)n and (CAAA)n
genotypes. (A) SLC11A1 (GT)n melt curves. The normalised and temperature shifted
melt curves are shown on the left side of the panel and the respective difference plot is
shown on the right. (B) SLC11A1 (CAAA)n melt curves. The normalised melt curves
are shown on the left with the respective difference plot (right).
98
4.3.3.3 Differentiation of the Common and Rare (GT)n Heterozygous
Genotypes using the Developed HRM Assay
It has been shown that different heterozygous genotypes, located at the same
polymorphic site, can be differentiated according to their melting curves (Graham et al.,
2005). Different heterozygous genotypes result in the formation of different
homoduplex and heteroduplex species (Section 4.1.1), giving each heterozygous
genotype a unique melting profile. To determine if the uncommon (GT)n alleles, which
are infrequently found in a homozygous form, could be differentiated from the more
frequently occurring homozygous and heterozygous genotypes (which account for
greater than 95% of all genotypes), the less abundant SLC11A1 heterozygous (GT)n
promoter genotypes were simulated using cloned alleles (corresponding to (GT)n
genotypes 2/5, 2/9, 3/5 and 3/9). Genotyping of the simulated rare heterozygous
samples, along with the common simulated homozygous and heterozygous genotypes,
showed that the rare heterozygous samples produce melting profiles that can be
differentiated from the common genotypes, in particular the heterozygous 2/3 genotype
(Figure 4.14). Thus, using this genotyping methodology, samples that do not conform to
the common melting groups would be selected for cloning and sequencing to determine
the genotype of the sample. This approach may potentially lead to the discovery of
novel alleles, which would remain uncharacterised using alternative techniques, such as
PCR amplicon size determination and restriction fragment length polymorphisms.
Figure 4.14 Differentiation of rare and common simulated (GT)n genotypes using HRM
analysis. Plasmid alleles containing the SLC11A1 (GT)n common (alleles 2 and 3) and
rare (alleles 5 and 9) alleles were mixed to simulate different heterozygous genotypes.
The first derivative profiles and difference plot, are shown (left and right sides of
panels, respectively) with the different colours representing different genotypes.
99
4.3.4 Validation of the SLC11A1 (GT)n and (CAAA)n HRM
Genotyping Methodologies
The successful differentiation of the simulated genotypes showed that the SLC11A1
(GT)n and (CAAA)n microsatellite repeats could be reliably genotyped using the
optimised HRM methodology developed in the current study. Validation of the (GT)n
and (CAAA)n genotyping methods was therefore subsequently conducted using gDNA
samples derived from different individuals. During the optimisation of the HRM
genotyping methodologies it was found that a reasonable quantity of DNA is required
for accurate genotyping to ensure all samples amplify with a similar Ct value.
Blood is the most common source of gDNA for genotyping studies. However, the
collection of blood is an invasive technique that may deter individuals from
participating in a study, particularly when children are involved in the sample cohort
(Harty et al., 2000, Lum and Le Marchand, 1998). A fast and non-invasive method of
DNA collection and extraction, in conjunction with the HRM methodology, would be
ideal for high-throughput genotyping of samples. Such a high-throughput genotyping
technique is required to enable association studies to analyse large enough sample sizes
to have the statistical power to identify authentic associations (Section 1.3.5).
4.3.4.1 Direct use of FTA Card Punches in the PCR
A non-invasive source of gDNA is buccal cells. We previously collected buccal cell
gDNA samples through a combined method of mouthwash collection followed by FTA
card immobilisation (n=30) (Section 4.2.2.1.1 and 4.2.2.1.2). The collected gDNA
samples were subsequently genotyped for the (GT)n and (CAAA)n microsatellite repeats
by cloning and sequencing (unpublished). The combined methodology (mouthwash and
FTA card) overcame several problems, which have individually limited the use of these
techniques in genotyping studies (London et al., 2001, Milne et al., 2006, Mulot et al.,
2005). The combined method of the immobilisation of gDNA from a mouthwash
sample on the FTA card resulted in a high yield of DNA, an even distribution of the
immobilised DNA across the card and the incorporation of a rapid and less labour
intensive DNA extraction technique.
100
Direct addition of washed FTA cards to the optimised real-time PCR (Section 4.2.2.2.1
and 4.2.2.4.2) to validate the HRM genotyping methodologies, resulted in amplification
of the FTA card samples over a wide range of Ct values, with inconsistent results
among replicates (Figure 4.15). The varied Ct values were most likely due to the
presence of the FTA card punch within each well of the PCR, which inhibited complete
fluorescence acquisition from the sample, therefore, not allowing assessment of the
quality of the amplification. Also, significant levels of noise were observed early in the
amplification process from reactions containing FTA cards, which was absent from the
amplification profiles of reactions containing plasmid DNA samples (Figures 4.8 and
4.15). Due to the inability to determine the quality of the amplification, the use of the
direct addition of an FTA card punch was not optimal for the (GT)n and (CAAA)n HRM
genotyping methodologies.
Figure 4.15 Real-time PCR quantification profiles of amplified plasmid alleles and
FTA card immobilised gDNA samples. The quantification plots show the substantial
background noise and low Ct values for the amplification when FTA card punches were
added directly to the PCR as compared to the use of plasmid DNA as template.
101
4.3.4.2 HRM Genotyping of Samples after Elution of DNA from FTA
Cards
As the use of a micropunch from an FTA card as the source of gDNA directly added to
the real-time PCR for HRM curve analysis was inadequate, an alternative strategy was
explored. Several studies have reported the removal/elution of DNA from the FTA card
by enzymatic digestion or elution into an elution solution (Heath et al., 1999, Johanson
et al., 2009, Lema et al., 2006, Rajendram et al., 2006), thus allowing the addition of
gDNA directly to the PCR without the need for the inclusion of the FTA card.
Therefore, the efficacy of eluting the DNA from an FTA card was investigated by the
addition of an FTA card punch to different volumes of TE buffer (Section 4.2.2.2.2).
PCR amplification of the gDNA eluted using TE buffer resulted in a low level of
amplification from the smallest elution volumes (25, 50 and 75μl) (Figure 4.16). While
this method overcame the issue of the addition of the FTA card punch directly to the
real-time PCR, the level of amplification achieved was much lower than that obtained
with the direct addition of the washed FTA card (positive control). Therefore, this
approach was not feasible for use in the HRM genotyping methodologies.
Figure 4.16 PCR amplification of eluted gDNA from FTA cards using different
volumes of TE buffer. FTA cards were added to different volumes of TE Buffer (25, 50,
75, 100, 150 and 200μl) and heated (99oC for 15min). A 5μl aliquot of each eluate was
added to a PCR for the amplification of a 208bp SLC11A1 promoter region using the
HSNRAMPA-F/R primer set (Section 2.2.2.1). Post-PCR analysis of amplicons by
agarose gel electrophoresis is shown. NTC denotes the no template control, while the
positive control contained a single 2mm FTA card punch with immobilised gDNA.
102
Another elution technique was trialled, which used pH treatment with RT elution
(Section 4.2.2.2.2). This method has been used to elute high quality DNA with
subsequent PCR amplification from 3 year old bacterial DNA samples immobilised on
FTA cards (Rajendram et al., 2006). In this method, FTA card punches were exposed to
an EDTA solution (pH 13.0) to elute gDNA, followed by the addition of Tris buffer (pH
7.0), resulting in eluted gDNA in TE buffer (Section 4.2.2.2.2). PCR amplification of
gDNA (Section 2.2.2.1), eluted using the pH treatment, did not produce any
amplification, suggesting that the elution technique failed to elute a sufficient amount of
gDNA from the FTA card.
4.3.4.3 Amplification from Buccal Cells Added Directly to the PCR
The elution of gDNA from the FTA cards resulted in insufficient amounts of gDNA
being recovered for HRM genotyping applications. The source of the DNA on the FTA
cards was buccal cells from a mouthwash sample, which has been shown to result in a
very high DNA yield (London et al., 2001, Mulot et al., 2005). Thus, if buccal cells
could be added directly to the PCR it would increase the template gDNA concentration
in the reactions. Previously collected and frozen mouthwash samples (one year old), as
well as fresh mouthwash samples (Section 4.2.2.1.1) containing buccal cells (n=4) were
washed (Section 4.2.2.2.3) to remove any PCR inhibitors and 5μl of the washed buccal
cells was added directly to the PCR (Section 2.2.2.1) (Figure 4.17). The buccal cells
from one of the fresh mouthwash samples would not adhere as a pellet, when repeatedly
centrifuged during the washing of the cells and was therefore not analysed any further.
The inability to pellet buccal cells from mouthwash samples has been previously
reported, where it was suggested that the presence of salivary mucins results in high
viscosity of the samples, hindering the collection of buccal cells by centrifugation
(Aidar and Line, 2007).
Use of the one year old frozen samples resulted in a very low level of amplification in
two out of the four samples (Figure 4.17A), while use of fresh samples resulted in good
amplification in only two of the three samples (Figure 4.17B). The direct addition of
buccal cells to the PCR appears to result in strong amplification when samples are fresh,
however, the reliability of this method is not very good, as only 50% of fresh
mouthwash samples resulted in the production of a PCR product.
103
Figure 4.17 PCR amplification of the SLC11A1 promoter region containing the (GT)n
microsatellite repeat from buccal cells. One year old (A) and fresh (B) buccal cells were
added to a PCR containing the HSNRAMPA-F/R primer set to produce a 208bp
amplicon. NTC denotes the no template control.
4.3.4.4 Introduction of a Nested PCR Approach to Allow for the
Validation of the HRM Assay for the (CAAA)n Polymorphism
The previously trialled methods of gDNA collection and extraction were insufficient to
allow optimal PCR amplification to validate the HRM genotyping assays. Therefore, a
nested PCR approach, utilising gDNA immobilised on the FTA card, was employed to
allow for enrichment of the sequence of interest for genotyping. A nested PCR uses two
successive rounds of amplification where the second round of amplification utilises a
second primer set specific to a region within the first generated amplicon (Sections
4.2.2.4.3 and 4.2.2.4.2). In this case, the second round, real-time PCR product, was
subsequently analysed by HRM curve analysis using the HR-1 instrument (Sections
4.2.2.5 and 4.2.2.6.2).
This nested PCR approach allowed the successful differentiation of all (n = 30)
genotypes of the SLC11A1 (CAAA)n polymorphism by HRM analysis using the HR-1
(Figure 4.18). Thus, the nested PCR approach utilising FTA card immobilised gDNA
enabled the validation of the (CAAA)n HRM genotyping methodology. However, using
this method the different (GT)n promoter genotypes could not be distinguished. It was
found that all samples melted as a single group and different genotypes could not be
distinguished, however, the different simulated (GT)n plasmid genotypes, could be
distinguished using this methodology.
104
The inability to genotype the (GT)n promoter polymorphism was likely attributable to
the quality of gDNA isolated from buccal cells. Buccal cells are exposed to carcinogens
and mutagens and exhibit high rates of cell turnover with rapid cell proliferation and
concomitant DNA replication. A positive correlation between age and microsatellite
instability in buccal cells has been reported (Slebos et al., 2008). Collectively, these
factors may be problematic for the genotyping of a complex microsatellite repeat, such
as the (GT)n polymorphism.
Figure 4.18 Genotyping of the SLC11A1 (CAAA)n repeat using a nested PCR protocol
utilising FTA card immobilised gDNA from buccal cells. The normalised melting
curves and the corresponding difference plot are shown on the left and right,
respectively. The different colours represent replicates of the same sample.
4.3.4.5 Validation of the (GT)n HRM Genotyping Assay using gDNA
Isolated from Blood
Due to the inability to successfully genotype the (GT)n promoter polymorphism using
the nested PCR technique, gDNA isolated from blood was trialled to validate the (GT)n
HRM genotyping methodology. The method of gDNA collection utilised a diabetic
lancet to draw several drops of blood (total volume of approximately 100μl) followed
by gDNA extraction using a commercial extraction kit (Section 4.2.2.1.3). While this is
an invasive technique and a more expensive method of gDNA collection, as compared
to DNA collected using FTA cards, a high quantity and quality of isolated gDNA was
obtained (Figure 4.19).
105
Figure 4.19 Representative image of the gDNA isolated from whole blood collected by
diabetic lancet followed by extraction using a commercial spin column system.
Due to the high quality and quantity, the gDNA extracted from whole blood was used to
validate the optimised HRM genotyping methodologies for both the (GT)n and
(CAAA)n microsatellite repeats (Sections 4.2.2.4.2, 4.2.2.5 and 4.2.2.6.2). Using gDNA
isolated from the blood allowed for 100% of collected samples (n = 10) to be correctly
genotyped for both the (GT)n and (CAAA)n polymorphisms. Confirmation of the
genotypes of all samples was completed by sequence analysis. Homozygote and
heterozygote promoter (GT)n and (CAAA)n genotypes separated into distinct melting
groups (Figure 14.20). Although homozygosity for (GT)n allele 2 was not represented in
any of the collected samples, the (GT)n HRM genotyping methodology was able to
differentiate the more frequently occurring homozygous allele 3 and heterozygous allele
2/3 genotypes.
106
Figure 4.20 Validation of the HRM genotyping methodology using gDNA extracted
from blood. (GT)n (A) and (CAAA)n (B) normalised and temperature shifted or
normalised melting curves, and the respective difference plots, are shown on the left and
right, respectively. The different colours represent replicates of the same sample.
4.3.5 Genotypes of the SLC11A1 (GT)n and (CAAA)n Repeat
can be Differentiated using the Eppendorf realplex Real-Time
PCR Instrument
During the optimisation of the HRM genotyping methodology using real-time PCR, it
was found that simulated plasmid genotypes of the (GT)n and (CAAA)n microsatellite
repeats could be differentiated using the melting curve application on the Eppendorf
mastercycler realplex (a non-dedicated melter) based on the peak maxima of the first
derivative profile of the melting curves. Table 4.3 shows the melting temperature and
the range of temperatures obtained for seven different experiments. In each experiment
the simulated genotypes were consistently discriminated using the realplex instrument,
107
with no overlap observed between the melting temperature ranges of the different
genotypes within each experiment.
Table 4.3 Differentiation of Simulated Common SLC11A1 (GT)n Promoter Genotypes
using the Eppendorf Mastercycler ep realplex.
Run No.
Replicates
1
2
3
4
5
6
7
6
5
5
5
5
5
5
Homozygous Allele 2
Temp
Range
88.0
(87.9-88.2)
88.0
(87.9-88.2)
88.0
(88.0-88.1)
88.0
(87.9-88.0)
88.0
(87.9-88.0)
88.4
(88.4-88.5)
87.9
(87.8-88.0)
Homozygous Allele 3
Temp
Range
88.3
(88.2-88.4)
88.4
(88.3-88.5)
88.4
(88.3-88.5)
88.2
(88.1-88.4)
88.4
(88.1-88.4)
88.9
(88.8-89.0)
88.3
(88.3-88.5)
Heterozygous Allele 2/3
Temp
Range
87.6
(87.6-87.8)
87.7
(87.5-87.8)
87.6
(87.5-87.8)
87.6
(87.4-87.8)
87.6
(87.4-87.8)
87.9
(87.8-88.1)
87.5
(87.3-87.7)
The melting parameters of the Eppendorf real-time instrument were varied to identify if
different genotypes could be differentiated based on the comparison of the shape of
their melting curves. Melting of samples at a rate of 0.1oC/s produced high levels of
background noise, which prevented the determination of the true shape of the curve and
also resulted in additional peaks being apparent on the first derivative profile that the
software would report as a melting transition. When the samples were melted at a rate of
0.4oC/s, the majority of the background noise disappeared and this allowed for better
discrimination of the different genotypes (Figure 4.21). The different genotypes separate
into different groups showing that genotyping of these microsatellite repeats is possible
using the Eppendorf ep realplex instrument.
The Eppendorf mastercycler ep realplex is not a dedicated high resolution melting
instrument, suggesting that the designed and optimised HRM genotyping methodologies
for the (GT)n and (CAAA)n repeats are versatile and can be performed using other nondedicated melters (i.e. using real-time PCR instruments). This is the first reported case
of the Eppendorf instrument being able to differentiate genotypes using melt curve
analysis which has led to the preparation of this work as an invited technical application
note (Eppendorf Application Note 206).
108
Figure 4.21 First derivative melting profiles for genotyping the SLC11A1 (GT)n and
(CAAA)n polymorphisms using the Eppendorf ep realplex real-time PCR instrument.
109
4.4 DISCUSSION
4.4.1 Introduction
Current methods for the genotyping of the SLC11A1 promoter (GT)n and (CAAA)n
polymorphisms are inadequate as they do not allow sufficiently large sample sizes to be
analysed in a timely manner to allow completion of large association studies, which are
required to increase the statistical power to detect authentic associations. Current
genotyping methods lack the sensitivity to detect all microsatellite variants and/or are
costly, time consuming and laborious. In this chapter an optimised genotyping
methodology, based on HRM curve analysis, was developed to genotype
polymorphisms within the SLC11A1 gene: the (CAAA)n polymorphism and the three
most common (GT)n promoter genotypes.
It was shown, through careful design of the HRM genotyping assays, and the rigorous
optimisation of the real-time PCR and HRM parameters, that simulated genotypes of the
(GT)n and (CAAA)n polymorphisms could be differentiated based on their melting
profiles. Furthermore, through the use of simulated genotypes, it was shown that the
(GT)n genotyping methodology is capable of detecting the less common (GT)n alleles in
a heterozygous form. While using the simulated genotypes provided proof of principle
of the ability to detect the SLC11A1 microsatellite genotypes using HRM, validation of
the HRM genotyping methodologies was completed using gDNA samples isolated from
whole blood and buccal cells.
4.4.2 Design and Optimisation of the HRM Genotyping
Assays
The process of amplicon design and optimisation is crucial for the development of a
robust HRM methodology (White and Potts, 2006). A range of amplicon lengths,
containing the (GT)n and (CAAA)n microsatellite repeats, were designed and
amplification parameters were optimised for each polymorphism (Sections 4.3.1 and
4.3.2). For both the (GT)n and (CAAA)n HRM genotyping assays, the smallest
amplicons produced the most consistent amplification and post-PCR melting profiles
(Section 4.2.2.3), in accordance with previous observations (Gundry et al., 2003,
110
Herrmann et al., 2006, Liew et al., 2004, White and Potts, 2006, Wittwer et al., 2003).
Smaller amplicons consistently provide the greatest overall fluorescence change
between different alleles/genotypes. This would be due to the production of single
melting domain curves by smaller amplicons (Gundry et al., 2003, Ririe et al., 1997). In
addition to this, the use of a smaller amplicon means that the polymorphism accounts
for a greater percentage of the total length of the amplicon and therefore, will show
larger differences between different genotypes. It is well noted that amplicons up to 400
bases have the ability to discriminate different genotypes (Reed and Wittwer, 2004,
White and Potts, 2006) with scanning sensitivity near 100% with amplicons less than
400bp (Reed and Wittwer, 2004). Larger amplicons tend to have multiple melting
domains producing more complex melting curves which are harder to analyse (White
and Potts, 2006).
All parameters of the genotyping real-time PCR (Section 4.3.2) and post-PCR HRM
analysis (Section 4.3.3.1) were vigorously optimised because the intercalacting dye used
is not specific for the amplicon, and will bind to any double stranded DNA present, any
non-specific amplification products formed, primer dimers or contaminating DNA,
lowering the resolution and sensitivity of the melting profile and preventing the
differentiation of genotypes.
It was found that HRM analysis is sensitive to subtle changes in reaction conditions and
is highlighted by the observation that the use of different primer concentrations, for the
production of the same amplicon, resulted in significant differences in the melting
profile for the same plasmid allele (Section 4.3.2.3, Figure 4.9). Furthermore, the
melting temperature of an amplicon has been shown to be affected by the MgCl2
concentration of the PCR (Ririe et al., 1997). As heteroduplex products melt, the single
stranded DNA produced is able to reanneal with complementary single stranded DNA
to produce new homoduplexes (as the melting temperature of these homoduplexes has
not yet been reached) causing artificial inflation of the fluorescence level. Grundy et al
(2003) have shown that low magnesium concentration limits strand reassociation
producing more sensitive melt curves. Additionally, it was also found, and has been
previously reported, that the different template sources and methods of gDNA
extraction produce melt curves which have subtle differences (White and Potts, 2006).
Therefore, consistency of all reaction parameters between individual samples within the
111
same experiment is important to allow an accurate comparison of the melting
characteristics. This ensures that genotypes can be differentiated.
It was also found that the quality of real-time PCR amplification of individual samples
had a large effect over the quality of the melt curve achieved. The best melting profiles
were observed when the samples produced similar consistent amplification profiles,
with low Ct values (20-25), steep amplification plots and a similar level of end
fluorescence (Figure 4.8). When these criteria were satisfied, optimal differentiation
between the different genotypes of the (GT)n and (CAAA)n polymorphisms was
achieved. Samples with late amplification (Ct values greater than 30), or lower end
fluorescence, and samples resulting in unusual amplification profiles all produced melt
curves that were inconsistent with the other replicates of a particular sample. After each
real-time PCR experiment was completed, the quality of the amplification of each
sample was assessed through the analysis of the quantification plot and the melting
curve from the real-time PCR, before the samples were melted using the HR-1. Samples
which did not meet the requirements of the optimal real-time amplification were omitted
ensuring that the samples that underwent HRM were those that would produce melt
curves with the greatest differentiation between genotypes.
4.4.3 Validation of the HRM Genotyping Assays
The quality of the real-time PCR amplification achieved is directly associated with the
quantity and quality of the template (gDNA). Successful differentiation of the (GT)n and
(CAAA)n genotypes was achieved using cloned repeats used to simulate different
genotypes (Section 4.3.3.2). However, validation of the genotyping methods with
gDNA proved difficult. The initial validation attempts were completed using gDNA
isolated from buccal cells. Buccal cells were used as they are a readily available source
of gDNA and are commonly used in other applications (for example forensics) but their
use is not common in genetic epidemiological studies. Buccal cells and the range of
isolation techniques trialled allowed for the collection of gDNA in a fast and noninvasive method which is ideal for the production of a complete high-throughput
genotyping methodology, encompassing DNA collection through to HRM analysis.
112
The direct addition of FTA card bound buccal cell DNA (as FTA card punches) to the
real-time PCR resulted in late amplification profiles (Section 4.3.4.1). Previous
successful use of the FTA card samples in standard PCR resulted in consistent high
amplification, thus it was thought that the poor amplification observed was due to the
presence of the FTA card in the reaction inhibiting the total fluorescence acquisition of
the samples. A similar conclusion was reported in another publication (Muthukrishnan
et al., 2008). Therefore, this method of gDNA collection was not suitable for the HRM
genotyping methodology as the quality of the amplification could not be assessed.
Several other methods were trialled to validate the HRM genotyping methodologies
using buccal cell DNA. This included elution of the DNA from the FTA card with TE
buffer or pH treatment, and the direct addition of buccal cells to the PCR (Sections
4.3.4.2 and 4.3.4.3). All of these methods allowed the addition of liquid gDNA to the
PCR and therefore, the inhibition of the fluorescence acquisition observed with the
direct addition of the FTA card to the real-time PCR would was eliminated. However,
these either resulted in poor or inconsistent amplification.
A nested PCR approach was subsequently employed which allowed for the successful
validation of the (CAAA)n genotyping methodology (Section 4.3.4.4). However, the
nested PCR approach did not allow for the successful genotyping of the (GT)n promoter
polymorphism. The inability to genotype the (GT)n promoter polymorphism by the
nested PCR approach was attributable to the quality of the gDNA isolated from the
buccal cells. Buccal cells are exposed to carcinogens and mutagens and exhibit high
rates of cell turnover with rapid cell proliferation and concomitant DNA replication.
Therefore, these cells may be more prone to replication errors, especially at complex
microsatellite repeat sites like the SLC11A1 promoter. There are also a range of
environmental factors that can result in allelic alterations in buccal cells (Gabriel et al.,
2006, Pai et al., 2006, Pai et al., 2002, Rupa and Eastmond, 1997, Vuyyuri et al., 2006,
Yang et al., 2003). A positive correlation between age and microsatellite instability in
buccal cells has also been reported (Slebos et al., 2008). Collectively, these factors may
be problematic for the genotyping of a complex microsatellite repeat, such as the (GT)n
polymorphism using gDNA isolated from buccal cells.
113
High quality gDNA appears to be essential to the success of genotyping the (GT)n
promoter polymorphism, as this study is not the first to have encountered issues. In an
association study of SLC11A1 polymorphisms with M.tuberculosis, Soborg et al. (2002)
were unable to genotype some patients at the promoter (GT)n polymorphism due to the
poor quality of gDNA samples extracted from frozen whole blood. In another
association study, PCR products were unobtainable in 39% of the population studied
when DNA extracted from blood was used (Paccagnini et al., 2009). The inability to
genotype the total population of a study lowers the sample size analysed and, therefore,
also the power to find a significant association.
Both the (GT)n and (CAAA)n HRM genotyping methods were validated using gDNA
isolated from blood obtained through a finger prick using a diabetic lancet and gDNA
extraction using a commercial system (Section 4.3.4.5). This technique proved
successful as the extracted gDNA was of very high quality and quantity (Figure 4.19).
The isolation of gDNA from blood obtained through a fingerprick is an ideal method of
DNA extraction and collection as it is rapid and results in a high quantity and quality
gDNA, which is required for the collection of large sample numbers for association
studies.
4.4.4 Sample Spiking with a Known Genotype May Increase
the Robustness of the HRM Assays
In some HRM experiments, different homozygous samples have near identical melt
curves, meaning that wild type and mutant homozygous genotypes are
indistinguishable. This commonly occurs with SNP genotyping where the nearest
neighbor interaction of the immediate bases adjacent to the polymorphism is the same
for different variants of the polymorphism (Breslauer et al., 1986). It is predicted that 416% of SNPs (and potentially a number of insertion/deletion polymorphisms) fall into
this category. A method to differentiate these SNPs has been described where each
sample is spiked with a known reference amplicon, usually containing the most frequent
(wild type) variant (Palais et al., 2005, Reed et al., 2007). The addition of the reference
amplicon to wild type homozygous samples results in no change in the shape of the
melting profile, however, the addition of the wild type amplicon to the homozygous
mutant samples causes the formation of heteroduplexes, which have lower melting
114
temperatures, thereby altering the shape of the melting profile to enable differentiation
between different homozygous genotypes.
For the (CAAA)n genotyping methodology, the difference plots were analysed from
normalised only melt curves without subsequent temperature shifting (Section 4.3.3.1).
When the (CAAA)n melt curves were temperature shifted, (CAAA)2/2 and (CAAA)3/3
homozygous genotypes became indistinguishable (Figure 4.11). Therefore, if
temperature shifting is a requirement for future analysis when using the (CAAA)n
genotyping methodology, spiking all of the samples with a reference gDNA of known
genotype will allow for the differentiation between the different homozygous samples.
It was found that the optimised (GT)n genotyping methodology is more prone to slight
variations in the quality of the melting curves compared to the (CAAA)n genotyping
methodology. This is likely attributable to the number of base pair differences that the
two methodologies are detecting, a 2bp and 4bp deletion for the (GT)n and (CAAA)n
methods, respectively. While it was shown that the genotyping methodology can detect
the most common (GT)n homozygous and heterozygous genotypes, the addition of a
reference amplicon, to the real-time PCR, may increase the robustness of the
methodology, increasing the differentiation between genotypes. Also, in populations
where there is a particularly high frequency of another (GT)n allele (e.g. allele 7 in
Asian populations or allele 5 in Greek populations) (Table 1.3), spiking of the samples
with a reference sample of known genotype may provide a way to differentiate
genotypes of these ethnic specific alleles from the more common genotypes.
4.4.5 The HRM Genotyping Assays can Detect Novel Variants
and Rare (GT)n Alleles in a Heterozygous Form
Currently, the most common genotyping methodology for the (GT)n promoter and
(CAAA)n polymorphisms, is through size determination of amplified fragments
containing the microsatellite repeats. However, this method is unable to detect all alleles
at the (GT)n repeat (as rare alleles are mis-reported due to the common length of alleles;
allele 7 is mis-reported for allele 1 and allele 5 for allele 3) or identify novel sequence
variants of the (GT)n and (CAAA)n repeats. One of the major advantages of HRM
analysis is the ability to simultaneously genotype a polymorphism and also scan for any
115
novel sequence variants (Liew et al., 2004, Palais et al., 2005, Reed and Wittwer, 2004,
Wittwer et al., 2003, Zhou et al., 2005). Through the use of simulated genotypes from
cloned variants, it was shown that the (GT)n genotyping methodology was capable of
detecting the less commonly occurring alleles in a heterozygous form compared to the
common heterozygous genotype (allele 2/3) (Section 4.3.3.3). Therefore, due to the
ability to detect rare alleles, both the (GT)n and (CAAA)n HRM genotyping
methodologies should also be sensitive enough to reveal novel microsatellite variants.
The rare alleles and novel variants, detected using the optimised HRM genotyping
methodologies, will appear as samples which have different shaped melting curves
compared to the common genotypes. These samples could then be selected for cloning
and sequence analysis to determine their genotypes. Cloning and sequencing of (GT)n
polymorphism is the only genotyping method enabling each allele to be separated and
analysed individually. Thus, unlike the most common method of genotyping the (GT)n
and (CAAA)n microsatellites, the designed and optimised HRM methodologies have the
ability to identify novel allelic variants and rare (GT)n alleles, which would be missed or
misidentified using current methodologies.
4.4.6 Conclusion
In this chapter, optimised genotyping methodologies have been developed, based on
HRM curve analysis, which can successfully genotype the (GT)n and (CAAA)n
polymorphisms within the SLC11A1 gene. The optimised HRM genotyping
methodologies allow for a conservative estimate of approximately 260 samples a week
to be genotyped using the HR-1 instrument. When compared to the 10 samples per
week that can be genotyped by traditional cloning and sequencing, the estimate
represents a significant increase in the number of samples that can be genotyped. This
genotyping methodology has the potential to be further developed and scaled up through
the use of a real-time PCR instrument that also has built-in HRM and auto-call
genotyping capabilities. These instruments, which include the Lightcycler (Roche
Applied Science, USA) or Rotorgene (Qiagen, Germany), allow 96-384 samples to be
melted at the same time meaning thousands of samples could be genotyped per week.
While the HR-1 instrument is recognised as the gold standard for HRM analysis (Reed
et al., 2007), a recent study found that the sensitivity and specificity of the HR-1, the
Lightcycler and Rotorgene to assess a range of different SNPs was comparable between
116
the different platforms (White and Potts, 2006). Furthermore, the ability to differentiate
the (GT)n and (CAAA)n polymorphisms using the Eppendorf mastercyler ep realplex
suggests that the designed and optimised HRM genotyping methodologies are versatile
and can be performed using other non-dedicated melters (Section 4.3.5).
HRM has most commonly been used for the genotyping of SNPs, however, HRM
methodologies are more frequently being used to genotype microsatellites and
insertion/deletion mutations (Mackay et al., 2008, Mader et al., 2008, Marziliano et al.,
2000, Pirulli et al., 2000, Reed et al., 2007, Vaughn and Elenitoba-Johnson, 2004). For
the analysis of polymorphic microsatellites, these HRM methods are commonly used as
a scanning technique where unknown samples are compared to a wild type sample to
identify variants with different melting profiles. These scanning techniques can identify
the presence of sequence variants, however, they do not provide information as to the
nature of the variant that has been identified. In a recent review, the ability to use HRM
to completely genotype short tandem repeats was suggested to be of significant
importance for the next step in HRM technology (Reed et al., 2007). The optimised
(GT)n HRM genotyping methodology is a step towards complete genotyping of short
tandem repeats, as the most common (GT)n genotypes could be successfully genotyped
and the identification of rare or novel variants was possible.
The designed and optimised HRM methodologies allow for the sensitive, accurate and
rapid determination of SLC11A1 (GT)n and (CAAA)n microsatellite polymorphisms.
Therefore, the HRM methodologies will facilitate the completion of association studies
analysing larger sample sizes required to identify true or significant associations. The
analysis of larger sample sizes, enabled by the high-throughput HRM genotyping
methodologies, will aid in the determination of the association between the presence of
variants at the (GT)n promoter microsatellite and (CAAA)n 3’UTR polymorphisms and
the incidence of infectious and autoimmune diseases.
117
CHAPTER 5 – FUNCTIONAL ANALYSIS OF
THE SLC11A1 PROMOTER
PART 1: Discovery of Important SLC11A1 Promoter Elements
by Bioinformatic Analysis.
PART 2: Design and Construction of SLC11A1 Promoter
Constructs for Functional Analysis.
118
5.1 INTRODUCTION
5.1.1 The SLC11A1 Promoter
The SLC11A1 promoter contains several polymorphisms which have been shown to
alter SLC11A1 expression (Figure 5.1). One of these polymorphisms is the (GT)n
microsatellite repeat, which is located approximately 240bp upstream of the
transcription start site. The (GT)n microsatellite is a complex repeat of GT units
interspersed by AC dinucleotides. Of the nine polymorphic variants identified, alleles 2
and 3 account for greater than 95% of the allele frequencies in most populations
(Section 1.3.1). The presence of allele 3 results in significantly higher basal level of
SLC11A1 expression compared to allele 2 (Section 1.3.2). The -237C/T polymorphism
is another functional polymorphism located 40bp downstream of the (GT)n
microsatellite repeat. The presence of the T variant, which has only been identified in
combination with (GT)n allele 3, results in lower SLC11A1 expression level, comparable
to that driven by (GT)n allele 2 (Section 1.3.3).
Due to the important role that SLC11A1 plays in the activation of a Th1 mediated
immune response to macrophage specific pathogens, it is thought that these functional
promoter polymorphisms may play a role in conferring resistance/susceptibility to
infectious and Th1-mediated autoimmune/inflammatory diseases. A large number of
association and linkage studies have been conducted to determine the association of
SLC11A1 promoter variants with the incidence of a range of infectious and autoimmune
diseases (Section 1.3.4). These studies have attempted to determine if an association
exists in a blinded fashion, as functional knowledge of the regulatory mechanisms
controlling SLC11A1 transcription, which ultimately mediates the differential SLC11A1
expression observed with the functional promoter variants, is lacking.
The work completed in this thesis has adopted a functional approach to gain a greater
understanding of the SLC11A1 promoter. The first aim was to determine the mechanism
by which SLC11A1 is regulated at the level of transcription initiation and to determine if
the SLC11A1 promoter mediates bidirectional transcription. The second aim was to
determine the mechanism by which SLC11A1 expression is altered by the different
polymorphic sequence variants.
119
Promoter
Intron 1
5’ UTR
Transcription
start site
Genomic DNA
Polymorphic (GT) n Z-DNA
-237C/T
(GT)n Allele 2
Potential
Z-DNA
(GT)10
-237C
(GT)n Allele 3
(GT)9
-237C
-237 Allele T
(GT)9
-237T
Figure 1: Sequences of functional SLC11A1 polymorphisms
Figure 5.1 SLC11A1 promoter organisation showing the positions of the SLC11A1
(GT)n and -237C/T promoter polymorphisms. The upper panel is a representation of the
SLC11A1 promoter and shows the location of sequence variants relative to the
transcription start sites. The lower image shows the sequences of the three common
promoter variants, which have been shown to modulate SLC11A1 expression levels.
(GT)n allele 2 contains a polymorphic repeat of 10 GT repeats and is always associated
with the more frequent -237 C variant, while (GT)n allele 3 contains 9 GT repeats and is
associated with both the commonly occurring -237 C and less commonly occurring -237
T variants.
To complete these aims a systematic bioinformatic assessment of the SLC11A1
promoter, to identify important promoter regions, was undertaken (Chapter 5, Part 1).
The findings of the bioinformatic analysis guided the preparation of expression
constructs containing promoter regions of varying size and containing regions of
putative importance with regard to transcriptional regulation (Chapter 5, Part 2). The
promoter expression constructs were tested in human cell lines to determine the
functional significance of the putative functional elements (identified in silico) (Chapter
6, Part 3). After promoter activity assessment, the sequences of regions identified to
play a functional role in the mechanism of SLC11A1 transcription were re-assessed for
transcription factor binding sites to explain the functional effects observed.
120
5.1.2 Mechanisms of Eukaryotic Transcription Initiation
RNA polymerase II (pol II), which transcribes protein-coding genes into an mRNA
transcript, cannot directly recognise (in a sequence specific manner) a target promoter to
initiate transcription. Gene promoters contain different sequence elements which bind
proteins, in a sequence specific manner, to recruit pol II, thereby facilitating the
regulated cell specific expression of a gene. Core promoter elements bind proteins
involved in the formation of the basal transcriptional complex, while proximal and
distal enhancer/repressor elements (located proximal and distal to core promoter
elements, respectively) bind transcription factors which enhance/repress transcription
(Latchman, 2004).
5.1.2.1 The Basal Transcriptional Complex
The basal transcriptional complex describes an essential multi-component complex of
factors required to recruit pol II, which subsequently binds to this multi-component
complex, and initiates transcription (Figure 5.2). In promoters with canonical TATA
boxes, the first step in the formation of the transcriptional complex is the binding of
TATA-binding protein (TBP) to a TATA consensus sequence (commonly
TATAa/tAa/t) located approximately 30bp upstream of the transcription start site
(Strubin and Struhl, 1992). Binding of TBP can only occur at consensus sites, which are
not packaged into nucleosomes, thus restricting TBP binding to genes/regions required
by the cell.
Binding of TBP to DNA results in the recruitment of TBP-associated factors (TAFs) to
form a complex, termed transcription factor IID (TFIID). Formation of the TFIID
complex at the core promoter results in the sequential recruitment of the factors TFIIA,
TFIIB, TFIIE, TFIIF and TFIIH, which assemble with pol II to form the basal
transcriptional complex (Figure 5.2). Dissociation of pol II from the basal
transcriptional complex then leads to transcription initiation (Latchman, 2004).
121
Figure 5.2 Formation of the basal transcriptional complex. (A) TBP binds to the TATA
element recruiting TAF to form TFIID. (B) Formation of TFIID then recruits other
factors and RNA polymerase II (pol II) allowing initiation of transcription. Key: TATA
– TATA box element, Inr – Initiator element, TBP – TATA binding protein, TAF –
TBP associated factor, TFIID – transcription factor (for RNA polymerase II
recruitment) D.
5.1.2.2 Transcription from Non-Canonical (TATA-less) Promoters
SLC11A1 does not have a conventional TATA or CCAAT box promoter and the
mechanism by which SLC11A1 transcription initiation is mediated is not fully known
(Searle and Blackwell et al., 1999). Gene promoters lacking a canonical TATA box
element cannot directly interact with TBP to initiate the formation of the basal
transcriptional complex. However, in most cases, the binding of TBP is still required for
the formation of the basal transcriptional complex (Smale, 1997, Smale and Kadonaga,
2003). Such promoters contain other core promoter elements, which recruit factors that
interact with and facilitate the positioning and binding of TBP or TFIID.
An initiator element (Inr) is a core promoter element, which can mediate transcription
independently of a TATA element (O'Shea-Greenfield and Smale, 1992). Initiator
elements have been suggested to be analogous to TATA elements and are located over
the transcription initiation start site where they recruit initiator binding proteins in a
sequence specific manner [Py Py A N T/A Py (Py – Pyrimidine, N – A, G, T or C)]
(Figure 5.3) (Smale et al., 1990, Zenzie-Gregory et al., 1992). The TFIID complex then
forms around, and interacts with, the protein bound at the initiator element (in
association with TFIIA), thus modulating the binding or the interaction of TBP with the
DNA (Emami et al., 1997). The other factors involved in the formation of the basal
transcriptional complex are then recruited. This mechanism is similar to the formation
of the basal transcriptional complex in promoters with a TATA element (Section
5.1.2.1).
122
Figure 5.3 Core elements involved in transcription from a non-canonical TATA-less
promoter. TATA box and Inr elements are able to mediate transcription initiaition
(elements in pink). Other core elements (blue) located upstream and downstream
associate with Inr (and TATA elements) to determine the location for the formation of
TBP as well as the basal transcriptional complex. Key: TATA – TATA box element,
TBP – TATA binding protein, TAF – TBP associated factor, TFIID – transcription
factor IID, pol II – RNA polymerase II, Inr – Initiator element, BREu – upstream TFIIB
response element, BREd – downstream TFIIB response element, MTE – motif ten
element, DPE – downstream promoter element, Sp1 – specificity protein 1, C/EBP –
CCAAT/enhancer binding protein, TSS – transcription start site.
Other essential core elements, located throughout the promoters of genes which lack a
TATA element, have also been described. The presence of these other essential core
elements alone is not sufficient to mediate the formation of the basal transcriptional
complex. Generally these essential core elements are associated with other elements
(such as an Inr). These other essential core elements are required to form the basal
transcriptional complex, as removal of these elements results in the loss of gene
expression. Examples of essential core elements include downstream promoter elements
(DPE), which are located 28bp downstream of the transcription initiation start site and
are generally found in conjunction with Inr elements, and TFIIB-recognition elements
(BRE), which associate in a sequence specific manner to a region analogous to the
location of a TATA element (Figure 5.3). Other core promoter elements that have been
described include the motif ten element (MTE), downstream core element (DCE) and X
123
core promoter element 1 (XCPE1). However, to date, these elements have not been well
characterised (Juven-Gershon et al., 2008) (Figure 5.3).
The CCAAT and GC box elements are other elements which may also be involved in
transcription initiation, and are generally located 70-150bp upstream of the transcription
start site (Figure 5.3). The CCAAT box elements recruit CCAAT/enhancer binding
protein (C/EBP), a group of proteins expressed in a range of tissues, while GC boxes
(consensus GGGCGG) bind the transcription factor Specificity Protein 1 (Sp1) and
Kruppel-like factors (KLFs) (Kaczynski et al., 2003, Liu et al., 2009). Multiple Sp1
sites have been shown to mediate transcription initiation in promoters which lack a
TATA element (Huber et al., 1998, Smale, 1997, Smale and Kadonaga, 2003). In
addition to transcriptional activation, recruitment of C/EBP and Sp1 to CCAAT and GC
box elements, respectively, has also been shown to repress transcription.
5.1.2.3 Transcriptional Activators and Repressors
If transcription initiation is restricted to core proteins involved in the formation of the
basal transcriptional complex, then transcription proceeds slowly (Burley and Roeder,
1996). The interaction of transcriptional activators with enhancer elements located
within the promoter region can increase the rate of transcription. These can be located
proximally or distally to the core promoter region. These factors can interact with
different components of the basal transcriptional complex, either through direct
interaction with, or through non-DNA bound secondary factors which then interact
with, the proteins involved in the formation of the basal transcriptional complex
(Latchman, 2004). Likewise, these elements can function to enhance transcription
through the modification of the chromatin structure. These enhancer proteins function to
stabilise or complement core protein interactions, thereby enhancing the rate of
formation of the basal transcriptional complex, resulting in an increased rate of
transcription. However, unlike TAFs, which direct the location and formation of the
assembly of the basal transcriptional complex, transcriptional activators do not directly
determine where transcription occurs and binding of an activator is not an essential
requirement for transcription initiation.
124
5.1.3 The SLC11A1 Promoter and Transcription
Since the determination of the SLC11A1 sequence (Blackwell et al., 1995, Cellier et al.,
1994), a number of in silico promoter studies have been conducted to determine the
mechanism of transcription initiation and to identify putative transcription factor
binding sites (TFBS) within the SLC11A1 promoter (Awomoyi, 2007, Blackwell et al.,
1995, Kishi et al., 1996, Searle and Blackwell, 1999).
The SLC11A1 promoter lacks consensus TATA, GC or CAAT box elements (Blackwell
et al., 1995). However, Kishi et al, (1996) identified a putative non-canonical TATA
box (TAAAA located at positions -37 to -33). Transcription from a promoter with a
canonical TATA box generally occurs from a single transcription start site, while
transcription from a non-canonical promoter results in multiple sites of transcription
initiation (Ince and Scotto, 1995). The lack of a TATA element in the SLC11A1
promoter is consistent with the presence of multiple transcription initiation start sites.
This finding is further corroborated by analyses of the murine Slc11a1 promoter, which
also lacks a canonical TATA, GC and CCAAT box elements, and possesses multiple
transcription start sites (Govoni et al., 1995, Wyllie et al., 2002). To date, other
potential DNA sequence elements involved in the formation of the basal transcriptional
complex, such as Inr or DPE, have not been identified within the SLC11A1 promoter.
The SLC11A1 promoter has also been assessed for the presence of enhancer elements,
which may recruit transcriptional activators (Figure 5.4) (Awomoyi, 2007, Blackwell et
al., 1995, Kishi et al., 1996, Searle and Blackwell, 1999). The previously published
putative TFBS are correlated with the haemopoietic/monocytic restricted expression of
SLC11A1 and the role of SLC11A1 a gene involved in immune modulation.
Additionally, putative binding sites involved in the regulation of SLC11A1 expression
due to exogenous stimuli IFN-γ and LPS have been reported (Figure 5.4). In addition to
the range of TFBS that have been described in the SLC11A1 promoter (Figure 5.4), a
string of heat shock transcription factor motifs have also been described (Blackwell et
al., 1995).
125
Figure 5.4 Location of previously published putative transcription factor binding sites
located within the SLC11A1 promoter. The blue boxes indicate the location of the
putative transcription factors within the SLC11A1 promoter (the scale located
underneath is relative to TSS1). Landmarks of the SLC11A1 promoter (the transcription
start sites and promoter polymorphisms) are also indicated. Numbers located below and
to the right of the boxes or landmarks indicate the location of the element (the 3’
nucleotide position). Key: TSS – transcription start site; NF-κB – nuclear factor kappalight-chain-enhancer of activated B cells; GM-CSF - granulocyte macrophage colonystimulating factor; NF-IL6 – nuclear factor IL-6; W-elem. – W-element; γ-IRE –
interferon-γ response element; AP-1 – activator protein 1; PU.1 – protein encoded by
SPI-1 (spleen focus by forming virus proviral integration 1) gene.
126
5.1.4 SLC11A1 Promoter Polymorphisms Modulate SLC11A1
Expression
The mechanism by which the promoter (GT)n microsatellite repeat and the -237C/T
polymorphisms alter expression of SLC11A1 remains unknown (Figure 1.8). Searle and
Blackwell (1999) suggested that the differences in expression levels, due to the presence
of (GT)n allele 2 or 3, may be attributable to a juxtaposition of LPS-related enhancer
elements, which are differentially affected by the two microsatellite variants.
Furthermore, Zaahl et al. (2004) suggested that the -237 T variant, when in cis with
(GT)n allele 3, influences IFN-γ and LPS response elements, resulting in a lower level
of expression as compared to the expression of the more common -237 C variant. Both
of these explanations suggest that transcription factors activated/expressed during
stimulation of monocytes/macrophages by the exogenous stimuli IFN-γ and LPS are
responsible for the differences in expression levels between the different promoter
variants. However, differences in SLC11A1 expression, mediated by the allelic variants,
also exist in the absence of stimulation (Figure 1.8), suggesting that these differences in
expression, mediated by variants at the (GT)n and -237C/T polymorphisms, exist prior
to the activation of cells.
5.1.4.1 The SLC11A1 (GT)n Microsatellite has Endogenous Enhancer
Activity
The SLC11A1 (GT)n microsatellite repeat has been shown to function as an enhancer
element. Promoter constructs containing repeat variants differing only in the length of
the microsatellite repeat show variation in promoter activity (Searle and Blackwell,
1999). The (GT)n microsatellite repeat is thought to form an alternative DNA structure,
known as Z-DNA (Blackwell et al., 1995). Z-DNA occurs primarily in DNA sequences
containing alternating purine/pyrimidine nucleotides, as found in the (GT)n
microsatellite repeat. Potential Z-DNA forming sequences are over represented in the 5’
UTR and promoter regions of genes (Schroth et al., 1992), such as SLC11A1, where
these microsatellite sequences are thought to have enhancer functions to upregulate
transcription (Bates and Maxwell, 2005, Kashi and Soller, 1999, Rich and Zhang,
2003). Therefore, the endogenous enhancement ability of the (GT)n microsatellite repeat
is thought to be mediated by the ability to form Z-DNA.
127
5.1.4.2 Z-DNA Structure and Function
Z-DNA has the potential to form in DNA sequences with alternating purine/pryimidine
bases when torsional stress is applied to the sequence (Peck et al., 1982). The most
common sequences for the formation of Z-DNA are alternating GC or GT repeats (Ho,
1994, Ho et al., 1986). Z-DNA, unlike the canonical B-DNA structure, has a left handed
turn, which can form transiently to reduce the high level of torsional stress/energy held
within the DNA (Wang et al., 1979). This conversion from a right handed to a left
handed structure is due to an alternation between anti (C/T) and syn (G) conformation
of the nucleotides producing the zig-zag backbone of Z-DNA (Figure 5.5).
B-DNA
Z-DNA
Figure 5.5 Comparison of the structure of right handed B-DNA to the left handed ZDNA. The primary structure of DNA consists of repeating nucleotides, which stack on
each other with a “stagger” due to the asymmetrical nature of nucleotides, causing the
strands to coil around each other in a right handed fashion producing the canonical BDNA, with 10.5 bases per helical turn. B-DNA can transition to Z-DNA in alternating
purine/pyrimidine sequences when stress (such as negative supercoiling) is applied. The
transition to Z-DNA causes the bases to flip, producing a left hand helical structure with
12 bases per helical turn. A single turn of Z-DNA reduces two turns of negative
supercoiling (Herbert and Rich, 1999).
128
5.1.4.2.1 Z-DNA Formation May Modulate Allelic Differences in SLC11A1
Expression
In vivo, negative supercoiling (the energy held within DNA due to the underwinding of
DNA) is maintained in DNA bound to nucleosomes. During transcription, nucleosomes
are removed resulting in the release of the energy from the DNA-nucleosome
interactions. The level of supercoiling and the amount of energy held within the DNA is
not evenly distributed along a chromosome, but is restricted to small DNA regions and
is dependent upon many complex factors, including the rate of transcription, the number
of active transcription complexes, local topoisomerase activity, the binding of specific
proteins, and the chromatin structure of the region (Bates and Maxwell, 2005, Kashi and
Soller, 1999).
During transcription, binding of the basal transcriptional complex and melting of the
DNA to initiate transcription significantly increases the level of negative supercoiling
downstream of the transcription initiation site (Liu and Wang, 1987). Negative
supercoiling is a major inhibitor of transcription. An increase in negative supercoiling
places the DNA under increasing torsional stress, resulting in an increasing amount of
free energy being held by the negatively supercoiled DNA. When this torsional stress,
reaches a certain point, known as the critical superhelical density, it causes the bases to
flip upside down, forming a left handed helical structure in sequences that have
alternating purine/pryimidine residues (Bates and Maxwell, 2005, Kashi and Soller,
1999). The flipping of the bases causes the formation of left-handed Z-DNA resulting in
a reduction in the level of negative supercoiling, thereby enhancing the rate of
transcription (Herbert and Rich, 1999). When the level of negative supercoiling
decreases to a point lower than the critical superhelical density, the left handed Z-DNA
transitions back to a right handed DNA conformation.
Observed differences in SLC11A1 expression levels, mediated by the allelic variants of
the SLC11A1 (GT)n promoter repeat, may be attributable to differences in the amount of
free energy required for Z-DNA transition. For example, allele 3 would theoretically
have a greater ability to enhance transcription, as compared to (GT)n allele 2, due to a
greater propensity to form Z-DNA.
129
5.1.5 Aims
The underlying mechanism of SLC11A1 transcription initiation, and the location of
DNA elements, which recruit transcriptional activators, is unknown. Previous studies
suggest that SLC11A1 does not contain canonical TATA, GC or CCAAT box elements,
however, no other core promoter elements have been described to explain the
mechanism of transcription initiation.
The aim of this work was to determine a minimal promoter region, in which the
essential components for the formation of the basal transcriptional complex are located,
and to determine if the SLC11A1 promoter, either the identified minimal promoter
region or larger promoter regions, can mediate bidirectional transcription. Additionally,
this work aimed to identify the location of elements which recruit transcriptional
activators/repressors that modulate expression and to determine the mechanism by
which the common promoter polymorphisms alter SLC11A1 expression.
This was achieved through initial in silico bioinformatic analyses of the SLC11A1
promoter to identify putatively important regions involved in the regulation of SLC11A1
transcription (Chapter 5, Part 1). The findings of the in silico analysis guided the design
of promoter constructs, containing promoter regions of varying size, orientation and
allelic variants, to determine the functional importance of the regions identified in silico
(Chapter 5, Part 2). The designed promoter constructs were tested in vivo using human
cell lines. Identified promoter regions important in SLC11A1 transcription were
subsequently re-assessed for TFBS, to provide a mechanism for the functional effects
observed (Chapter 6, Part 3).
130
5.2 MATERIALS AND METHODS
5.2.1 Materials
5.2.1.1 General Materials
The dNTPs and the pooled human gDNA were purchased from Promega (Wisconsin,
USA). DyNAzyme II DNA Polymerase and Phusion High-Fidelity DNA Polymerase
were purchased from Finnzymes (Espoo, Finland). The PCR additives GC melt and
dimethyl sulfoxide (DMSO) were obtained from Clontech (California, USA) and
Sigma-Aldrich (Missouri, USA), respectively. Size 15 sterile scalpel blades were
purchased from Livingstone International (Sydney, Australia) and glycerol was obtained
from Sigma-Aldrich (Missouri, USA). The Purelink Quick Gel Extraction Kit,
GeneTailor Site-Directed Mutagenesis System, PureLink HiPure Plasmid Maxiprep kit,
One-Shot MAX Efficiency DH5α-T1R competent cells, pGeneBLAzer-TOPO plasmid
and T4 DNA ligase were purchased from Invitrogen (California, USA). The restriction
enzymes, SmaI and BstXI, were purchased from Roche Molecular Biosciences (Basel,
Switzerland), while Bsu36I, PstI, NcoI and RsaI were purchased from New England
Biolabs (Massachusetts, USA).
5.2.1.2 Oligonucleotides
Multiple oligonucleotides specific for the SLC11A1 promoter were designed following
previously described parameters (Section 2.1.3) based on sequence file AF229613. Due
to the presence of previously identified repetitive elements (Alu, SINE and MER
elements) within the SLC11A1 promoter, an Alu element search (Section 5.2.2.1.6) was
completed to ensure primers were designed to regions located between these elements
(Marquet et al., 2000, Roger et al., 1998). Table 5.1 lists the designed oligonucleotide
primers.
131
Table 5.1 Oligonucleotides Designed for SLC11A1 Promoter Analyses.
Primer name
Sequence
Length
Primers for the preparation of promoter constructs and sequencing
SLC11A1prom1a-F
TCAGCCAGGTGCAGTGGTTCATGC
SLC11A1prom1a-R
AAGGACTCCACCCAGTGAGATTG
SLC11A1prom1b-F
CCAGCCTGGGCAACATAGTGAGAC
SLC11A1prom1b-R
AAGGACTCCACCCAGTGAGATTGA
SLC11A1prom1c-R
CCGAGTGCCCTGCCTCTTACATC
SLC11A1promAlu1-F
TGGGGGCCTGTAATCCTCGTGACT
SLC11A1promAlu2-F
TGGGCATGAGTCAAGCTGGATTTC
SLC11A1promAlu3-F
CCATCCTTGGGCAGCTACATTTTT
SLC11A1promAlu4-F
CAGTCAAGCATGGTGGCATAGGTC
SLC11A1prom1d-F
CAAAAATTAGCCAGGTGTGGTTGG
SLC11A1prom1e-F
CAGAGCAAGACGCCATCTCAAAGT
SLC11A1prom1f-F
GCACCACTGCACTTCACACCTCAC
SLC11A1prom1g-F
GAGAAGGGACATGATCTGGTGACA
SLC11A1prom1h-F
ACAAAGGTCCACTCCATGGGTAAC
SLC11A1prom1-237C-F
CATGGGGTATTGACATGAATACGCAAGGGGCAG
HSNRAMPA-F
TGAAGACTCGCATTAGGCCAACG
HSNRAMPC-R
CCTGCCCCTTGCGTATTCATGTCA
Primers for sequence analysis
SLC11A1Seq1
CACTGGGATCTGGTCCTGGTTCAA
SLC11A1Seq2
AGGCTGGTCTCGAACTCCTGGTCT
SLC11A1Seq3
CAGGAAGCAGAGGTTTCAGTTAGC
Primers for in vitro site-directed mutagenesis
SDM-F (SLC11A1prom1-237T-F) CATGGGGTATTGACATGAATATGCAAGGGGCAG
SDM-R (SLC11A1prom1-237-R) ATTCATGTCAATACCCCATGACCACACCCC
24
23
24
24
23
24
24
24
24
24
24
24
24
24
33
23
24
Name*
A
C
1
2
3
4
5
6
7
10
9
8
D
24
24
24
33
30
9
*Name used to describe amplicon created from this primer for the production of promoter constructs. Amplicon names
were made up of a forward primer number and a reverse primer letter. For example, promoter region 1A is created
using forward primer 1 (SLC11A1promAlu1-F) and reverse primer A (SLC11A1prom1a-R).
5.2.2 Methods
5.2.2.1 Bioinformatic Analysis of the SLC11A1 Promoter
Multiple programs for in silico sequence analysis were used to obtain information about
the SLC11A1 promoter. This in silico information was then used to guide the design of
SLC11A1 promoter constructs to functionally test identified putative promoter regions
important in transcription.
5.2.2.1.1 Bioinformatic Storage and Analysis using LaserGene
GeneQuest file
As a range of in silico studies analysing the SLC11A1 promoter were conducted a large
amount of data was generated. To allow for this information to be easily stored and
compared, all data from the in silico analyses was annotated against the nucleotide
sequence AF229163 into a GeneQuest file (from the Lasergene suite of programs).
132
Throughout the analyses, the transcription start site of SLC11A1 was used as a reference
point to identify different regions of the SLC11A1 promoter. Several transcription start
sites have been described for SLC11A1, however, the transcription start site used in the
SLC11A1 sequence file AF229163 (Marquet et al., 2000) and first determined by 5’
Random Amplification of cDNA Ends (5’RACE) (Kishi et al., 1996) was used as the
reference point and has been referred to as transcription start site 1 (TSS1). Another
documented transcription start site, which is 28bp downstream of transcription start site
1, has also been described and is referred to as transcription start site 2 (TSS2) in this
study (Richer et al., 2008). The -237C/T polymorphism is located -237bp upstream of
TSS2, however, based on the nomenclature used in this study, the location of this
polymorphism is 209bp upstream of the TSS1 reference point (-209C/T) (Mohamed et
al., 2004). However, the common name for this polymorphism (-237C/T) has been
retained.
SeqBuilder – Cloning File
A cloning project was created using SeqBuilder (Lasergene, DNAStar) to allow the
sequence files for all of the designed SLC11A1 expression plasmids to be stored. The
sequence for the production of each SLC11A1 promoter insert was derived from the
AF229163 GeneQuest file. The promoter plasmids designed and produced were
simulated in SeqBuilder, where SLC11A1 promoter inserts were TA cloned into the
pGeneBLAzer plasmid. The designed plasmids in the file were used to analyse the
plasmids produced to determine restriction fragment patterns using different restriction
enzymes (Section 2.2.2.3).
5.2.2.1.2 ClustalW Alignment of the Promoter Regions of SLC11A1
Homologs
In order to define regions of high homology, clustalW alignment was carried out using
promoter regions of SLC11A1 homologs. A search of the NCBI database identified nine
SLC11A1 homologs, which were assessed for their inclusion into the alignment. The
Gallus gallus sequence was excluded from the clustalW alignment as there was
significant evidence to suggest that the mechanism of transcriptional regulation differed
significantly from the other SLC11A1 homologs. This was due to the orientation of the
Slc11a1 gene, in relation to the surrounding genes, which was in the opposite direction
to the other SLC11A1 homologs, the absence of a GT or CA microsatellite repeat, and a
133
lack of restricted expression within the reticuloendothelial system (Section 1.1.3).
Therefore, the clustalW alignment included the promoter sequences of eight SLC11A1
homologs.
From the promoter region of SLC11A1 (or homolog) 3000 bases were extracted. In most
cases this was completed through the NCBI Reference Sequences (from the gene page)
and extracted from large sequence files. The extracted data was selected to include 2000
bases upstream of the transcriptional start site (or putative start site) and 1000 bases
downstream of the start site. Sequences were copied into the EditSeq Lasergene
program (DNASTAR) and then imported into MegAlign. A clustalW alignment was
completed of the imported sequences in MegAlign and the resulting alignment was
assessed manually for regions of high homology.
5.2.2.1.3 Identification of Conserved SLC11A1 Promoter Elements by
WeederH Analysis
The program WeederH was used to identify conserved elements located within the
SLC11A1 promoter. The program WeederH (http://www.beacon.unimi.it/modtools/) is a
free web-based program, which identifies conserved TFBS (Pavesi et al., 2007). The
3000bp of the human SLC11A1 promoter region, as used in the clustalW alignment
(Section 5.2.2.1.2), was used as the reference sequence. Three other SLC11A1 promoter
homologs (mus, rattus and canis) were used as a comparison to determine conserved
regions. FASTA formatted sequence data was pasted into the appropriate area of the
input form and the respective species selected. The results were viewed using the UCSC
genome browser (http://genome.ucsc.edu) by entering the appropriate information about
species, chromosome and start/stop locations on the chromosome (Homo sapiens, Chr2,
21893160-218956160) and the results were entered into the Lasergene GeneQuest file
(Section 5.2.2.1.1).
5.2.2.1.4 Analysis of SLC11A1 for Transcription Factor Binding Sites
Transcription Element Search Software (TESS)
The Transcription Element Search Software (TESS) (http://www.cbil.upenn.edu/cgibin/tess/tess) (Schug, 2003, Schug and Overton, 1997) is a free web-based program,
which searches for putative TFBS using site or consensus strings and positional weight
134
matrices from the TRANSFAC, JASPAR, IMD and CBIL-GibbsMat databases. Binding
sites are determined through the use of a scoring system, with a default minimum score
of 12. However, shorter consensus sequences will not reach this score and therefore
may be missed. The score can be lowered to find shorter consensus sequences or
sequences with a higher mis-match.
The analysis of TFBS was completed by pasting FASTA formatted SLC11A1 promoter
and 5’UTR sequences (AF229163) into the search box and completing a search with
default parameters. TFBS search results were generally analysed using the annotated
sequence view. Further information about transcription factors was obtained by
following hyperlinks for the particular transcription factor and also by using the external
database references.
GRAILEXP
GRAILEXP (version 3.3) (http://compbio.ornl.gov/grailexp/) (Xu and Uberbacher,
1997) is a suite of programs commonly used in the discovery and annotation of genes.
In addition to predicting the exon/intron structure from a DNA sequence, the program
also has the ability to identify promoter regions and CpG islands. The prediction of
promoter regions is based around the search for consensus sequences (e.g. TATA, GC
and CCAAT elements) within an area of 5000bp of the first codon of a predicted
GRAILEXP gene model. One gene element is assigned to each gene model. A FASTA
formatted sequence of the whole SLC11A1 gene and promoter region (AF229163) was
entered with all features of the program enabled. The gene predictions and promoter
data output were compared to the annotated Genequest sequence file (Section 5.2.2.1.1).
Lasergene – Genequest
A TFBS search was completed in Lasergene Genequest by first creating an EditSeq
DNA sequence file containing the SLC11A1 promoter region and 5’UTR. The file was
opened using the Genequest program and the patterns – signals – tfd.dat was dragged
from the method curtain onto the assay surface with the source organism ‘mammalian’
selected and site length ‘any’ chosen. Further summary information was obtained about
individual transcription factors found to bind to the promoter region by analysis of the
site description. From this page further information was obtained through the Pubmed
ID links.
135
BioGPS
BioGPS (http://biogps.gnf.org/#goto=welcome) (Wu et al., 2009) is a free online gene
annotation source. The gene expression activity chart of the program was used in
association with the TFBS searches to look at the expression pattern of identified
putative transcription factors in different tissues. This allowed each putative binding site
to be assessed, based on the expression profile of the factors, and to be removed if
inconsistent with the restricted expression of SLC11A1 to phagocytic cells. This
significantly reduced the number of identified TFBS to those likely relevant to the
expression of SLC11A1.
5.2.2.1.5 Identification of Z-DNA Forming Sequences in the SLC11A1
Promoter by Z-Hunt Analysis
Z-Hunt is an online program (http://gac-web.cgrb.oregonstate.edu/zDNA/) (Ho et al.,
1986) that uses the thermodynamic properties of a DNA sequence to identify regions
that have the propensity to form Z-DNA. The program is superior to other programs that
determine Z-DNA forming regions as it is able to identify non-classical sequences
which deviate from the alternating purine/pyrimidine sequence. The program identifies
Z-DNA forming regions within a sequence, providing each identified region with a ZScore, which is proportional to the ability of that region to form Z-DNA. A cutoff value
of 700 is applied, with higher scores indicative of a greater propensity for the formation
of Z-DNA.
The Z-Hunt program was used to identify regions of the SLC11A1 promoter, which
have a propensity for the formation of Z-DNA. The SLC11A1 promoter sequence was
obtained from the sequence file AF229163. Genomic sequences were formatted into
FASTA format, copied into Microsoft Word and saved in rich text format (rtf). The rtf
text file was altered manually to produce the individual (GT)n allele sequences.
Individual rtf files were uploaded onto the Z-Hunt server and submitted to determine the
presence of Z-DNA forming sequences and their corresponding Z-scores.
136
5.2.2.1.6 Dectection of Alu Elements and Other Repetitive Elements within
the SLC11A1 Promoter
A search for Alu and other repetitive sequence elements, within the SLC11A1 promoter,
was completed to ensure that designed oligonucleotides were located in sequence
regions that did not include the repeat sequences (Section 5.2.1.2). Identification of
repetitive elements was achieved through a basic nucleotide blast
(http://blast.ncbi.nlm.nih.gov/) using the accession number AF229163 with the Human
Alu repeat elements chosen as the search set. Repetitive elements located around the
SLC11A1 promoter were mapped into the SLC11A1 GeneQuest file (Section 5.2.2.1.1)
and compared to previous reports describing the presence of repetitive elements in the
SLC11A1 promoter (Marquet et al., 2000, Roger et al., 1998).
5.2.2.2 DNA Techniques
5.2.2.2.1 PCR 5 – Amplification of Promoter Regions for Promoter
Analysis
Regions of the SLC11A1 promoter to be functionally analysed for promoter activity,
which were identified through the in silico analysis were produced by PCR
amplification for cloning into promoter constructs (Sections 5.2.2.2.3 and 5.2.2.2.6).
Amplification was carried out in a total volume of 50μl, which contained 2U Phusion
Polymerase, 1X Phusion GC Buffer, 0.2mM dNTP, 20μM forward and reverse primers
and pooled human gDNA (25ng) or 1A-bla(M) plasmid DNA (0.2ng) (Section
5.2.2.2.3). The additives GC melt (2-10%) and DMSO (3%) were added to the PCR
when single bands were not obtained using standard PCR conditions. Table 5.5 outlines
the optimal PCR conditions for the amplification of the different SLC11A1 promoter
regions. Each PCR experiment included a negative (no template) control in which
sterile dH2O was added to the PCR instead of template DNA. The PCR was carried out
in an Eppendorf Mastercycler Gradient instrument (Eppendorf) and was initiated with a
denaturation step (98oC, 3min), followed by 34 cycles of denaturation (98oC, 10s),
annealing (56-72oC, 20s) and extension [72oC, 10-60s (148bp-3kb fragments)],
followed by a final extension step (72oC, 5min). After amplification, amplicons were
analysed by agarose gel electrophoresis (0.8-1.4%) (Section 2.2.2.5) of an aliquot (5μl)
of the PCR. Amplicons were gel (Section 5.2.2.2.2) or PCR purified (Section 2.2.2.2)
and then cloned into the pGeneBLAzer plasmid (Section 5.2.2.2.3 or 5.2.2.2.6) for
functional analyses.
137
5.2.2.2.2 Gel Purification of DNA Fragments for Cloning
Gel purification of restriction fragments (Section 5.2.2.2.9) and PCR products (Section
5.2.2.2.1) was completed to remove any contaminating DNA fragments. Samples for
purification were electrophoresed in 1.4-1.8% agarose gels for 1-2h (Section 2.2.2.5).
DNA fragments were visualised using a transilluminator set on low intensity UV
(Section 2.2.2.5). Bands of interest were excised from the agarose using a size 15 sterile
scalpel blade and gel slices were transferred to a sterile centrifuge tube. The DNA
fragments were then purified from the agarose using the Purelink Quick Gel Extraction
Kit, following the manufacturer’s protocol. The purified DNA was eluted in a volume
of 50μl and 5μl was then electrophoresed to confirm successful purification. The
concentration of purified DNA was determined using the NanoDrop (Section 2.2.2.7)
and used immediately or stored at -20oC until required for cloning (Section 5.2.2.2.3
and 5.2.2.2.6).
5.2.2.2.3 Production of the 1A-bla(M) Plasmid
All promoter inserts were cloned into the reporter vector pGeneBLAzer-TOPO plasmid
upstream of a modified β-lactamase gene (bla) (Section 6.1.1). The 1A-bla(M) plasmid
(containing the largest SLC11A1 promoter region, 1A of 3267bp length, cloned
upstream of the β-lactamase gene) was prepared first by PCR amplification using
pooled human gDNA (Section 5.2.2.2.1). The pooled gDNA was used to obtain as many
of the common sequence variants within the SLC11A1 promoter (at the (GT)n
microsatellite repeat and the -237C/T variants), with each variant cloned into a different
plasmid. Sequence variants not obtained through this method were produced by in vitro
site-directed mutagenesis (Section 5.2.2.2.4). The 1A insert was cloned following the
pGeneBLAzer cloning protocol (Section 5.2.2.2.6) (Figure 5.17) producing four
different plasmids all containing promoter region 1A, with (GT)n allele 3 in the forward
and reverse orientation and (GT)n allele 2 in the forward and reverse orientation.
Preparation of the same promoter regions with the different sequence variants allowed
for the determination of the mechanisms by which the most commonly occurring
promoter variants differentially modulated SLC11A1 expression. Likewise, analysis of
the important identified promoter regions in both the forward and reverse orientation
were used to determine if the SLC11A1 promoter mediates bidirectional transcription.
138
Validation of the cloning of the correct sized insert and determination of the orientation
of the insert was completed by restriction analysis using the enzyme SmaI (Section
5.2.2.2.8) (Figure 5.17). In-vitro site-directed mutagenesis (Section 5.2.2.2.4) was used
to modify the 1A-bla(M) plasmid containing allele 3 in both the forward and reverse
orientation to produce the -237 T variant, thereby producing 2 new plasmids, both
containing the 1A promoter region (with (GT)n allele 3) with the mutant -237 T allele in
the forward and reverse orientation.
Complete sequencing of all six 1A-bla(M) plasmids was carried out to identify any
sequence variants other than the common promoter alleles (Section 5.2.2.2.5). The six
verified 1A-bla(M) plasmids (allele 2, allele 3 and allele T in both the forward and
reverse orientation) were produced on a large scale (Section 5.2.2.3.1) and were used as
the template for the amplification of the smaller promoter regions for cloning (Sections
5.2.2.2.1 and 5.2.2.2.6), or for in vivo detection of promoter activity in human cell lines
(Chapter 6, Part 3).
5.2.2.2.4 In Vitro Site-Directed Mutagenesis
The use of pooled human gDNA to amplify the 1A insert (Section 5.2.2.2.1) did not
allow for the less commonly occurring -237 T variant to be obtained as a clone in the
pGeneBLAzer-TOPO vector (Section 5.3.2.3). In vitro site-directed mutagenesis was
used to introduce the -237 T variant.
Primers were designed to introduce the -237 T variant into the target plasmids 1Abla(M) allele 3 in both the forward and reverse orientation (Section 5.2.2.2.3) (Figure
5.18). Primer specifications were as detailed in the GeneTailor Site-Directed
Mutagenesis System manual. Briefly, a forward primer was designed that flanked the
mutation site with 10 nucleotides downstream of the mutation site, while the reverse
primer was designed to be positioned adjacent to the mutation site.
The manufacturer’s protocol for the introduction of the -237 T variant was followed.
The methylation reaction had a final volume of 16μl, containing 100ng plasmid DNA
(1A-bla(M) allele 3 in either the forward or reverse orientation), 1.6μl methylation
139
buffer, 1X freshly diluted SAM and 4U DNA methylase. The reaction was incubated at
37oC for 1h.
The mutagenesis reaction was completed in a total volume of 50μl, which contained 2U
Platinum Taq DNA Polymerase High Fidelity, 1X HiFi Buffer, 1.2mM dNTP, 1mM
MgSO4, 0.3μM forward and reverse mutagenesis primers (Table 5.1), and 2μl of
methylated plasmid reaction. The mutagenesis reaction was completed on the
Eppendorf Mastercycler Gradient instrument. The reaction was initiated by an initial
denaturation step of 94oC for 2min, followed by 20 cycles of 94oC for 30s, 55oC for 30s
and 68oC for 8min 30s, and a final extension step of 68oC for 10min. The mutagenesis
reaction was checked by electrophoresis of a 5μl aliquot in an agarose gel (Section
2.2.2.5).
The mutagenesis reaction (2μl) was transformed into One-Shot MAX Efficiency DH5αT1R competent cells (Section 2.2.3.2), clones were grown O/N and plasmid DNA was
then isolated (Sections 2.2.3.3 and 2.2.2.4). Verification of the correct base substitution
of the commonly occurring -237 C variant for the T variant was completed by
restriction digestion of a 208bp amplified promoter region (primers HSNRAMPA-F/R)
(Section 2.2.2.1) containing the -237C/T mutation with the enzyme MslI (Section
2.2.2.3) (Figure 5.18). The prepared 1A-bla(M) plasmids containing the T variant in the
forward and reverse orientation were completely sequenced to ensure that no additional
sequence variations were introduced during the mutagenesis reactions (Section
5.2.2.2.5).
5.2.2.2.5 Verification of the 1A-bla(M) Plasmids by Sequence Analysis
The prepared 1A-bla(M) plasmids (Section 5.2.2.2.3), for all three allelic variants in
both the forward and reverse orientation, were completely sequenced (Section 2.2.2.6).
Sequencing of each of the 1A-bla(M) plasmids was completed to identify any aberrant
polymorphisms (other than the selected common allelic variants), which may have been
present in the template DNA (pooled human gDNA), introduced during PCR
amplification (Section 5.2.2.2.1), cloning (Section 5.2.2.2.3), or during the site directed
mutagenesis reaction to introduce the -237 T variant (Section 5.2.2.2.4). Figure 5.6
shows the location of the six forward primers and five reverse primers used, in relation
140
to transcription start site 1 (TSS1), to sequence in both directions the 3267bp 1A inserts
cloned into the pGeneBLAzer plasmid (primer sequences are detailed in Table 5.1).
Figure 5.6 Primers used to completely sequence cloned 1A-bla(M) plasmids containing
the different sequence variants in both the forward and reverse orientation. The 1A
insert (3267bp) was sequenced in both directions by six forward primers and five
reverse primers. The location of primers are relative to TSS1.
5.2.2.2.6 The pGeneBLAzer Cloning Protocol to Produce the 1A-bla(M)
Plasmid and Smaller SLC11A1 Promoter Constructs
The amplification of the 1A promoter region (Section 5.2.2.2.1), for the production of
the 1A-bla(M) plasmid (Section 5.2.2.2.3), was completed using pooled human gDNA.
Once sequenced and verified (Section 5.2.2.2.5), the 1A-bla(M) plasmids, containing
the common SLC11A1 promoter variants (allele 2, allele 3 and allele T), were used as
the templates for the amplification of the smaller promoter regions (Section 5.2.2.2.1)
for cloning into the pGeneBLAzer expression vector. Figure 5.16 details the size and
depicts the different SLC11A1 promoter regions amplified and cloned for the reporter
analyses. Amplification of the smaller promoter regions, using the 1A-bla(M) plasmid
as template, comprised three separate PCR reactions, with each reaction containing one
allelic variant and each variant was cloned and the sequence was verified separately.
Additionally, all plasmids were made in both the forward and reverse orientation to
determine if the SLC11A1 promoter mediates bidirectional transcription.
141
PCR products were PCR (Section 2.2.2.2) or gel (Section 5.2.2.2.2) purified and
assessed by agarose gel electrophoresis (Section 2.2.2.5). To allow for compatibility
with TOPO cloning, 3’ A overhangs were added to the purified products (Section
5.2.2.2.7) before cloning (Section 2.2.3.2) into the pGeneBLAzer-TOPO plasmid. After
O/N growth, positive colonies were isolated and cultured (Section 2.2.3.3). Minipreparations of plasmid DNA were completed (Section 2.2.2.4), and the quality of the
purified plasmid DNA was assessed by agarose gel electrophoresis (Section 2.2.2.5).
Verification of the production of the correct plasmids, containing inserts of the correct
size and orientation, were determined through restriction digestion and sequencing
(Section 5.2.2.2.8). Verified plasmids were produced on a large scale (Section 5.2.2.3.1)
for in vivo detection of promoter activity in human cell lines (Chapter 6, Part 3).
5.2.2.2.7 Addition of A Overhangs for TOPO TA Cloning
TOPO cloning of amplified SLC11A1 promoter regions (Section 5.2.2.2.1) into the
pGeneBLAzer plasmid (Section 5.2.2.2.6) requires inserts to have 3’ A overhangs. This
allows for efficient ligation into the vector, which is made with a T overhang. Most
standard DNA polymerases produce amplicons with A overhangs, however, Phusion
polymerase creates blunt end products, which are not directly compatible with TOPO
cloning.
The 3’ A overhangs were added by incubation of the amplicons to be cloned with
DyNAzyme II DNA Polymerase. The reaction was carried out in a total volume of 15μl,
which contained DyNAzyme II DNA polymerase (2U), 1X buffer, 2mM dATP and
11μl purified PCR product (Section 5.2.2.2.2). The reaction was incubated at 72oC for
20min and then used immediately for cloning (Section 5.2.2.2.6).
5.2.2.2.8 Verification of SLC11A1 Promoter Constructs
Verification of the cloned SLC11A1 promoter regions into the pGeneBLAzer plasmid
(Sections 5.2.2.2.3 and 5.2.2.2.6) was completed by restriction digestion (Section
2.2.2.3) and sequencing (Section 2.2.2.6). Verification was completed to ensure that the
correctly sized SLC11A1 promoter insert had been cloned, and that all clones contained
the correct sequence variant at the (GT)n microsatellite repeat and -237C/T substitution.
Verification was also completed to determine the orientation of the insert cloned into
142
pGeneBLAzer vector. Appropriate restriction enzymes were selected using the
simulated plasmids in the SeqBuilder cloning file (Section 5.2.2.1.1). The criteria used
was for the selection of a single enzyme, which had restriction sites located in both the
SLC11A1 promoter insert and the pGeneBLAzer vector. Sequencing (Section 2.2.2.6) of
the insert was completed to verify promoter constructs when there were no restriction
enzymes which met this criteria. Table 5.2 lists the method of verification for each of
the prepared constructs containing different SLC11A1 promoter regions with each of the
common sequence variants (allele 2, allele 3 and allele T) in both the forward and
reverse orientation. One of each correct plasmid size, containing each of the individual
sequence variants in both the forward and reverse orientation, was selected for
functional analyses in human cell lines (Chapter 6, Part 3).
Table 5.2 Method of SLC11A1 Promoter Plasmid Verification Prior to Functional
Analysis.
Plasmid
1A-bla (M)-F
1A-bla (M)-R
7A-bla (M)-F
7A-bla (M)-R
7C-bla (M)-F
7C-bla (M)-R
8A-bla (M)-F
8A-bla (M)-R
8C-bla (M)-F
8C-bla (M)-R
8D-bla (M)-F
8D-bla (M)-R
9C-bla (M)-F
9C-bla (M)-R
10C-bla (M)-F
10C-bla (M)-R
emp-bla (M)
Enzyme
Sma I
Sma I
Pst I
Pst I
Pst I
Pst I
Nco I
Nco I
Nco I
Nco I
Rsa I
Rsa I
Sequencing
Sequencing
Sequencing
Sequencing
Rsa I
Fragment sizes (bp)
4622, 4025
5581, 3062
3352, 2927
4011, 2268
3325, 2609
3693, 2268
3128, 1774, 735, 472
3299, 1774, 735, 301
3128, 1774, 735, 154
2981, 1774, 735, 301
2418, 2141, 516, 334, 124, 12
2418, 2141, 516, 343, 115, 12
2418, 2141, 516, 292
5.2.2.2.9 Production of the Negative Control Plasmid emp-bla(M)
An empty vector of the pGeneBLAzer plasmid (vector only with no insert), which could
be used as a negative control to establish background fluorescence during in vivo
detection of promoter activity, was constructed as there was no commercially available
circular pGeneBLAzer plasmid. The empty vector [termed emp-bla(M)] was produced
143
by the removal of an insert from one of the prepared SLC11A1 promoter constructs,
followed by self-ligation of the vector to produce the empty vector.
Analysis of the prepared SLC11A1 promoter constructs was completed using the
SeqBuilder cloning project file (Section 5.2.2.1.1) to determine restriction digestion
patterns. The promoter construct, 8A-bla(M) in the forward orientation, was determined
to be the most suitable plasmid to produce the empty vector by double digestion
(Section 2.2.2.3) with the enzymes Bsu36I and BstXI, as each of the individual enzymes
cut once on either side of the insert, to completely remove the 8A insert (Figure 5.19).
The 8A-bla(M) (1μg) was digested O/N with the restriction enzyme Bsu36I and the
product was purified (Section 2.2.2.2). The purified product was then digested O/N with
the enzyme BstXI and the 5366bp fragment was purified from the smaller insert by gel
purification (Section 5.2.2.2.2) (Figure 5.19).
DNA overhangs, produced from restriction digestion, were filled in to produce blunt
ends using Phusion Polymerase in a final reaction volume of 50μl, containing 2U
Phusion Polymerase, 1X Phusion HF Buffer, 0.2mM dNTP and 10μl gel purified vector
incubated at 72oC for 20min. Ligation of blunt ends was completed in 20μl containing
1U T4 ligase (Invitrogen), 1X ligase buffer and 2μl blunt end vector. The reaction was
ligated at RT for 4h and transformed into competent TOP10 cells (Section 2.2.3.2). Four
positive clones were selected (Section 2.2.3.3) and plasmid was DNA isolated (Section
2.2.2.4). Verification of the removal of the 8A insert and the re-ligation of the
pGeneBLAzer plasmid to produce the empty vector was completed by restriction digest
using the enzyme RsaI (Section 5.2.2.2.8) (Figure 5.19). One correct clone was selected
to grow to a high plasmid stock (Section 5.2.2.3.1) for transfection as a negative control.
5.2.2.3 Microbial Techniques
5.2.2.3.1 Large Scale Preparation of Plasmid DNA (Maxi-prep)
Promoter regions successfully amplified (Section 5.2.2.2.1) and cloned (Section
5.2.2.2.3 and 5.2.2.2.6) in the pGeneBLAzer-TOPO plasmid and verified for insert size,
sequence and orientation (Section 5.2.2.2.8) were grown on a large scale to produce
high concentration plasmid stocks for in vivo detection of promoter activity (Chapter 6,
Part 3). Positive clones were inoculated (100-200μl) into 5ml of LB medium (Section
144
2.2.3.1) containing 100μg/ml ampicillin. Cells were grown O/N at 37oC with agitation
(220rpm). After O/N growth, the 5ml of culture was added to a 1l conical flask
containing 200ml LB medium (100μg/ml ampicillin) and incubated O/N at 37oC with
agitation (200rpm).
After O/N growth, 50ml of the culture was transferred to two 50ml centrifuge tubes and
centrifuged using the Megafuge at 4000rcf for 10min at RT. The supernantant was
discarded and another 50ml of culture was added to each 50ml centrifuge tube and
centrifuged. The supernatant was again discarded and excess media removed. Plasmid
DNA was isolated and purified using the PureLink Plasmid Maxiprep kit following the
manufacturer’s protocol. For the different centrifugation steps, samples were transferred
to sterile Sorvall tubes and centrifuged in a Sorvall Super T21 centrifuge at 14000rpm at
4oC for the appropriate time period as outlined in the protocol.
Plasmid DNA was resuspended in 350μl TE buffer and transferred to a 1.7ml centrifuge
tube and stored at -20oC. Plasmid quality was determined by agarose gel electrophoresis
(Section 2.2.2.5) and the yield was determined by NanoDrop quantification (Section
2.2.2.7), with the average concentration of isolated plasmids approximately 1-4μg/μl.
These high concentration plasmid stocks were used for in vivo detection of SLC11A1
promoter activity through transfection into human cell lines (Chapter 6, Part 3).
145
5.3 RESULTS
PART 1: Discovery of Important SLC11A1 Promoter
Elements by Bioinformatic Analysis.
A number of different bioinformatic software programs were utilised to analyse the
SLC11A1 promoter to identify highly conserved and putatively important regulatory
regions. All of the results obtained from these in silico studies were compiled into a
Lasergene GeneQuest file (Section 5.2.2.1.1). Putative regulatory regions identified
were used for the design and production of SLC11A1 promoter constructs (Chapter 5,
Part 2) for functional analyses of the identified elements in human cell lines (Chapter 6,
Part 3).
5.3.1.1 A Model of Regulation of SLC11A1 Expression
Based on previously published findings regarding the positions of putative transcription
factor binding sites and the results of reporter assays, a hypothesised model for the
regulation of SLC11A1 expression was developed (Figure 5.7). In previous studies, the
factors involved in the formation of the basal transcriptional complex were not
identified and therefore, the minimal promoter region had not yet been elucidated.
However, due to the detection of multiple transcription start sites, expression of
SLC11A1 is likely controlled through an initiator, or downstream promoter element,
which mediates the formation of the basal transcriptional complex (Figure 5.7).
Control of SLC11A1 expression within cells is likely under both endogenous and
exogenous control. Endogenous control of SLC11A1 expression appears to be through
the macrophage-specific transcription factors, PU.1 and GM-CSF, which control the
phagocytic cell restricted expression of SLC11A1 (Figure 5.7). Furthermore, reporter
assays of the different (GT)n microsatellite repeat alleles (which differ only in the length
of the repeat) has shown that different (GT)n sequences differentially enhance
transcription, without the addition of exogenous stimuli (i.e. in unstimulated cells (GT)n
allele 3 has a higher level of SLC11A1 expression compared to allele 2). This suggests
that the fundamental DNA sequence of the microsatellite modulates transcription, and
therefore, the endogenous transcriptional enhancement would putatively be attributable
to the Z-DNA forming ability of the microsatellite, with the expression levels of
146
different (GT)n alleles being driven by varying propensities of the sequences to form ZDNA (Section 5.1.4.2.1).
Exogenous control of SLC11A1 expression (i.e. modulated by the exogenous stimuli,
IFN-γ and LPS) appears to be mediated through the binding of transcription factors to
multiple IFN-γ response elements (γ-IRE) and LPS response elements (binding
transcription factors NF-κB, NF-IL6 and AP-1) (Figure 5.7). Differential expression
levels modulated by the (GT)n and -237C/T promoter polymorphisms, after the addition
of exogenous stimuli, would be due to the polymorphic sequence variants differentially
affecting the interaction between and/or binding of transcription factors to promoter
enhancer elements.
Figure 5.7 Hypothesised mechanism for the control of SLC11A1 expression based on
the findings of previously published studies. SLC11A1 expression is under both
endogenous and exogenous control. Endogenous control is mediated through phagocytic
cell specific factors PU.1 and GM-CSF and the Z-DNA forming ability of the (GT)n
microsatellite repeat. Exogenous control (after the exposure to exogenous stimuli)
appears to be attributable to multiple IFN-γ response elements (γ-IRE) and LPS
response elements (binding transcription factors NF-κB, NF-IL6 and AP-1) located
throughout the SLC11A1 promoter. It is hypothesised that transcription is modulated
through initiator (Inr) or downstream promoter element (DPE). The position of factors
and elements in the figure does not represent the putative binding location within the
SLC11A1 promoter. Key: IFN-γ – interferon-γ; LPS – lipopolysaccharide; TBP – TATA
binding protein; TAF – TBP associated factor; γ-IRE – interferon-γ response element;
NF-κB – nuclear factor kappa-light-chain-enhancer of activated B cells; NF-IL6 –
nuclear factor IL-6; AP-1 – activator protein 1; PU.1 – protein encoded by SPI-1 (spleen
focus by forming virus proviral integration 1) gene; GM-CSF – granulocyte
macrophage colony-stimulating factor.
147
5.3.1.2 Identification of Conserved Regions within the SLC11A1
Promoter
A high level of homology is found between protein sequences of different homologs of
SLC11A1, suggesting that the protein plays an important evolutionarily conserved
function (Section 1.1.2). Due to the restricted expression of SLC11A1 homologs, as
well as the similar function the gene plays in immunomodulation (in higher order
animals), it would be expected that the mechanisms controlling expression of the
different SLC11A1 homologs may be similar. Therefore, a clustalW alignment was
conducted to identify highly conserved promoter regions among the different SLC11A1
homologs. Sequence conservation likely suggests functional significance of the region
representing putatively important sites that regulate gene expression (i.e. sequences for
the recruitment and binding of transcription factors).
The promoter sequences of eight SLC11A1 homologs were included in the clustalW
alignment. Table 5.3 displays information about the organisms, which were included in
the alignment, the accession numbers of the different sequences as well as the selected
nucleotide regions. A clustalW alignment was then performed using all 8 promoter
regions using the slow and accurate alignment (Section 5.2.2.1.2).
Table 5.3 SLC11A1 Homologs Included in the ClustalW Analysis.
Organism
Homo sapien
Macaca mulatta
Mus musculus
Pan troglodytes
Equus caballus
Rattus norvegicus
Bos taurus
Canis familiaris
Accession No.
First Nucleotide Position Last Nucleotide Position
AF229163
NW_001098167
4060
305761
7059
308760
NT_039170
51946454
51949454
NW_001232114
300017
303017
NC_009149.1
NW_047816
8047141
17141907
8050141
17144907
NW_001494678
NC_006619.2
284803
28035951
287803
28038951
The most conserved region identified from the clustalW alignment of SLC11A1
homologs was approximately 200 bases in length and located just downstream of the
(GT)n microsatellite repeat extending to the first transcription start site (-200 to -1)
(Appendix 1). Furthermore, within this identified conserved 200bp region was a region
of approximately 40bp (-70 to -28) that approached 100% homology between all eight
SLC11A1 homologs (Figure 5.8A). Conservation of this near perfectly aligned 40bp
-70
-28
Homology around the (GT)n microsatellite
Region of highest homology
+1
Figure 5.8 ClustalW alignment of the nucleotide sequences of the promoter regions of 8 SLC11A1 homologs. The coloured bar located at the top
of each alignment designates the level of homology (red designates 100% homology, followed by orange and green, while blue designates low
homology). (A) The region with the highest level of conservation was located just upstream of the transcription start site (-70 to -28) and may
represent the minimal promoter region and the site for the formation of the basal transcriptional complex. (B) Homology around the (GT)n
microsatellite repeat. The box designates the human sequence showing the lack of conservation of the sequence at the (GT)n repeat.
B
A
148
148
149
region, suggested that this site plays an important functional role, and, due to its
location, likely represents a minimal promoter region required for the assembly of the
basal transcriptional complex. Other areas of high homology were also identified in the
5’UTR and within the first exon of the SLC11A1 gene at positions +44 to +71 and +199
to +222, respectively (Appendix 1). These regions could represent initiator or
downstream core promoter elements, which are required for the formation of the basal
transcriptional complex or may represent sites of transcription factor binding.
Further analysis of the clustalW alignment found that the (GT)n microsatellite tract was
not well conserved between the different SLC11A1 promoter homologs (Figure 5.8B).
While nearly all homologs had some form of GT repeat sequences, the location of the
repeat within the promoter and the sequence composition was not highly conserved. In
murine and rat sequences, the GT microsatellite repeat was shifted upstream
approximately 200bp as compared to the human promoter. The bovine sequence did not
have a well defined microsatellite of repetitive GT units, however, the region did
contain areas of homology to the human microsatellite repeat. This lack of sequence
specific conservation suggests that the (GT)n microsatellite repeat may have a
topological or structural influence on transcription (such as the formation of Z-DNA),
rather than a sequence specific function, such as transcription factor binding.
A low level of homology was identified at the location of the -237C/T polymorphism
(209bp upstream of TSS1), however, a highly homologous 9bp region was located 56bp downstream of the -237C/T polymorphic site. Zaahl et al. (2004), showed that the
-237 T variant, when in cis with (GT)n allele 3, results in a lower SLC11A1 expression
level compared to the expression levels normally driven by (GT)n allele 3 in cis with the
frequent -237 C variant (Section 1.3.3). The lower promoter activity driven by the T
variant could be due to this base substitution modulating the ability of a transcription
factor to bind to the homologous region adjacent to the polymorphic site. Comparison of
the sequence of the homologous region with previously published putative TFBS
showed that this conserved region may correspond to a γ-IRE binding site. The regions
of homology that were identified through the clustalW alignment were loaded into the
Genequest sequence file (Section 5.2.2.1.1) used to collect information about the
SLC11A1 promoter.
150
5.3.1.3 Identification of Conserved Elements within the SLC11A1
Promoter
The motif discovery program, WeederH, was used to further identify conserved
promoter regions within the SLC11A1 promoter. Like the clustalW alignment, the
program uses the concept that conservation of DNA sequences between species implies
an important functional role for those sequence regions. This method has been termed
phylogenetic footprinting (Tagle et al., 1988). However, unlike other programs (such as
clustalW), which identify important motifs/conserved regions based on the level of
sequence homology alone, WeederH assesses for significant deviation from sequence
conservation based on a reference sequence and the other sequence homolog being
tested. Identified motifs/elements are then scored relative to the level of conservation
observed. Rigorous testing of the program has shown a high correlation between the
highest scoring elements identified by WeederH analysis and elements which have been
found to bind transcription factors experimentally, thereby validating the predictive
value of this in silico analysis (Pavesi et al., 2007).
The human SLC11A1 promoter region was assessed for conserved elements against the
promoter regions of three SLC11A1 promoter homologs (mus, rattus and canis) using
WeederH (Section 5.2.2.1.3). This analysis indicated that the majority of the identified
elements were located within a few hundred bases of the transcription start site, and that
there was a close correlation between the identified elements and conserved regions
from the WeederH analyses and clustalW alignment, respectively. Figure 5.9 displays
the location of all identified WeederH elements surrounding the transcription start site,
with the location of the nine highest scoring WeederH elements identified in the
SLC11A1 promoter.
The highest and sixth highest scoring WeederH elements (scores of 38.08 and 15.67,
respectively) were located in the -28 to -70bp region (Site 1 and 6, Figure 5.9),
consistent with the area found to exhibit the greatest homology from the clustalW
alignment. Therefore, this region likely plays a significant role in modulating SLC11A1
expression, and may represent a minimal promoter region required for the assembly of
the basal transcriptional complex.
Figure 5.9 The SLC11A1 promoter showing the location of conserved regions identified from the WeederH analysis and clustalW alignment. (A)
Nucleotide sequence, location of the transcription start sites (TSS) and SLC11A1 promoter polymorphisms. (B) Open red boxes show the
location of conserved sequence motifs identified by WeederH analysis. The smaller numbers on top of each box represent the score for the
identified motif. Larger numbers designate the location of the nine highest scoring identified motifs in order of significance of conservation (1-9).
The fourth highest scoring element is not shown, however is located approximately 200bp upstream of TSS1. (C) Conserved regions, identified
by clustalW analysis, showing a high correlation between the identified WeederH elements and conserved regions identified from the clustalW
alignment.
151
151
152
The second and third highest scoring elements identified by the WeederH analysis were
located adjacent to the 5’ end of the (GT)n microsatellite repeat and 60bp downstream of
the (GT)n microsatellite repeat, respectively (Figure 5.9). Like the highest scoring
element, these WeederH elements are consistent with the finding of high conservation
from the clustalW alignment and may be elements for the recruitment of transcriptional
enhancers.
Several elements were also identified downstream of the transcription start site, in
particular, the fourth most conserved region was located in the first intron (+199 to
+222), while the fifth highest scoring element (15.75) was located in the 5’UTR (+44 to
+77) (Figures 5.9 and 5.10). The identified elements located in the 5’UTR and into the
first intron of SLC11A1 fall within conserved regions identified in the clustalW
alignment, suggesting that regions downstream of the transcription start site may
represent core promoter elements, other 5’ UTR enhancer elements, or may play a post
transcriptional role (Figure 5.10).
Consistent with the clustalW analysis, the -237C/T polymorphism was not located in a
conserved area (Figure 5.9), suggesting that the altered SLC11A1 expression observed
in the presence of this polymorphism may not be due to the alteration of a TFBS. While
a high level of conservation in the (GT)n microsatellite repeat region was not observed
in the clustalW analysis, the WeederH analysis identified two conserved repetitive
regions (scores of 11.39 and 10.88), suggesting the presence of a putative element for
transcription factor binding (Figure 5.9). Due to its location within the (GT)n repeat,
transcription factor binding to this site within the (GT)n repeat, or at the second highest
scoring WeederH element located adjacent to the microsatellite repeat, may be affected
by the rate of Z-DNA formation of the microsatellite, and therefore, may play a role in
mediating differential allelic expression of the (GT)n alleles.
A high level of concordance was observed between clustalW alignment and WeederH
analysis suggesting promoter regions identified in these in silico analyses may be
involved in the control of SLC11A1 expression (Figure 5.10).
153
Figure 5.10 Summary of the most significant findings from the clustalW alignment and
WeederH analysis of the SLC11A1 promoter. The landmarks of the SLC11A1 promoter
are shown, including the two transcription start sites (TSS1 and TSS2), the location of
the 5’UTR and the exon/intron boundary (grey striped line) and the location of the
polymorphic (GT)n microsatellite repeat and the -237C/T polymorphism. The TATA
and Inr indicate the presumptive location of TATA and initiator elements, respectively.
Red regions indicate the conserved areas of the SLC11A1 promoter identified from the
clustalW alignment, with the 40bp region showing the highest conservation (-70 to -28),
designated by diagonal stripes. The highest scoring WeederH elements are shown as
white boxes containing numbers, with the large numbers above ordering these elements
sequentially by score (1-6).
154
5.3.1.4 Identification of Transcription Factor Binding Sites within the
SLC11A1 Promoter
A search for potential TFBS within the SLC11A1 promoter was completed using several
in silico bioinformatic programs (Section 5.2.2.1.4). These searches were performed to
identify the location of any consensus sequences which may be involved in the
formation of the basal transcriptional complex, thereby forming the minimal promoter
region. The in silico analyses also facilitated the identification of putative transcription
factor binding sites located throughout the SLC11A1 promoter.
5.3.1.4.1 Bioinformatic Analysis Failed to Identify Consensus Sequences
for Core Proteins Involved in the Basal Transcriptional Complex
Analysis of the SLC11A1 promoter using TESS, GRAILEXP or Lasergene programs
failed to identify consensus sequences for TBP/TFIID binding (to a TATA element),
consistent with previously published reports (Section 5.1.3). Furthermore, analysis of
the two major transcription start sites did not identify any initiator elements, which
could recruit proteins to mediate the formation of the basal transcriptional complex. The
lack of TATA/initiator elements was consistent with visual analysis of the SLC11A1
promoter sequence for the presence of TATA and initiator elements following published
consensus sequence requirements (Javahery et al., 1994, Lo and Smale, 1996, Smale,
1997). Additionally, TFBS searches and visual sequence analysis did not identify other
core elements, such as DPE, MTE or BRE, within the SLC11A1 promoter (Figure 5.3).
While no core promoter sequence elements were identified in the SLC11A1 promoter,
the bioinformatic analysis, using the programs TESS and Lasergene (Section 5.2.2.1.4),
identified multiple CCAAT and GC elements for the binding of the factors C/EBP and
Sp1. In particular, 15 sites were identified for the binding of Sp1 within the SLC11A1
promoter. Figure 5.11 displays results of the bioinformatic analysis using the program
TESS, highlighting the location of the binding sites for the factors C/EBP and Sp1, with
several binding sites located in the conserved regions identified through clustalW and
WeederH analysis. It has previously been shown that the transcription factors Sp1 and
C/EBP can drive expression from promoters, which lack TATA and other core elements
(Huber et al., 1998, Smale, 1997, Smale and Kadonaga, 2003), suggesting that they may
mediate the formation of the basal transcriptional complex for SLC11A1 expression.
155
Figure 5.11 TFBS search of the SLC11A1 promoter centered on the TSS using the
program TESS. The black boxes indicate conserved regions identified by clustalW
alignment and WeederH analysis, while red boxes indicate putative TFBS.
156
Several other elements were also identified in the area that showed the highest level of
conservation from the clustalW and WeederH analysis (Figure 5.11, black box from
position -70 to -28). Consensus sequences for the binding of the transcription factors
Ying-Yang 1 (YY1) and NP-TCII were identified. The transcription factor YY1 has
been shown to play a role in the formation of the basal transcriptional complex, through
binding to an initiator element (Usheva and Shenk, 1996). However, the location of the
element relative to the two TSS was inconsistent with a potential role as an initiator
element. Located over the YY1 consensus sequence was an NP-TCII element, which
binds the transcription factor NF-κB, an LPS response element, which may be involved
in the upregulation of SLC11A1 expression after exposure to LPS. The location of YY1
and NP-TCII elements within the most conserved region and highest scoring elements
from the clustalW and WeederH analyses, respectively, suggests they may function as
core promoter elements involved in SLC11A1 expression.
5.3.1.4.2 Identification of Putative TFBS in the SLC11A1 Promoter
The completed TFBS searches (Section 5.2.2.1.4) identified a large number of potential
enhancer elements within the SLC11A1 promoter, which may function to recruit
transcription factors that enhance transcription. Due to the large number of identified
enhancer elements, it was beyond the scope of this study to analyse all of these
elements. Rather, results of the promoter assays focusing on different regions of the
SLC11A1 promoter will narrow the focus to more specific locations within smaller
regions of the promoter, which can then be assessed bioinformatically for the presence
of putative enhancer elements.
5.3.1.4.3 SLC11A1 Promoter Polymorphisms and Transcription Factor
Binding
Transcription factor binding site searches were used to assess if variants at the (GT)n
and -237C/T polymorphisms altered any putative consensus TFBS sequences, which
could provide an explanation for the differences in SLC11A1 expression observed with
the different alleles (Section 5.2.2.1.4). Analysis of the (GT)n microsatellite repeat
region did not identify any consensus elements for transcription factor binding using
TESS. However, Lasergene analysis did identify two TFBS within the (GT)n
microsatellite repeat region. The identified elements (TACGTG) putatively bind the
157
factor ARNT. These sites were consistent with two conserved sites identified by
WeederH analysis (Figure 5.9), suggesting that a factor might bind to the (GT)n repeat.
However, this finding is inconsistent with the clustalW analysis, which showed a lack of
conservation within the (GT)n microsatellite repeat among SLC11A1 homologs,
suggesting a topological role, rather than a functional role in the binding of a sequence
specific transcription factor.
In general, there was a lack of sequence conservation at the site of the -237C/T
polymorphism, as identified by the clustalW and WeederH analyses. However, analysis
for the presence of TFBS showed some interesting results. Analysis of the region with
the wild type -237 C variant included did not identify any transcriptional elements,
however, when the analysis was carried out in the presence of the mutant -237 T
variant, a site for the binding of the ubiquitously expressed transcription factor Oct-1
(also known as POU2F1) was introduced. Binding of this factor may be involved in the
decreased level of SLC11A1 expression observed in the presence of the -237 T variant.
5.3.1.5 Multiple Regions of the SLC11A1 Promoter Display a
Propensity to Form Z-DNA
The SLC11A1 promoter region was assessed for the presence of sequences, which have
the ability to form Z-DNA. The switch from the canonical B-DNA to the Z-DNA
conformation in promoter regions may enhance the rate of transcription (Section
5.1.4.2.1) (Rich and Zhang, 2003). The propensity of a DNA sequence to form Z-DNA
is related to the length of the alternating purine/pryimidine tract and the torsional stress
placed on the sequence, with longer tracts requiring less torsional stress to form ZDNA, as compared to shorter sequences (Nordheim et al., 1982).
Assessment of the complete SLC11A1 promoter region by Z-Hunt analysis (Section
5.2.2.1.5) identified three putative Z-DNA forming sequences (Table 5.4). Located
240bp upstream of the transcription start site, the (GT)n promoter microsatellite repeat
yielded the highest Z-score (12598.14), with the entire 44bp (GT)n tract possessing the
ability to form Z-DNA. The observed Z-score was significantly higher than the cutoff
score of 700. This finding is consistent with the observation that the (GT)n microsatellite
repeat forms Z-DNA in vivo during transcription (Bayele et al., 2007, Xu et al., 2011).
158
Two other regions of the SLC11A1 promoter were also shown to have the propensity to
form Z-DNA (Table 5.4). An alternating purine pryimidine sequence was identified
5344bp upstream of the transcription start site (with a Z-score of 2062.84), and another
Z-DNA forming sequence was identified over the transcription start site (TSS1) (Zscore of 1276.91) (Table 5.4).
Table 5.4 Identified SLC11A1 Promoter Sequences with the Potential to Form Z-DNA.
Position*
Location†
Length
Z-Score
5768-5811
-240
715-727
6046-6060
-5344
+1
44
13
15
12598.14
2062.84
1276.91
Sequence
(GT)5AC(GT)5AC(GT)9GG
TACACGCACACGA
TGTGTGTGTGTGTGA
*Based on sequence file AF229613 where TSS1 is located at 6059.
†
In relation to TSS1.
5.3.1.5.1 The (GT)n Microsatellite Alleles Differ in their Z-DNA Forming
Ability
Having identified the (GT)n microsatellite repeat as a region possessing Z-DNA forming
potential, the ability of each of the different (GT)n repeat variants to form Z-DNA was
further analysed (Section 5.2.2.1.5). Z-Hunt analysis of the individual (GT)n alleles
found that allele 1 had the highest Z-score (18793.69), followed by allele 2 (15167.83),
then alleles 3 (12598.14) and 4 (11990.58) (Figure 5.12). Consistent with previous
reports (Nordheim et al., 1982), it was found that the longer (GT)n alleles had a greater
potential to form Z-DNA, as allele 1, with 11 GT repeats, had the highest Z-score,
followed by allele 2 and allele 3 (10 and 9 GT repeats, respectively). However, the
known promoter activity of the (GT)n repeats, as determined experimentally by reporter
assays (Section 1.3.2), does not correlate with the in silico predictions of the Z-DNA
forming ability of the individual alleles (Figure 5.12). Reporter analyses have shown
that (GT)n allele 3 drives a significantly higher level of SLC11A1 expression, as
compared to (GT)n allele 2 in monocytic cell lines. This finding contradicts the Z-hunt
analysis, which shows that allele 2 has a greater propensity to form Z-DNA, as
compared to allele 3 and, therefore, allele 2 would be theoretically predicted to possess
a greater transcriptional enhancer activity. This contradictory finding suggests that the
ability of allelic variants at the (GT)n microsatellite repeat to modulate SLC11A1
expression, in the absence of exogenous stimuli, is not solely attributable to the Z-DNA
forming ability of each allele (Sections 5.1.4.2.1 and 5.3.1.1).
159
20000
(GT)11
Z-Score
18000
16000
(GT)10
14000
(GT)9
12000
(GT)9
10000
1
2
3
4
A
lle
le
1
A
lle
le
2
A
lle
le
3
A
lle
le
4
A
lle
le
Allele
(GT)n Alleles
Figure 5.12 Z-Hunt analysis of the SLC11A1 (GT)n microsatellite alleles. Each (GT)n
variant has a different number of GT repeats and/or different sequence composition.
Above each bar is the number of GT units located at the end of the repeat for that
specific allele.
Z-hunt analysis of the SLC11A1 promoter containing (GT)n allele 3 in association with
either the -237 C or T variant showed that the presence of this polymorphism does not
alter the Z-DNA forming ability of the SLC11A1 promoter (GT)n microsatellite repeat.
5.3.1.6 In Silico Identification of Transcription Factor Binding Sites
and Promoter Activity: GeneQuest Summary
All of the data from the bioinformatic analysis of the SLC11A1 promoter was compiled
into a GeneQuest file (Section 5.2.2.1.1). Figure 5.13 displays the findings of the
bioinformatic analyses, focusing specifically on the area which displayed the highest
level of homology (-469 to +211). The important SLC11A1 regions identified through
the bioinformatic analyses were used as the basis for the design of promoter reporter
constructs to determine the promoter activity associated with the different regions
(Chapter 5, Part 2).
Since the completion of the bioinformatic analysis (and design of the promoter
constructs), three studies which assess the SLC11A1 promoter for transcription factor
160
160
161
161
162
Figure 5.13 Compilation of the findings of the bioinformatic analyses of the SLC11A1
promoter and 5’UTR and comparison with previously published theoretical and
experimentally-determined promoter elements. (A) Ruler and SLC11A1 sequence based
on NCBI file AF229163. (B) Landmarks of the SLC11A1 promoter showing the
location of the two transcription start sites, the SLC11A1 (GT)n and -237C/T promoter
polymorphisms and potential Z-DNA sequences. (C) Location of the SLC11A1 mRNA
transcript. (D) Location of conserved elements identified from the WeederH analysis.
The score above each box designates the level of conservation. (E) Conserved regions
identified by clustalW alignment of promoter regions of 8 SLC11A1 homologs. (F)
Location of previously published putative TFBS (based on the following papers:
Awomoyi, 2007, Blackwell et al., 1995, Kishi et al., 1996, Searle and Blackwell et al.,
1999). (G) Location of putative TFBS identified in the current study. (H) Protected sites
identified through in vitro footprinting suggesting the location of TFBS determined by
Richer et al. (2008). (I) Experimentally determined TFBS (Based on the following
papers: Bayele et al., 2007, Richer et al., 2008, Xu et al., 2011). Sites E2M2, E3M2 and
E6M2 were identified experimentally by Richer et al. (2008) as elements for
transcription factor binding.
binding have been published (Bayele et al., 2007, Richer et al., 2008, Xu et al., 2011).
The transcription factors identified by these studies are displayed in Figure 5.13, in
association with the findings of the current bioinformatic analyses. The recently
published experimentally determined sites of transcription factor binding (Figure 5.13I)
corroborate the current bioinformatic analysis (Figure 5.13 D, E and G), showing a high
predictive ability for identifying important elements using the bioinformatic tools
utilised in the current analyses.
Bayele et al. (2007) identified the binding of hypoxia inducible factor 1 alpha (HIF-1α)
to a cryptic consensus sequence located within the (GT)n microsatellite repeat (Figure
5.13, Panel 2, Row I – HIF-1α). While the clustalW alignment identified neither the
location of HIF-1α binding, nor the (GT)n microsatellite repeat as being highly
conserved, both WeederH analysis (Row D), as well as the TFBS searches (which
identified ARNT, Row G), identified the two repetitive cryptic sites located in the (GT)n
repeat. However, Bayele et al. (2007) showed that HIF-1α binds to the microsatellite in
vivo only upon cell stimulation (treatment with IFN-γ + LPS or exposure to zymosan
particles), showing that binding of this factor could not account for previously reported
differences in the level of expression observed in the presence of (GT)n alleles 2 or 3 (or
the rarely occuring alleles), in the absence of exogenous stimulus (Figure 1.8).
163
Furthermore, Richer et al. (2008) identified vitamin D response elements involved in the
upregulation of SLC11A1 (after vitamin D differentiation of HL-60 cells). In vitro
footprinting identified 14 protected sites within the SLC11A1 promoter. Of these, 4 sites
were identified by electrophoretic mobility shift assays to contain transcription factor
binding sites (Figure 5.13H, E2, E6, E10 and E14). Based on these footprinting
experiments, Richer et al. (2008) identified binding of the transcription factors Sp1
(binding -112 to -106) at site E10 (Panel 3, Row I), as well as C/EBP-α/β (located over
the second transcription start site +25 to +34) at site E14 (Panel 3, Row I), both of
which were also identified in the TFBS searches. While the site for Sp1 binding
appeared to be conserved (located within a WeederH element), the C/EBP binding site
was not conserved, suggesting that this element may be specific for the human gene.
However, while Richer et al. (2008) identified Sp1 and C/EBP binding, transcription
factor binding to three other identified elements, E2M2, E3M2 and E6M2, was not
determined (Figure 5.13, Panel 1 and 2, Row I).
The most recent paper determining transcription factor binding to the SLC11A1
promoter reports the binding of an AP1-like transcription factor (ATF-3 and Jun D
binding) adjacent the 5’ end of the (GT)n microsatellite repeat (Figure 5.13, Panel 2,
Row I). The binding of this factor is consistent with a report from Awoyomi (2007),
which first suggested an AP1 site located adjacent to the (GT)n repeat based on the high
level of homology at this site. Furthermore, bioinformatic analysis completed in the
current study identified this site as a highly conserved region by clustalW analysis, as
the second most conserved region by WeederH analysis (22.56) and also through the
TFBS searches.
5.3.1.7 Conclusions of the Bioinformatic Analysis
The bioinformatic analysis identified a number of important regions which could be
putatively involved in SLC11A1 transcription (Figure 5.14). The bioinformatic analysis
indicated that the most important elements for SLC11A1 transcription were located in a
700bp region of the promoter, spanning 500bp upstream of the transcription start site
through to the first intron (-500 to +211). Furthermore, within this region, a highly
conserved 40bp promoter region located 28bp upstream of TSS1 was determined to be
the likely site for the formation of the basal transcriptional complex. Putative important
164
regions were also identified downstream of the transcription start site in the 5’UTR
region and the first intron of SLC11A1.
The high correlation observed between the findings of the bioinformatic analysis
completed in this study and the location of published transcription factor elements
(Section 5.3.1.6), suggests the combined bioinformatic assessment has a significant
predictive ability to identify further elements within the SLC11A1 promoter that are
involved in the regulation of SLC11A1 transcription. Furthermore, this provides a
greater confidence that putative areas, identified from the in silico analyses (Figure
5.14), which were selected for further analysis through the use of promoter constructs
and subsequent reporter assays (Chapter 5, Part 2 and Chapter 6, Part 3), contain
functional elements involved in the regulation of SLC11A1 transcription.
Figure 5.14 Compilation of findings of the bioinformatic analysis of the SLC11A1
promoter. The landmarks of the SLC11A1 promoter are shown, including the two
transcription start sites (TSS1 and TSS2), the location of the 5’UTR and the exon/intron
boundary (grey striped line) and the location of the polymorphic (GT)n microsatellite
repeat and the -237C/T polymorphism. Zig-zag lines identify regions with the potential
to form Z-DNA. The TATA and Inr indicate the presumptive location of TATA and
initiator elements, respectively. The bioinformatic analysis indicated the important
elements for SLC11A1 transcription were located in a 700bp promoter region, which
spanned 500bp upstream of the transcription start site through to the first intron. Red
regions identify the areas of the SLC11A1 promoter which are conserved from the
clustalW alignment, with the 40bp region showing the highest conservation (-70 to -28),
designated by diagonal stripes. The highest scoring WeederH elements are shown as
white boxes containing numbers, with the large numbers above ordering these elements
sequentially by score (1-6).
165
PART 2: Design and Construction of SLC11A1 Promoter
Constructs for Functional Analysis.
5.3.2.1 Primer Site Determination and Primer Design
Based on the findings of the in silico bioinformatic analyses of the SLC11A1 promoter,
the promoter was divided into sections to allow the functional assessment of the
identified putative regulatory regions. The primers were distributed evenly over a 3.5kb
region of the SLC11A1 promoter to allow a systematic approach to determine important
regions which modulate SLC11A1 transcription (Figure 5.15).
Previous reports have shown that the SLC11A1 promoter region contains highly
repetitive elements (Alu, SINE and MER elements) (Marquet et al., 2000, Roger et al.,
1998). Therefore, to ensure that the designed primers for the amplification of different
segments of the promoter were not located within these repetitive elements (thus
making amplification of promoter regions difficult), an in silico BlastN search was
completed to locate all repetitive elements within the SLC11A1 promoter (Section
5.2.2.1.6). These regions were mapped in the GeneQuest file of the SLC11A1 promoter
(Section 5.2.2.1.1) (Figure 5.15D). Primers for the production of SLC11A1 promoter
constructs for reporter analyses were then designed, which were located in the regions
between the identified repetitive elements (Figure 5.15E).
Ten forward and three reverse primers were designed to amplify different regions of the
SLC11A1 promoter (Figure 5.15F). Due to the numerous forward and reverse primers
designed, and the subsequent amplicons produced, a nomenclature was devised to
systematically identify each amplicon. Amplicon names were based on the forward and
reverse primers used. Each forward primer was numbered sequentially based on its
location from 1, designating the primer with the furthest location from the transcription
start site (SLC11A1promAlu1), through to 10, for the forward primer located closest to
the transcription start site (SLC11A1prom1h-F). A letter was used to signify the reverse
primer used, with A, C and D referring to the primers SLC11A1prom1a-R,
SLC11A1prom1c-R and HSNRAMPC-R, respectively (Table 5.1) (Figure 5.15G). For
example, the largest promoter region designed is termed 1A, as the forward primer 1
and reverse primer A was used to produce this amplicon.
Figure 5.15 Location of designed primers for the amplification of different promoter regions for subsequent production of SLC11A1 promoter
plasmids. (A) Ruler. (B) Landmarks of the SLC11A1 promoter showing the location of the mRNA transcript (red arrow), the two transcription
start sites (TSS), the SLC11A1 (GT)n promoter polymorphisms and potential Z-DNA sequence. (C) Ideal location of promoter regions for
production of primers for PCR amplification. The regions were selected to break the SLC11A1 promoter into evenly spaced regions centered
around the putative elements identified by the in silico analyses. (D) Location of identified Alu repetitive elements from an in silico Alu search.
(E) The location of gaps between the Alu elements for the design of primers. (F) Location of designed SLC11A1 primers (arrows), designed
based on the findings gathered from the bioinformatic analysis of the SLC11A1 promoter and located between Alu elements, with primer names
located above each primer. Red arrows pointing right indicate forward primers, while black arrows pointing left indicate reverse primers. (G)
Large numbers and letters beneath designed primers designate the nomenclature used to name inserts for cloning. The name of a promoter region
is based on the number and letter of the forward and reverse primer used to amplify that promoter region.
166
166
167
5.3.2.1.1 Optimisation of PCR Conditions for the Amplification of
SLC11A1 Promoter Regions
The PCR conditions (annealing temperature and the inclusion of PCR additives if
required) for the amplification of the different SLC11A1 promoter regions were
optimised using pooled human gDNA to allow for the production of single PCR
products for each promoter segment (Section 5.2.2.2.1). Table 5.5 displays the optimal
PCR conditions for the production of the different SLC11A1 promoter amplicons and
the primers used to produce the amplicons. Sequencing of each amplicon verified the
amplification of the correct SLC11A1 promoter sequence (Section 2.2.2.6).
Table 5.5 Optimised PCR Conditions for the Amplification of the Different SLC11A1
Promoter Amplicons for Subsequent Cloning.
Amplicon
1A
1C
2A
2C
3A
3C
4A
4C
5A
5C
6A
6C
7A
7C
8A
8C
8D
9A
9C
10A
10C
Annealing Temperature
72+ 5μl GC melt
72+ 2μl GC melt
72
72+ 5μl GC melt
72 + DMSO
72 + DMSO
64.4
64.4
70.4
70.4
64.4
64.4
64.4
64.4
64.4
64.4
64.4
64.4
64.4
64.4
64.4
Forward
SLC11A1promAlu1-F
SLC11A1promAlu1-F
SLC11A1promAlu2-F
SLC11A1promAlu2-F
SLC11A1promAlu3-F
SLC11A1promAlu3-F
SLC11A1promAlu4-F
SLC11A1promAlu4-F
SLC11A1prom1d-F
SLC11A1prom1d-F
SLC11A1prom1f-F
SLC11A1prom1f-F
SLC11A1prom1g-F
SLC11A1prom1g-F
HSNRAMPA-F
HSNRAMPA-F
HSNRAMPA-F
SLC11A1prom1-237C/T-F
SLC11A1prom1-237C/T-F
SLC11A1prom1h-F
SLC11A1prom1h-F
Reverse
SLC11A1prom1a-R
SLC11A1prom1c-R
SLC11A1prom1a-R
SLC11A1prom1c-R
SLC11A1prom1a-R
SLC11A1prom1c-R
SLC11A1prom1a-R
SLC11A1prom1c-R
SLC11A1prom1a-R
SLC11A1prom1c-R
SLC11A1prom1a-R
SLC11A1prom1c-R
SLC11A1prom1a-R
SLC11A1prom1c-R
SLC11A1prom1a-R
SLC11A1prom1c-R
HSNRAMPC-R
SLC11A1prom1a-R
SLC11A1prom1c-R
SLC11A1prom1a-R
SLC11A1prom1c-R
Size(bp)
3267
2949
2879
2562
2425
2107
1777
1459
1422
1104
1024
706
899
580
729
411
165
597
280
465
148
168
5.3.2.2 Selection of SLC11A1 Promoter Regions for Cloning and
Reporter Analyses
Figure 5.16 summarises the identified elements potentially regulating SLC11A1
expression as identified from the bioinformatic analyses, the location of designed
primers to amplify the different promoter regions, and the SLC11A1 promoter regions,
which were cloned for the production of reporter constructs. The SLC11A1 promoter
regions were designed to functionally determine multiple aspects of SLC11A1
transcription (Sections 5.3.2.2.1, 5.3.2.2.2 and 5.3.2.2.3). Once amplified, these
promoter regions were cloned into the pGeneBLAzer expression vector (Sections
5.3.2.3 and 5.3.2.4) for functional assessment (Chapter 6, Part 3).
Results of the bioinformatic analyses indicated that the location of elements controlling
SLC11A1 expression were within a 700bp region surrounding the transcription start
sites (approximately -500 to +210). Therefore, all promoter regions designed (except
promoter region 1A) were located within this 700bp region (Figure 5.16). The promoter
region 1A was the largest SLC11A1 promoter region cloned (3267bp) to determine if
there were transcriptional elements located upstream of the identified 700bp region
which may influence SLC11A1 transcription. As shown in Figure 5.16, the designed
primers allowed the production of amplicons with sequential shortening of the SLC11A1
promoter in both directions, thus allowing the functional assessment of the different
regions of the SLC11A1 promoter to determine which regions specifically regulated
SLC11A1 expression.
5.3.2.2.1 Identification of SLC11A1 Promoter Regions Containing Core
Elements for the Formation of the Basal Transcriptional Complex
The bioinformatic analysis identified a highly conserved region between -70 and -28,
suggesting that this site may mediate the formation of the basal transcriptional complex.
The sequential shortening of the designed SLC11A1 promoter regions was centered
around this identified site, with a 148bp promoter region (10C) the smallest SLC11A1
region cloned (Figure 5.16). These analyses would indicate whether this region contains
the core elements for the formation of the basal transcriptional complex.
169
7
8
9 D
10
C
A
TSS1
TSS2
Genomic DNA
-532
-362
2
3
22.56
18.80
-291
-249
-231 -197
1
6
38.08 15.67TATA
-177
-99
-28
-70
Inr
+1
5
4
15.75
16.91
+77
+28 +49
+199 +367
40bp of highest conservation
(GT)n Z-DNA
-237C/T
200bp highly conserved region
Potential Z-DNA
5’ UTR
700bp region containing all elements from the bioinformatic analysis
1A – 3267bp
2
3
7A – 899bp
-532
7C – 581bp
-532
-231 -197
2
3
18.80
-231 -197
2
3
18.80
8A – 729bp
-231 -197
2
3
18.80
-362
8C – 411bp
-231 -197
2
8D – 165bp
4
16.91
+367
+49
6
Inr
5
4
15.75
16.91
+49
+1
1
5
15.75
Inr
38.08 15.67TATA
+367
6
38.08 15.67TATA
18.80
+367
+49
+1
1
4
16.91
6
-99
-231 -197
Inr
+1
1
5
15.75
+49
6
38.08 15.67TATA
3
22.56
-362
1
38.08 15.67TATA
-99
22.56
Inr
+1
-99
22.56
-362
6
-99
22.56
-362
1
38.08 15.67TATA
18.80
22.56
-362
-99
Inr
+49
+1
2
22.56
-362
-231 -197
9C – 280bp
3
1
-231 -197
6
38.08 15.67TATA
18.80
-99
10C – 148bp
Inr
1
6
38.08 15.67TATA
-99
7
8
9 D
10
+49
+1
Inr
+1
+49
C
A
Figure 5.16 Designed SLC11A1 promoter regions for cloning into reporter constructs to
functionally test the different elements identified bioinformatically. Located at the top is
a summary of the findings of the bioinformatic analyses and location of important
identified promoter elements. The landmarks of the SLC11A1 promoter are shown,
including the transcription start sites (TSS1 and TSS2), the location of the 5’UTR and
the polymorphic (GT)n microsatellite repeat and the -237C/T polymorphism (blue line).
Red regions identify the areas of the SLC11A1 promoter shown to be conserved from
the clustalW alignment, with the 40bp region showing the highest conservation (-70 to
-28), designated by diagonal stripes. The highest scoring WeederH elements are shown
as white boxes containing numbers, with the large numbers above ordering these
elements sequentially by score (1-6). TATA and Inr (initiator) identify the presumptive
location of these elements. The grey dashed lines designate the location of the designed
primers, with the numbers and letters signifying forward and reverse primers,
respectively. Below the summary the designed SLC11A1 promoter regions containing
the identified bioinformatic elements are shown. The name (primer number and letter
used to produce amplicon) and size of the different promoter regions are shown to the
left.
170
The bioinformatic analysis of the SLC11A1 promoter also identified conserved elements
which may play a role in SLC11A1 transcription within the 5’UTR, and into the first
intron (Figure 5.16). Two reverse primers were designed (reverse primers A and C), to
allow the production of amplicons which included (1A, 7A and 8A) or excluded (7C
and 8C) the 5’UTR and the small portion of the first intron from the analysis (Figure
5.16), to determine whether the these regions contain core promoter elements and/or
elements for the recruitment of transcriptional enhancers.
5.3.2.2.2 Determination of the Effect of Variants at the (GT)n and -237C/T
Polymorphisms on SLC11A1 Expression
To determine how promoter variants modulate differential SLC11A1 promoter activity,
multiple plasmids for each of the same SLC11A1 promoter region cloned (Figure 5.16)
were created, which only differed by the allelic variant present at the (GT)n and -237C/T
polymorphism. This enabled identification of SLC11A1 promoter regions which may be
responsible for the differences in the level of expression driven by the different variants.
When a promoter region contained both the (GT)n microsatellite and -237C/T
polymorphisms, three different plasmids were produced to mimic the possible
combinations of allelic variants at (GT)n and -237C/T polymorphisms, which contained
either (GT)n allele 2 (10 GT repeats with -237 C), allele 3 (9 GT repeats with -237 C),
or allele T (10 GT repeats [allele 3] with -237 T) (Figure 5.1). The effect of the allelic
variants at the (GT)n repeat were determined by comparing promoter activity between
plasmid variants allele 2 and allele 3, while the effect of the variants at the -237C/T
polymorphisms were determined by comparing plasmid variants allele 3 with allele T.
Likewise, if a promoter region contained only the -237C/T polymorphism (promoter
region 9C) then two plasmid variants were produced and termed allele C and allele T.
The designed promoter region 9C was produced to exclude the (GT)n repeat in order to
allow the analysis of the effects of variants at the -237C/T polymorphisms separately
from the (GT)n microsatellite repeat.
5.3.2.2.3 Determination of the Ability of the SLC11A1 Promoter to Mediate
Bidirectional Transcription
All of the designed SLC11A1 promoter regions (Figure 5.16), containing the different
SLC11A1 promoter variants (Section 5.3.2.2.2), were cloned in both the forward and
171
reverse orientation to determine if the SLC11A1 promoter could mediate bidirectional
transcription. Furthermore, if bidirectional transcription was present, then use of the
promoter constructs could establish if the different promoter variants altered the rate of
forward transcription as compared to reverse transcription, which may account for
observed differences in SLC11A1 promoter activity mediated by the different promoter
variants.
5.3.2.3 Construction of the Largest SLC11A1 Promoter Plasmid: 1Abla(M)
The designed SLC11A1 promoter regions (Figure 5.16) were cloned into the
pGeneBLAzer expression plasmid upstream of a β-lactamase gene (bla) (Section 6.1.1).
The largest SLC11A1 promoter region designed, 1A (3267bp), was first amplified using
pooled human gDNA and cloned, into the pGeneBLAzer vector (Section 5.2.2.2.3) to
produce the plasmid 1A-bla(M) (Figure 5.17A). The pooled human gDNA was used as
template for the production of the 1A promoter region to enable each common sequence
variant at the (GT)n and -237C/T polymorphisms to be cloned independently. The 1Abla(M) plasmids, each containing a common SLC11A1 promoter sequence variant, were
created, sequenced and used as the template for the production of the shorter designed
promoter segments (Figure 5.16). To increase the probability of isolating the different
promoter variants in the 1A-bla(M) constructs, 30 colonies were selected and plasmid
DNA was isolated (Figure 5.17B). Validation of the cloning of the correct sized insert
and determination of the orientation of the insert in the isolated 1A-bla(M) plasmids
was determined by restriction digestion, using the enzyme SmaI (Section 5.2.2.2.8)
(Figure 5.17C).
Sequencing of the isolated 1A-bla(M) plasmids was carried out to determine which
SLC11A1 promoter variants had been cloned (Section 2.2.2.6). The use of pooled
human gDNA allowed the cloning of 1A-bla(M) plasmids containing (GT)n alleles 2
and 3 both in the forward and reverse orientation. However, the -237 T variant was not
obtained from any of the plasmids, with all clones possessing the wild type -237 C
variant.
172
Figure 5.17 Production of the SLC11A1 expression plasmid 1A-bla(M). (A) Maps of
the 1A-bla(M) plasmids in the forward and reverse orientation showing the SLC11A1
promoter insert 1A cloned upstream of the β-lactamase gene [bla(M)] and location of
the SmaI restriction sites. (B) Isolated 1A-bla(M) plasmid DNA obtained from miniprep (Section 2.2.2.4). (C) Restriction digestion of 1A-bla(M) plasmids with SmaI to
verify that the cloned insert was the correct size and to determine the orientation of the
insert. Forward orientation insert produced bands 4025 and 4622bp while reverse
orientation plasmids produced bands 3062 and 5581bp.
5.3.2.3.1 In Vitro Site-Directed Mutagenesis to Generate the -237 T
Variant
The use of the pooled human gDNA to obtain the common SLC11A1 promoter variants
did not result in the isolation of the -237 T variant. In vitro site-directed mutagenesis of
the prepared 1A-bla(M) plasmid was used to generate the -237 T substitution in cis with
(GT)n allele 3 in both forward and reverse orientations (Section 5.2.2.2.4) (Figure 5.18).
The introduction of the T variant was validated by restriction digestion as the
substitution of the C to a T introduces a cleavage site for the enzyme, MslI (Figure
5.18B). Restriction digestion of a 208bp amplicon containing the -237C/T
polymorphism confirmed that the in vitro site-directed mutagenesis successfully
introduced the -237 T variant (in cis with (GT)n allele 3) in the forward and reverse
orientation (Section 5.2.2.2.4) (Figure 5.18C).
173
Figure 5.18 In vitro site directed mutagenesis for the production of the -237 T variant in
cis with (GT)n allele 3. (A) Designed forward and reverse site-directed mutagenesis
primers for the production of the -237 C to T substitution. The mutation site was
introduced by the forward primer. (B) Restriction enzyme digestion map of mutagenesis
site. The introduced T nucleotide (highlighted) introduces an MslI restriction site. (C)
Restriction digestion of plasmid clones after site directed mutagenesis. Cleavage of the
208bp product by MslI into 149bp and 59bp signifies the presence of the -237 T variant.
5.3.2.3.2 Verification of 1A-bla(M) Clones by Sequence Analysis
Isolated 1A-bla(M) plasmids, for each of the common sequence variants (1A-bla(M)
allele 2, allele 3 and allele T in the forward and reverse orientation), were selected for
use in the SLC11A1 promoter expression assays. Complete sequencing of selected
plasmids was carried out (Section 5.2.2.2.5), to ensure that no other sequence variations,
other than the selected common SLC11A1 polymorphisms had been introduced. With
the exception of a polymorphic G(T)n microsatellite, located 2474bp upstream the
transcription start site (Section 5.3.2.6), complete sequencing of the selected 1A-bla(M)
174
plasmids did not identify sequence variants other than the selected variants at the (GT)n
and -237C/T promoter polymorphisms. The 1A-bla(M) plasmid variants containing
either (GT)n allele 2 or allele 3 contained the G(T)n microsatellite variants G(T)8G(T)3
or G(T)11, respectively (analogous to that found naturally from the pooled human
gDNA) (Section 5.3.2.6).
5.3.2.4 Production of the Smaller SLC11A1 Promoter Plasmids
The smaller SLC11A1 promoter regions designed to functionally test elements identified
through the bioinformatic analysis (Figure 5.16) (Section 5.3.2.2) were cloned into the
pGeneBLAzer-TOPO plasmid. The cloned and sequence verified 1A-bla(M) plasmids
(allele 2, allele 3 and allele T in the forward orientation) (Section 5.3.2.3) were used as
the template to produce the smaller SLC11A1 promoter inserts (Section 5.2.2.2.1).
These were subsequently cloned, isolated (Section 5.2.2.2.6), and verified for the
incorporation of the correct insert and insert orientation (Section 5.2.2.2.8).
The amplification, cloning and verification of expression constructs resulted in the
production of 42 different plasmids, containing the eight designed SLC11A1 promoter
regions (Table 5.6) (Figure 5.16). Promoter regions 1A, 7A, 7C, 8A, 8C and 8D
contained both (GT)n and -237C/T polymorphisms (Figure 5.16). Therefore, six
different promoter constructs were prepared for each of these regions (variants: allele 2,
allele 3 and allele T in the forward and reverse orientation) (Table 5.6). Four different
plasmids were produced for the promoter region 9C, containing only the -237C/T
polymorphism (variants: allele C and allele T in the forward and reverse orientation),
while the promoter region 10C did not contain any polymorphisms and, therefore, was
only produced in the forward and reverse orientation (Table 5.6). The created SLC11A1
promoter expression constructs were transfected into human cell lines to determine the
influence of bioinformatically identified putative regulatory elements involved in
SLC11A1 transcription (Chapter 6, Part 3).
175
Table 5.6 Description of Variants of the Manufactured SLC11A1 Reporter Constructs.
Plasmid
Insert Size
Variants
Number
Description
1A-bla (M)
3267bp
6
Allele 2, Allele 3 and Allele T in the forward and reverse orientation.
7A-bla (M)
898bp
6
Allele 2, Allele 3 and Allele T in the forward and reverse orientation.
7C-bla (M)
581bp
6
Allele 2, Allele 3 and Allele T in the forward and reverse orientation.
8A-bla (M)
729bp
6
Allele 2, Allele 3 and Allele T in the forward and reverse orientation.
8C-bla (M)
411bp
6
Allele 2, Allele 3 and Allele T in the forward and reverse orientation.
8C-bla (M)
411bp
6
Allele 2, Allele 3 and Allele T in the forward and reverse orientation.
8D-bla (M)
165bp
6
Allele 2, Allele 3 and Allele T in the forward and reverse orientation.
9C-bla (M)
280bp
4
Allele C and Allele T in the forward and reverse orientation.
10C-bla (M)
148bp
2
Forward and reverse orientation.
5.3.2.5 Production of the Control Plasmids
An empty vector negative control was required for the SLC11A1 promoter assays to
determine a baseline expression level, thus allowing for correction of background
fluorescence. However, due to the presence of the topoisomerases at each end of the
linear vector (which allows for fast TOPO ligation of the insert), re-circularisation of the
vector was not possible. There was neither a commercially available circular bla(M)
plasmid nor literature documenting the removal of the topoisomerases enzymatically or
chemically (and subsequent self-ligation) of any of the TOPO vectors. LaGier et al.
(2007) used an empty vector as a control [empty-bla(M)], however, the paper did not
specify how the empty vector was prepared. Restriction enzyme analysis of all the
SLC11A1 reporter plasmids (Sections 2.2.4.1 and 5.2.2.1.1) determined an empty vector
[emp-bla(M)] plasmid could be produced using the 8A-bla(M) plasmid cut with the
restriction enzymes Bsu36I and BstXI to remove the insert (Figure 5.19A). Therefore,
the emp-bla(M) plasmid was prepared (Section 5.2.2.2.9) by sequential digestion of the
176
8A-bla(M) plasmid, followed by self-ligation of the vector (Figure 5.19B). Restriction
digestion, with the enzyme RsaI, verified that the correct emp-bla(M) plasmid had been
created (Figure 5.19D).
Provided with the transfection kit was a positive control plasmid, UBC-bla(M), which
has the ubiquitously expressed, ubiquitinase C promoter, located upstream of the βlactamase gene. This provided a positive control for use in the transfection studies.
Figure 5.19 Production of the negative control emp-bla(M) plasmid. (A) Restriction
map of the 8A-bla(M) plasmid with the enzymes BstXI and Bsu36I allowing the
removal of the 8A insert. (B) Double restriction digestion showing the removed insert
(743bp) and the linear vector (5366bp). (C) Restriction map of the ligated emp-bla(M)
plasmid showing the positions of RsaI sites. (D) Restriction digestion of isolated
plasmids with clones 2 and 4 showing the correct banding pattern and successful
production of the emp-bla(M) plasmid.
177
5.3.2.6 Identification of Novel Sequence Variants within the SLC11A1
Promoter
Sequencing and alignment of the sequences of the different isolated 1A-bla(M) plasmid
clones (Section 5.3.2.3.2) resulted in the identification of several novel promoter
variants. A putative single base substitution was detected in one of the cloned SLC11A1
promoter inserts. This was a base substitution of an A for a C at position -2578
(designated -2578A/C) (Figure 5.20A). Another substitution (G to A) was detected in
the non-coding region of the first exon at position +128 (47 bases upstream of the
translation start site). This is the first polymorphism to be reported within the 5’UTR of
SLC11A1 (Figure 5.20B) (Section 1.2.4.2). Each of these single base substitutions was
identified in only one of the sequenced plasmids, suggesting that these identified
substitutions may be rare novel polymorphisms. Alternatively, they may represent
artifacts of the amplification and cloning process to produce the plasmid clones. Further
sampling and sequencing is required to validate the identified novel sequence variants.
In addition to the two identified single base substitutions, a polymorphic G(T)n tract
[G(T)nG(T)3G(T)3G(T)5G(T)2G(T)2G(T)6] was also identified 2474 bases upstream of
the SLC11A1 transcription start site (rs13035487) (Figure 5.20C). Three novel
polymorphic variants [G(T)14, G(T)11 and G(T)10], in addition to two previously
reported variants [G(T)12 and G(T)8G(T)3] were identified. The large region (3267bp) of
the SLC11A1 promoter amplified and cloned in the pGeneBLAzer plasmid to produce
the 1A-bla(M) plasmid, allowed for the analysis of haplotype patterns between the
different polymorphisms within the SLC11A1 promoter (Table 5.7).
178
Figure 5.20 Sequencing electrophoregrams of novel SLC11A1 promoter sequence
variants. Two single base substitutions were identified, one 2578bp upstream of the
transcription start site (A), resulting in the substitution of an A nucleotide for a C, and a
second at position +128 and 47 bases before the translation start site (B), resulting in a
G to A substitution. (C) Five alleles (of which three are novel) of a G(T)n microsatellite
(rs13035487) were identified.
179
From the 17 1A-bla(M) plasmids, which were sequenced, the allelic variants
G(T)8G(T)3 and (GT)n allele 2 were always identified in cis with each other (5 of 17
plasmids), while (GT)n allele 3 was only identified with the four other identified G(T)n
alleles, notably G(T)11 (8 of 17 plasmids) (Table 5.7). It is not known if polymorphic
variants at the G(T)n polymorphism (at -2474) have an effect on the expression levels of
SLC11A1, however, due to the high level of LD that exists within the SLC11A1
promoter (especially (GT)n allele 2 and G(T)8G(T)3), the observed association of the
SLC11A1 promoter microsatellite (GT)n alleles with infectious and autoimmune disease
may be due to potential LD with the G(T)n polymorphism located further upstream.
Table 5.7 SLC11A1 Promoter Haplotypes at the G(T)n, Promoter (GT)n and -237C/T
Polymorphic Sites.
G(T)n Allele
(GT)n Allele
-237
Number*
G(T)14
3
C
1
G(T)12
3
C
1
G(T)11
3
C
8
G(T)10
3/9
C
2
G(T)8G(T)3
2
C
5
*Number of plasmids with polymorphism combination (n=17)
Further sampling and sequencing is required to validate the identified novel sequence
variants and to determine the extent of LD between promoter variants. However,
validation of these novel sequence variants was beyond the scope of this current study
(Section 6.4.6.6).
180
5.4 DISCUSSION
5.4.1 In Silico Identification of Putative Elements Involved in
SLC11A1 Transcription
Bioinformatic analyses were used to assess the SLC11A1 promoter to identify important
regions for the binding of putative regulatory elements that may modulate SLC11A1
expression. The findings of the bioinformatic studies guided the design of promoter
constructs to functionally determine whether identified putative promoter regions could
regulate SLC11A1 expression. The majority of data from the bioinformatic assessment
indicated that the important SLC11A1 promoter elements/regions were located within a
700bp region, surrounding the transcription start site (-500bp to +200) (Figure 5.14).
Therefore, this 700bp region formed the focus of the reporter analyses (Section 5.3.2.2).
The bioinformatic studies showed that a high level of conservation existed upstream of
TSS1 (-28 to -70). While TFBS searches did not identify elements associated with the
formation of the basal transcriptional complex (for example TATA box or TAF/TFIID
elements) (Section 5.3.1.4.1), the positioning, as well as the extremely high level of
conservation (Sections 5.3.1.2 and 5.3.1.3) suggested that this region could be the site
for the formation of the basal transcriptional complex. Furthermore, a high level of
homology was also identified after the two transcription start sites in the 5’ UTR and
first intron of SLC11A1 (Section 5.3.1.2). In particular, the fourth and fifth highest
scoring WeederH elements were located after the transcription start site (Section
5.3.1.3), suggesting either the presence of a core promoter element (i.e. DPE) or noncore elements (Figure 5.14). The SLC11A1 promoter expression constructs were
designed to determine a minimal promoter region through the systematic shortening of
the SLC11A1 promoter around the region displaying the highest level of conservation
(SLC11A1 promoter region 10C, Figure 5.16). Furthermore, constructs were designed to
determine if the identified putative elements, located after the transcription start site,
modulated SLC11A1 expression. The SLC11A1 promoter constructs were designed to
also allow for the systematic determination of SLC11A1 promoter regions which
enhance expression (Figure 5.16). Once these regions were identified, they could be
further assessed, according to the bioinformatic data collected, to determine putative
transcription factor candidates (Section 5.3.1.4.2).
181
From the bioinformatic analyses completed in this study, and conclusions from other
studies, there is conflicting evidence regarding the level of conservation at the (GT)n
microsatellite repeat, and therefore, the mechanism by which the microsatellite
functions to enhance transcription. While a repetitive GT unit was identified in the
promoter region of all SLC11A1 homologs (Section 5.3.1.2), the clustalW alignment
indicated poor conservation of the repetitive sequence (Figure 5.8), suggesting that the
repeat may play a topological role, as opposed to being involved in the binding of
transcription factors in a sequence specific manner. However, another previously
published alignment of four SLC11A1 homologs, which only included the GT repeat
region, showed a high level of conservation at the microsatellite repeat (Awomoyi,
2007), consistent with conserved elements identified from the WeederH analysis
(Figure 5.9) and recruitment of the transcription factor HIF-1α to these elements
(Bayele et al., 2007) (Figure 5.13). The clustalW alignment, completed in this study,
failed to identify conservation within the (GT)n microsatellite region due to the large
3000bp region selected for the analysis. While other features of the selected 3000bp
SLC11A1 homolog promoters were well aligned (for example the translation start site),
the differing locations of the GT repeats between the different homolog promoters
meant they were not aligned in the current analysis, thus accounting for the observed
lack of conservation. Therefore, it appears that the (GT)n microsatellite repeat functions
to modulate SLC11A1 expression through both a topological function (i.e.
transcriptional enhancement due to the formation of Z-DNA [Section 5.3.1.5]), as well
as recruitment of the transcription factor HIF-1α to conserved sequence elements, in a
sequence specific manner.
The bioinformatic analysis of the SLC11A1 promoter identified a significant number of
putative elements located throughout the promoter region (Figure 5.13). A comparison
of identified elements from the different in silico programs showed a high degree of
correlation (Figure 5.14). Since the compilation of this data, three subsequent studies
have identified transcription factor binding to sequence elements within the SLC11A1
promoter (Section 5.3.1.6). Comparison of the in silico data with these experimentally
determined promoter elements indicates a significant level of concordance between the
published sites and those identified by bioinformatic analyses in the current study. The
level of concordance suggests that the bioinformatic assessment completed has
significant predictive ability to discover other elements within the SLC11A1 promoter
182
involved in transcriptional regulation. This provides greater confidence in the
methodology employed for the design and production of the promoter constructs and a
high level of confidence that the prepared promoter constructs will likely identify
functional regions involved in the regulation of SLC11A1 expression.
5.4.2 Mechanism of Differential SLC11A1 Expression
Mediated by the Functional Promoter Polymorphisms
Allelic variants at the (GT)n microsatellite and -237C/T promoter polymorphisms have
been shown to differentially regulate SLC11A1 expression. At the (GT)n microsatellite
repeat, reporter constructs indicated that allele 3, with 9 GT repeats, mediated a higher
level of SLC11A1 expression, as compared to allele 2 (10 GT repeats) (and the other
alleles that occur at low frequencies), with or without exposure to exogenous stimuli
(Figure 1.8). Due to the role SLC11A1 plays in the activation of a Th1 mediated
immune response, the (GT)n alleles have been the focus of a significant number of
studies assessing the association of this microsatellite with the incidence of disease
(infection, autoimmune/inflammatory disease and cancer), with growing evidence
showing that (GT)n allele 3 confers susceptibility to autoimmune disease (but resistance
to infection), while allele 2 predisposes an individual to infectious disease (but
resistance to autoimmune disease). Similarly, the -237 T variant resulted in a
significantly lower level of SLC11A1 expression (comparable to the expression level of
(GT)n allele 2), as compared to the wild type -237 C variant (Section 1.3.3). The
mechanism by which the promoter variants at these polymorphisms modulate
differential levels of SLC11A1 expression is yet to be elucidated.
The transcriptional enhancement modulated by the (GT)n microsatellite repeat has been
attributed, in part, to the ability of the microsatellite to form Z-DNA (Blackwell, 1996,
Searle and Blackwell, 1999). Z-DNA is an alternative DNA conformation, which has
been shown to enhance transcription (Section 5.1.3.2). Bioinformatic (Section 5.3.1.5)
and experimental analyses have shown the ability of the (GT)n microsatellite form to ZDNA in vivo during SLC11A1 transcription (Bayele et al., 2007, Xu et al., 2011).
Therefore, it was hypothesised that the ability of the (GT)n promoter alleles to modulate
differing SLC11A1 expression levels would be attributable to differences in the ability
of each allele to form Z-DNA (Sections 5.1.4.2.1 and 5.3.1.1). Thus, high SLC11A1
183
expression, driven by (GT)n allele 3, would be due to an increased propensity to
transition to Z-DNA, compared to allele 2. Bioinformatic analysis of allelic variants at
the (GT)n microsatellite repeat for their Z-DNA forming propensity, found the ability of
the individual (GT)n alleles to form Z-DNA did not correlate with previously reported
promoter activity for the individual alleles, but was associated with the length of the
microsatellite repeat, consistent with previous observations (Nordheim et al., 1982)
(Section 5.3.1.5.1). The Z-Hunt analysis of the different (GT)n microsatellite alleles
found that (GT)n allele 2 (15167.83), with 10 GT repeats, had a higher Z-score than
allele 3 (12598.14) (9 GT repeats) (Section 5.3.1.5.1), suggesting that allele 2 would
have an increased propensity to form Z-DNA, and therefore, would drive higher
SLC11A1 expression, as compared to allele 3. The contradictory findings between the
Z-Hunt analysis (which suggested that allele 2 possessed greater transcriptional activity)
and the previously determined promoter activity of the (GT)n alleles (which show allele
3 drives higher SLC11A1 expression), suggests that the ability of the individual (GT)n
alleles to modulate differential SLC11A1 expression is not mediated by differences in
the ability of the alleles to form Z-DNA to enhance transcription, but due to an
alternative mechanism(s).
Bioinformatic analysis aimed at understanding the mechanism underlying the difference
in the level of expression mediated by the -237C/T polymorphism found that the
presence of the -237 C or T variant did not affect the Z-score of the (GT)n microsatellite
repeat (Section 5.3.1.5.1). This suggests that differences in the level of expression of
SLC11A1, mediated through variants at the -237C/T polymorphism, are not due to these
sequence variants bringing about differences in the propensity of the microsatellite
repeat to form Z-DNA. Furthermore, this suggests that the -237C/T polymorphism may
function to alter SLC11A1 expression independently of the differential level of
expression modulated by allelic variants at the (GT)n repeat. Further bioinformatic
analysis did not identify transcription factor binding at the location of the -237C/T
polymorphism in the presence of the commonly occurring C variant, however, TFBS
searches identified an element for the recruitment of the ubiquitously expressed
transcription factor, Oct-1, in the presence of the T variant (Section 5.3.1.4.3). The
introduction of this element and recruitment of Oct-1 to the SLC11A1 promoter during
transcription may be responsible for the lower SLC11A1 expression level observed in
the presence of the -237 T variant.
184
To further assess the mechanism by which the (GT)n and -237C/T polymorphisms alter
SLC11A1 expression, multiple SLC11A1 promoter constructs were produced for each
promoter region designed (Figure 5.16), with each plasmid differing only by the allelic
variant present (Section 5.3.2.4). The promoter constructs containing the different allelic
variants were designed to enable the identification of promoter regions, where
transcription factors may be located, which are differentially regulated by the different
promoter variants. This may lead to the identification of the mechanism by which
variants at the (GT)n and -237C/T modulate differential levels of SLC11A1 expression.
5.4.3 Conclusion
Results of the completed in silico analysis of the SLC11A1 promoter were used as a
guide for the functional experiments aimed at understanding the mechanisms of
SLC11A1 transcription and how allelic variants within the promoter function to
modulate differential SLC11A1 expression. The design of the promoter constructs,
based on the findings of the bioinformatic analysis has enabled a focused approach (as
opposed to the random cloning of different promoter segments), to facilitate the
determination of the functional importance of the identified putative promoter elements.
The promoter activity of the 42 designed and prepared SLC11A1 promoter constructs
were determined in vivo using human cell lines. The results of the reporter assays are
presented in Chapter 6.
185
CHAPTER 6 – FUNCTIONAL ANALYSIS OF
THE SLC11A1 PROMOTER
PART 3: Analysis of the SLC11A1 Promoter using Promoter
Assays.
186
6.1 INTRODUCTION
Studies assessing the association of functional variants of the SLC11A1 promoter with
the incidence of infectious and autoimmune diseases have produced conflicting
observations (Section 1.3.4). These studies have attempted to determine if there is an
association with disease incidence in the absence of functional knowledge of the
regulatory mechanisms controlling SLC11A1 transcription, and the mechanisms
mediating the differential expression of SLC11A1 observed in the presence of the
different promoter variants. The current study adopted an integrated approach utilising a
combination of in silico and in vivo analyses, to gain an understanding of SLC11A1
promoter function and regulation.
In the previous chapter, in silico bioinformatic analyses of the SLC11A1 promoter were
completed to identify putative regulatory regions/elements involved in the expression of
SLC11A1 (Chapter 5, Part 1). The in silico analyses indicated that the important
SLC11A1 promoter elements/regions were located within a 700bp region (-500 to +200)
surrounding the transcription start site. Furthermore, a highly conserved 40bp region
upstream of the transcription start site (-70 to -28), and putative elements in the 5’UTR
and into the first intron were also identified (Figure 5.14). Based on the findings of the
bioinformatic analyses, SLC11A1 promoter regions of varying lengths (Figure 5.16)
were cloned into a reporter vector to empirically determine the promoter activity driven
by each of the elements identified in silico (Chapter 5, Part 2).
Where the SLC11A1 promoter regions contained either the (GT)n or -237C/T
polymorphisms, multiple promoter constructs which contained the different
polymorphic variants were designed and cloned for each promoter length. This strategy
was aimed at identifying promoter regions containing elements for the recruitment of
transcription factors that may interact differently with the polymorphic variants to
modulate SLC11A1 expression. Where promoter regions contained both the (GT)n and
-237C/T polymorphisms, three promoter constructs were prepared to contain the
different combinations of polymorphic variants. These were termed allele 2 [combined
(GT)n allele 2 and -237 C], allele 3 [combined (GT)n allele 3 and -237 C] and allele T
[combined (GT)n allele 3 and -237 T] (Section 5.3.2.2.2). When the cloned promoter
region contained only the -237C/T polymorphism (SLC11A1 promoter region 9C,
187
Figure 5.16), two plasmid variants were produced, and named allele C and allele T.
Additionally, the different promoter regions, containing the different polymorphic
variants, were cloned into the expression constructs in both the forward and reverse
orientation to determine if the SLC11A1 promoter could mediate bidirectional
transcription (Section 5.3.2.2.3). In total, 42 different SLC11A1 promoter constructs
were designed and prepared (Table 5.6).
In the current chapter, the 42 SLC11A1 promoter constructs were transfected into
monocytic and non-monocytic human cell lines, in parallel with the negative and
positive control plasmids, emp-bla(M) and UBC-bla(M), respectively, to functionally
determine the promoter activity of different regions of the SLC11A1 promoter (Chapter
6, Part 3). Furthermore, the mechanism by which promoter variants differentially
modulate SLC11A1 expression, and whether the SLC11A1 promoter could mediate
bidirectional transcription were also investigated. The SLC11A1 promoter regions
identified to alter promoter activity were further assessed based on the bioinformatic
data, to identify candidate TFBS.
6.1.1 Detection of SLC11A1 Promoter Activity using the
GeneBLAzer Reporter System
The different SLC11A1 promoter regions were cloned into the pGeneBLAzer reporter
vector upstream of a β-lactamase gene (bla) (Figure 6.1A). β-lactamase is a bacterial
enzyme which has been developed as a reporter to quantify promoter activity in the
pGeneBLAzer plasmid in mammalian cells. After transfection, β-lactamase expression
is directed by the cloned promoter region within the construct. Promoter activity (i.e.
expression level of β-lactamase) is measured by the addition of a fluorescence
resonance energy transfer (FRET) molecule, CCF2-AM, composed of a coumarin
(donor) and fluorescein (acceptor) moiety (Oosterom et al., 2005, Zlokarnik et al.,
1998). When added to live cells, the CCF2-AM FRET molecule passes freely into the
cell, where cytoplasmic esterase’s modify the molecule and concentrate the substrate
within the cell (Figure 6.1B). When excited at 409nm, the intact CCF2-AM molecule
results in a green fluorescence emission at 520nm. The expressed β-lactamase cleaves
the CCF2-AM substrate resulting in the physical separation of the coumarin and
fluorescein moieties, which, upon excitation at 409nm, produces a blue fluorescence
188
Figure 6.1 GeneBLAzer detection of promoter activity. (A) Map of the pGeneBLAzer
reporter plasmid (Section 5.2.2.1.1). (B) After diffusion across the cell membrane, the
CCF2-AM substrate is concentrated within the cell, due to modification of the FRET
molecule. Excitation of CCF2 at 409nm results in a transfer of energy from the donor to
the acceptor, generating green fluorescence emission at 520nm. β-lactamase expression,
driven by the cloned promoter region, cleaves the CCF2 molecule (removal of the
acceptor), where excitation at 409nm results in the emission of blue fluorescence at
447nm (Zlokarnik et al., 1998). (C) Cleaved (blue) and uncleaved (green) CCF2
substrate have different emission peaks (Zlokarnik et al., 1998).
189
emission at 447nm (Figure 6.1C) (Zlokarnik et al., 1998). Promoter activity is
determined by the ratio of blue to green fluorescence (i.e. cleaved and uncleaved
substrate, respectively). This ratiometric determination reduces experimental well to
well variation, which may arise from variation in cell density, cell size or signal
intensity (Oosterom et al., 2005, Qureshi, 2007). Therefore, by extension, the observed
fluorescence intensity (due to β-lactamase expression driven by the cloned promoter
region) is a measure of SLC11A1 promoter activity.
190
6.2 MATERIALS AND METHODS
6.2.1 Materials
Dulbecco's Modified Eagle Medium (DMEM), RNase AWAY, Roswell Park Memorial
Institute (RPMI) 1640 medium, HEPES buffer, L-gluatamine, amino acids, TrypLE
Express, fetal bovine serum (FBS), Recovery Cell Culture Freezing Medium, Hanks
buffered salt solution (HBSS), OPTIMEM, Accutase, Lipofectamine 2000,
Lipofectamine LTX, SuperScript III First-Strand Synthesis Supermix, SYBR GreenER
qPCR SuperMix Universal, and the CCF2-AM Loading Kit were purchased from
Invitrogen (California, USA). Methanol, formaldehyde (37%), phorbol myristate acetate
(PMA), 0.4% trypan blue, LPS, and recombinant human IFN-γ were purchased from
Sigma-Aldrich. Tissue culture flasks (T75 and T175) for the culture of U937 and THP-1
cell lines were purchased from Sarstedt (Nümbrecht, Germany). Tissue culture flasks
for the culture of 293T cells, 6-well tissue culture plates, 15ml and 50ml centrifuge
tubes and 20 gauge needles were purchased from BD Biosciences (New Jersey, USA).
Costar 96 well optically clear black walled tissue culture plates were purchased from
Corning (Massachusett, USA). The Amaxa Human Monocyte Nucelofection system
was purchased from Lonza (Basel, Switzerland). The 50μm gauze was obtained from
Sefar Filter Specialist (Thal, Switzerland) and the RNeasy Plus Mini Kit from Qiagen
(Maryland, USA).
6.2.1.1 Cell Lines
The cell lines used for transfection of SLC11A1 promoter constructs to determine
promoter activity included:
x
293T cells (human embryonic kidney cell line) (kindly donated by Lisa Sedger,
University of Technology Sydney).
x
U937 (histiocytic cell line) (kindly donated by Stella Valenzuala, University of
Technology Sydney).
x
THP-1 (monocytic leukaemia cell line) (purchased from the European
Collection of Cell Cultures).
191
6.2.2 Methods
6.2.2.1 Cell Culture Techniques
6.2.2.1.1 Sterility and Containment
All mammalian cell culture work was conducted in a class II laminar flow cell culture
cabinet. Sterilisation of equipment and the working area of the cabinet was completed
by cleaning with 70% (v/v) ethanol followed by exposure to UV light for 15min prior to
the commencement of any cell culture work. After UV sterilisation, all media, cells or
equipment were thoroughly cleaned with 70% (v/v) ethanol when moved in or out of the
cell culture cabinet. Unless otherwise stated, all media was warmed to 37oC prior to use.
All cell lines were grown at 37oC in a humidified chamber with 5% CO2.
6.2.2.1.2 Culture and Maintenance of Human Embryonic Kidney 293T
Cells
The human embryonic kidney 293T cell line (293T) was created by adenoviral
transformation of healthy human aborted fetus embryonic kidney cells (Graham et al.,
1977). The 293T cell line is an adherent cell line, which was maintained in DMEM
supplemented with 20mM HEPES, 2mM L-glutamine and 10% (v/v) FBS. Cells were
passaged every 3-4 days with a 1 in 10 to 1 in 20 split (doubling time ~18-20h) (Section
6.2.2.1.5).
6.2.2.1.3 Culture and Maintenance of U937 Cells
The cell line U937 is a histiocytic cell line originating from an individual suffering from
diffuse histiocytic lymphoma (Sundström and Nilsson, 1976). The U937 cell line is a
non-adherent cell line and was maintained in DMEM supplemented with 20mM
HEPES, 2mM L-glutamine and 10% (v/v) FBS. Cells were maintained at a density of
between 0.3-1.0×10⁶cells/ml and subcultured every 3-4 days (doubling time of ~30h)
(Section 6.2.2.1.5).
6.2.2.1.4 Culture and Maintenance of THP-1 Cells
The THP-1 cell line, a non-adherent acute monocytic leukaemia cell line (Tsuchiya et
al., 1980), was originally obtained at a passage number of 14. THP-1 cells were cultured
in RPMI 1640 medium supplemented with 20mM HEPES, 2mM L-glutamine and 10%
192
(v/v) FBS. Cells were maintained at a density of between 0.3-0.8×10⁶cells/ml and
passaged every 3-5 days using a 1 in 4 to 1 in 5 split (doubling time ~40h) (Section
6.2.2.1.5). Cells between passage number 14 and 25 were used for experiments.
6.2.2.1.5 Passaging of Cell Lines
Enumeration of Cell Density
For the passage of cell lines and for experimental work, cell density was determined
using a haemocytometer. Cells were loaded by capillary action into a haemocytometer
and viewed under an inverted microscope. The cell density was determined using the
mean number of cells within the four large corner squares on the counting grid,
multiplied by a factor of 104 and the dilution factor (if applicable).
Adherent Cell Lines
To subculture adherent cells, the media was removed and 3ml of TrypLE Express was
washed over the cell monolayer and then removed. A further 8ml of TrypLE Express
was then added to the flask, which was incubated at 37oC for approximately 4min. Cell
detachment was verified by viewing the cells using an inverted microscope. Cells were
dispersed using a pipette and 1ml of cell suspension was removed and added to a 50ml
centrifuge tube containing 5ml of media. After centrifugation (1000rpm, 2min), the
supernatant was removed and the cells were resuspended in 10ml of fresh culture
medium. The appropriate volume (generally 1-5ml) of cell suspension was then seeded
into new T75 flasks and fresh culture medium was added to the flask to a final volume
of 20ml. The cells were incubated at 37oC with 5% CO2.
Non-adherent Cell Lines
Non-adherent cells were subcultured by removing 5-10ml of confluent cell suspension
(0.8×10⁶cells/ml) and adding it to a centrifuge tube. After centrifugation (1000g, 4min)
the cells were resuspended in fresh media (5-10ml) and the required number of cells
were transferred to new T75 tissue culture flasks. Fresh culture medium was added to
the flask for a final volume of 20ml and the cells were incubated at 37oC with 5% CO2.
193
6.2.2.1.6 Determination of Cell Viability
The trypan blue viability assay was used as a relative measure of cell death. The vital
dye trypan blue (0.4%) was added to an equal volume of media containing suspended
cells, loaded into a haemocytometer, and cells were observed immediately. The number
of blue (dead) cells counted in a total of 100 cells represented the percentage of nonviable cells.
6.2.2.1.7 Reviving Mammalian Cell Lines
Cell stocks, maintained in liquid nitrogen, were thawed rapidly in a 37oC water bath.
Once thawed, all of the media containing the cells was removed and added dropwise to
4ml of media (containing 20% (v/v) FBS) with gentle mixing. Cells were pelleted
(500rpm, 8min) and resuspended in 5ml of fresh culture medium (containing 20% (v/v)
FBS) and transferred to a T25 tissue culture flask, and incubated at 37oC and 5% CO2.
Flasks containing THP-1 cells were maintained in an upright position to concentrate
cells for 5-7 days.
6.2.2.1.8 Storage of Mammalian Cell Lines
Cells were frozen down when in the log phase of growth. Cells were removed from the
tissue culture flasks (Section 6.2.2.1.5), resuspended in Recovery Cell Culture Freezing
Medium at a density of 1×10⁶cells/ml, and 1ml of the cell suspension was added to
individual cryogenic tubes. To achieve a slow rate of freezing, cryogenic tubes were
placed in a freezing apparatus containing isopropanol and frozen at -80oC for 24h. Cells
were then transferred to storage in liquid nitrogen.
6.2.2.1.9 Differentiation and Cytokine Stimulation of THP-1 Cells
Differentiation of THP-1 cells was completed by the addition of PMA to the culture
medium to achieve a final concentration of 5ng/ml or 100ng/ml. Cells were observed for
adherence 24h after initiation of differentiation. Removal of adherent, PMAdifferentiated THP-1 cells, after 48h, was achieved using Accutase following the same
procedure used for the removal of adherent cells (Section 6.2.2.1.5). However, cells
were washed with phosphate buffered saline (PBS) prior to the addition of the Accutase.
Stimulation of THP-1 cells was achieved by supplementation of the culture medium
with IFN-γ (100U/ml) and LPS (0.1μg/ml) prior to the addition of cells.
194
6.2.2.2 Transfection Protocols
6.2.2.2.1 Transfection of 293T Cells using Lipofectamine 2000
The 293T cells were seeded into 96 well optically clear bottom black walled plates or 6well tissue culture plates (for flow cytometric analysis) 24h prior to transfection of cells
with the SLC11A1 promoter constructs (Figure 5.16). For the 96 or 6 well plates,
2.5×10⁴ or 2.5×10⁶ cells were added to each well, respectively. Plates were incubated at
37oC with 5% CO2 until the cells were transfected.
Lipofectamine 2000 was used to transfect 293T cells with the SLC11A1 promoter
constructs (Section 5.2.3.4), or the positive and negative control plasmids [UBC-bla(M)
and emp-bla(M), respectively] (Section 5.3.2.5). After 24h, cells were observed for
adherence using an inverted microscope. Transfections in 96 well plates were conducted
in replicates of four. For each plasmid transfected, solution A (2μg plasmid DNA in a
final volume 50μl OPTIMEM) and solution B (4μl Lipofectamine 2000 and 46μl
OPTIMEM) were prepared separately, then mixed together and allowed to stand for
20min. The media was then carefully removed from all wells and cells were washed in
100μl of OPTIMEM. The OPTIMEM was removed completely and 20μl of lipid/DNA
complexes (combined solution A and B) was added in each well, followed by the
addition of 100μl fresh culture medium. Transfection of 293T cells in 6 well plates was
completed in a similar fashion to cells in 96-well plates, however, increased volumes
were used: solution A (4μg DNA in 250μl OPTIMEM) and solution B (10μl
Lipofectamine 2000 and 240μl OPTIMEM). After transfection, the cells were incubated
(37oC, 5% CO2) and, after 24h, the cells were loaded with substrate (Section 6.2.2.2.4)
and fluorescence was detected using a plate reader (Section 6.2.2.3.3) or flow cytometer
(Section 6.2.2.3.4).
6.2.2.2.2 Transfection of THP-1 Cells with Lipofectamine LTX
Prior to transfection (24h), THP-1 cells were passaged into fresh media to ensure that
the cells were in log phase growth (Section 6.2.2.1.5). At the time of transfection, cells
were approximately 50% confluent (4×10⁵cells/ml). Liposomes were prepared by the
addition of 1μg plasmid DNA (SLC11A1 promoter constructs or control plasmids) to
200μl of OPTIMEM, followed by the addition of 1μl of PLUS reagent. The sample was
mixed gently, incubated at RT for 5min and 2.5μl of Lipofectamine LTX was added.
195
The sample was mixed gently and incubated at RT for 30min. THP-1 cells were
removed from the flask, washed in OPTIMEM, counted (Section 6.2.2.1.5) and
resuspended in OPTIMEM at a density of 2×10⁵cells/ml. Cells were seeded into 12 well
tissue culture plates (2×10⁵cells/well) and 200μl of the DNA-lipid complexes were
added dropwise into the well and mixed gently. Cells were incubated at 37oC with 5%
CO2 and, 24h post-transfection, cells were loaded with CCF2-AM substrate (Section
6.2.2.2.4) and fluorescence was detected using a plate reader (Section 6.2.2.3.3) or flow
cytometer (Section 6.2.2.3.4).
6.2.2.2.3 Transfection of THP-1 Cells Using Nucleofection
Prior to transfection (24h), THP-1 cells were split into fresh culture medium to ensure
that cells were in log phase growth. At the time of transfection, cells were
approximately 50% confluent. Prior to transfection, 6 well tissue culture plates,
containing 3ml human monocyte nucleofector media (supplemented with 20% (v/v)
FBS and 1% amino acids), were incubated at 37oC with 5% CO2 until required.
Following the optimised protocol of Schnoor et al. (2009), THP-1 cells were transfected
using the Amaxa Human Monocyte Nucelofection Kit. Each transfection was conducted
using 2.5×10⁶cells in 100μl human monocyte nucleofector solution. The appropriate
SLC11A1 promoter plasmid, or supplied pmaxGFP vector (0.5μg), was then added to
the cells in nucleofector solution, mixed well and transferred to the nucleofection
cuvette. The cells were electroporated using a Nucleofector (Lonza) set to the Y-001
program, and 500μl of human monocyte nucleofector media (supplemented with 20%
(v/v) FBS and 1% amino acid) was added to the cuvette (post-nucleofection) and the
contents were mixed well. Cells were removed from the cuvette using a sterile pipette
and transferred to a single well of the pre-incubated 6 well tissue culture plate,
containing human monocyte nucleofector media. Cells were mixed well and incubated
at 37oC with 5% CO2 and, 24h post-transfection, cells were loaded with substrate
(Section 6.2.2.2.4) and promoter activity was determined by flow cytometry (Section
6.2.2.3.4).
6.2.2.2.4 Addition of Substrate (CCF2-AM) For Reporter Analysis
To detect promoter activity of cells transfected with SLC11A1 promoter constructs
(Sections 6.2.2.2.1, 6.2.2.2.2 and 6.2.2.2.3), the transfected cells were initially analysed
196
for cellular morphology and/or adherence using an inverted microscope. Loading of the
coumarin cephalosporin fluorescein (CCF2-AM) substrate was carried out according to
the manufacturer’s general loading protocol for in vivo detection. Firstly, 6X loading
solution was prepared (solution A was added to solution B, mixed well, and then
solution C was added) and wrapped in aluminium foil to avoid light exposure. When
cells were analysed by flow cytometry or confocal microscopy, HBSS was substituted
for solution C.
For substrate loading of 293T cells in 96 well plates (Section 6.2.2.2.1), the media was
removed, cells were washed once with 100μl HBSS, and 100μl of fresh HBSS was
added to each well. With the light in the class II laminar flow cabinet turned off, 20μl of
the 6X loading solution was added to each well. Control wells, which did not contain
cells, were prepared in parallel and these contained 100μl HBSS and 20μl 6X loading
solution. The 96 well plate was incubated at RT for 60min, protected from light
exposure. Promoter activity was determined by measurement of fluorescence intensity
(blue and green) using a fluorescence plate reader (Section 6.2.2.3.3) or cells were
analysed by confocal microscopy (Section 6.2.2.3.2).
For substrate loading of Lipofectamine LTX transfected THP-1 cells (Section 6.2.2.2.2),
the cells were removed from the 12 well tissue culture plate, transferred to centrifuge
tubes, washed once in HBSS, and resuspended in 400μl HBSS. Samples were split into
replicates of four by transferring 100μl of cells from each well to a 96 well optically
clear bottom black walled plate. The substrate was then loaded, as previously described
for the 293T cells. Prior to the measurement of fluorescence intensity using the plate
reader, the plate was centrifuged (1000g, 1min) to ensure that cells were located at the
base of each well.
For flow cytometric analysis of the adherent, cell line 293T (Section 6.2.2.2.1), the
media was removed from the 6 well tissue culture plates and the cells were removed
from the wells by the addition of 1ml TrypLE Express. After 4min incubation (37oC
with 5% CO2) the cells were transferred to 15ml centrifuge tubes and 3ml fresh medium
was added to each tube followed by centrifugation (1000g, 4min). After removal of the
supernatant, the cells were washed in 4ml of HBSS and 2ml of fresh HBSS was added
followed by the addition of 6X loading solution. The cells were resuspended and passed
197
through 50μm gauze to remove any clumped cells or cellular debris. The cells were then
incubated for 1h at RT (protected from light) and the promoter activity was determined
by flow cytometry (Section 6.2.2.3.4).
For THP-1 cells transfected by nucleofection (Section 6.2.2.2.3), the cells were
transferred to 15ml centrifuge tubes 24h post-transfection. The cells were centrifuged
(1000g, 4min) and the supernatant was removed. The cells were resuspended in 1ml
HBSS and divided into triplicate samples in a 96 well U-bottom plate, which was
centrifuged (1000g, 4min), and the supernatant removed. Cells were resuspended in
100μl of HBSS and transferred to bullet tubes containing 200μl HBSS. Next, 60μl of 6X
loading solution was added to each bullet tube and mixed well. The cells were incubated
for 1h at RT (protected from light) and promoter activity determined by flow cytometry
(Section 6.2.2.3.4). For analysis by confocal microscopy, 50μl of the washed and
substrate loaded THP-1 cells were loaded into a well of a 96 well optically clear black
wall plate. The plate was centrifuged (1000g, 4min at RT) to ensure cells were located
at the bottom of the wells and cells were visualised by confocal microscopy (Section
6.2.2.3.2).
6.2.2.3 Analyses of Human Cell Lines Transfected with SLC11A1
Promoter Constructs
6.2.2.3.1 Fluorescence/Light Microscopy Analysis of Human Cell Lines
Transfected with the SLC11A1 Promoter Constructs
Analysis of SLC11A1 promoter constructs transfected into human cell lines was
completed using the Olympus BX-51 microscope using the X20 and X40 air objectives
and the X60 and X100 oil immersion objective. For fluorescence analysis, excitation
was completed using a mercury burner (Olympus U-RFL-T) with a peak at 404.7nm
and WIB (bandpass 460-490 – blue) and WIG (bandpass 520-550 – green) emission
filter cubes.
6.2.2.3.2 Confocal Microscopy Analysis of Human Cell Lines Transfected
with the SLC11A1 Promoter Constructs
Confocal microscopy was conducted to assess the promoter activity of the SLC11A1
promoter constructs after transfection into 293T (Section 6.2.2.2.1) and THP-1 (Section
6.2.2.2.2 and 6.2.2.2.3) cells, using a X40 air objective. Fluorescence analysis was
198
carried out with excitation at 405nm (UV) and two channels were used to detect the
fluorescence emission, a blue filter cube (425-475nm, with the laser power set low and
the gain adjusted to a medium level), and a green filter cube (500-550nm, with no laser
power and the gain set at a medium level). The laser power and gain adjustments were
varied for each experiment and the settings were determined by analysis of the
untransfected cells. The green channel gain was set to ensure that the level of green
fluorescence was below the level of saturation. The blue channel gain value was set so
that no blue fluorescence was observable. Cells transfected with the negative and
positive control plasmids (Section 5.3.2.5) and the SLC11A1 promoter plasmids
(Section 5.3.2.4) were then assessed for green and blue fluorescence levels (i.e.
promoter activity). Cells were imaged in the Z-series and maximum intensity profile
images of the Z-series were produced in NIS-Elements (Nikon).
6.2.2.3.3 Fluorescence Plate Reader Analysis of Human Cell Lines
Transfected with the SLC11A1 Promoter Constructs
Fluorescence detection of promoter activity of transfected cells (in 96 well plates) was
completed 60min after loading cells with the CCF2-AM substrate (Section 6.2.2.2.4).
Fluorescence detection was carried out using the bottom-read Synergy HT plate reader
(BioTek, Vermont, USA). The plate was analysed with 10 sample reads per well with
an excitation filter of 400/30nm and detection was completed using 460/40 (blue
fluorescence) and 528/20 (green fluorescence) emission filters, with sensitivities of 80
and 75, respectively.
Raw fluorescence intensity data was exported into Microsoft Excel and background
fluorescence was subtracted, based on the mean value of the control wells which did not
contain any cells, for both blue and green fluorescence data. The ratio of blue to green
fluorescence was then determined for each well and the mean of the replicate samples
represented the level of promoter activity for each SLC11A1 promoter region. Graphs of
promoter activity were generated by transferring the data from replicate samples into
Graphpad Prism 5. The promoter activity of cells transfected with SLC11A1 promoter
constructs reported represents the trend from a minimum of three independent
experiments. The level of promoter activity was assessed between each of the promoter
constructs based on the fold change in fluorescence intensity between different
constructs.
199
6.2.2.3.4 Flow Cytometric Analysis of Human Cell Lines Transfected with
the SLC11A1 Promoter Constructs
Fluorescence detection of promoter constructs transfected into 293T (Section 6.2.2.2.1)
and THP-1 (Section 6.2.2.2.2 and 6.2.2.2.3) cells was carried out using the BD LSR II
flow cytometer with FACSDiva software (BD Biosciences). The cells were analysed
with the following channels (and voltages): forward (326) and side (263) scatter and the
fluorescence channels 530/30 (244) and 450/50 (262 and 230 for 293T and THP-1 cells,
respectively). Generally, 3-5×10⁴ events were acquired. Data was exported as FCS files
from the FACSDiva software and imported into CellQuest (BD Biosciences) for
analysis. From the forward and side scatter histogram, a gate (R1) was placed around
the cell population of interest and events within R1 were further analysed according to
fluorescence intensity.
For the analysis of the 293T cells transfected with promoter constructs, the cells in gate
R1 were assessed through a dot plot of green (530/30) versus blue (450/50)
fluorescence. A second gate (R2) was placed around the β-lactamase expressing cell
population (the gate location was determined by analysis of CCF2-AM loaded
untransfected cells and negative control emp-bla(M) plasmid transfected cells). Mean
fluorescence intensity of cells within gate R2 was then determined (Figure 6.11).
For the analysis of THP-1 cells transfected with promoter constructs, the cells selected
in gate R1 were displayed as a dot plot of green fluorescence (on x-axis) versus forward
scatter. A second gate, R2, was placed around the high green fluorescing cell
population, which represented the viable cell population. A dot plot of green versus blue
fluorescence was then created for cells located in gate R2. The mean fluorescence
intensity was determined for each sample by placing a gate, R3, around the transfected
β-lactamase expressing cells using a similar method to that used to analyse 293T cells
(Figure 6.13).
Raw mean fluorescence intensity data was imported into Microsoft Excel and the mean
fluorescence intensity of untransfected cells was subtracted from the replicate raw data
samples. The adjusted mean fluorescence intensities were tabulated using Graphpad
Prism 5 to allow graphical representation of the data. The promoter activity of each of
the SLC11A1 promoter construct presented is representative of a minimum of three
200
independent experiments. The level of promoter activity was assessed between each of
the promoter constructs based on the fold change in fluorescence intensity between
different constructs. All flow cytometric dot plots shown were prepared by importing
the FCS files into the software program FlowJo Flow Cytometry Analysis software
(FlowJo, USA) where the gating parameters were replicated.
6.2.2.4 Staining Techniques for the Characterisation of the THP-1 Cell
Line
SLC11A1 displays restricted expression to monocytes/macrophages (and other
phagocytic cells, Section 1.1.3) and expression levels increase upon differentiation and
stimulation. Characterisation of the THP-1 cell line was undertaken to determine if the
cell line was representative of monocyte/macrophages, thereby providing a good model
in which to study SLC11A1 expression. The THP-1 cell line was assessed through the
use of morphological and cytochemical stains. Furthermore, quantitative reverse
transcriptase real-time PCR (Section 6.2.2.5) was carried out to ensure that SLC11A1
was expressed in THP-1 cells.
6.2.2.4.1 Morphological Assessment of THP-1 Cells
Slides were prepared for May-Grunwald Giemsa staining by spreading approximately
0.6×10⁶ THP-1 cells (in RPMI medium) across a glass slide and allowing cells to air
dry. Slides were then fixed in methanol for 10min and placed in May-Grunwald stain
for 5min. Slides were then transferred to Giemsa stain for 10min, rinsed in buffered
water, and then the slides were placed in buffered water for 5min. Stained slides were
allowed to air dry and mounted using a coverslip and DPX. Cells were analysed using
the Olympus BX-51 microscope (Section 6.2.2.4.7).
6.2.2.4.2 Slide Preparation for Cytochemical Analyses
THP-1 cells (5×10⁴ cells) were cytospun (Hettich Universal 32 centrifuge) onto glass
slides (1250rpm, 4min) and slides were then air dried and fixed. Positive control slides,
kindly donated by Gillian Rozenburg (Prince of Wales Hospitial, Australia), were
stained in parallel with the THP-1 cells.
201
6.2.2.4.3 Periodic Acid-Schiff Staining
The periodic acid-schiff (PAS) stain tests for the presence of glycogen. A magenta
colour denotes a positive result due to the Schiff stain combining with stable aldehyde
groups (Figure 6.8A). Air dried cytospin slides (Section 6.2.2.4.2) were fixed in formal
methanol (5ml 37% formaldehyde mixed with 45ml 100% methanol) for 15s and then
rinsed with water for 10s and allowed to air dry. Slides were stained in periodic acid for
10min, rinsed in water and placed in Schiff’s reagent for 30min. Slides were then rinsed
in water for 5min and counterstained with Harris haematoxylin for 2min and rinsed
again in water for 1min. Once air dried, slides were mounted using a coverslip and
DPX. Cells were analysed using the Olympus BX-51 microscope (Section 6.2.2.4.7).
Granulocytes at all stages of development stain positive (AML+), while 10-40% of
lymphocytes show granular positivity on a negative background (ALL-). Monocytes
and their precursors show variable diffuse positivity with superimposed fine granules
(Hanly, 2001, Matutes et al., 2006).
6.2.2.4.4 Sudan Black B Staining of THP-1 Cells
Sudan black B (SBB) is a lipophilic stain that binds irreversibly to an unknown granule
component in granulocytes. A positive result is denoted by a black granular pattern in
the cytoplasm (Figure 6.8B). Prepared THP-1 cells (Section 6.2.2.4.2) were fixed in
concentrated formalin (formalin vapour) for 10min. To complete this, Whatman filter
paper (size 14) was placed at the base of a perspex staining dish and a few drops of 37%
formaldehyde were placed on the filter paper (until completely damp), which was
allowed to stand for 10min with the lid on to produce the vapour. Slides were then
placed into the staining dish supported on applicator sticks placed above the formalin
soaked filter paper and allowed to stand for 10min. The fixed films were placed into the
Sudan black B staining solution for 60min, washed in 70% (v/v) ethanol for 2min, and
then rinsed briefly in water. Slides were counterstained in haematoxylin for 10min,
washed in running water for 5min and allowed to air dry before cells were mounted
with a coverslip and DPX. Cells were analysed using the Olympus BX-51 microscope
(Section 6.2.2.4.7). Developing and mature granulocytes show a strong positive result
(AML+), while lymphocytes and lymphoblasts are negative (ALL-), and
monocytes/monoblasts show a negative result (Hanly, 2001, Matutes et al., 2006).
202
6.2.2.4.5 Myeloperoxidase Staining of THP-1 Cells
Myeloperoxidase is located in the primary and secondary granules of granulocytes and
their precursors. A positive result is denoted by the presence of a blue granular pattern
in the cytoplasm (Figure 6.8C). Air dried cytospin slides (Section 6.2.2.4.2) were fixed
in formal ethanol (5ml 37% formaldehyde mixed with 45ml 100% ethanol) for 1min
and washed in running tap water for 20s and allowed to air dry. Washed fixed slides
were placed into the peroxidase stain for 30s, washed in water for 30s, and then allowed
to air dry before being mounted with DPX and a coverslip. Cells were analysed using
the Olympus BX-51 microscope (Section 6.2.2.4.7). Developing and mature
granulocytes are strongly positive (AML+) while lymphoblasts and lymphocytes are
negative (ALL-). Monoloblasts are negative while monocytes stain positive or negative.
The myeloperoxidase stain reflects results obtained from the SBB stain (Hanly, 2001,
Matutes et al., 2006).
6.2.2.4.6 Combined α-Naphthyl butyrate and AS-D Chloroacetate esterase
Staining of THP-1 Cells
The combined α-naphthyl butyrate and AS-D chloroacetate esterase stain allows the
differentiation of myeloid and monocytic cells on a single slide. It is commonly used to
detect acute myelomonocytic leukaemia (AMML), which displays a dual phenotype
(both granulocytic and monocytic). The combined stain is therefore a good way to
differentiate between acute leukaemias of myeloid or monocytic origin or a mixture of
the two (AMML). This stain was kindly completed by Prince of Wales Hospital
Haematology Department. Fresh slides (Section 6.2.2.4.2) were fixed in formalin
vapour for 4min and then incubated in α-NBE working solution for 45min. Slides were
rinsed with distilled water and then placed into the chloroacetate esterase working
solution for 10min. The slides were rinsed with distilled water, counterstained with
Harris haematoxylin for 5min, and then rinsed in water for 10min. Once air dried, slides
were mounted using a coverslip and DPX. Cells were analysed using the Olympus BX51 microscope (Section 6.2.2.4.7). Myeloid cells stain a dark-blue colour while
monocytic cells stain a red-brown colour (megakaryocytes and platelets also stain a redbrown colour) (Hanly, 2001, Matutes et al., 2006).
203
6.2.2.4.7 Analysis of THP-1 Cell Morphology and Cytochemistry by Light
Microscopy
Stained cells (Sections 6.2.2.4.1 and 6.2.2.4.3-6) were examined and images were
captured on an Olympus BX-51 microscope. Positive control slides were first analysed
to ensure the stains had worked correctly prior to analysing the stained THP-1 cells.
Unless otherwise stated, images of stained THP-1 cells were obtained using the X60 oil
objective.
6.2.2.5 Techniques for Quantiation of SLC11A1 Expression
6.2.2.5.1 RNA extraction
Quantitative reverse transcriptase real-time PCR was completed to verify that THP-1
cells expressed SLC11A1. THP-1 cells (untreated, PMA differentiated or IFN-γ and LPS
stimulated [Section 6.2.2.1.9]) were removed from the tissue culture flask (3×10⁶ cells),
centrifuged, the supernatant removed, and the cell pellet was stored at -80oC until RNA
was extracted. Prior to RNA extraction, all surfaces and pipettes were treated with
RNase AWAY to deactivate any contaminating RNases. RNA was extracted using the
RNeasy Plus Mini Kit, following the manufacturer’s protocol. Homogenisation of the
cell lysate was completed by passing the lysate through a 20 gauge needle five times.
The purified RNA was eluted from the spin column in 50μl of supplied RNase free
water. The concentration of the extracted RNA was quantified using the NanoDrop
(Section 2.2.2.7), and cDNA was synthesised immediately after extraction (Section
6.2.2.5.2).
6.2.2.5.2 Synthesis of cDNA
Synthesis of cDNA was carried out using the SuperScript III First-Strand Synthesis
Supermix, following the manufacturer’s protocol. Firstly, 5μg of isolated RNA (Section
6.2.2.5.1) was added to 50μM oligo(dT) and annealing buffer in a final volume of 8μl.
Samples were incubated at 65oC for 5min, placed on ice for 1min, and 1X First Strand
Reaction Mix and Superscript III were added. The reactions were mixed well and
incubated for 50min at 50oC followed by an incubation at 85oC for 5min to terminate
the reaction. The synthesised cDNA was stored at -20oC until used for quantitative realtime PCR (Section 6.2.2.5.3).
204
6.2.2.5.3 PCR 6 – Quantitation of SLC11A1 Expression by Real-time PCR
Quantitative real-time PCR was carried out to quantitate SLC11A1 expression (target
gene) relative to the reference gene, RPL36AL (ribosomal protein L36a-like), using the
SYBR GreenER qPCR SuperMix Universal. The PCR was carried out in a 25μl reaction
volume, which contained 1X SYBR GreenER qPCR SuperMix Universal, 6.0μM
forward and reverse primer concentrations and 50ng cDNA template (Section 6.2.2.5.2).
Four replicate reactions were completed for each sample. Real-time PCR was conducted
on the Mastercycler ep realplex2 instrument (Eppendorf). The PCR was initiated by an
UDG incubation (50oC for 2min), followed by an initial denaturation (95oC, 5min) and
40 cycles of denaturation (95oC for 30s), annealing (61oC for 30s), and extension (72oC
for 30s). Amplification was followed by a dissociation step consisting of a denaturation
step at 95oC for 15s and then 60oC for 15s, followed by fluorescence acquisition as the
samples were heated to 95oC for 10min. Real-time PCR amplification was assessed
using quantification plots and melting curves.
Differences in expression were calculated by first determining the mean Ct value of the
four replicates of each sample for the target and reference gene. The ΔCt (difference
between the Ct values of the target and reference gene) was determined by subtracting
the mean Ct value of the target gene from the mean Ct value of the reference gene for
both mean Ct values of untreated and treated samples (equation 1 and 2, respectively).
The difference in expression was then determined using the equation 2-ΔΔCt, where ΔΔCt
equals ΔCt(treated) minus the ΔCt(untreated) (equation 3).
ΔCt(untreated)
=
Ct(target) – Ct(reference)
[1]
ΔCt(treated)
=
Ct(target) – Ct(reference)
[2]
ΔΔCt
=
ΔCt(treated) – ΔCt(untreated)
[3]
205
6.3 RESULTS
PART 3: Analysis of the SLC11A1 Promoter using Promoter
Assays.
6.3.1 Determination of the Promoter Activity of SLC11A1
Constructs Transfected into 293T Cells
6.3.1.1 Characterisation of the 293T Cell Line
The SLC11A1 promoter constructs were first tested in the non-monocytic cell line 293T
(Graham et al., 1977). Being of non-monocytic lineage, 293T cells do not express
SLC11A1. Therefore, the data gathered from the transfection of SLC11A1 promoter
constructs into 293T cells enabled the identification of promoter regions containing
non-monocytic specific factors which regulate SLC11A1 transcription. For example,
data from the 293T cell transfections may enable the determination of a minimal
promoter region, as the core components for the formation of the basal transcriptional
complex that mediates pol II transcription are located in all cells, or may identify
SLC11A1 promoter regions which could recruit general, ubiquitously expressed
transcription factors. Additionally, the results obtained from the transfection of the
promoter constructs into 293T cells could be compared to the transfection results
obtained from a monocytic cell line, where SLC11A1 exhibits restricted expression,
allowing the identification of SLC11A1 promoter regions containing elements for the
recruitment of monocyte specific regulators of transcription.
The 293T cell line was initially analysed by fluorescence microscopy (Section 6.2.2.3.1)
to assess the suitability for use with the Geneblazer technology. Promoter activity
generated from the expression constructs is based on cleavage of a green fluorescing
molecule to generate a blue fluorescing molecule (Figure 6.1). Therefore, to enable
sensitive determination of promoter activity, it was first established that the 293T cells
did not generate green or blue autofluorescence. No autofluorescence was observed
from untransfected 293T cells, thereby establishing that the 293T cells were suitable
candidates for use with the Geneblazer technology (Figure 6.2A).
206
Figure 6.2 Microscopic analysis of 293T cells. (A) Bright field microscopy of
untransfected 293T cells grown on glass coverslips. No blue or green autofluorescence
was observed when untransfected 293T cells were assessed by fluorescence microscopy
(X60 magnification). (B) Confocal microscopy analysis of 293T cells transfected with
the positive control, UBC-bla(M) (X40 magnification). After seeding 293T cells into
96-well plates (24h), 293T cells were transfected with the SLC11A1 promoter constructs
and controls using Lipofectamine 2000, and, 24h post transfection, the CCF2-AM
substrate was loaded into the transfected 293T cells. Cells were analysed for green (left
panel) and blue (centre panel) fluorescence (representing uncleaved and cleaved
substrate, respectively). The overlay (right panel) shows colocalisation of blue and
green fluorescence.
207
6.3.1.2 Transfection of SLC11A1 Promoter Constructs into 293T Cells
The SLC11A1 promoter constructs were transfected into the 293T cell line using
Lipofectamine 2000 (Section 6.2.2.2.1). Transfections of promoter constructs were
completed in replicates of four in 96-well plates, with the negative and positive control
plasmids (emp-bla(M) and UBC-bla(M), respectively) included in all transfection
experiments. After substrate loading (Section 6.2.2.2.4), detection of green and blue
fluorescence levels of transfected 293T cells was performed using a fluorescence plate
reader (Section 6.2.2.3.3).
Analysis of transfected 293T cells by confocal microscopy showed that the procedure
did not induce morphological changes and the transfected cells showed a homogenous
distribution of green and blue fluorescence (Figure 6.2B) (Section 6.2.2.3.2). The posttransfection cell viability remained high (between 95 and 100%) (Section 6.2.2.1.6) and
the transfection efficiency was also high, with 60-75% of cells fluorescing blue (Figure
6.2B). The positive control, UBC-bla(M) plasmid, exhibited the highest fluorescence
ratio (i.e. the highest promoter activity), while the negative control plasmid emp-bla(M)
(Section 5.3.2.5) resulted in low promoter activity, with a similar level of green
fluorescence compared to other SLC11A1 promoter plasmids, but low blue fluorescence.
Variable promoter activities were observed after 293T cells were transfected with
constructs containing different segments of the SLC11A1 promoter (Figure 6.3).
6.3.1.2.1 Determination of Important Promoter Regions Driving SLC11A1
Transcription in 293T Cells
The SLC11A1 constructs containing different lengths of the SLC11A1 promoter, all
harbouring the variant allele 3 [(GT)n allele 3 with -237 C] in the forward orientation
(Section 5.3.2.2), were first transfected into 293T cells (Figure 6.3). Transfection of the
293T cells with SLC11A1 promoter plasmids showed that promoter region 7C (-532 to
+49) consistently resulted in the highest promoter activity, while promoter regions 1A (2900 to +367) and 8C (-362 to +49) resulted in the lowest promoter activity.
The smallest SLC11A1 promoter regions, 9C (-231 to +49) and 10C (-99 to +49),
resulted in a high level of promoter activity, just below that observed for SLC11A1
promoter region 7C (which exhibited the highest promoter activity). This suggests that
-362
-532
22.56
2
-231 -197
18.80
3
3
18.80
2
22.56
3
18.80
2
22.56
3
18.80
2
22.56
3
18.80
2
22.56
3
18.80
2
22.56
9 D
-99
10
+1
1
6
1
6
6
6
38.08 15.67TATA
1
38.08 15.67TATA
1
38.08 15.67TATA
+1
+1
+1
+1
Inr
Inr
Inr
+49
5
15.75
Inr
Inr
6
1
+1
38.08 15.67TATA
38.08 15.67TATA
+1
5
15.75
Inr
6
38.08 15.67TATA
1
5
15.75
Inr
6
1
38.08 15.67TATA
C
4
9C
8D
8C
8A
7C
7A
1A
10C
+367
16.91
4
16.91
4
16.91
A
0
Fluorescence Ratio
0.2 0.4 0.6 0.8
1.0
Figure 6.3 Promoter activity of SLC11A1 constructs, containing different lengths of the SLC11A1 promoter, after transfection into 293T cells.
293T cells were transiently transfected with the promoter constructs, with all plasmids containing variant allele 3 [(GT)n allele 3 with -237 C] in
the forward orientation. Cells were loaded with the CCF2-AM substrate 24h post-transfection and fluorescence intensity measured using a
fluorescent plate reader. The promoter activities of the different promoter constructs (right) are shown adjacent to the respective SLC11A1
promoter regions cloned into the pGeneBLAzer plasmid (left).
8
7
SLC11A1 Promoter Regions
208
208
209
the minimal promoter region, and the site of the formation of the basal transcriptional
complex, is located within the 10C promoter region (-99 to +49) (Figure 6.3). This is
consistent with the results obtained from the bioinformatic analyses (Sections 5.3.1.2
and 5.3.1.3).
The bioinformatic analyses also identified elements within the 5’UTR, and extending
into the first intron, which could function as core promoter elements. Core elements are
essential in the formation of the basal transcriptional complex, and their removal results
in a loss of gene expression. However, SLC11A1 promoter activity was not lost in any
of the plasmids containing promoter regions, which lacked the 5’UTR and first intron
(plasmids 7C, 8C, 8D, 9C and 10C) (region +49 to +367). This finding suggests that
SLC11A1 expression is not modulated by a core promoter element downstream of the
transcription start site. However, while no core promoter elements were identified, the
decrease in the level of promoter activity driven by promoter regions 8A to 8C suggests
that the region +49 to +367 may contain an element for transcription factor binding,
which enhances transcription (Sections 5.3.1.2 and 5.3.1.3).
The promoter region 8C resulted in a low level of promoter activity, however, the 7C
promoter region drove the highest promoter activity, with a four to five fold increase in
expression over that observed in the presence of promoter region 8C. Therefore, another
element for the binding of a transcription factor may be located within the -532 to -362
region. Likewise, the 3 fold decrease in promoter activity observed in the presence of
promoter region 8C, as compared to that driven by the smaller 9C region, suggests that
the -362 to -231 region contains an element for the recruitment of a transcription factor
which negatively regulates SLC11A1 expression.
6.3.1.2.2 Assessment of the Ability of the SLC11A1 Promoter to Mediate
Bidirectional Transcription
Promoter constructs with inserts cloned in the forward and reverse orientation (all
containing variant allele 3), were transfected into 293T cells to assess the ability of the
SLC11A1 promoter to mediate bidirectional transcription (Figure 6.4). The majority of
inserts cloned in the reverse orientation showed no promoter activity, with the exception
of promoter regions 8A and 8D. While the promoter region 8A (-326 to +367) showed
similar promoter activity in the forward and reverse orientation, bidirectionality of the
210
SLC11A1 promoter likely does not occur in vivo, as the largest promoter regions (7A
and 7C) did not exhibit bidirectional promoter activity (Figure 6.4). This suggests that
the SLC11A1 promoter contains or recruits factors, which co-ordinate regulated
expression in the forward orientation.
Figure 6.4 Assessment of the ability of the SLC11A1 promoter region to mediate
bidirectional transcription in non-monocytic (293T) cells. The black and white bars
represent SLC11A1 promoter regions cloned into the pGeneBLAzer vector in the
forward (F) and reverse (R) orientation, respectively.
The SLC11A1 promoter region 8D (-326 to -231) resulted in a comparable fluorescence
ratio in both the forward and reverse orientation. This plasmid contained only the (GT)n
microsatellite repeat (with a minimal amount of sequence either side) and lacks the
region 9C/10C where the formation of the basal transcriptional machinery occurs
(Figure 6.3). The promoter activity of the 8D plasmid in the forward and reverse
orientation is likely attributable to the intrinsic ability of the alternating
purine/prymidine sequence to enhance transcription due to the formation of Z-DNA,
thereby confirming previous reports that the microsatellite repeat has endogenous
enhancer ability (Searle and Blackwell, 1999).
211
6.3.1.2.3 The Promoter Variants Allele 2 and Allele T Drive Higher
Promoter Activity Compared to the Allele 3 Variant in 293T Cells
The effect of variants at the (GT)n and -237C/T polymorphisms on SLC11A1 promoter
activity was assessed. The different SLC11A1 promoter lengths, containing the allelic
variants, allele 2, allele 3 and allele T (or allele C and allele T for promoter region 9C)
(Sections 5.3.2.2, 5.3.2.4), were transfected into 293T cells (Section 6.2.2.2.1) to
elucidate the mechanism(s) by which promoter variants modulate differential SLC11A1
expression (Figure 6.5).
Interestingly, (GT)n allele 2 drove a 1.3 to 6 fold higher level of SLC11A1 promoter
activity as compared to (GT)n allele 3, in all SLC11A1 promoter regions tested (Figure
6.5). This finding is in contrast with previous studies, which have shown that (GT)n
allele 3 drives a higher level of SLC11A1 expression as compared to (GT)n allele 2 in
monocytic cell lines (Searle and Blackwell, 1999, Zaahl et al., 2004). This finding also
challenges the current hypothesis explaining the association of the different (GT)n
alleles with the incidence of disease (Section 1.3), namely, that increased SLC11A1
expression, driven by allele 3, confers resistance and susceptibility to infectious and
autoimmune disease, respectively, due to the generation of a heightened Th1 mediated
immune response. However, the current finding that (GT)n allele 2 exhibits a greater
promoter activity than (GT)n allele 3, in non-monocytic 293T cells, is consistent with
the findings of the Z-Hunt analysis (Section 5.3.1.5.1, Figure 5.12), which identified
that (GT)n allele 2 had a greater propensity to form Z-DNA and accordingly would exert
greater transcriptional enhancement of SLC11A1 as compared to allele 3.
The presence of the -237 T variant resulted in a 1.3 to 5 fold higher level of promoter
activity as compared to that observed for the more common -237 C variant in all
SLC11A1 promoter regions tested (Figure 6.5). This trend was also observed for the 9C
promoter region (-231 to +49) (Figure 6.3), which lacked the (GT)n microsatellite
repeat, suggesting that this polymorphism may alter SLC11A1 expression independently
of the (GT)n microsatellite repeat. The higher promoter activity driven by the -237 T
variant, as compared to the -237 C variant, is in contrast to a previous transfection
study, carried out in monocytic cell lines, which showed that the C variant drove
enhanced SLC11A1 expression compared to the T variant (Zaahl et al., 2004).
212
Figure 6.5 Effect of the SLC11A1 plasmid variants, allele 2, allele 3 and allele T, on
SLC11A1 promoter activity in 293T cells. Multiple plasmids of the same SLC11A1
promoter region, differing only by the promoter variant present, either allele 2 [(GT)n
allele 2 with -237 C], allele 3 [(GT)n allele 3 with -237 C] or allele T [(GT)n allele 3
with -237 T] (Section 5.3.2.2.2), were transfected into 293T cells. Promoter region 9C
contained only the -237C/T polymorphism, therefore, had two variants, allele C and
allele T.
Previously published transfection experiments, determining the promoter activity
mediated by variants within the SLC11A1 promoter, have been completed in monocytic
cell lines where SLC11A1 has restricted expression. The results presented are based on
expression of promoter constructs in non-monocytic cells, which do not express
SLC11A1. Therefore, there may be other factors, such as the presence of transcription
factors, Z-DNA binding proteins or DNA topology changes, that are specific to
monocytic cells, which may account for the differences in expression patterns observed.
213
6.3.2 Determination of the Promoter Activity of SLC11A1
Constructs Transfected into THP-1 Cells
6.3.2.1 Selection of a Monocytic Cell Line with SLC11A1 Expression
SLC11A1 has restricted expression to phagocytic cells, notably monocytes and
macrophages (Section 1.1.3). To elucidate the monocyte-specific factors which
influence SLC11A1 expression, a cell line that exhibited the phenotypic characteristics
of monocytes/macrophages and also expressed SLC11A1 was required. Previous
publications assessing SLC11A1 expression have utilised THP-1, U937 and HL-60 cell
lines (Richer et al., 2008, Roig et al., 2002, Searle and Blackwell, 1999, Zaahl et al.,
2004), with the THP-1 and U937 cell lines exhibiting SLC11A1 expression in the
absence of differentiation/stimulation. Therefore, the THP-1 and U937 cells were
assessed for their suitability for use with the in vivo detection of SLC11A1 promoter
activity using the Geneblazer technology.
As the expression of SLC11A1 differs according to the stage of monocyte/macrophage
development (Figure 1.3), different transcription factors are likely involved in
modulating SLC11A1 expression. Therefore, a cell line which could be induced to
differentiate from a monocyte-like cell to a macrophage-like cell would be ideal to test
the prepared SLC11A1 promoter constructs. Accordingly, THP-1 and U937 cells were
analysed with or without PMA, resulting in differentiated (i.e. macrophage-like) and
undifferentiated (i.e. monocyte-like) cells, respectively (Section 6.2.2.1.9) (Auwerx,
1991, Tsuchiya et al., 1982). After PMA induced differentiation, THP-1 cells became
adherent as single cells within 24h, with no observable green or blue auto-fluorescence
in either undifferentiated or differentiated THP-1 cells (Figure 6.6A). When U937 cells
were PMA differentiated, the cells adhered as large masses of cells, with evidence of
continued cell division (which is not a feature of monocyte differentiation to
macrophages) (Figure 6.6B). Additionally, a low level of green auto-fluorescence and a
high level of blue auto-fluorescence were observed (Figure 6.6B). Therefore, the
monocytic-like THP-1 cells, which lacked auto-fluorescence and exhibited monocyte to
macrophage differentiation, were the most suitable candidate to assess promoter activity
of the SLC11A1 promoter constructs using the Geneblazer technology.
214
Figure 6.6 Analysis of THP-1 and U937 cell lines for suitability for use with the
Geneblazer technology. (A) Undifferentiated (left panel) and PMA differentiated (right
panel) THP-1 cells (X40 magnification). (B) Undifferentiated (middle left panel) and
PMA differentiated U937 cells (middle right panel) and the green (bottom left panel)
and blue (bottom right panel) auto-fluorescence of differentiated U937 cells (X40
magnification).
215
6.3.2.2 Characterisation of the THP-1 Cell Line
THP-1 cells were established in the 1980s from a patient with acute monocytic
leukaemia (Tsuchiya et al., 1980). THP-1 cells are non-adherent and analysis of the
cellular morphology by electron microscopy and cytochemical stains suggests that the
cells have a monocyte-like phenotype (Tsuchiya et al., 1980). The THP-1 cell line was
characterised to validate that the cells possessed a monocytic-like phenotype (and not
another leukaemic cell type) and possessed SLC11A1 expression, by morphological/
cytochemical analyses and reverse transcriptase real-time PCR, respectively.
6.3.2.2.1 Morphological/Cytochemical Characterisation of THP-1 Cells
Morphological analysis of THP-1 cells by May-Grunwald Giemsa staining (Section
6.2.2.4.1) found that the cells were predominantly round with cell diameters ranging
between 12 and 18μm (Figure 6.7). The cytoplasm was slightly basophilic with
intracellular vacuoles and nuclei staining lightly and being round in appearance, with
most having an an indent. The morphological appearance after May-Grunwald Giemsa
staining was consistent with the findings of Tsuchiya et al. (1980), suggesting that the
cells resembled a monocytic leukaemia.
Cytochemistry was further used to validate that the THP-1 cell line represented a
monocytic leukaemia and did not contain features of other haemopoietic malignancies.
Consistent with the findings of Tsuchiya et al. (1980), the cytochemical analysis
determined that the THP-1 cells were PAS negative (Figure 6.8A) (Section 6.2.2.4.3),
Figure 6.7 Analysis of THP-1 cell morphology by May-Grunwald Geimsa staining (left
panel X20 magnification, right panel X60 magnification).
216
A
B
C
Figure 6.8 Cytochemical analyses of THP-1 cells. The THP-1 cells are shown in the
right panels and the respective positive controls in the left panels. (A) Periodic acidschiff stain (left panel: normal peripherial blood showing two neutrophils with intense
positive magenta staining). Inset in the right panel is a higher magnification image of a
THP-1 cell displaying the positive fine granules (Section 6.2.2.4.3). (B) Sudan Black B
stain (left panel: acute myeloid leukaemia with granulocytic cells showing positive
black granular pattern in the cytoplasm). (C) Myleoperoxidase stain (left panel: acute
myeloid leukameia showing myeloblasts/myelocytes containing the expected blue
granular pattern in the cytoplasm).
217
SBB negative (Figure 6.8B) (Section 6.2.2.4.4) and myeloperoxidase negative (Figure
6.8C) (Section 6.2.2.4.5). The combined α-Naphthyl butyrate and AS-D chloroacetate
esterase staining of THP-1 cells (Section 6.2.2.4.6) resulted in the production of an
intense red/brown colour within the cytoplasm with no blue colouration produced,
validating that the cells were of monocytic origin and not myeloid or biphenotypic
AMML (mixed myeloid/monocytic phenotype) (Figure 6.9) (Matutes et al., 2006).
Verfication of the THP-1 cell line suggests, based on morphological and cytochemical
features, that the cells were of monocytic origin and do not contain features
characteristic of other leukaemias. This observation is consistent with a previously
reported characterisation of THP-1 cells (Tsuchiya et al., 1980).
Figure 6.9 Combined α-naphthyl butyrate and AS-D chloroacetate esterase stain. The
left hand panel is the positive control of bone marrow (X40 magnification) showing
positive results for the combined esterase stain with the majority of cells containing
dark blue granules indicating a myeloid origin and few cells staining a red/brown colour
indicating a monocyte/megakaryocyte origin. A higher magnification image of a
megakaryocyte shows the red/brown colouration observed (centre). The THP-1 cells
(right hand side) contain red/brown colouration in the cytoplasm.
218
6.3.2.2.2 Quantitation of SLC11A1 Expression in THP-1 Cells
A model monocyte/macrophage cell line for the analysis of promoter regions driving
SLC11A1 expression should exhibit similar kinetics as observed in primary monocytes
and macrophages in the level of SLC11A1 expression when differentiated or stimulated.
Therefore, quantitative real-time RT-PCR was carried out to determine the level of
expression of SLC11A1 in THP-1 cells after differentiation and stimulation. THP-1 cells
were either treated with PMA (5ng/ml or 100ng/ml) for 48h to stimulate differentiation
into macrophage-like cells or stimulated with IFN-γ and LPS (either individually or in
combination) for 6h (Section 6.2.2.1.9). RNA was extracted from the cells (Section
6.2.2.5.1), cDNA synthesised (Section 6.2.2.5.2) and quantitative real-time RT-PCR
was used to determine the level of SLC11A1 expression (Section 6.2.2.5.3).
Analysis of the untreated cells verified that THP-1 cells expressed SLC11A1. When
THP-1 cells were differentiated with PMA (5ng/ml or 100ng/ml), SLC11A1 expression
increased 24 and 29 fold, respectively, as compared to undifferentiated cells. This
increase in SLC11A1 expression suggested that the pattern of expression is similar to
that seen during the differentiation of primary monocytes to macrophages (Figure 1.3).
Furthermore, stimulation of the cells with LPS, IFN-γ, and LPS + IFN-γ resulted in an
increase in SLC11A1 expression (2.7, 5.7 and 1.3 fold increase, respectively). The
increase in SLC11A1 expression following differentiation or stimulation suggests that
the THP-1 cell line exhibited the changes in SLC11A1 expression observed in vivo,
indicating that THP-1 cells represented an appropriate model to elucidate the
mechanisms that modulate SLC11A1 transcription.
219
6.3.2.3 Optimisation of THP-1 Cell Transfection with the SLC11A1
Promoter Constructs
6.3.2.3.1 Detection of SLC11A1 Promoter Activity using a Fluorescence
Plate Reader
Initially, transfection of the THP-1 cell line to determine promoter activity of the
SLC11A1 promoter constructs was completed using a similar methodology to that used
for the 293T cells. However, Lipofectamine LTX transfection of THP-1 cells (Section
6.2.2.2.2), followed by CCF2-AM substrate loading (Section 6.2.2.2.4), and subsequent
detection using a fluorescence plate reader (Section 6.2.2.3.3) failed to identify any
differences in promoter activity between the different SLC11A1 promoter constructs,
including expected differences between the positive and negative control plasmids,
UBC-bla(M) and emp-bla(M), respectively.
Trypan blue exclusion staining (Section 6.2.2.1.6) of THP-1 cells throughout the
transfection protocol showed that 97% of cells were viable prior to transfection,
however, 24h post Lipofectamine LTX transfection, cell viability was significantly
decreased to 40-50%. The low cell viability was also evident when the transfected THP1 cells were analysed by confocal microscopy (Section 6.2.2.3.2), which identified two
cell populations, according to the intensity of green fluorescence (Figure 6.10); a high
and a low fluorescing population, representing viable and non-viable (non-viable cells
can not retain the CCF2-AM substrate and therefore exhibit low green fluorescence) cell
populations, respectively.
Additionally, confocal microscopy analysis of transfected THP-1 cells showed that
transfection efficiency was low. Of the viable cells (high green fluorescence), only 12% of cells transfected with the positive control plasmid [UBC-bla(M)] showed blue
fluorescence greater than that observed for the negative control plasmid [emp-bla(M)]
(Figure 6.10), indicating that only 1-2% of viable cells were transfected. Therefore, the
inability to detect differences between the Lipofectamine LTX transfected promoter
constructs was attributable to both low cell viability and transfection efficiency. The
difficulty of transfecting the THP-1 cells identified in this study corroborates previous
reports (Martinet et al., 2003, Schnoor et al., 2009).
220
The inability to detect differences in promoter activity between the SLC11A1 promoter
constructs was further compounded by the use of a plate reader for fluorescence
detection, as all cell populations (viable and non-viable) contributed to the overall
fluorescence detected. Therefore, a method to increase the cell viability and transfection
efficiency, as well as a method, capable of detecting only the transfected cell population
was required to determine the promoter activity driven by each of the SLC11A1
promoter constructs.
Figure 6.10 Lipofectamine LTX transfected THP-1 cells showing low cell viability and
low transfection efficiency. Cells were analysed by confocal microscopy (X40
magnification) after transfection and substrate loading. (A) THP-1 cells transfected with
the negative control emp-bla(M) plasmid. (B) THP-1 cells transfected with the positive
control UBC-bla(M) plasmid. Cells were analysed for green (left panel) and blue
(centre panel) fluorescence (representing uncleaved and cleaved substrate, respectively).
The overlay (right panel) shows colocalisation of both blue and green fluorescing cells.
221
6.3.2.3.2 Flow Cytometric Analysis Enabled the Selective Detection of
Transfected THP-1 Cells
Flow cytometry has been used to detect rare events in β-lactamase expressing stably
transfected Jurkat cells using the CCF2-AM substrate (Knapp et al., 2003). Due to the
ability to gate on specific cell populations of interest (i.e. only the viable transfected
cells in this case), flow cytometry offered a more specific and sensitive detection
method, as compared to fluorescence measurements conducted using a plate reader.
Confocal microscopy of Lipofectamine LTX transfected THP-1 cells found that the
non-viable cell population emitted low green fluorescence as compared to the viable
cells (Figure 6.10). Flow cytometry would enable the exclusion of the non-viable cell
population by gating specifically on the high green fluorescing (viable) cells.
Furthermore, viable, non-transfected cells would result in no, or very low blue
fluorescence as they lack the ability to cleave the substrate, and could also be excluded
from the analysis. This approach would enable the assessment of promoter activity
exclusively from the viable transfected cell population.
To test the flow cytometric method of detection and quantification of fluorescence
intensity, the SLC11A1 promoter constructs were first transfected into the 293T cells
and subsequently analysed by flow cytometry (Sections 6.2.2.2.1, 6.2.2.3.4). As the
promoter activity of the SLC11A1 promoter constructs had already been determined in
293T cells using the fluorescence plate reader (Section 6.3.1.2), fluorescence detection
by flow cytometry, allowed a direct comparison of promoter activity determined by the
two methods. Transfection of the SLC11A1 promoter constructs into 293T cells (Section
6.2.2.2.1) and detection by flow cytometry (Section 6.2.2.3.4) produced a similar trend
in promoter activity, driven by the different constructs, as observed using the plate
reader (Figure 6.11), thus validating the determination of promoter activity using flow
cytometry.
222
Figure 6.11 Validation of flow cytometric analyses to quantitate promoter activity
driven by the different SLC11A1 promoter constructs using 293T cells. (A) Gating
procedure used to detect promoter activity of negative control emp-bla(M) and (B)
positive control UBC-bla(M) plasmids. Gate R1 was first selected to exclude cellular
debris using the forward and side scatter plot (left panels). Promoter activity was
determined as the mean fluorescence intensity of a gate R2 from scatter plots of blue
and green fluorescence (Section 6.2.2.3.4). (C) Promoter activity of SLC11A1 promoter
constructs transfected into 293T cells with flow cytometry or (D) fluorescence plate
reader detection.
223
6.3.2.3.3 Nucleofection of THP-1 Cells Resulted in Increased Cell Viability
and Transfection Efficiency as Compared to Lipofectamine LTX
The use of Lipofectamine LTX to transfect THP-1 cells resulted in low transfection
efficiency and viability of the THP-1 cells post-transfection, thereby prohibiting
comparisons of promoter activity driven by the different SLC11A1 promoter constructs.
Consistent with previous findings (Section 6.3.2.3.1), flow cytometry analysis of
Lipofectamine LTX transfected THP-1 cells (Figure 6.12, left panel) showed that the
majority of the cells were non-viable (approximately 80%), and of the viable cell
population, only 1-2% were transfected. Nucleofection has previously been shown to
allow transfection of THP-1 cells with high efficiency while maintaining cell viability
(Martinet et al., 2003, Schnoor et al., 2009). The modified nucleofection protocol of
Schnoor et al. (2009), reported transfection efficiencies and cell viability of 55-56% and
62-81%, respectively.
Transfection of THP-1 cells using nucleofection (Section 6.2.2.2.3) with subsequent
flow cytometric analysis (Section 6.2.2.3.4) resulted in significantly higher cell viability
(approximately 70%) and transfection efficiency (30% of viable cells) as compared to
transfection using Lipofectamine LTX (Figure 6.12A). Consistent with this finding,
confocal microscopy analysis of THP-1 cells, transfected using nucleofection, also
showed a significant increase in the number of green and blue fluorescing cells,
indicating a high cell viability and transfection efficiency, respectively (Figure 6.12B).
Due to the lower post-transfection cell viability of THP-1 cells, the gating parameters
used to assess promoter activity (Figure 6.13) differed from those used for the analysis
of 293T cells (Figure 6.11).
224
Figure 6.12 Nucleofection of THP-1 cells increases cell viability and transfection
efficiency. (A) Comparison of THP-1 cells transfected with the positive control plasmid
[UBC-bla(M)] using either lipofectamine LTX (left panel) or Nucleofection (right
panel) (all captured events are shown). R1: non-viable THP-1 cells, R2: viable
untransfected cells, R3: viable transfected cells. (B) Confocal microscopy analysis of
THP-1 cells transfected by nucleofection with the positive control plasmid UBC-bla(M)
(X40 magnification). Cells were analysed for green (left panel) and blue (centre panel)
fluorescence (representing uncleaved and cleaved substrate, respectively). The overlay
(right panel) shows colocalisation of both blue and green fluorescing cells.
225
Figure 6.13 Gating protocol for determining promoter activity after nucleofection of
THP-1 cells with SLC11A1 promoter constructs. Gates were determined according to
scatter plots of untransfected cells (left panels), negative control [emp-bla(M)]
transfected THP-1 cells (middle panels), and the positive control [UBC-bla(M)]
transfected THP-1 cells (right panels). On the forward and side scatter plot (A), a gate
R1 was used to select only intact cells (removing cell debris). To remove the non-viable
cells, a gate R2 was used to select viable cells, which had high green fluorescence on a
forward versus green fluorescence scatter plot (B). Promoter activity was then
determined by the mean fluorescence intensity of gate R3, which was positioned after
analysis of untransfected cells and cells transfected with the negative control plasmid,
emp-bla(M), to gate specifically on the transfected cell population (C). The mean
fluorescence intensity of the viable untransfected cell population of the negative control
plasmid [emp-bla(M)] was used to correct for background fluorescence for each
SLC11A1 promoter construct.
226
6.3.2.4 Transfection of SLC11A1 Promoter Constructs into THP-1
Cells
Using the optimised THP-1 transfection method involving nucleofection (Section
6.2.2.2.3) and flow cytometric analysis (Section 6.2.2.3.4), SLC11A1 promoter
constructs were transfected into undifferentiated THP-1 cells (monocyte phenotype).
Overall, the level of SLC11A1 promoter activity driven by the different promoter
constructs was higher in THP-1 cells as compared to 293T cells, when comparisons
were made using the positive control plasmid [UBC-bla(M)]. The negative control
plasmid, emp-bla(M), resulted in a similar level of green fluorescence, compared to
other SLC11A1 promoter plasmids, however, there was no or low blue fluorescence.
Variable promoter activities were observed after nucleofection of the different SLC11A1
promoter constructs into THP-1 cells.
6.3.2.4.1 Determination of Important Promoter Regions Driving SLC11A1
Transcription in Monocyte-Like THP-1 Cells
The different SLC11A1 promoter lengths, containing only the variant allele 3 [(GT)n
allele 3 with -237 C] in the forward orientation (Section 5.3.2.2), were assessed for their
promoter activity in THP-1 cells. Similar to results obtained using 293T cells, promoter
region 7C (-532 to +49) had the highest promoter activity in the THP-1 cells (Figure
6.14). However, promoter region 8A (-362 to +367) had the lowest promoter activity
(Figure 6.14). In THP-1 cells, increasing promoter region size correlated with increasing
promoter activity. For example, the promoter activity of construct 7C was higher than
that of 8C, which had higher promoter activity than 9C, which, in turn, was greater than
10C (the smallest promoter region) (Figure 6.14).
Determination of the Minimal SLC11A1 Promoter Region and Mechanism of
Transcription Initiation
The smallest SLC11A1 promoter region, 10C, was able to activate transcription, albeit at
a medium to low level (Figure 6.14). This 148bp region, spanning from -99 to +49,
represents the minimal promoter region and, therefore, the site of the formation of the
basal transcriptional complex. The location of the minimal promoter region within this
148bp region confirmed the in silico clustalW and WeederH analysis, which identified
this region as the most conserved (Section 5.3.1.2 and 5.3.1.3). This finding also
-362
-362
-362
-249
2
22.56
-231 -197
-231 -197
-231 -197
-231 -197
18.80
3
3
18.80
2
22.56
-231 -197
3
18.80
2
22.56
-231 -197
3
18.80
2
22.56
-231 -197
3
18.80
2
22.56
-231 -197
3
18.80
2
22.56
9 D
-99
-99
-99
-99
-99
-99
-99
-99
10
+1
1
6
1
6
6
6
38.08 15.67TATA
1
38.08 15.67TATA
1
38.08 15.67TATA
+1
+1
+1
+1
Inr
Inr
Inr
+49
+49
+49
+49
+49
5
+49
15.75
Inr
Inr
6
+1
+49
38.08 15.67TATA
1
38.08 15.67TATA
+1
5
15.75
Inr
6
1
38.08 15.67TATA
+49
5
15.75
Inr
6
1
38.08 15.67TATA
C
4
9C
8D
8C
8A
7C
7A
1A
10C
+367
16.91
4
16.91
4
16.91
A
0
10
20
Fluorescence
30
Figure 6.14 Promoter activity of SLC11A1 constructs, containing different lengths of the SLC11A1 promoter, after transfection into THP-1 cells.
Nucleofection of SLC11A1 promoter constructs, containing only allelic variant allele 3 [(GT)n allele 3 with -237 C] in the forward orientation,
was used to transiently transfect THP-1 cells. Cells were loaded with the CCF2-AM substrate 24h post-nucleofection and fluorescence intensity
measured by flow cytometry. The promoter activity of the promoter constructs in THP-1 cells (right) are shown adjacent to the respective
SLC11A1 promoter regions cloned into the pGeneBLAzer plasmid (left).
-532
-362
-532
-362
-362
-362
8
-532
7
SLC11A1 Promoter Regions
227
227
228
corroborates the data obtained after transfection of the SLC11A1 promoter constructs
into 293T cells (Figure 6.15) (Section 6.3.1.2.1). The observation that the minimal
promoter region of SLC11A1 is shared by both non-monocytic (293T) and monocytic
(THP-1) cells suggests that the essential factors involved in the formation of the basal
transcriptional complex may not be monocyte specific.
Transfection of the SLC11A1 promoter constructs into THP-1 cells also showed that a
downstream promoter element, or other core elements downstream of the transcription
start site (+50 to +369), are not involved in the formation of the basal transcriptional
complex as a loss of promoter activity from promoter regions lacking the 5’UTR was
not observed (Figure 6.14). The absence of core elements located within this region is
consistent with the results after the transfection of promoter constructs into 293T cells
(Figure 6.15) (Section 6.3.1.2.1) and corroborates the findings of TFBS searches
(Section 5.3.1.4.1).
Location of Potential Transcriptional Enhancers/Repressors
The observation that enhanced promoter activity correlated with increasing promoter
length (Figure 6.14) suggests the presence of TFBS, and/or regions of altered DNA
topology, located throughout the SLC11A1 promoter. Such regions would likely exert
synergistic effects to enhance SLC11A1 expression. However, an increase in promoter
activity was not observed between the larger 1A promoter region (3267bp region
spanning -2900 to +369) compared to the smaller 7A promoter region (-533 to +369). A
similar level of promoter activity was observed from both of these SLC11A1 promoter
regions, suggesting that there are no transcriptional elements which influence SLC11A1
transcription in monocytes, located within the -2900 to -533 region.
Of particular interest was the -532 to -362 region of the SLC11A1 promoter. Both the
7A (-533 to +369) and 7C (-533 to +49) promoter regions drove a high level of
promoter activity, however, the 8A (-362 to +369) and 8C (-362 to +49) regions
resulted in promoter activity that was 3 to 5 fold lower (Figure 6.14). This 170bp region
(-532 to -362), located upstream of the (GT)n microsatellite repeat, likely contains a
factor(s), which enhance SLC11A1 transcription. These factors may interact directly to
facilitate formation of the basal transcriptional complex, thereby enhancing SLC11A1
0
10C
9C
8D
8C
8A
7C
7A
1A
-532
-532
-532
7
-362
-362
-362
-362
-362
-362
-362
8
2
22.56
-231 -197
-231 -197
-231 -197
-231 -197
18.80
3
3
18.80
2
22.56
3
18.80
-231 -197
3
18.80
2
-231 -197
22.56
22.56
2
3
18.80
-231 -197
2
22.56
3
18.80
-231 -197
2
22.56
-249
9 D
-99
-99
-99
-99
-99
-99
-99
-99
10
1
6
1
6
6
6
38.08 15.67TATA
1
38.08 15.67TATA
1
38.08 15.67TATA
+1
+1
+1
Inr
Inr
Inr
+49
+49
+49
+49
+49
5
Inr
+49
15.75
+1
Inr
6
+1
38.08 15.67TATA
1
38.08 15.67TATA
+49
5
Inr
15.75
+1
6
38.08 15.67TATA
1
5
+49
15.75
Inr
6
+1
C
38.08 15.67TATA
1
SLC11A1 Promoter Regions
4
9C
8D
8C
8A
7C
7A
1A
10C
+367
16.91
4
16.91
4
16.91
A
0
THP-1 Cells
Fluorescence
10
20
30
Figure 6.15 Comparison of promoter activity of SLC11A1 constructs, containing different lengths of the SLC11A1 promoter, in 293T cells and
THP-1 cells. The cell lines were transiently transfected with the promoter constructs, with all plasmids containing only variant allele 3 [(GT)n
allele 3 with -237 C] in the forward orientation, and 24h post transfection loaded with the CCF2-AM substrate with detection of promoter
activity using a fluorescent plate reader (293T) or flow cytometry (THP-1). The promoter activity of the different promoter constructs in the
THP-1 (right) and 293T (left) cells are shown adjacent to the respective promoter regions cloned into the pGeneBLAzer plasmid (centre).
10C – 148bp
9C – 280bp
8D – 165bp
8C – 411bp
8A – 729bp
7C – 581bp
7A – 899bp
1A – 3267bp
1.0
Fluorescence Ratio
0.8 0.6 0.4 0.2
293T Cells
229
229
230
expression. Alternatively, due to the location of this region 300-500bp upstream of the
minimal promoter region, a synergistic effect with another transcription factor(s)
located closer to the transcription start site may result, thereby accounting for the high
promoter activity observed with the 7C promoter region. This region was also shown to
drive higher promoter activity in 293T cells, however, the effect of this region on
SLC11A1 promoter activity was more pronounced in THP-1 cells (Figure 6.15) (Section
6.3.1.2.1).
The bioinformatic analyses of the SLC11A1 promoter coupled with observations after
the transfection of promoter constructs into 293T cells suggested the presence of
transcriptional enhancer elements located within the 5’UTR and the first intron (+50 to
+369) (Sections 5.3.1.7 and 6.3.1.2.1). However, after transfection of the SLC11A1
promoter constructs into THP-1 cells, a 1.5 and 3 fold decrease in promoter activity was
observed between regions 7C and 7A and regions 8C and 8A, respectively (Figure
6.14), indicating that the +50 to +369 region does not contain any functional
transcriptional enhancer(s). However, the decreased promoter activity observed for the
+50 to +369 promoter region suggests that this region serves to recruit a factor, which
inhibits SLC11A1 transcription in monocytes. The transcriptional effect of the -362 to
-231 region also differed between the non-monocytic (293T) and monocytic (THP-1)
cells. While this region appears to recruit a transcription factor which inhibits
transcription in 293T cells (Section 6.3.1.2.1), the higher promoter activity driven by 8C
(-362 to +49) as compared to 9C (-231 to +49) in THP-1 cells, suggested that this region
did not contain an inhibitory element in monocytic cells (Figure 6.15).
6.3.2.4.2 The SLC11A1 Promoter Shows Evidence of Bidirectional
Transcription
Analysis of promoter activity in the forward and reverse orientation (containing the
allele 3 variant) indicated that the SLC11A1 promoter may mediate bi-directional
transcription, as the larger promoter regions (1A, 7A and 7C) exhibited promoter
activity when cloned in the opposite orientation (Figure 6.16). The promoter activity of
these larger promoter regions, in the reverse orientation, was 25-50% of the activity
driven by the respective inserts in the forward orientation. While the larger SLC11A1
promoter regions showed evidence of bidirectional promoter activity in vivo, the smaller
promoter regions did not show any evidence of promoter activity in the reverse
231
orientation. The bidirectional activity of the 1A, 7A and 7C promoter regions in THP-1
cells was not observed in 293T cells (Section 6.3.1.2.2), in which only promoter regions
8A and 8D mediated bidirectional expression (Figure 6.16).
Figure 6.16 Assessment of the ability of the SLC11A1 promoter region to mediate
bidirectional transcription. The black and white bars represent SLC11A1 promoter
regions, all containing variant allele 3 [(GT)n allele 3 with -237 C] cloned into the
pGeneBLAzer vector in the forward (F) and reverse (R) orientation, respectively.
Promoter activity observed when promoter constructs were tested in monocyte-like
THP-1 (A) and the non-monocyte 293T (B) cells.
A Monocyte Specific Factor Binds to the 8D Promoter Region
Consistent with findings using 293T cells, the 8D promoter region (-362 to -197), which
contains the (GT)n microsatellite repeat and a small amount of surrounding DNA,
showed a medium level of promoter activity, suggesting that the (GT)n microsatellite
repeat may have endogenous enhancement ability (Figure 6.15). However, unlike the
findings using the 293T cell line (Section 6.3.1.2.2), the 8D promoter region only
enhanced transcription when in the forward orientation in THP-1 cells, with no
promoter activity observed in the reverese orientation (Figure 6.16). This suggests that
there may be a monocyte specific transcription factor, which binds within the 8D region
to co-ordinate expression only in the forward orientation.
232
6.3.2.4.3 Promoter Constructs Containing Allele 3 Drive Higher Promoter
Activity Compared to Allele 2 and Allele T in THP-1 Cells
The different SLC11A1 promoter lengths, containing the variants allele 3 [(GT)n allele 3
with -237 C], allele 2 [(GT)n allele 2 with -237 C], and allele T [(GT)n allele 3 with -237
T] were transfected into THP-1 cells to determine the effects of the common promoter
variants on SLC11A1 promoter activity and locate factors which may mediate the
differential expression levels observed in the presence of the different variants (Figure
1.8) (Section 5.3.2.2.2).
Of the different promoter lengths transfected into THP-1 cells, promoter regions 7C, 8C
and 8D resulted in a 2 to 2.5 fold increase in promoter activity in the presence of (GT)n
allele 3 as compared to (GT)n allele 2 (Figure 6.17A). Promoter regions 7A and 8A
displayed a similar trend to the other SLC11A1 promoter regions tested, where (GT)n
allele 3 drove higher expression as compared to allele 2, however the differences in the
level of expression were not as pronounced (Figure 6.17B). While the higher promoter
activity observed in the presence of allele 3 is consistent with previous reports, which
have assessed the promoter activity of the (GT)n microsatellite repeat in monocytic cell
lines (Searle and Blackwell, 1999, Zaahl et al., 2004), it does not corroborate the results
observed after transfection of the promoter constructs in 293T cells (Section 6.3.1.2.3)
or the in silico Z-Hunt analysis (Section 5.3.1.5.1). Both of the latter analyses found that
(GT)n allele 2 possessed greater enhancer ability as compared to allele 3.
Analysis of the effect of the -237C/T polymorphism on promoter activity in THP-1 cells
found that the more frequent -237 C variant drove a 1.5 to 6 fold increase in promoter
activity as compared to the -237 T variant (Figure 6.17A). The trend for higher
promoter activity in the presence of the -237 C variant was also observed for the 9C
promoter region, which lacks the (GT)n microsatellite repeat, suggesting that this
polymorphism may modulate SLC11A1 expression independently of the (GT)n
microsatellite (Figure 6.17C). However, the lower promoter activity of the -237 T
variant, as compared to the -237 C variant, in the 9C region was not as high (1.5 fold
increase) as that seen in the other promoter regions containing both the (GT)n
microsatellite and the -237C/T polymorphisms. This suggested that the -237C/T
polymorphism may alter SLC11A1 expression both independently of, and in association
with, the (GT)n microsatellite repeat. The effect of the -237C/T polymorphism on
233
Figure 6.17 Analysis of the effect of the variants at the SLC11A1 promoter (GT)n and
-237C/T polymorphisms on promoter activity in THP-1 cells. Multiple plasmids of the
same SLC11A1 promoter region, differing only by the allelic variant present, either
allele 2 [(GT)n allele 2 with -237 C], allele 3 [(GT)n allele 3 with -237 C] or allele T
[(GT)n allele 3 with -237 T], were transfected into THP-1 cells. Promoter region 9C
contained only the -237C/T polymorphism, therefore, had two variants, allele C and
allele T. Promoter activity of the allelic variants observed in the 7C, 8C, 8D (A), 8A (B)
and 9C (C) SLC11A1 promoter regions. (D) Assessment for bias in the direction of
transcription due to the presence of different allelic variants. Promoter regions 1A, 7A
and 7C, containing the different allelic variants, were transfected into THP-1 cells in
both the forward and reverse orientation.
promoter activity in THP-1 cells differed to that observed in the 293T cells. While a
decrease in promoter activity was observed in the presence of the -237 T variant in
THP-1 cells, the presence of this variant led to an increase in promoter activity in 293T
cells (Section 6.3.1.2.3).
Analysis of the larger promoter regions, 1A, 7A and 7C, suggested that the SLC11A1
promoter may mediate transcription in a bidirectional fashion (Section 6.3.2.4.2).
Therefore, modulation of SLC11A1 promoter activity by the different promoter variants
234
could be due to the variant altering the rate of transcription in the forward direction as
compared to transcription in the reverse orientation, with increased reverse direction
transcription resulting in a decrease in SLC11A1 expression. Analysis of the 1A, 7A and
7C promoter constructs containing the common promoter variants in the forward and
reverse orientation, did not detect any differences in promoter activity of forward and
reverse orientation constructs between the different variants (Figure 6.17D).
6.3.2.5 Further Bioinformatic Analysis of Important SLC11A1
Promoter Regions Identified by the Reporter Assays
Based on the findings of the in vivo promoter analyses (Sections 6.3.1.2 and 6.3.2.4),
the identified important SLC11A1 promoter regions were analysed further to identify
putative DNA elements which may recruit transcription factors to these regions that
may be involved in modulating SLC11A1 transcription. Analyses were carried out by
reviewing the previously obtained in silico data and by conducting further analyses
(Sections 5.2.2.1.4 and 5.3.1.4)
6.3.2.5.1 The Basal Transcriptional Complex Assembles within a 148bp
Region (-99 to +49) of the SLC11A1 Promoter
The SLC11A1 promoter reporter assays identified a minimal promoter region of 148bp
located at -99 to +49 within the SLC11A1 promoter (Section 6.3.2.4.1). While this
region showed high homology among SLC11A1 homologs, as determined by the
clustalW and WeederH analyses (Figure 6.18A), no elements for the formation of the
basal transcriptional complex (for example TATA box, Inr, DPE etc) were identified
when this region was analysed using TFBS searches or by visual sequence analysis
(Section 5.3.1.4.1). Kishi et al. (1996) reported a non-canonical TATA box (GAAAA)
located at -38 to -33, however this site is not as highly conserved as the surrounding
regions, casting doubt on the significance of this site (Figure 6.18A). Located adjacent
to this site is an area of high homology, which was identified by clustalW analysis and
was the 6th highest scoring element from the WeederH analysis (15.67). The location of
this region at -33 to -22 (TGTTTCACAACG) is in keeping with the positioning of a
TATA element and may therefore represent the site for TBP interaction (Figure 6.18).
235
Located upstream of the putative TBP element, within the SLC11A1 promoter region
which displayed the highest level of conservation (-70 to -28) (Section 5.3.1.2), is the
highest scoring WeederH element (38.08) (Section 5.3.1.3) (Figure 6.18). Based on its
location, this highly conserved sequence may correspond to a region where a
transcription factor(s) binds, as either part of the TFIID complex, or other TAFs, which
would bind first and then recruit TBP to the highly conserved -33 to -22 region. Also
located within this region are predicted C/EBP (NF-IL6) (Figure 6.18) and Sp1 sites,
which may further modulate the formation of the basal transcriptional complex.
Figure 6.18 Identified SLC11A1 minimal promoter region and putative mechanism of
SLC11A1 expression. (A) ClustalW alignment of the promoter regions of 8 SLC11A1
homologs. (B) The location of WeederH elements and their respective scores. (C)
Location of putative TFBS. Transcription is initiated by TAF binding to the region
displaying the highest level of homology and highest scoring WeederH element. TAF
would then recruit TBP to a region -33 to -22 from which the basal transcriptional
complex would form.
236
6.3.2.5.2 Analysis of the 170bp Region (-532 to -362) Exerting the Highest
SLC11A1 Promoter Activity
The promoter assays identified a 170bp region (-532 to -362) as having the greatest
transcriptional activity (Figure 6.14) (Section 6.3.2.4.1). This region was assessed for
potential TFBS that could account for the high promoter activity observed. A range of
transcription factor elements, potentially able to regulate monocyte-specific expression,
were identified within this region. These included binding sites for transcription factors
involved in immune cell development or haemopoietic cell proliferation (c-Myb, PU.1,
PEA3, GATA2 and GM-CSF), in interferon response (IRF-1, IRF-2 and IRF-9) or LPS
response (CSPB1), and more generalised transcription factor binding sites (AP1, AP2
and Sp1) (Figure 6.19).
In the vicinity of the described 170bp region were two sites (E2M2 and E3M2),
previously identified by Richer et al. (2008), as elements for the binding of transcription
factors (Figure 6.19). While these sites were identified as putative transcriptional
elements, the specific transcription factors which bound these sites were not determined
(Richer et al., 2008). The site E3M2, located at the border of the identified 170bp
region, was located close to a high scoring WeederH element (12.18) (Figure 6.19).
Bioinformatic analysis did not identify any transcription factors at the E3M2 site,
however, previous studies have suggested that GM-CSF may bind at this site. The site
E2M2 also coincides with another identified WeederH element (10.46) and analysis of
this site located a number of putative interferon response elements (ISGF3 – IRF9,
IRF2) (Figure 5.19). Furthermore, visual sequence analysis of this site revealed a
perfect match for an IFN-stimulated response element (ISRE)
[(A/G)NGAAANNGAAACT] (Darnell et al., 1994), specifically an IRF-Ets composite
sequence (IECS) [GAAANN(N)GGAA] (Tamura et al., 2005, Tamura et al., 2008).
237
Figure 6.19 Location of putative transcription factor binding sites within the -520 to
-340 region of the SLC11A1 promoter. This region drove the greatest level of
transcriptional enhancement. The coloured boxes indicate the location of putative TFBS
within the SLC11A1 promoter (the scale located underneath is relative to TSS1). The
green, red and blue colours indicate transcription factors present in immune cell
development, IFN/LPS responsiveness and general transcription factors, respectively.
The black boxes indicate the location of elements identified by WeederH analysis, with
the respective score indicated inside the box. The grey boxes indicate the location of
sites E2M2 and E3M2 (identified by Richer et al., 2008). Numbers located below to the
right of boxes indicate the location of the element (the 3’ nucleotide position).
The promoter analyses showed a trend towards increasing SLC11A1 promoter activity
with increasing length of the SLC11A1 promoter region assessed. From the
bioinformatic analysis, multiple elements for the binding of the transcription factors,
Sp1 and C/EBP, were identified. Binding of these transcription factors has been shown
to drive expression from promoters, which lack canonical TATA box elements (Huber
et al., 1998, Smale, 1997, Smale and Kadonaga, 2003). Specifically, 15 sites for Sp1
binding were identified within the SLC11A1 promoter, suggesting that SLC11A1
transcription may be further modulated by Sp1 and C/EBP sites dispersed throughout
the promoter, which would account for the increased expression levels observed with
increasing promoter size.
238
6.3.2.5.3 Binding of a Monocyte Specific Transcription Factor within the
-362 to -197 Region Mediates Allelic Differences in SLC11A1 Expression
Z-Hunt analysis indicated that (GT)n allele 2 had a greater propensity to form Z-DNA as
compared to (GT)n allele 3, suggesting that allele 2 would provide greater
transcriptional enhancement (Section 5.3.1.5.1). This finding was corroborated by the
promoter analyses conducted using 293T cells (Section 6.3.1.2.3). However, when the
promoter plasmids were transfected into the THP-1 monocytic cell line, (GT)n allele 3
possessed a higher promoter activity as compared to (GT)n allele 2 (Section 6.3.2.4.3),
and was consistent with previous studies assessing the transcriptional enhancement
ability of the different (GT)n variants in monocytic cell lines (Searle and Blackwell,
1999, Zaahl et al., 2004). Therefore, these results indicate that monocyte-specific
factor(s) interact with (or are differentially affected by) the (GT)n microsatellite repeat
to mediate the differences in SLC11A1 expression observed for the different promoter
variants. Furthermore, the monocyte-specific factor(s) would be located within the
-362 to -197 region (165bp), as this region was common to all of the promoter
constructs assessing the effects of the (GT)n microsatellite repeat.
Analysis of the -362 to -197 promoter region identified a number of transcription factor
elements, which may play a role in modulating SLC11A1 transcription in monocytic
cells (Figure 6.20). This region contains the experimentally determined sites for the
binding of HIF-1α and AP1 (ATF3) located within, and adjacent to, the (GT)n
microsatellite repeat, respectively (Bayele et al., 2007, Xu et al., 2011) (Figure 6.20).
This region also contained two sites, identified by Richer et al. (2008), which could
mediate transcription factor binding. These include the previously described E3M2
region (putative GM-CSF binding) (Figures 6.19 and 6.20) and the E6M2 site, which,
from the in silico analysis, correlated with elements for the binding of the transcription
factors, Sp1 and KLF (Figure 6.20). Also located within the -362 to -197 region were
sites for additional Sp1 and KLF binding as well as a PEA3 site. A few highly
conserved WeederH elements were also located within this 165bp region (Figure 6.20)
and several of these corresponded with experimentally determined sites for transcription
factor binding. However, no transcription factor binding candidates were identified for
two high scoring WeederH elements, in particular the seventh highest scoring element
(14.08), which was located within the 165bp 8D region, and another element (18.08, the
third highest scoring element) located just outside of the 8D region.
239
Analysis of the effect of the -237C/T polymorphism on transcriptional activity
suggested that the lower level of promoter activity driven by the -237 T variant in THP1 cells was independent of the (GT)n microsatellite repeat (Section 6.3.2.4.3). Analysis
of wild type (-237 C) sequence for potential TFBS did not identify any transcriptional
elements in the vicinity of the -237C/T polymorphism. However, a TFBS search carried
out with the introduction of the -237 T variant, resulted in the production of a
transcriptional element for the binding of the ubiquitously-expressed transcription factor
Oct-1 (Figure 6.20) (Section 5.3.1.4.3). The introduction of the Oct-1 element in the
presence of the -237 T variant may explain the differences in promoter activity
mediated by variants at the -237C/T polymorphism.
Figure 6.20 Location of putative monocyte-specific TFBS within the -360 to -180
region of the SLC11A1 promoter. The coloured boxes indicate the location of putative
transcription factor binding within the SLC11A1 promoter (the scale bar located
underneath is relative to TSS1). The green, red and blue colours indicate transcription
factors expressed during immune cell development, IFN/LPS responsiveness and
general transcription factors, respectively. The black boxes indicate the location of
elements identified by WeederH analysis, with the respective score indicated inside the
box. The grey boxes indicate the location of sites E3M2 and E6M2 (identified by Richer
et al., 2008). Numbers located below to the right of boxes indicate the location of the
element (the 3’ nucleotide position).
240
6.4 DISCUSSION
6.4.1 Overview
The current study has utilised an integrated approach, based on in silico bioformatics
and in vivo functional assays, to elucidate promoter regions involved in the
transcriptional regulation of SLC11A1. Firstly, bioinformatic analyses of the SLC11A1
promoter were completed to identify highly conserved and putative regulatory regions
involved in SLC11A1 transcription (Chapter 5, Part 1). These regulatory regions were
then used to define SLC11A1 promoter regions, for cloning into promoter reporter
assays, allowing the functional assessment of the regions for their involvement in
SLC11A1 transcriptional regulation (Chapter 5, Part 2). A number of different variants
of each SLC11A1 promoter length, differing only at the (GT)n microsatellite and the
-237C/T polymorphisms, were cloned. Additionally, these promoter regions were
cloned in both the forward and reverse orientation. The prepared SLC11A1 promoter
constructs were then functionally assessed for promoter activity in monocyte-like
(THP-1) and non-monocyte (293T) cell lines (Chapter 6, Part 3). Testing of the
promoter constructs allowed: the identification of a minimal SLC11A1 promoter region
and promoter regions mediating transcriptional enhancement of SLC11A1, the
determination of the ability of the SLC11A1 promoter to mediate bidirectional
transcription, and the elucidation of the mechanism by which promoter variants mediate
differential levels of SLC11A1 expression.
6.4.2 THP-1 Cells are an Appropriate Model for the
Investigation of SLC11A1 Expression
To determine promoter activity of the designed and manufactured SLC11A1 promoter
constructs, it was important to select a cell line which displays the restricted expression
of SLC11A1 in vivo. Furthermore, it would be advantageous that the selected cell line
mimics the kinetics of SLC11A1 expression during monocyte to macrophage
differentiation or upon stimulation (with IFN-γ or LPS), thereby ensuring that the
factors involved in modulating SLC11A1 expression are present as cells progress along
the monocyte/macrophage lineage.
241
THP-1 cells were found, by morphological/cytochemical analysis and quantitative real
time PCR, to resemble a monocyte-like cell, which expressed SLC11A1 (Section
6.3.2.2.1 and 6.3.2.2.2). Furthermore, the observed increase in SLC11A1 expression
during cellular differentiation of THP-1 cells was consistent with that observed during
the differentiation of primary monocytes to macrophages. A PMA concentration of
5ng/ml was found to be adequate to allow differentiation and a concomitant increase in
SLC11A1 expression, in the absence of off target effects observed using higher
concentrations (Park et al., 2007). Stimulation of THP-1 cells with IFN-γ and LPS also
resulted in an increase in SLC11A1 expression (Section 6.3.2.2.2), consistent with
observations after stimulation of primary monocytes. Overall, the morphological and
cytochemical analyses coupled with increased expression of SLC11A1 during monocyte
to macrophage differentiation or stimulation established that the THP-1 cell line
constituted an appropriate model for the analysis of the mechanisms of SLC11A1
expression.
6.4.3 SLC11A1 Promoter Analysis
6.4.3.1 A 148bp Region of the SLC11A1 Promoter Defines the Minimal
Promoter Region
Transfection of promoter constructs containing different lengths of the SLC11A1
promoter, into 293T and THP-1 cells, showed that the minimal promoter region able to
activate transcription was a 148bp region (located from -99 to +49), which represents
the site for the formation of the basal transcriptional complex (Figure 6.21). The
location of the minimal promoter (-99 to +49) corresponds to the region predicted by the
bioinformatic analyses (WeederH analysis and the clustalW alignment) (Section 5.3.1.2
and 5.3.1.3). Furthermore, the 148bp minimal promoter region identified in the current
analysis is the smallest region identified to date, which is able to mediate SLC11A1
transcription. Prior to this study, a 180bp region (-161 to +19) was the smallest
identified SLC11A1 promoter region, which could mediate transcription (Xu et al.,
2011).
242
Figure 6.21 SLC11A1 transcription appears to be initiated by a mechanism different to
that observed from canonical promoters. Landmarks of the SLC11A1 promoter are
shown, including the two transcription start sites (TSS1 and TSS2) and putative Z-DNA
forming sequence identified at TSS1 (Section 5.3.1.5). Red regions indicate the
conserved areas of the SLC11A1 promoter identified from the clustalW alignment and
white boxes containing numbers indicate the high scoring WeederH elements (Section
5.3.1.2 and 5.3.1.3). A 148bp region was identified as the minimal promoter region (-99
to +49) and the site for the formation of the basal transcriptional complex. No core
promoter elements were identified in the 5’ UTR or first intron of SLC11A1.
Recruitment of C/EBP binding has been experimentally determined to occur over TSS2
(+24) and functions as a core promoter element, while Sp1 binding just outside of the
minimal promoter region (located at -106 to site E10M0) has also been experimentally
shown to occur (Richer et al., 2008). Initiation of the formation of the basal complex is
likely due to Sp1 and C/EBP binding first within the minimal promoter region. Sp1 and
C/EBP binding would recruit TBP and TAF’s to the promoter to mediate TFIID
formation and then subsequent recruitment of the basal transcriptional complex.
6.4.3.2 Mechanism of the Formation of the Basal Transcriptional
Complex
The results obtained from the in silico bioinformatic analysis and reporter assays
suggests that SLC11A1 transcription is initiated by a mechanism different to that
observed for canonical promoters containing TATA, Inr or DPE elements (Figure 6.21).
Core promoter elements were not identified in the 5’UTR and first intron of SLC11A1,
thus confirming the location of the minimal promoter region, and core elements
243
involved in transcription intiation, to the region between -99 to +49 of the SLC11A1
promoter (Section 6.3.2.4.1). Consistent with previous in silico studies, SLC11A1 was
not found to contain a TATA element (Blackwell et al., 1995, Searle and Blackwell,
1999) and further in silico and visual sequence analysis of the identified minimal
promoter region did not identify other core elements, including an initiator element,
DPE, MTE or BREu/d (Section 5.3.1.4.1). These observations are consistent with the
finding that non-canonical, TATA-less promoters generally have multiple transcription
initiation start sites, as observed with SLC11A1 (Smale and Kadonaga, 2003).
However, analysis of the SLC11A1 promoter identified multiple transcription factor
binding sites for Sp1 and C/EBP (Section 5.3.1.4.1 and 6.3.2.5.1). The data from the
current study, and that of previous reports, suggest that SLC11A1 transcription may be
initiated through the binding of transcription factors C/EBP and Sp1 to CCAAT box and
GC box elements, respectively (Bowen et al., 2003, Richer et al., 2008, Yeung et al.,
2004).
Richer et al. (2008) identified a consensus site for the CCAAT-binding factors located
over the second transcription start site (28bp upstream of TSS1) of SLC11A1 (Figure
6.21) and showed that the transcription factors C/EBPα and C/EBPβ (also known as
NF-IL6) are able to bind at this site. The transcription factors C/EBPα and C/EBPβ are
important in the differentiation of immature cells into monocytes and then into
macrophages (Friedman, 2007, Studzinski et al., 2006). Interestingly, SLC11A1
transcription was completely abolished when the site of C/EBP binding was mutated,
suggesting that this transcription factor functions as a core promoter element, which is
essential for the formation of the basal transcriptional complex. While C/EBP has not
been reported to function as a core initiator like protein (Smale, 1997, Smale and
Kadonaga, 2003), the location of C/EBP binding over the transcription start site has
been reported in another promoter (Jiang and Zarnegar, 1997). The transcription factor
C/EBP has been shown to directly activate transcription through interaction with the
core factors, TBP and TFIIB (Chevneval et al., 1991, Nerlov and Ziff, 1995, Pedersen et
al., 2001) and, aside from SLC11A1, it has been shown to play a role in the expression
of other immune-related genes, such as IL-6 (Akira et al., 1992, Natsuka et al., 1992),
IL-12p40 (Plevy et al., 1997), IL-1β (Yang et al., 2000b), and iNOS (Sakitani et al.,
1998).
244
In addition to the C/EBP binding site, Richer et al. (2008) identified a Sp1 site located,
106bp upstream of the transcription start site and just outside the minimal promoter area
identified in the current study (Figure 6.21). While this site was not identified as a core
element for transcription, multiple putative Sp1 sites have been identified throughout
the SLC11A1 promoter, with potentially one of the sites located within the minimal
promoter region, being essential for SLC11A1 expression. Interestingly, Slc11a1
expression has been shown to be inhibited after the knockdown of Sp1 expression by
RNA interference in mice (Yeung et al., 2004). Furthermore, a Sp1 site, located in the
core promoter region, was found to be essential for expression of Slc11a1 during
macrophage differentiation and upon stimulation with IFN-γ and LPS. Therefore, Sp1
potentially plays an important role in modulating SLC11A1 expression (Bowen et al.,
2003).
The transcription factor Sp1 is ubiquitously expressed, however it exerts cell- and
tissue-specific control over the genes whose transcription it regulates. This high level of
control is mediated through the wide range of protein modifications to Sp1, altering
transcription factor interactions and the ability of Sp1 to bind DNA (Resendes and
Rosmarin, 2004, Suske, 1999, Tan and Khachigian, 2009). Sp1 can mediate
transcription through direct interaction with TBP, TAF4 and TAF7, to initiate the
formation of the basal complex, and multiple Sp1 sites have been shown to initiate the
expression of genes which lack TATA and other core elements (Huber et al., 1998,
Smale, 1997, Smale and Kadonaga, 2003, Wierstra, 2008). Interaction of Sp1 with other
transcription factors occurs through multiple binding domains, resulting in synergistic
effects. In particular, Sp1 can interact with other Sp1 factors as well as the monocytic
transcription factors, PU.1 and C/EBP. Sp1 has been shown to be involved in the
expression of important myeloid genes (Resendes and Rosmarin, 2004) as well as CD14
and C/EBP expression in both monocytes and macrophages (Berrier et al., 1998, Zhang
et al., 1994).
Therefore, the mechanism of SLC11A1 transcription initiation appears to be controlled
through the binding of transcription factors, C/EBPα or C/EBPβ and Sp1, to the
minimal promoter region (Figure 6.21). Both Sp1 and C/EBP can bind to nucleosome
bound DNA recruiting chromatin modifiers to alter the local topological structure,
thereby activating transcription (Wierstra, 2008). Formation of the basal transcriptional
245
complex would then be mediated through the direct interaction of C/EBP and Sp1 with
TBP and TAFs (and potentially TFIIB) leading to the formation of TFIID, recruitment
of the other core proteins and RNA polymerase II (Section 5.1.2), and thus SLC11A1
transcription. Other genes, whose expression has been shown to be mediated through
the combined effects of Sp1 and C/EBP binding, include CD11c (CD18) (LópezRodríguez et al., 1997), human reduced folate carrier promoter C (Payton et al., 2005)
and lactoferrin (Khanna-Gupta et al., 2000).
6.4.3.3 The 5’UTR and First Intron do not Function to Enhance
SLC11A1 Transcription in Monocytic Cells
The current study is the first to determine if the SLC11A1 5’UTR contains any core
promoter elements, or elements involved in the binding of transcription factors. The in
silico analysis identified several elements in the 5’UTR and the first intron, in particular
the fourth and fifth highest scoring WeederH elements (scores 16.91 and 15.75)
(Section 5.3.1.3) (Figure 6.21). Additionally, the promoter assays suggested the 5’UTR
and first intron contained elements which could enhance transcription in 293T cells
(Section 6.3.1.2.1). However, the same region did not provide transcriptional
enhancement in THP-1 cells (Section 6.3.2.4.1). Interestingly, the presence of the
5’UTR and first intron region resulted in a decrease in promoter activity in THP-1 cells
(Figure 6.14), suggesting that this region may contain a monocyte-specific
transcriptional repressor.
It is not uncommon for the 5’UTR and the first intron to contain elements for
transcription factor binding (Bianchi et al., 2009, McKeon et al., 1997). However, while
regions identified in the 5’UTR and the first intron were found not to mediate any
transcriptional enhancement in monocytic cells, these highly conserved sites may be
active at other stages of macrophage differentiation or stimulation, potentially mediating
the increase in SLC11A1 expression observed. In silico analysis of murine Slc11a1
identified transcriptional elements in the first intron, homologous to the conserved
region of the first intron in the human gene (16.91, Figure 6.21), suggesting that
transcription factor binding may occur at this site during the classical activation of
macrophages or in response to IFN-γ stimulation (Govoni et al., 1995).
246
6.4.3.4 Identification of SLC11A1 Promoter Regions Important in the
Recruitment of Transcription Factors
In the THP-1 cell line it was found that the smallest promoter region tested had the
lowest promoter activity, with promoter activity increasing as the SLC11A1 promoter
regions increased in length (Figure 6.14). This is consistent with published studies
assessing SLC11A1 expression in HL-60 cells, which showed that increasing promoter
activity was correlated with increasing promoter size, with the region showing the
highest promoter activity being of similar size and location to the region with the
highest promoter activity identified in the current study (region 7C, located from -532 to
+49) (Figure 6.14) (Roig et al., 2002, Xu et al., 2011).
Initiation of transcription is slow when restricted to the core proteins involved in the
formation of the basal transcriptional complex (Burley and Roeder, 1996). This would
account for the low promoter activity mediated by the smallest SLC11A1 promoter
region (+99 to -49) used in the current study. This region likely only contains sites for
the binding of core proteins involved in the formation of the basal complex. Promoter
activity increased, as larger promoter regions were assessed, presumably due to the
introduction of elements for the binding of additional transcriptional enhancers, thereby,
increasing the rate of transcription through direct or indirect interaction with the basal
transcriptional complex (Latchman, 2004).
It has previously been suggested that negative elements, which inhibit SLC11A1
expression, may be located upstream of the SLC11A1 promoter in the -3451 to -469
region (Roig et al., 2002). While increasing promoter size correlated with increasing
promoter activity in the current study, there was no difference in the level of expression
between the largest (1A) and second largest (7A) promoter regions tested (Figure 6.14)
(Section 6.3.2.4.1). This suggests that no transcriptional enhancers or negative
regulators of expression are located within the -2900 to -533 region of the SLC11A1
promoter. Furthermore, when combined with the previous observation of a lack of
transcriptional enhancement by the 5’UTR, these findings suggest that the components
required for SLC11A1 transcription in monocytic cells are located within a 581bp region
(from -532 to +49) (Figure 6.22).
Figure 6.22 Transfection of the promoter constructs into THP-1 cells revealed that a 581bp region is involved in expression of SLC11A1 in
monocytic cells. The SLC11A1 promoter region from -532 to -362 exerted the greatest transcriptional enhancement over SLC11A1 expression.
Within this region, combined binding of transcription factors, IRF-8 and PU.1 to an IECS element, are the likely candidates mediating the
increase in expression observed. Also identified within this region is a putative site for IRF-1 binding. Sites E2M2, E3M2, E6M2 and E10M0
identify TFBS identified by Richer et al. (2008). Landmarks of the SLC11A1 promoter are shown, including the two transcription start sites
(TSS1 and TSS2) and the location of the polymorphic (GT)n microsatellite repeat and -237C/T polymorphism (blue line). Red regions indicate
the conserved areas of the SLC11A1 promoter identified from the clustalW alignment and white boxes containing numbers indicate the high
scoring WeederH elements (Section 5.3.1.2 and 5.3.1.3). The grey dashed lines designate the SLC11A1 promoter regions cloned for production
of the promoter constructs. A description of the minimal promoter region (promoter regions and transcription factors shown in grey) is detailed in
Figure 6.21.
247
247
248
6.4.3.4.1 Transcription Factors IRF and PU.1 are Candidates for the
Transcriptional Enhancement of the -532 to -362 SLC11A1 Promoter
Region
It was found that a 170bp region (-532 to -362), located upstream of the (GT)n repeat,
displayed the greatest enhancement of promoter activity in monocytes (Section
6.3.2.4.1). A similar region was also reported to drive increased SLC11A1 expression in
HL-60 cells after vitamin D stimulation (Richer et al., 2008, Roig et al., 2002). While
the identified -532 to -362 region did not contain a high level of homology from the
clustalW alignment and WeederH analysis (Figure 5.13), the in silico analyses for
putative TFBS identified a number of elements for the recruitment of transcription
factors, which could account for the high SLC11A1 promoter activity that occurs in the
presence of this 170bp promoter region (Figure 6.19).
The most significant of the identified TFBS, located in the 170bp region, were two
ISRE for the binding of interferon regulatory factors (IRF) (Figure 6.19). The IRF
family, which consists of nine members (IRF-1-9), plays an important role in immune
cells, where IRF members are involved in signal transduction, initiation of gene
expression during IFN stimulation and in responding to pathogen- associated molecular
patterns (PAMPs), such as LPS and viral DNA (Tamura et al., 2008). Of the nine
members of the IRF family, IRF-1, IRF-2, IRF-4, and IRF-8 are expressed in monocytes
and macrophages (Friedman, 2007). In addition to the role that these transcription
factors play in the activation and maintenance of an immune response, they are also
involved in myeloid development and macrophage function (Tamura et al., 2005,
Tamura et al., 2008).
IRF-8 is an essential transcription factor involved in the commitment of developing
myeloid cells to a monocyte/macrophage lineage, as IRF-8 null progenitor cells are
unable to differentiate into macrophages (Scheller et al., 1999, Tamura and Ozato,
2002, Tsujimura et al., 2002). While the TFBS searches identified parallel consensus
sequences for IRF-2 and IRF-9 (Figure 6.19), these transcription factors do not play a
role in myeloid differentiation. Closer visual analysis of the sequence of this region
identified an IRF-Ets composite sequence (IECS) for the combined binding of
transcription factors, IRF-8 and PU.1 (an Ets transcription factor) (Section 6.3.2.5.2)
(Tamura et al., 2005, Tamura et al., 2008). The IECS elements were first identified to
249
be active during the differentiation of macrophages, resulting in the transactivation of a
number of genes, in particular those encoding several lysosomal/endosomal proteins
(Tamura et al., 2005). The identified IECS, in the SLC11A1 promoter, correlated with a
previously identified protected site (E2M2) found during vitamin D differentiation of
HL-60 cells, suggesting that transcription factor binding occurs at this site during
monocyte to macrophage differentiation (Figure 6.22) (Richer et al., 2008). However,
the study could not identify the specific transcription factor that bound to this region.
Due to the observation that SLC11A1 has increasing expression during macrophage
activation (Section 1.1.3.2), as well as restricted localisation to the endosome/lysosome
(Section 1.1.3.1), the identified IECS site in the SLC11A1 promoter, which binds the
interacting factors IRF-8 and PU.1, is a strong candidate element for the observed
increase in expression driven in the presence of this 170bp promoter region.
Furthermore, the transcription factors, IRF-8 and PU.1, have been shown to interact to
drive Slc11a1 transcription in mice (Alter-Koltunoff et al., 2003, Alter-Koltunoff et al.,
2008, Govoni et al., 1995, Turcotte et al., 2007, Turcotte et al., 2005).
The second ISRE that was identified in the 170bp region of the SLC11A1 promoter was
a putative IRF-1 transcription factor located at -497bp (Figure 6.22). The transcription
factor IRF-1 also plays a role in myeloid development and, therefore, may also be
associated with the higher promoter activity which occurs in the presence of this 170bp
region (Friedman, 2007, Tamura et al., 2008).
6.4.3.4 The SLC11A1 Promoter Shows Evidence of Bidirectional
Transcription
Results of the transfection of the SLC11A1 promoter constructs in both the forward and
reverse orientation in THP-1 cells suggests that the SLC11A1 promoter may function to
direct transcription in a bidirectional manner (Section 6.3.2.4.2). The shortest SLC11A1
promoter constructs showed orientation-specific promoter activity only in the forward
direction, while the larger promoter constructs (1A, 7A and 7C), showed orientationindependent promoter activity (Figure 6.16). This is consistent with previous findings
that a larger SLC11A1 promoter region (386bp located at -338 to +48) showed evidence
of bidirectional transcription, however, a smaller region (263bp located at -85 to +178)
showed expression only in the forward orientation (Bayele et al., 2007, Roig et al.,
2002).
250
A bidirectional promoter is characterised by gene pairs orientated head to head on
opposite DNA strands, with less than 1000bp separating their transcription start sites
(Trinklein et al., 2004). Transcriptional expression of the gene pair is mediated by a
common promoter region. While a gene located within 1000bp upstream of SLC11A1,
on the opposite strand is not apparent at the SLC11A1 locus, the current finding is
consistent with a study into the level of bidirectional transcription, which found that
52% of random promoters showed transcriptional activity in both directions (Trinklein
et al., 2004). This suggests that half of all human promoters do not exhibit strong
directionality in transcription initiation. This lack of directional transcription was found
to be more common in TATA-less promoters, as the presence of a TATA element
regulates the directionality of transcription (Trinklein et al., 2004).
The bidirectional nature of the SLC11A1 promoter may be of functional significance
due to a currently unidentified, regulatory transcript such as a gene for a regulatory
microRNA, or another type of non-coding RNA, located in the opposite direction. Such
regulatory non-coding RNAs are increasingly being shown to play important roles in the
coordination of gene expression (Mattick, 2007, Neil et al., 2009, Wei et al., 2011). The
coexpression of a regulatory non-coding RNA, with the SLC11A1 transcript, may
explain (and be responsible for) the pleiotropic effects attributable to increased
SLC11A1 expression levels.
Likewise, the bidirectional nature of the SLC11A1 promoter may be attributable to the
increased rate of SLC11A1 expression observed from the larger SLC11A1 promoter
regions, as compared to the smaller promoter regions. The smaller SLC11A1 promoter
regions drive low promoter activity, which would allow sufficient time to correctly
orientate the formation of the basal transcriptional complex. However, the larger
promoter regions, by mediating more rapid expression due to the presence of additional
transcriptional activators, may result in decreased stringency with respect to the
orientation of the basal transcriptional complex (Neil et al., 2009). In this case the coexpressed transcript, known as a cryptic unstable transcript, does not play a functional
role and would be rapidly degraded (Neil et al., 2009, Wei et al., 2011, Xu et al., 2009).
251
6.4.4 The Influence of SLC11A1 Promoter Polymorphisms on
SLC11A1 Promoter Activity
The SLC11A1 promoter contains several polymorphisms, which have been shown to
alter SLC11A1 expression. To determine the mechanism underlying the ability of the
different promoter polymorphisms to alter SLC11A1 expression, various lengths of the
SLC11A1 promoter, containing the different polymorphic variants, were cloned for
reporter assays. The promoter constructs were designed to contain (GT)n allele 2 or
allele 3, as well as either the C or T variant at the -237C/T polymorphism (both in cis
with (GT)n allele 3). These were transfected into 293T and THP-1 cells, to assess if
interacting factors were located within the different promoter regions, which may
associate with, or be differentially modulated by, the different promoter variants.
6.4.4.1 The (GT)n Variants Mediate Differential Transcription
Through the Binding of a Monocyte-Specific Transcription Factor to
the -362 to -197 Region
Of the nine identified alleles of the (GT)n microsatellite repeat, the most frequently
occurring (GT)n allele 3 has also been shown to mediate significantly higher SLC11A1
expression in monocytic cell lines as compared to (GT)n allele 2 (Figure 1.8) (Searle
and Blackwell, 1999, Zaahl et al., 2004). The mechanism by which the 2bp difference
between (GT)n alleles 3 and 2 mediates a significant difference in SLC11A1 expression
remains unknown.
It was hypothesised, and has recently been shown, that the polymorphic (GT)n
microsatellite repeat can form Z-DNA during transcription of SLC11A1 (Bayele et al.,
2007, Blackwell et al., 1995, Xu et al., 2011). Z-DNA has been shown to enhance
transcription by reducing the negative supercoiling, thereby allowing transcription
factor binding and unwinding of the DNA to allow pol II transcription (Section
5.1.4.2.1) (Bates and Maxwell, 2005, Kashi and Soller, 1999). Due to the ability of the
(GT)n microsatellite to form Z-DNA during transcription, it would be hypothesised that
the difference in the basal level of SLC11A1 expression (in the absence of exogenous
stimuli) between the (GT)n alleles would be mediated through the differing ability of the
(GT)n repeats to form Z-DNA. However, in the current study, Z-Hunt analysis found
that allele 2, with 10 GT repeats, had a greater propensity to form Z-DNA than allele 3
252
(9 GT repeats), inferring that allele 2 would possess greater transcriptional enhancement
(Figure 5.12). This finding is consistent with reports which show that longer alternating
purine/pryimidine tracts have an increased ability to form Z-DNA, and accordingly, a
greater ability to enhance transcription (Nordheim et al., 1982). However, this finding
contradicts previously completed reporter assays, showing that allele 3 drives a higher
level of SLC11A1 expression than allele 2. This contradiction suggests that the ability of
alleles 2 and 3 to mediate different levels of SLC11A1 expression is not attributable to
their propensity to form Z-DNA.
Transfection of promoter constructs containing the different (GT)n alleles into nonmonocytic 293T cells indicated that the presence of allele 2 resulted in a higher
promoter activity as compared to allele 3 (Figure 6.23) (Section 6.3.1.2.3). This
corroborated the results of the Z-Hunt analysis, which ascribed a higher Z-score to allele
2. When the promoter constructs containing the different microsatellite alleles were
transfected into the monocyte-like THP-1 cell line, (GT)n allele 3 was shown to drive
higher promoter activity in all of the promoter regions tested (Figure 6.23) (Section
6.3.2.4.3), contradicting the findings of the Z-Hunt analysis and the results of the
transfection of promoter constructs in 293T cells.
The findings from the current analysis suggests that (GT)n allele 2 has a greater
transcriptional enhancement ability compared to allele 3, as observed from the Z-Hunt
analysis and the transfection of promoter constructs into the non-monocytic 293T cells.
However, in monocytic cells, SLC11A1 expression is modulated by a monocyte-specific
factor(s), which are differentially regulated by the (GT)n alleles to result in a higher
level of expression in the presence of (GT)n allele 3. Putatively, the 9 GT repeat length
and/or the Z-DNA forming ability of allele 3 is optimal for the binding of a monocyticspecific factor(s). Alternatively, a monocytic specific factor may initially bind and then
alter the propensity for the GT repeat to form Z-DNA. Furthermore, the results of the
reporter assays suggested that the location of the element(s) for the recruitment of
monocyte-specific transcription factor(s) is within a 165bp promoter region between
-362 to -197, as all larger promoter regions tested showed the same expression profile
(Figures 6.5, 6.17 and 6.23).
253
Figure 6.23 Comparison of the promoter activity of the SLC11A1 promoter constructs,
containing the common allelic variants, in non-monocytic and monocyte-like cells.
Multiple plasmids of the same SLC11A1 promoter region, differing only by the
promoter variant present, either allele 2 [(GT)n allele 2 with -237 C], allele 3 [(GT)n
allele 3 with -237 C] or allele T [(GT)n allele 3 with -237 T], were transfected into 293T
cells (A) or monocyte-like THP-1 cells (B). Promoter region 9C contained only the
-237C/T polymorphism, therefore, had two variants, allele C and allele T.
The modulation of SLC11A1 expression by the (GT)n alleles in monocytic cells may be
mediated by the binding of the recently described transcription factors, ATF-3 and
JunB, to an AP-1-like element (identified as the second highest scoring WeederH
element [22.56]; Section 5.3.1.3) located within the 165bp region adjacent to the
microsatellite repeat (Xu et al., 2011) (Figure 6.24). Xu et al. (2011) used the HL-60
(pre-monocytic) cell line, which does not endogenously express SLC11A1, to show that
after PMA differentiation, binding of ATF-3 to the AP1-like element recruited BRG1
(SWI/SNF complex) and β-actin to modulate the removal of nucleosomes within the
SLC11A1 promoter (Figure 6.24). Removal of the nucleosomes allows the formation of
Figure 6.24 Monocytic-specific factor(s), binding within the -362 to -197 region, were identified as the mechanism controlling differences in
promoter activity in the presence of allelic variants at the (GT)n repeat. ATF-3 and Jun D binding to an AP-1-like element adjacent to the (GT)n
microsatellite repeat have been shown to promote an open chromatin structure of the SLC11A1 promoter (through recruitment of SWI/SNF) and
enhance transcription by recruitment of pol II (through direct interaction with β-actin) (Xu et al., 2011, Xu et al., 2010). Therefore ATF-3 is a
candidate factor controlling differences in promoter activity in the presence of variants at the (GT)n repeat. Other candidate factors include GMCSF, KLF, Sp1 and ZBP-1. While HIF-1 has been shown to bind to the (GT)n repeat to enhance SLC11A1 transcription, HIF-1 is not a candidate
to explain differences in promoter activity in monocytes (Bayele et al., 2007). The -237C/T polymorphism functions to alter SLC11A1 promoter
activity independently of the (GT)n repeat. The candidate transcription factor, Oct-1, binding over the site of the -237C/T polymorphism in the
presence of the -237 T variant, could be responsible for the observed differences in promoter activity mediated by the variants at the -237C/T
polymorphism. Descriptions of promoter regions and transcription factors shown in grey are detailed in Figures 6.21 and 6.22.
254
254
255
an open chromatin structure (and recruitment of pol II to the basal transcriptional
complex), thereby facilitating transcription (Figure 6.24) (Xu et al., 2011, Xu et al.,
2010). The study found that ATF-3 binding and recruitment of BRG1 were essential for
Z-DNA formation at the (GT)n microsatellite repeat (Xu et al., 2011). Therefore, ATF-3
binding to the AP-1-like site in the SLC11A1 promoter is the likely candidate
responsible for modulation of SLC11A1 expression in the presence of the different
(GT)n variants in monocytic cells.
Transcription factor binding site searches identified several additional transcription
factors, which may also bind within the 165bp promoter region to modulate SLC11A1
expression in the presence of the different (GT)n alleles (Figure 6.20). These
transcription factors include binding of Sp1 and KLF downstream of, and adjacent to,
the (GT)n microsatellite repeat, GM-CSF binding to the previously identified E3M2 site
(Richer et al., 2008) and PEA3 (Figure 6.24). In addition to these factors, the ability of
the microsatellite repeat to form Z-DNA could result in the recruitment of transcription
factors, which may bind to a Z-DNA conformation. The transcription factor Z-DNA
binding protein 1 (ZBP-1) is a cytosolic based immune sensor involved in interferon
signaling (IFN-γ) (Takaoka et al., 2007) and may bind to the 3’ end of the microsatellite
repeat (Figure 6.24). Due to the different abilities of the (GT)n alleles to form Z-DNA,
modulation of different levels of SLC11A1 expression, may be attributable to the
differing propensity for ZBP-1 (or another similar factor which can bind Z-DNA) to
bind and enhance transcription.
The transcription factor HIF-1α has also been shown to bind, within the identified
165bp region, to a cryptic element located in the middle of the (GT)n microsatellite
repeat (Bayele et al., 2007) (Figure 6.24). However, HIF-1α is not stably expressed in
normoxic (normal oxygen concentration) monocytic cells (which represents the stage of
SLC11A1 expression in THP-1 cells investigated in the current study) and was shown to
transactivate SLC11A1 expression only after cytokine stimulation or the induction of
phagocytosis (Bayele et al., 2007), thereby discounting the potential for HIF-1α to
mediate the higher SLC11A1 expression observed in the presence of (GT)n allele 3 in
monocytic cells.
256
6.4.4.2 The -237C/T Polymorphism Functions Independently of the
(GT)n Microsatellite Repeat to Modulate SLC11A1 Expression
Transfection of promoter constructs containing different lengths of the SLC11A1
promoter, which only differed at the -237 polymorphic site (209 bases upstream of
TSS1; Section 5.2.2.1.1), into 293T cells found that a higher promoter activity was
observed in the presence of the -237 T variant, as compared to the -237 C variant for all
promoter regions tested (Section 6.3.1.2.3) (Figure 6.23). This finding is consistent with
a previous analysis of this polymorphism in 293T cells, which found the less frequent
-237 T variant drove a 1.6 fold increase in promoter activity as compared to the more
common C variant (Donninger et al., 2004).
However, when the promoter constructs were transfected into THP-1 cells, the -237 C
variant resulted in a greater transcriptional enhancement compared to the -237 T variant
with all promoter regions tested (Section 6.3.2.4.3). This finding is also consistent with
reporter studies assessing the effect of the -237C/T polymorphism in THP-1 and U937
cells (Zaahl et al., 2004). Furthermore, it was found that the transcriptional
enhancement occurring in the presence of the -237 C variant, compared to the T variant,
was independent of the (GT)n microsatellite repeat. This is consistent with the results of
the Z-Hunt analysis, which showed that the -237C/T polymorphism did not alter the
ability of the (GT)n microsatellite to form Z-DNA and suggests that the -237C/T
polymorphism may modulate SLC11A1 expression by altering transcription factor
binding to the region. However, in silico analysis of the sequence at the -237C/T
polymorphism found that the region was not highly conserved (Section 6.3.1.2 and
6.3.1.3) and did not identify any potential TFBS, which would potentially recruit
transcription factors to the region of the polymorphic site (Section 5.3.1.4.3). This
suggests that substitution of C to T does not result in the loss of a transcriptional
element that could explain the drop in promoter activity observed.
While no elements for the recruitment of transcription factors were lost at the location
of the -237C/T polymorphism, TFBS searches did identify the formation of a new
element for the recruitment of the ubiquitously expressed transcription factor, octamer
binding protein 1 (Oct-1, also known as POU2FI), when the common -237 C variant
was substituted with the T variant (Section 5.3.1.4.3) (Figure 6.24). The formation of
this TFBS is in agreement with the findings of Donninger et al. (2004) and binding of
257
this transcription factor may explain the increased promoter activity observed in the
presence of the less frequent -237 T variant, compared to the C variant, in 293T cells.
The Oct1 site is 89bp upstream of an identified Sp1 site (Richer et al., 2008) (Figure
6.24) and direct protein interaction of promoter bound Oct1 and Sp1 have been shown
to regulate (and increase) transcriptional activity (Strom et al., 1996, Zwilling et al.,
1994).
The decrease in SLC11A1 promoter activity observed in the presence of the -237 T
variant, compared to the C variant, in THP-1 cells, may also be due to the binding of
Oct-1 to this site (Figure 6.24). While the introduction of this sequence element may
enhance promoter activity in 293T cells, the recruitment of Oct-1 in monocytic cells,
may out-compete/inhibit binding of other transcription factors located in adjacent DNA
regions important in SLC11A1 expression, thus resulting in the observed decrease in
SLC11A1 expression. For example Oct-1 binding at the site of the -237C/T
polymorphism, in the presence of the -237 T variant, may inhibit the recruitment of a
transcription factor to the site E6M2 (Richer et al., 2008) thereby lowing the promoter
activity.
6.4.5 Conclusion
This study has functionally analysed the SLC11A1 promoter to determine the
mechanisms of transcriptional regulation and the way in which promoter variants
function to modulate differential expression of SLC11A1. The study was completed
using an integrated approach, where bioinformatic analyses were first completed to
identify putative transcriptional regulatory elements (Chapter 5, Part 1). Based on the
findings of the bioinformatic analyses, promoter constructs of varying lengths were
designed to functionally test the elements identified in silico (Chapter 5, Part 2). The
promoter activities of the prepared constructs were tested using the human cell lines,
293T and THP-1 (Chapter 6, Part 3). Figure 6.25 displays a summary of the findings
from the in silico and functional analyses of the SLC11A1 promoter.
The current study has identified a 581bp region of the SLC11A1 promoter that was
involved in transcriptional enhancement of SLC11A1 in monocytic cells (-532 to +49)
(Figure 6.25). Furthermore, within this region, a 148bp minimal promoter region (-99 to
Figure 6.25 Summary of the putative mechanisms of SLC11A1 expression and location of experimentally determined transcription factors. The
transfection of the promoter constructs into THP-1 cells suggested that a 581bp region was involved in expression of SLC11A1 in monocytic
cells. Within this region a 148bp region was identified as the minimal promoter region and the site for the formation of the basal transcriptional
complex. Initiation of the formation of the basal complex appears to be due to Sp1 and C/EBP binding to the minimal promoter region which
directly interact with TBP and TAF’s to mediate TFIID formation and then subsequent recruitment of the basal transcriptional complex. The
SLC11A1 promoter region from -532 to -362 exerted the greatest transcriptional enhancement over SLC11A1 expression. Within this region,
combined binding of transcription factors, IRF-8 and PU.1 to an IECS element, are the likely candidates to mediate the increase in expression
observed. Also identified within this region is a putative site for IRF-1 binding. A putative monocytic specific factor, binding within the 8D
region (-362 to -197), was identified as the mechanism controlling the differential level of SLC11A1 expression in monocytic cells. WeederH
analysis of the SLC11A1 promoter identified several high scoring elements, however transcription factor binding site searches could not identify
putative elements recruited to the identified elements (factors X and Y located at elements with scores 18.80 and 16.91).
258
258
259
+49) was identified, which contained the core elements for the formation of the basal
transcriptional complex. This study is the first to analyse the 5’UTR and first intron of
SLC11A1, showing that this region does not contain core elements essential for
transcription initiation. The current findings suggest that SLC11A1 transcription is
initiated by a mechanism different to that observed for canonical promoters (i.e. not
through TATA, Inr or DPE elements), with the formation of the basal transcriptional
complex putatively mediated by the transcription factors, Sp1 and C/EBP, which
directly interact with TAFs to recruit other core proteins, allowing transcription of
SLC11A1 to occur (Figure 6.25). Additionally, the current analysis has identified a
170bp region (-532 to -362), upstream of the (GT)n microsatellite repeat, which has the
greatest transcriptional enhancement on SLC11A1 promoter activity. Within the 170bp
region, a novel IECS element, for the combined recruitment of IRF8 and PU.1, was
identified as the candidate responsible for the increased promoter activity observed
(Figure 6.25).
Analysis of promoter constructs containing the SLC11A1 promoter regions cloned in the
forward and reverse orientation determined that the SLC11A1 promoter could mediate
bidirectional transcription. However, the functional significance of bidirectional
transcription at the SLC11A1 locus is currently unclear. Such bidirectional transcription
may mediate the expression of a putative regulatory transcript or may produce a cryptic
unstable transcript, which is rapidly degraded.
This study is the first to show that the ability of the (GT)n alleles to differentially
modulate SLC11A1 expression, in monocytes, is not attributable to their differing
abilities to form Z-DNA. Rather, differential expression is due to monocyte-specfic
factor(s), binding to a 165bp region of the SLC11A1 promoter (-362 to -197) (Figure
6.25). Furthermore, it is hypothesised that removal of this monocyte-specific factor
would result in (GT)n allele 2 driving a higher level of SLC11A1 expression than allele
3, as predicted by the in silico Z-Hunt analysis and determined by the analysis of
promoter constructs in 293T cells.
Additionally, this study is the first to show that differences in SLC11A1 expression,
mediated by the -237C/T polymorphism, occur independently of the (GT)n
microsatellite repeat, suggesting that the -237C/T polymorphism alters an element for
260
the recruitment of a transcription factor. While no TFBS were identified over the site of
the polymorphism in the presence of the common -237 C variant, it is hypothesised that
the introduction of a sequence element and recruitment of the transcription factor, Oct1, in the presence of the -237 T variant, may out compete/inhibit binding of another
transcription factor, resulting in the loss of SLC11A1 expression observed in monocytic
cells (Figure 6.25).
Therefore, through the combined in silico analysis and the subsequent design,
production and analysis of promoter constructs, the current study has been able to
determine the mechanism by which SLC11A1 is regulated at the level of transcription
initiation and furthermore, has elucidated a mechanism which explains the variation in
SLC11A1 expression mediated by polymorphic variants within the SLC11A1 promoter.
The work completed in this study will ultimately help to determine the mechanism by
which SLC11A1 and the functional promoter polymorphisms confer
susceptibility/resistance to infectious, autoimmune and other diseases.
261
6.5 Future Directions
6.5.1 Assessment of the Minimal Promoter Region to
Determine the Location of Core Elements
Future work will further characterise the identified 148bp minimal promoter region, to
determine the exact location of core elements involved in the formation of the basal
transcriptional complex and to elucidate the precise mechanism of transcription
initiation. This would involve site-directed mutagenesis of the SLC11A1 promoter
constructs, to introduce base substitutions in identified putative core elements to
determine their functional significance. Electrophoretic mobility shift assays (EMSA)
and chromatin immunoprecipitation assays could be used to assess the interaction of
transcription factors, Sp1 and C/EBP, with the minimal promoter region. Furthermore,
the role of Sp1 and C/EBP in transcription initiation could then be further assessed by
co-transfection of reporter constructs with plasmids expressing the Sp1 and C/EBP
proteins to test the putative mechanism of transcription initiation.
6.5.2 Analysis of the 170bp Promoter Region Driving High
Promoter Activity
The current study identified that high promoter activity occurred in the presence of a
170bp region of the SLC11A1 promoter, located from -532 to -362 (Section 6.3.2.4.1).
Further work will be aimed at determining the location of transcriptional element(s)
within this region through the use of in vivo footprinting. Chromatin
immunoprecipitation assays and EMSAs could be completed to determine the identity
of transcription factors recruited to protected sites identified from the in vivo
footprinting assays. Furthermore, site directed mutagenesis of the identified IECS
element, for the recruitment of the transcription factors, IRF-8 and PU.1, within the
SLC11A1 promoter constructs may determine what role this candidate element plays in
SLC11A1 expression in monocytes. Co-transfection of reporter constructs with plasmids
expressing the identified transcription factors could be competed to determine what
effect the factors, binding within the identified 170bp promoter region, exert on
SLC11A1 promoter activity.
262
6.5.3 Determination of the Monocyte-Specific Transcription
Factor Interacting with Allelic Variants to Modulate
Differential Levels of SLC11A1 Expression
Another future direction will be to determine the monocyte-specific factor(s) which
interact with variants of the (GT)n microsatellite repeat, within a 165bp region of the
promoter, to mediate differential levels of SLC11A1 promoter activity (Section 6.4.4.1).
In 293T cells, a higher promoter activity was observed in the presence of allele 2, as
compared to allele 3, which was consistent with the prediction of the Z-Hunt analysis,
while allele 3 drove an increased promoter activity in monocyte-like (THP-1) cells,
compared to allele 2. It is hypothesised, that in the absence of the monocyte-specific
factor(s), the promoter activity of allelic variants at the (GT)n microsatellite repeat in
monocytic cells would be consistent with the predicted promoter activity observed in
non-monocytic (293T) cells and identified by Z-Hunt analysis (i.e. allele 2 drives higher
promoter activity as compared to allele 3). Therefore, site directed mutagenesis of
reporter constructs at putative elements within the identified 165bp promoter region
could be completed to determine the location of elements, which result in a higher
promoter activity of allele 3 compared to allele 2 when promoter assays are completed
in monocytic cells. Furthermore, chromatin imunoprecipitation assays and EMSAs
could be completed to determine the identity of the monocyte-specific transcription
factor(s).
Validation of the identification of the monocyte-specific transcription factor(s), which
interact with the (GT)n alleles to mediate differential SLC11A1 promoter activity, could
be completed by several methods. Firstly, co-transfection of the different promoter
constructs containing (GT)n allele 2 or allele 3, with or without plasmids expressing the
identified transcription factor(s), would be transfected into non-monocytic (293T) cells.
If the identified transcription factor was responsible for the observed differences in
promoter activity, then in the presence of the plasmid expressing the monocytic
transcription factor, (GT)n allele 3 would mediate higher promoter activity compared to
allele 2, while in the absence of the monocyte transcription factor, allele 2 would
mediate higher expression. Alternatively, RNA interference in monocytic cells, to
knockdown the expression of the identified monocytic transcription factor, should result
in (GT)n allele 2 driving a higher promoter activity as compared to allele 3.
263
6.5.4 Analysis of Sequence Elements Identified by the
WeederH Analysis
The WeederH program has a high predictive ability in locating elements for
transcription factor binding (Section 5.3.1.6) (Pavesi et al., 2007). Therefore, further
work should aim to determine if the high scoring elements, identified in the current
study, do in fact modulate SLC11A1 expression through the recruitment of transcription
factors. In particular, no transcription factor binding sites were located to bind at the site
of the third and fourth highest scoring elements (18.80 and 16.91), located at 177bp
upstream the transcription start site and in the first intron of SLC11A1, respectively
(Figure 6.25, Factors X and Y). Site-directed mutagenesis of promoter constructs at the
high scoring WeederH elements will determine if these sites function to mediate
SLC11A1 expression in monocytic cells. If these sites do not play a role in monocytic
cells then they may function to mediate SLC11A1 expression at another stage of cellular
differentiation or activation.
6.5.5 Analysis of the Mechanisms of SLC11A1 Transcription
at Different Stages of Monocyte/Macrophage Differentiation
and Stimulation
The current study has identified important promoter regions involved in SLC11A1
transcription initiation, and furthermore, the mechanisms by which the allelic variants
within the SLC11A1 promoter are able to alter SLC11A1 expression, specifically in
undifferentiated and unstimulated monocyte-like cells (THP-1). Therefore, only
transcriptional information at the monocytic stage of cell development was determined.
The level of SLC11A1 expression changes at different stages of the monocyte and
macrophage differentiation process, in which SLC11A1 expression increases as the cells
gain greater phagocytic ability (Figure 1.3). The level of SLC11A1 is further modulated
after the classical activation of macrophages and also upon exposure to EPO (Soe-Lin et
al., 2008). Concomitant with the changes in SLC11A1 expression, would also be
alterations in the milieu of transcription factors. Therefore, the transcription factors
which regulate expression of SLC11A1 in monocytes, as analysed in this study, may not
play a role in SLC11A1 expression at other stages of cellular differentiation and
264
activation. For example, binding of HIF-1α to the SLC11A1 promoter only occurs after
cytokine stimulation or induction of phagocytosis (Bayele et al., 2007) (Section
6.4.4.1).
Therefore, the designed constructs used in the current study, containing different
SLC11A1 promoter regions and the common polymorphisms, could be transfected into
THP-1 cells at different stages of differentiation or activation, to determine the location
of elements for the recruitment of transcription factors which mediate SLC11A1
expression at that time point. Additionally, it has been found that upon IFN-γ and LPS
stimulation, SLC11A1 expression is downregulated in the presence of (GT)n allele 2 (as
compared to IFN-γ alone), while an increase in SLC11A1 expression is observed in the
presence of allele 3 (Figure 1.8). It is hypothesised that the expression differences are
due to the juxtaposition of IFN-γ and LPS response elements which are affected by the
microsatellite repeat length (Searle and Blackwell, 1999). Therefore, the promoter
constructs may provide a way to locate these elements.
6.5.6 Validation of Novel Sequence Variants of the SLC11A1
Promoter Identified During the Preparation of the Promoter
Constructs
Validation of the promoter constructs by sequencing resulted in the identification of
novel sequence variants, with two putative single point mutations detected, one in the
promoter region (designated -2578A/C), and another 128bp downstream of the
transcription start site (+128G/A) (Section 5.3.2.6). Each of the variants was only
identified once, therefore, further sampling and sequencing is required to validate these
sequence variants and determine their frequencies. Additionally, three novel variants of
a previously identified G(T)n repeat (rs13035487) were also identified, bringing the total
number of variants identified at this site to five. Additional sampling and sequencing is
required to validate the observed LD identified between repeat lengths at the G(T)n
repeat and the SLC11A1 promoter (GT)n microsatellite repeat (Section 5.3.2.6).
265
CHAPTER 7 - META-ANALYSES ASSESSING
THE ASSOCIATION OF SLC11A1
POLYMORPHISMS WITH THE
OCCURRENCE OF AUTOIMMUNE AND
INFECTIOUS DISEASE
266
7.1 INTRODUCTION
SLC11A1 expression is restricted to macrophages where it plays a major role in the
elimination of macrophage-tropic pathogens by initiating and perpetuating a Th1 proinflammatory immune response. While murine models show a strong correlation
between the expression of functional Slc11a1 with both resistance to macrophage-tropic
pathogens and susceptibility to autoimmune disease (Govoni et al., 1996, Kissler et al.,
2006, Malo et al., 1994, Vidal et al., 1995), studies analysing the association of
SLC11A1 with disease incidence in humans have produced inconsistent results (Sections
1.3.4.1 and 1.3.4.2). This inconsistency is attributable, in part, to the absence of a
naturally occurring polymorphism within the human SLC11A1 locus, which produces a
functionally null protein (Vidal et al., 1996). Rather, polymorphisms that alter the levels
of functional SLC11A1 expressed have been described (Section 1.2).
Of the SLC11A1 polymorphisms identified to date, the polymorphic (GT)n
microsatellite repeat has been shown to alter the level of SLC11A1 expressed (Section
6.3.2.4.3) (Searle and Blackwell, 1999, Zaahl et al., 2004), and is therefore, a strong
candidate for influencing disease incidence. Several alleles of different repeat length
have been identified, with (GT)n allele 2 resulting in lower SLC11A1 expression
compared to the more commonly occurring (GT)n allele 3. It has therefore been
hypothesised that allele 3 would provide protection against infectious disease by driving
high SLC11A1 expression and a resultant Th1 mediated immune response. However,
allele 3 would also be associated with susceptibility to Th1-mediated autoimmune
diseases.
Over 110 association studies, which aimed to assess the association of different
SLC11A1 polymorphisms (Figure 7.1) with the incidence of infectious,
autoimmune/inflammatory and other diseases, have been conducted to date. These
studies have shown inconsistent results, which are largely attributable to the small
sample sizes of the individual studies that lack the statistical power to determine
bonafide associations. Furthermore, studies with small sample sizes also have a
tendency to over report allele frequencies (Section 1.3.5). Other reasons for the
inconsistent findings could be due to population stratification or publication biases.
267
0
1
Polymorphism
SNP ID
rs#
(GT)n
Allele 2
(GT)n
Allele 3
rs534448891
rs57811024
1
2
2
3
3
4 4a
4
5
6
7
5 6 78
8
9
9
10
10 11
11
12
12
13 14
13
14kb
15
-237C/T
274C/T
469+14G/C
(INT4)
577-18G/A
823C/T
1029C/T
(A318V)
1465-85G/A
1730G/A
(D543)
1729+55del4
(TGTG)
1729+271del4
(CAAA)n
rs7573065
rs2276631
rs3731865
rs3731864
rs17221959
rs118133351
rs2279015
rs17235409
rs17235416
rs17229009
Figure 7.1 Location of SLC11A1 polymorphisms analysed in the meta-analysis.
Associations between the occurrence of these polymorphisms and the incidence of
autoimmune/inflammatory, infectious disease and tuberculosis alone was analysed by a
meta-analysis. The 15 exons of the gene are shown as black boxes with their respective
numbers. The corresponding scale above indicates the length (kb) of the gene. The grey
boxes indicate the 3’ and 5’ untranslated regions and the introns and flanking regions
are represented by a thin line. The arrows indicate the position of sequence variants.
Below each polymorphism is the reference SNP (rs#) identification number.
The aim of the present study was to use meta-analyses to determine the association of
SLC11A1 polymorphisms with the incidence of infectious and autoimmune disease
(Figure 7.1). A meta-analysis is a powerful tool which combines individual association
studies to determine the strength of an association. By pooling the individual association
studies, a meta-analysis increases the sample size, which therefore increases the
statistical power to determine the magnitude of associations.
The current meta-analysis was undertaken for several reasons. Firstly, there has been at
least a doubling in the number of case control association studies (and in some cases a
3-4 fold increase) that have been completed since the previously published metaanalysis of the association of SLC11A1 polymorphisms with pulmonary tuberculosis
infection (Li et al., 2006) and with autoimmune/inflammatory diseases (Chapter 3)
(Nishino et al., 2005, O'Brien et al., 2008). This represents a significant increase in the
number of studies to be included (or eligible for inclusion) in the meta-analysis, which
will increase the likelihood of identifying associations, or the lack thereof, between
SLC11A1 polymorphisms and disease incidence. Secondly, the current meta-analysis
assessing the association of SLC11A1 polymorphisms with infectious disease incidence
has been more inclusive (as all infectious diseases, except HIV, were included in the
268
analysis) compared to the previous meta-analysis, which only assessed pulmonary
tuberculosis publications (Li et al., 2006). The aforementioned analysis included 14
publications assessing pulmonary tuberculosis, while the current analysis includes 26
studies assessing the association of SLC11A1 polymorphisms with infectious disease,
published during the same time period (1998-2004), and 59 publications all together
(1995-2010).
Additionally, this meta-analysis assessed a number of polymorphisms, within the
SLC11A1 gene, for which meta-analyses to determine disease association had not been
previously performed. This study is the first to assess the association of polymorphisms
other than the (GT)n promoter repeat with the occurrence of autoimmune disease. The
current analysis includes the assessment of a further 10 polymorphisms, which could
not be previously analysed as there were insufficient association studies to enable a
meta-analysis to be completed (O'Brien et al., 2008). This analysis is also the first to
assess the association of (GT)n allele 2, the -273C/T, 274C/T, 1465-85G/A and
1729+271del4 polymorphisms with the incidence of infectious disease or tuberculosis
alone. Overall, the present study constitutes the largest and most inclusive meta-analysis
of SLC11A1 polymorphisms with the incidence of infectious and autoimmune diseases
conducted to date.
269
7.2 METHODS
7.2.1 Criteria for Study Inclusion
Publications included in the meta-analysis were identified by searching literature
databases (PubMed, Medline and Ovid) using the search terms “SLC11A1”,
“NRAMP1”, “autoimmunity”, “inflammation”, “tuberculosis” and “infection”,
individually and in combination using the Boolean characters "OR" or “AND”.
Additional papers were sourced by cross-referencing original and review publications.
Inclusion criteria for the meta-analysis were that studies assessed SLC11A1
polymorphisms in patients diagnosed with a specific autoimmune/inflammatory or
infectious disease and used non-familial subjects as controls. Furthermore, all
publications included in the meta-analyses had to assess HIV negative cases and
controls.
Information regarding the disease studied, the population analysed and the study
findings was extracted from all publications meeting the inclusion criteria. Total study
numbers (individuals and alleles) and allelic frequencies (numbers and percentages)
were also tabulated for all relevant datasets within a publication. When a publication
contained several datasets/associations for a single polymorphism, each dataset was
assessed as an individual association when the populations/diseases were different
between the datasets. Alternatively, data were pooled if the same population/disease
was analysed. Allele frequencies were inferred when genotype frequencies were
reported. In the few cases where carrier frequencies were reported, the genotype
frequencies were first determined and then allele frequencies were inferred (as
described in Appendix 2). Corresponding authors were contacted by email if the
information to determine the odds ratio (OR) was unavailable or if the published data
was ambiguous. When publications assessed specific SLC11A1 polymorphisms, but
concluded that an analysis was not completed due to a low frequency of the less
commonly occurring variant, the data was omitted from the analysis. The data extracted
from all publications satisfying the inclusion criteria for the meta-analysis was
reanalysed to ensure that the extracted data was correct. Only polymorphisms that had
been investigated in five or more individual association studies were included in the
analysis. The only exception was the analysis of the association of the 1729+271del4
270
[(CAAA)n] polymorphism with the incidence of autoimmune disease, which included
only three associations. Where a large number of datasets were available for a particular
polymorphism, smaller meta-analyses were completed, where possible, analysing the
association of individual diseases (for example T1D, tuberculosis) or geographical
location with the SLC11A1 polymorphisms. In these cases analyses were performed
from as many as two association studies.
Although nine SLC11A1 promoter microsatellite (GT)n alleles have been identified to
date, seven of these alleles (alleles 1 and 4-9) occur at extremely low frequencies
(Table 1.3). Therefore, association studies have focused on the association of the
common alleles (alleles 2 and 3), which have a combined allele frequency of greater
than 95%, with disease incidence. Meta-analyses of both (GT)n allele 3 and allele 2
were completed to determine the association of these alleles with the incidence of
autoimmune/inflammatory and infectious disease. For the analysis of allele 3, the
frequency data for alleles 1, 2 and 4-9 were pooled and compared against the frequency
of allele 3. Likewise, for the analysis of allele 2, the frequencies of alleles 1 and 3-9
were pooled and compared against the frequency of allele 2.
7.2.2 Statistical analysis
The program R (R Core Development Team, 2008) was used to perform the statistical
analysis utilising the program Rmeta (Lumley, 2009). Data tables, containing the
number of cases and controls and allele frequencies, were created in Microsoft excel
and saved in .csv format which can be recognised by R. Figure 7.2 shows the
methodology used to analyse the individual datasets. Using the relevant data sets, the
OR and 95% confidence intervals (CI) were determined for each individual association
included in each of the meta-analyses.
The combined association of a polymorphism with autoimmune or infectious disease
incidence, from the individual associations, was completed by the determination of a
pooled OR estimate. The fixed-effects pooled OR estimate (Mantel-Haenszel method)
was first determined (Figure 7.2). A pooled OR estimate of 1 indicates a lack of
association between the polymorphism of interest and the disease state analysed, while a
pooled OR estimate higher or lower than 1 indicates susceptibility or resistance to the
271
disease state analysed, respectively. Furthermore, the fixed-effects pooled OR estimate
was deemed to be significant if the 95% CI did not include 1.
Fixed Effect Pooled OR
Determine Pooled OR
Is the OR significant?
Funnelplot - Publication bias
Is there heterogeneity in the data set?
Yes
No
Logistic Regression
Random Effects Pooled OR
Fixed effect pooled OR
can be used
Does the factor account for
the heterogeneity seen?
Determine Pooled OR
Is the OR significant?
Figure 7.2 Flow chart outlining the methodology used to determine pooled OR
estimates for the association of SLC11A1 polymorphisms with the occurrence of
infectious or autoimmune disease. The fixed effects pooled OR estimate was first
determined. The OR was determined to be significant if the 95% CI did not include 1. If
heterogeneity was identified in the dataset, as determined by the Cochran Q test, then
the random effects pooled OR estimate was completed and the underlying cause of the
heterogeneity was assessed by logistic regression. The funnel plot was used to assess for
bias within the dataset.
The fixed-effects OR has an underlying assumption that the individual ORs from each
dataset included in the meta-analysis are homogenous (i.e. all publications report the
same findings with regard to the association being assessed). When analysing a number
of studies in a meta-analysis, ideally, all variables would be consistent across studies.
For example, consistency with respect to diagnostic criteria for the inclusion of cases,
criteria for the selection of controls and population background, infers that the outcome
measured for each study (in this case the OR) would be consistent across studies, which
are combined to determine the overall association. Therefore, the pooled OR estimate
reflects only the effect of the association being analysed, and is not attributable to
272
additional variables which are not consistent across all populations analysed (Berman
and Parker, 2002).
The Cochran Q test was utilised to determine whether heterogeneity was present in the
analysed data set and was completed in association with the determination of the fixedeffects pooled OR estimate. The null hypothesis of the Cochran Q test is that the studies
included are heterogeneous. Therefore, a p-value less than 0.05 (or a Chochran Q value,
which is greater than the degrees of freedom of the analysis) indicates the existence of
heterogeneity within the studies included in the meta-analysis. If the Cochran Q test
revealed that heterogeneity was present, then the fixed-effect pooled OR estimate was
not used as the underlying assumption of homogeneity was not satisfied (Figure 7.2). In
this case, the random-effects pooled OR estimate (DerSimonian-Laird method), which
differs from the fixed-effect model in that there is no underlying assumption of
homogeneity within the dataset, was used to determine the pooled OR. The randomeffects pooled OR estimate was deemed significant if the 95% CI did not include 1
(with a p-value of less than 0.05).
Pooled OR estimates are a weighted method, which takes into account the sample size
of the individual studies. Larger studies have a greater influence over the pooled OR
estimate, and therefore, inclusion of studies with very large sample sizes, as compared
to the other studies in the analysis, may bias the pooled OR estimate. To assess the
influence of studies with large sample sizes, pooled OR estimates were determined in
the presence and absence of the large study. Additionally, funnel plots (Section 7.2.3)
were analysed to determine if the OR estimate was reflective of all publications. Where
a large sample size study was found to exert significant bias over the pooled OR
estimate (i.e. the reversal of the direction of the pooled OR estimate), the large
publication was omitted from the analyses.
7.2.2.1 Determination of the Source of Heterogeneity using Logistic
Regression Analysis
If significant heterogeneity of ORs was identified within a dataset when the fixedeffects pooled OR estimate was calculated, logistic regression analysis was used to
explore the cause of the observed heterogeneity, provided the number of publications
included in the analysis were sufficiently large. Logistic regression analysis was
273
conducted using the program R to determine if the observed heterogeneity was
attributable to the ethnic/geographical location of the population analysed or the range
of diseases assessed. To assess for heterogeneity due to the disease analysed,
comparable diseases were grouped. For the analysis of autoimmune disease, the
publications assessing inflammatory bowel disease, ulcerative colitis and Crohn’s
disease were collectively classified as inflammatory bowel disease; while rheumatoid
arthritis and juvenile rheumatoid arthritis were classified as rheumatoid arthritis. For the
analysis of infectious disease, individual studies were separated into four groups:
tuberculosis, leprosy, M. avium and other. To assess heterogeneity due to the
ethnicity/geographical location of the population, datasets were classified as Asian,
African, European, Mediterranean and South American. If the p-value was less than
0.05, then the heterogeneity was deemed attributable to differences in ORs across the
grouping analysed (i.e. due to the diseases or ethnicities analysed).
7.2.3 Detection of Bias using the Funnel Plot
The data sets used for the meta-analyses were also assessed for bias through the use of a
funnel plot. A funnel plot is a graphical representation (scatter plot) of the sample size
versus ORs (logOR). Therefore, an OR of one (i.e. no association) equates to zero on
the funnel plot and each point on the plot represents a single association. Due to the
ability of larger studies to more accurately estimate true associations of the variables
tested, the OR estimates of smaller studies are scattered at the base of the funnel plot,
with a narrowing at the top of the plot where the larger studies reside. This produces a
plot, which has an inverted funnel shape, with symmetry of publications on both sides
of the pooled OR estimate (if bias is absent). Bias is present in the dataset when the
funnel plot is asymmetric (gap in inverted funnel shape), and for publication bias, the
gap is usually located at the bottom of the funnel plot, where the smaller studies with
non-significant findings are located (Sterne et al., 2001).
Bias is introduced by a range of factors. Publication bias arises due to a preference to
publish results with significant findings in English based journals, while smaller studies,
with non-significant findings, are either not published or published in smaller (nonEnglish) local journals (Jüni et al., 2002, Sterne et al., 2001). Other sources of bias
could be due to heterogeneity in the data (due to a lack of stringent inclusion criteria) or
274
random variation attributable to chance. When bias exists in the dataset, the pooled OR
estimate can overestimate the true strength of the association.
7.2.4 Continuity Corrections for Zero Observations
Studies which have zero observations for both cases and controls were excluded from
the current meta-analyses, as it has been shown that these studies do not contribute to
the pooled OR estimate (Sweeting et al., 2004). However, studies with a zero
observation in only the case or control frequencies were included. The inclusion of
datasets with zero events (in either the case or control frequencies) to meta-analyses has
been shown to decrease heterogeneity within a dataset and reduce the confidence
interval of the pooled OR estimate (Friedrich et al., 2007). To allow the inclusion of
studies containing zero observations, a continuity correction was added to the
frequencies. The reciprocal of the opposite treatment size method was used to allow
studies with a zero observation to be included. In this method, the reciprocal of the
sample size of the opposite arm was added (i.e. for cases the reciprocal of the control
sample size was added to the case frequencies, while for controls, the reciprocal of the
case sample size was added to the control frequencies). The use of the reciprocal of the
opposite treatment arm size provides a more conservative estimate, which does not bias
the pooled OR estimate compared to other methods such as the addition of a standard
constant (i.e. 0.5) (Sweeting et al., 2004).
275
7.3 RESULTS
A total of 34 and 59 publications, which determined the association of SLC11A1
polymorphisms with the incidence of autoimmune/inflammatory and infectious disease,
respectively, met the criteria for inclusion into the meta-analyses (Appendix 3 and 4).
From the 34 identified publications of autoimmune/inflammatory disease, 11 SLC11A1
polymorphisms had been investigated in a sufficient number of association studies to
warrant completion of a meta-analysis (a total of 162 associations) (Table 7.1), while 8
polymorphisms, from the 59 publications investigating infectious disease, had a
sufficient number of association studies completed to be included (224 associations in
total). Table 7.1 summarises the number of publications and datasets for each
polymorphism, the number of datasets analysed after the exclusion of publications
(Appendix 5-9), and the number of cases and controls. The literature search identified a
greater number of SLC11A1 polymorphisms, where association studies assessing the
incidence with autoimmune and infectious disease had been completed, however, the
number of data sets for these polymorphisms were insufficient to complete a meaningful
meta-analysis.
Table 7.1 Summary of Identified Publications, Datasets Analysed and Number of Cases
and Controls.
Polymorphism
(GT)n Allele 3
(GT)n Allele 2
-237C/T
274C/T
469+14G/C
577-18G/A
823C/T
1029C/T
1465-85G/A
1730G/A
1729+55del4
1729+271del4
Autoimmune Disease
Publications*
Datasets
30
30
7
9
14
6
8
8
9
16
16
3
32
32
9
9
14
6
8
8
9
16
16
3
#
Analysed
29
29
9
9
14
5
8
4
8
15
14
3
†
Infectious Disease
#
†
Cases
Control
Publications*
Datasets
Cases
Control
10932
11210
6371
6546
10122
711
922
949
6342
7050
10116
480
11023
10969
6963
7074
12006
691
952
873
6639
7588
11340
309
29
29
7
10
39
29
29
7
12
43
24
18
5
11
39
4497
2837
380
1726
5490
5175
2683
433
2347
6498
6
42
43
5
7
46
45
6
6
44
43
6
771
5490
6669
868
713
6498
8030
1581
Analysed
*Total number of published studies identified from the literature search meeting the inclusion criteria of the meta-analysis.
#
Total number of datasets from the identified publications for inclusion into the meta-analysis.
†
The number of datasets analysed in the meta-analysis after the removal of datasets containing zero observation for both cases and controls and when data
to determine OR was not forthcoming from corresponding authors.
276
7.3.1 Associations of SLC11A1 Polymorphisms with the
Incidence of Autoimmune Disease
The analysis of SLC11A1 polymorphisms with autoimmune/inflammatory disease
included 11 polymorphisms (Table 7.1) (Figure 7.1). Table 7.2 displays a summary of
the pooled OR estimates for each polymorphism (Section 7.2.2).
As part of a larger study of the association of six previously identified T1D
susceptibility genes, Maier et al. (2005) completed a case control association study of
several SLC11A1 polymorphisms with T1D. However, the paper did not provide allele
frequencies of cases and controls. Correspondence with the authors resulted in the
receipt of a more comprehensive analysis (Yang et al., unpublished), which assessed an
extended sample size, and accordingly, the Maier et al. (2005) paper was excluded from
all meta-analyses. Care was taken to incorporate the Yang et al. (unpublished) study
into the individual meta-analyses of SLC11A1 polymorphisms, due to the large sample
sizes analysed in this study (which ranged from 5498-10611 individual cases or
controls) (Section 7.2.2), which could bias the estimated pooled OR.
277
Table 7.2 Meta-analyses of the Association of SLC11A1 Polymorphisms with the
Incidence of Autoimmune/Inflammatory Disease.
Polymorphism
Association
Fixed-Effects Pooled OR
Absence of Yang † Cochrane Q test
Complete dataset Cochrane Q test
Random-Effects
Significance
(GT)n Allele 3
Autoimmune/autoinflammatory
Autoimmunity
1.07 (1.03-1.12)
1.08 (1.03-1.13)
82.59 (P=0)
75.13 (P=0)
1.09 (1.01-1.18)
82.42 (P=0)
1.08 (0.96-1.21)
1.11 (0.98-1.26)
P=0.22
P=0.09
(GT)n Allele 2
Autoimmune/autoinflammatory
Autoimmunity
0.93 (0.89-0.97)
0.93 (0.89-0.97)
59.01 (P=0)
54.73 (P=0)
0.91 (0.83-0.99)
58.73 (P=0)
0.92 (0.83-1.03)
0.90 (0.81-1.00)
P=0.22
P=0.06
-237C/T
Autoimmunity
IBD
0.92 (0.83-1.02) 12.43 (P=0.13)
0.60 (0.43-0.84)** 5.82 (P=0.32)
0.61 (0.46-0.81)** 5.87 (P=0.55)
274C/T
Autoimmunity
0.97 (0.92-1.03)
18.41 (P=0.02)
1.25 (1.07-1.47)** 7.50 (P=0.38)
469+14G/C
Autoimmune/autoinflammatory
0.93 (0.89-0.97)
58.92 (P=0)
1.37 (1.18-1.59)
31.09 (P=0.02)
1.32 (1.03-1.71)*
P=0.02**
577-18G/A
Autoimmunity
0.74 (0.50-1.09)
2.87 (P=0.58)
N/A
N/A
823C/T
Autoimmunity
0.90 (0.75-1.08)
23.71 (P=0)
N/A
N/A
1.02 (0.67-1.56)
P=0.93
1029C/T (A318V)
Autoimmunity
0.48 (0.21-1.11)
1.57 (P=0.67)
N/A
N/A
1465-85G/A
Autoimmunity
0.98 (0.93-1.03)
10.97 (P=0.14)
1.11 (0.95-1.29)
8.19 (P=0.22)
1730G/A
Autoimmune/autoinflammatory
Autoimmunity
1.23 (1.09-1.39)
1.25 (1.10-1.41)
46.48 (P=0)
45.33 (P=0)
1.23 (1.04-1.45)
1.26 (1.05-1.49)
46.49 (P=0)
45.29 (P=0)
1.15 (0.84-1.58)
1.17 (0.83-1.66)
P=0.39
P=0.37
1729+55del4
Autoimmune/autoinflammatory
Autoimmunity
1.10 (0.98-1.25)
1.10 (0.98-1.25)
29.36 (P=0.01)
29.25 (P=0)
0.97 (0.80-1.17)
0.96 (0.80-1.16)
26.16 (P=0.01)
25.43 (P=0)
1.17 (0.83-1.64)*
1.17 (0.82-1.67)*
P=0.37
P=0.38
1729+271del4
Autoimmunity
0.98 (0.80-1.22)
1.79 (P=0.41)
N/A
N/A
Bolded pooled OR estimates represent the final pooled OR estimate for the association of the SLC11A1 polymorphism.
†
Pooled OR estimate with the omission of the large sample sized Yang et al . (unpublished) study.
N/A - The publication did not assess this polymorphism.
*Random-effects OR determined in the absence of Yang et al . (unpublished).
**Statistically significant
278
7.3.1.1 Association of the (GT)n Promoter Alleles with the Incidence of
Autoimmune/Inflammatory Disease
Meta-analyses were completed for both (GT)n allele 3 and allele 2 to determine the
association of these variants with the incidence of autoimmune/inflammatory disease
(Section 7.2.1). Of the 32 datasets identified from literature searches, 29 datasets were
included in the meta-analysis (Appendix 5a and 5b). The meta-analyses of (GT)n allele
3 and allele 2 showed a marginal trend towards susceptibility and resistance to
autoimmune/inflammatory disease incidence, with pooled OR estimates of 1.08 and
0.92, respectively (Table 7.2). However, the CI interval of both estimates included 1,
indicating that neither (GT)n allele 2 or 3 are associated with the incidence of
autoimmune/inflammatory disease (Table 7.3). Re-analysis of the pooled OR estimate,
omitting the study conducted by Yang et al. (unpublished), resulted in little change in
the observed OR estimate, showing that the large study did not bias the pooled OR
estimate, and therefore, this large study was retained in the analyses (Table 7.2) (Section
7.2.2). Furthermore, analysis of the funnel plots from the meta-analysis of (GT)n allele 2
and 3 with autoimmune/inflammatory disease did not indicate bias within the datasets
(Figure 7.3).
Figure 7.3 Funnel plots of the meta-analyses assessing the association of the (GT)n
alleles with the incidence of autoimmune/inflammatory disease. (A) Allele 3. (B) Allele
2. The dashed lines indicate the location of the random-effects pooled OR estimate.
279
7.3.1.1.1 (GT)n Allele 2 is Associated with Marginal Protection Against the
Occurrence of Autoimmune Disease
Further analysis was completed by assessing the association of SLC11A1 (GT)n allele 2
and 3 with autoimmune diseases only. Behçet’s disease is a systemic vasculitis of
unknown aetiology, characterised by relapsing ulcers/lesions. Unlike the other diseases
assessed in the meta-analyses, Behçet’s disease does not exhibit the classical features of
autoimmune disease and is described as an autoinflammatory disease (an inherited
disorder of inflammatory attacks of innate nature) (Direskeneli, 2006, Mendes et al.,
2009). Therefore, the association of the (GT)n alleles was completed using only the
association studies analysing autoimmune diseases.
Re-analysis of the pooled OR estimate, assessing the association of the (GT)n alleles
with autoimmune disease only, yielded an increased pooled OR estimate for (GT)n
allele 3 of 1.11 with a 95% CI, which just included 1 (0.98-1.26), thereby strengthening
the association of SLC11A1 (GT)n allele 3 with the incidence of autoimmune disease,
however, this value did not reach significance (P=0.09) (Table 7.2). Analysis of the
association of (GT)n allele 2 with the incidence of autoimmune disease resulted in an
OR estimate of 0.90 with a 95% CI which included 1 (0.81-1.00), thus increasing the
strength of the association of allele 2 with protection from the development of
autoimmune disease. However, this putative association was just outside statistical
significance (P=0.06) (Table 7.2).
7.3.1.1.2 The (GT)n Allelic Variants are Associated with the Incidence of
Sarcoidosis and Type 1 Diabetes
Further analysis of the association of (GT)n allele 3 with individual autoimmune
diseases found a significant association with the incidence of both sarcoidosis and T1D
with pooled OR estimates of 1.65 (CI: 1.30-2.08) and 1.07 (CI: 1.01-1.12), respectively
(Table 7.3). Conversely, a significant protective effect was observed when the
association of (GT)n allele 2 with the incidence of sarcoidosis [OR=0.73 (CI: 0.540.98)] and Type 1 diabetes [OR=0.93 (CI: 0.89-0.98)] was analysed (Table 7.3). No
association was observed between (GT)n alleles 2 and 3 and the occurrence of
inflammatory bowel disease, rheumatoid arthritis and multiple sclerosis.
280
Table 7.3 Pooled OR Estimates of the Association of (GT)n Alleles 3 and 2 with
Disease Occurrence and Ethnicity.
Allele 3
Allele 2
Disease
Type 1 diabetes
Sarcoidosis
Multiple sclerosis
Inflammatory bowel disease
Rheumatoid athritis
1.07 (1.01-1.12)**
1.65 (1.30-2.08)**
1.22 (0.80-1.85)
1.05 (0.81-1.37)
1.06 (0.75-1.51)
0.93 (0.89-0.98)**
0.73 (0.54-0.98)**
0.84 (0.53-1.33)
0.91 (0.78-1.06)
0.91 (0.65-1.26)
1.75 (1.19-2.59)**
1.17 (0.97-1.42)
1.10 (0.98-1.24)
0.80 (0.67-0.96)**
0.66 (0.13-3.43)
0.82 (0.67-1.00)
1.06 (0.89-1.26)
0.88 (0.73-1.06)
Ethnicity
African
European
Mediterranean
Asian
**Statistically significant
The difference in (GT)n allele frequencies between different populations has been well
documented (Awomoyi, 2007, Yip et al., 2003). Therefore, further analysis was
completed assessing the association of the allelic variants of the (GT)n repeat, in
individual ethnicities/geographical locations, with the occurrence of autoimmune
disease (Table 7.3).
From these analyses, allele 3 was found to be significantly associated with the onset of
autoimmune disease in African populations, with a fixed-effects pooled OR of 1.75 (CI:
1.19-2.59), and just outside of statistical significance in European and Mediterranean
populations. A significant association of allele 3 with autoimmune disease was also
found in the Asian population, with a fixed-effects pooled OR estimate of 0.80 (CI:
0.67-0.96) (Table 7.3). Surprisingly, this finding, which included 6 datasets, is opposite
to the overall pooled OR trend of the other populations studied. This suggests that in
Asian populations (GT)n allele 3 putatively exerts a protective effect against the
development of autoimmune disease, while in the other populations analysed, allele 3 is
associated with an increased propensity to develop autoimmune disease. No significant
associations were identified from the analysis of allele 2 with autoimmune disease when
data was analysed according to ethnicity (Table 7.3).
281
Ideally, the current meta-analyses would be completed based on the individual
populations and diseases assessed, thereby removing confounding factors which exist
when studies from different populations and diseases are pooled (as in the current metaanalysis). The juxtaposition in the association of different populations with autoimmune
diseases highlights the requirement for the completion of more association studies, with
sufficiently large sample sizes, to allow the study of single diseases and populations
enabling the identification of authentic associations.
7.3.1.2 The -237C/T, 274C/T and 469+14G/C Polymorphisms are
Associated with the Incidence of Autoimmune Disease
The meta-analyses of the -237C/T, 274C/T and 469+14G/C polymorphism included 9, 9
and 14 datasets, respectively (Appendix 6a). When all datasets were assessed for each
polymorphism, the meta-analyses found a non-significant protective effect of the less
frequent variants at the -237C/T, 274C/T and 469+14G/C polymorphisms (Table 7.2).
However, it was found that inclusion of the large Yang et al. (unpublished) dataset
biased the pooled OR estimates (Section 7.2.2). Analysis of the funnel plots for each of
the meta-analyses showed that the dataset from Yang et al. (unpublished) significantly
influenced the pooled OR estimate for each of the polymorphisms by skewing the OR
towards a value of 1 (Figure 7.4). In the -237C/T funnel plot, the large study was the
only dataset located to the right of the OR estimate. In funnel plots showing data for the
274C/T and the 469+14G/C polymorphisms, only 2 out of 9 and 4 out of 14
publications were located to the right of the pooled OR estimate, respectively (Figure
7.4). Therefore, the resultant OR was not representative of the overall trend of all
studies included in the meta-analyses and this large dataset was omitted from the
calculation of the pooled OR estimates for the -237C/T, 274C/T and 469+14G/C
polymorphisms. Re-analysis of the pooled OR estimates in the absence of Yang et al.
(unpublished) resulted in funnel plots which showed no evidence of bias.
Re-analysis of the pooled OR estimate found that the less frequent T variant at the
-237C/T polymorphism exerts a putative protective effect against the occurrence of
autoimmune disease, with a statistically significant pooled OR estimate of 0.61 (CI:
0.46-0.81) (Table 7.2). The less frequent -237 T variant has only been identified in cis
with (GT)n allele 3, where it results in a significant reduction in SLC11A1 expression, to
levels comparable to those expression levels driven by (GT)n allele 2 (Chapter 6)
282
Figure 7.4 Funnel plots of the meta-analyses of the -237C/T (A), 274C/T (B) and
469+14G/C (C) polymorphisms with the occurrence of autoimmune disease. The odds
ratios (logOR) for each study included in the meta-analyses was plotted against its
sample size. The dashed lines indicate the location of the pooled OR estimate when all
datasets were analysed. For each polymorphism, the large Yang et al. (unpublished)
dataset (dot located in the red box) biased the pooled OR estimate.
(Zaahl et al., 2004). Therefore, the identified protective effect of the -237 T variant,
observed in the current meta-analysis, is consistent with functional data suggesting that
this variant would afford protection against autoimmune disease by driving decreased
SLC11A1 expression and concomitant decreased Th1 immune response. Furthermore,
analysis of the association of the -237C/T polymorphism with inflammatory bowel
disease (combined Crohn’s disease and ulcerative colitis) found that the mutant T
variant exerted a putative protective effect over disease onset (OR=0.60) (Table 7.2).
Analysis of the 274C/T and 469+14G/C polymorphisms, omitting the dataset of Yang et
al. (unpublished), resulted in a reversal of the direction of the previously determined
283
pooled OR estimates. In both cases the less frequent variants were associated with the
occurrence of autoimmune disease, with statistically significant pooled OR estimates of
1.25 (CI: 1.07-1.47) and 1.32 (CI: 1.03-1.71) for the 274C/T and 469+14G/C
polymorphisms, respectively.
7.3.1.3 Polymorphisms Within the 3’ Region of SLC11A1 are Not
Associated with the Incidence of Autoimmune Disease
No significant associations were identified between the SLC11A1 polymorphisms, 57718G/A, 823C/T, 1029C/T, 1465-85G/A, 1729+55del4 and 1729+271del4, and the
incidence of autoimmune disease (Table 7.2) (Appendix 6). Again, the large Yang et al.
(unpublished) dataset skewed the pooled OR estimate for the 1465-85G/A and
1729+55del4 meta-analyses, and therefore this dataset was omitted. However, the large
Yang et al. (unpublished) dataset was retained in the meta-analysis of the 1730G/A
(D543N) polymorphisms as no bias was observed, as determined by analysis of the
funnel plot and resultant pooled OR estimates (Section 7.2.2).
Interestingly, all of the polymorphisms located in the 3’ region of the SLC11A1 gene
showed no association with the incidence of autoimmune disease, while polymorphisms
in the 5’ end of SLC11A1 [(GT)n,-237C/T, 247C/T and 469+14G/C] were all found to
be significantly associated (or just outside the values required for statistical
significance) with the incidence of autoimmune disease (Figure 7.1) (Table 7.2).
7.3.1.4 Logistic Regression Analysis to Determine the Source of
Heterogeneity Identified in the Meta-Analyses
Heterogeneity of pooled OR estimates was observed within the datasets used for the
meta-analyses of the SLC11A1 (GT)n, 469+14G/C, 823C/T, 1730G/A and 1729+55del4
polymorphisms with autoimmune disease (based on the Cochran Q value) (Table 7.2)
(Section 7.2.2). Logistic regression analysis was used to determine if the different
diseases or different ethnicity/populations analysed accounted for the source of the
heterogeneity observed within the datasets for each polymorphism (Section 7.2.2.1).
Logistic regression analysis found that the different diseases analysed and the different
ethnicity/populations studied were not the source of the observed heterogeneity within
the datasets.
284
7.3.2 Associations of SLC11A1 Polymorphisms with the
Incidence of Infectious Disease
The analysis of the association of SLC11A1 polymorphisms with the incidence of
infectious disease included the assessment of 8 polymorphisms (Table 7.1) (Figure 7.1).
Table 7.4 displays the pooled OR estimates for each polymorphism. Where possible,
additional meta-analyses were completed assessing the association of the SLC11A1
polymorphisms with tuberculosis or leprosy alone (Table 7.4). Additionally, the
association of the SLC11A1 polymorphisms with the incidence of infectious disease
according to ethnicity was also analysed.
Table 7.4 Meta-analyses of the Association of SLC11A1 Polymorphisms with the
Incidence of Infectious Disease.
Polymorphism
Association
Fixed-Effects
Cochrane Q test
Random-Effects
Significance
(GT)n Allele 3
Infectious disease
Tuberculosis
0.82 (0.76-0.88)
0.75 (0.69-0.82)
59.00 (P=0)
40.54 (P=0)
0.82 (0.72-0.93)
0.76 (0.65-0.89)
P=0.002**
P=0.0005**
(GT)n Allele 2
Infectious disease
Tuberculosis
1.32 (1.20-1.46)** 25.52 (P=0.08)
1.47 (1.30-1.66)** 12.23 (P=0.27)
-237C/T
Infectious disease
0.66 (0.41-1.06)
2.11 (P=0.71)
274C/T
Infectious disease
Tuberculosis
1.07 (0.95-1.20)
1.15 (0.93-1.41)
11.28 (P=0.34)
10.03 (P=0.12)
469+14G/C
Infectious disease
Tuberculosis
1.21 (1.12-1.31)
1.23 (1.13-1.33)
56.54 (P=0.03)
47.63 (P=0.01)
1.22 (1.10-1.36)
1.24 (1.09-1.40)
P=0.0003**
P=0.001**
1465-85G/A
Infectious disease
1.05 (0.89-1.24)
2.86 (P=0.70)
1730G/A
Infectious disease
Tuberculosis
1.17 (1.08-1.26)
1.18 (1.08-1.29)
102.58 (P=0)
75.97 (P=0)
1.21 (1.05-1.39)
1.22 (1.04-1.42)
P=0.007**
P=0.01**
1729+55del4
Infectious disease
Tuberculosis
Leprosy
1.18 (1.11-1.26)
1.23 (1.14-1.33)
1.06 (0.89-1.26)
83.39 (P=0)
51.98 (P=0)
1.63 (P=0.80)
1.22 (1.10-1.36)
1.28 (1.14-1.44)
P=0.0003**
P=0.00003**
1729+271del4
Infectious disease
Tuberculosis
1.06 (0.89-1.24)
1.02 (0.87-1.19)
2.92 (P=0.71)
2.12 (P=0.71)
Pooled OR Estimate
Bolded OR estimates represent the final pooled OR estimate for the association of the SLC11A1 polymorphism.
**Statistically significant
285
7.3.2.1 SLC11A1 (GT)n Allele 2 and Allele 3 are Associated with
Susceptibility and Resistance to Infectious Disease and Tuberculosis
Alone
The meta-analysis of the association of (GT)n allele 2 and allele 3 with infectious
disease included 18 and 24 datasets, respectively (Table 7.1) (Appendix 7a and 7b). The
meta-analyses showed that (GT)n allele 2 was strongly associated with the incidence of
infectious disease, with a statistically significant fixed-effects pooled OR estimate of
1.32 (CI: 1.20-1.46). On the other hand, (GT)n allele 3 was shown to play a protective
role against the occurrence of infectious disease, with a random-effects pooled OR of
0.82 (CI: 0.72-0.93) (Table 7.4). Further analysis, assessing the association of the (GT)n
alleles with the incidence of tuberculosis alone, revealed a stronger association than
those observed with the occurrence of infectious disease per se, with fixed and randomeffects pooled OR of 1.47 (CI: 1.30-1.66) and 0.76 (CI: 0.65-0.89) for allele 2 and 3,
respectively (Table 7.4).
A meta-analysis assessing the association of (GT)n allele 2 with the occurrence of
infectious disease or tuberculosis alone has not been completed prior to the current
study. A previous meta-analysis, and case control association studies have focused
primarily on the incidence of allele 3 with infectious disease, and disease associations
with allele 2 have not been investigated (Li et al., 2006). However, the results of the
current meta-analysis show that the association of (GT)n allele 2 with the incidence of
infectious disease and tuberculosis susceptibility alone is more significant than the
protective effect putatively exerted by (GT)n allele 3. Additionally, the (GT)n allele 2
dataset was found to be homogenous, as the Chochran Q value did not identify
heterogeneity of OR within the dataset. Conversely, heterogeneity was identified within
the (GT)n allele 3 dataset (Table 7.4). It would be envisaged that a sequence variant,
which alters the propensity of an individual to contract an infectious disease (i.e. the
variant provides a selective advantage or disadvantage to the carrier) would be common
to all studies irrespective of other factors responsible for heterogeneity (for example
ethnicity and nutritional status). In such a case, the ORs for the individual studies in the
meta-analysis would be expected to be homogenous, as is observed with the metaanalysis of allele 2 with the incidence of infectious disease. Therefore, the meta-analysis
data suggests that allele 2 may exert a greater influence on the incidence of infectious
disease than the previously thought (GT)n allele 3.
286
Analysis of the funnel plots from the meta-analyses of (GT)n allele 2 and 3 with the
incidence of infectious disease indicated the presence of bias within the datasets (Figure
7.5). While the use of the trim and fill method was previously used to adjust for bias
(Chapter 3), in the current analysis the use of the trim and fill method does not appear to
be needed, as if the funnel plots for both the (GT)n allele 2 and 3 analyses did not show
bias (i.e. the "missing" studies were filled in), these missing studies would be located in
a position that would strengthen the pooled OR estimate.
Figure 7.5 Funnel plots of the meta-analyses of allelic variants at the (GT)n repeat with
the incidence of infectious disease. The odds ratios (logOR) for each study included in
the meta-analyses was plotted against the sample size of the study. The dashed lines
indicate the location of the pooled OR estimate. Slight bias is evident in the analysis of
(GT)n allele 2 (A) and allele 3 (B) due to small gaps to the right and left of the pooled
OR estimates, respectively. The dotted triangles indicate the location of missing studies.
7.3.2.1.1 The Association of the (GT)n Alleles with Infectious Disease
According to Ethnicity
Further analysis, based on ethnicity, found that (GT)n allele 2 was significantly
associated with infectious disease susceptibility in the African population, with a
susceptibility trend, which failed to reach significance, among Asian and European
populations (Table 7.5). Furthermore, no association was found in the South American
population (Table 7.5). Allele 3 was found to be significantly associated with resistance
to infectious disease in African and Asian populations, however, no association was
found among European and South American populations (Table 7.5). While the lack of
association of both (GT)n allele 2 and 3 with the occurrence of infectious disease in the
287
South American population may be due to the small number of publications completed
to date (n=2), conflicting results were observed with the association of the (GT)n alleles
with infectious disease in the European population. The results from the European
population indicate that allele 2 may be associated with the incidence of infectious
disease (OR=1.24), while allele 3 appears to play no role in affording disease protection
(OR=1.01). This result suggests that in the European population allele 2 exerts a greater
influence over infectious disease susceptibility compared to allele 3.
Table 7.5 Analysis of the Association of (GT)n Allele 2 and 3 with the Incidence of
Infectious Disease According to Ethnicity.
Ethnicity
African
Asian
European
South American
Allele 3
0.81 (0.74-0.90)**
0.72 (0.63-0.83)**
1.01 (0.69-1.48)
1.02 (0.74-1.41)
Allele 2
1.45 (1.22-1.71)**
1.28 (0.98-1.66)
1.24 (0.97-1.57)
1.00 (0.72-1.40)
**Statistically significant
7.3.2.2 The 469+14G/C, 1730G/A and 1729+55del4 Polymorphisms are
Associated with the Incidence of Infectious Disease
The meta-analyses assessing the association of the 469+14G/C, 1730G/A and
1729+55del4 polymorphisms with the incidence of infectious disease included 39, 44
and 43 datasets, respectively (Table 7.1) (Appendix 8a, 8b and 8c). The meta-analyses
found that the presence of the less frequent variant for each polymorphism was
significantly associated with the incidence of infectious disease, with random effects
pooled OR estimates of 1.22 (CI: 1.10-1.36), 1.21 (CI: 1.05-1.39) and 1.22 (CI: 1.101.36) for the 469+14G/C, 1730G/A and 1729+55del4 polymorphisms, respectively
(Table 7.4). Furthermore, analysis of the association of the 469+14G/C, 1730G/A and
1729+55del4 polymorphisms with the incidence of tuberculosis alone identified a
stronger association than that observed with infectious disease per se, with pooled OR
estimates of 1.24 (CI: 1.09-1.40), 1.22 (CI: 1.04-1.42) and 1.28 (CI: 1.14-1.44),
respectively (Table 7.4). Significant heterogeneity, as determined by the Cochran Q
value, was identified within the datasets of the meta-analyses assessing both infectious
disease and tuberculosis alone for all three polymorphisms (469+14G/C, 1730G/A and
288
1729+55del4) (Table 7.4). The association of the incidence of leprosy with SLC11A1
polymorphisms was only completed for the 1729+55del4 polymorphism, as there were
insufficient association studies to warrant an analysis of the other polymorphisms. No
association between the occurrence of the 1729+55del4 polymorphism and the
incidence of leprosy was identified (Table 7.4). No asymmetry was identified from the
analysis of the funnel plots for the 469+14G/C, 1730G/A and 1729+55del4
polymorphisms.
7.3.2.2.1 Association of SLC11A1 Polymorphisms with the Incidence of
Infectious Disease According to Geographical Location/Ethnicity
Analysis of the association of the 469+14G/C, 1730G/A and 1729+55del4
polymorphisms with the occurrence of infectious disease among different ethnicities,
identified a trend in which the less frequent variant for each polymorphism was
associated with the incidence of infectious disease (Table 7.6). In particular, a
significant association was identified between each polymorphism and the incidence of
infectious disease in the Asian population. The 469+14C/C and 1729+55del4
polymorphisms were significantly associated with the incidence of infectious disease in
the African population. However, a protective effect appeared to be conferred by the
less frequent 1730 A variant in the Mediterranean population (Table 7.6). However, this
analysis incorporated only two publications, suggesting that the observed association
may be largely attributable to random variation.
Table 7.6 Analysis of the Association of the 469+14G/C, 1730G/A and 1729+55del4
Polymorphisms with the Incidence of Infectious Disease Based on Ethnicity.
Ethnicity
African
Asian
European
South American
469+14G/C
1.37 (1.14-1.65)**
1.35 (1.10-1.66)**
1.03 (0.88-1.21)
1730G/A
1.26 (0.82-1.93)
1.23 (1.11-1.36)**
1.19 (0.79-1.78)
1.18 (0.98-1.43)
1729+55del4
1.11 (1.01-1.23)**
1.30 (1.08-1.57)**
1.66 (0.90-3.05)
1.21 (1.00-1.47)
Mediterrianean
1.19 (0.75-1.87)
0.37 (0.23-0.61)**
1.16 (0.40-3.40)
**Statistically significant
289
7.3.2.3 The -237C/T, 274C/T, 1485-85G/A and 1729+271del4
Polymorhisms are not Associated with the Incidence of Infectious
Disease
No significant association was identified between the occurrence of the -237C/T,
274C/T, 1485-85G/A and 1729+271del4 polymorphisms and the incidence of infectious
disease or tuberculosis alone (Table 7.4) (Appendix 9). The association of the -237C/T
polymorphism with infectious disease failed to reach statistical significance and this is
likely attributable to the small number of publications, which have been completed to
date. The results suggest that promoter -237C/T polymorphism may be associated with
the occurrence of infectious disease, however more association studies are required.
7.3.2.4 Logistic Regression Analysis to Determine the Source of
Heterogeneity Identified in the Meta-Analyses
Heterogeneity of OR was observed within datasets from the meta-analyses of the
SLC11A1 (GT)n allele 3, 469+14G/C, 1730G/A and 1729+55del4 polymorphisms with
infectious disease (Table 7.4) (Section 7.2.2). Therefore, only (GT)n allele 2 was found
to be significantly associated with the incidence of infectious disease with an absence of
significant heterogeneity of OR within the datasets included in the analysis. Logistic
regression analysis was used to determine if the different diseases or different
ethnicity/populations analysed accounted for the source of the heterogeneity observed
within the datasets for each polymorphism (Section 7.2.2.1). Logistic regression
analysis found that the different diseases analysed and the different
ethnicity/populations were not the source of the observed heterogeneity within the
datasets of the SLC11A1 polymorphisms.
7.3.3 Summary
Of the associations found between SLC11A1 polymorphisms and disease occurrence,
(GT)n allele 2 showed the strongest association with both infectious disease and
tuberculosis alone. Significant associations were also observed with the 469+14G/C,
1730G/A and 1729+55del4 polymorphisms and the incidence of infectious disease and
tuberculosis alone (Table 7.4). In contrast to the observation that polymorphisms
throughout the SLC11A1 gene were associated with the occurrence of infectious disease,
meta-analyses of the association of SLC11A1 polymorphisms with the incidence of
290
autoimmune disease, revealed that polymorphisms in the 5’ end of SLC11A1 were
associated with disease incidence, while polymorphisms in the 3’ end showed no
association (Section 7.3.1.3) (Table 7.2 and 7.4) (Figure 7.6).
1.32
(1.20-1.46)
1.47
(1.30-1.66)
Infection
Tuberculosis
0.76
(0.65-0.89)
0.82
(0.72-0.93)
1.11
(0.98-1.26)
(GT)n
Allele 3
-237C/T
0.66
(0.41-1.06)
0.61*
(0.46-0.81)
2
1
3
2
1.15
(0.93-1.41)
1.07
(0.95-1.20)
1.25*
(1.07-1.47)
274C/T
4 4a
3
4
1.24
(1.09-1.40)
1.22
(1.10-1.36)
1.32*
(1.03-1.71)
469+14G/C
(INT4)
5 6 78
5
7
0.74
(0.50-1.09)
577-18G/A
6
823C/T
1.02
(0.67-1.56)
9
8
1029C/T
(A318V)
10
0.48
(0.21-1.11)
10 11
9
1465-85G/A
13 14
12
1.05
(0.89-1.24)
1.11*
(0.95-1.29)
12
11
14kb
1.22
(1.04-1.42)
1.21
(1.05-1.39)
1.15
(0.84-1.58)
1730G/A
(D543)
15
13
1.28
(1.14-1.44)
1.22
(1.10-1.36)
1.17*
(0.82-1.67)
1729+55del4
1.02
(0.87-1.19)
1.06
(0.89-1.24)
0.98
(0.80-1.22)
1729+271del4
(CAAA)n
Figure 7.6 Summary of the results from the meta-analyses (pooled OR estimates and 95% CI interval) assessing the association of the SLC11A1
polymorphisms with the incidence of autoimmune disease, infectious disease and tuberculosis alone.
*Pooled OR estimate determined without Yang, Todd unpublished
0.90
(0.81-1.00)
Autoimmune
(GT)n
Allele 2
1
0
291
291
292
7.4 DISCUSSION
7.4.1 Summary
Due to the role of SLC11A1 in driving a Th1 pro-inflammatory immune response, a
significant number of case-control association studies have been completed to determine
if polymorphisms within the SLC11A1 locus are associated with the incidence of
infectious and autoimmune disease. These studies have produced inconsistent results
(Section 1.3.4). Therefore, through the use of meta-analyses, the current study aimed to
determine the association of several polymorphisms within the SLC11A1 locus with the
occurrence of infectious and autoimmune disease. The current study incorporates the
largest number of publications and the largest number of SLC11A1 polymorphisms
investigated to date, with 11 and 8 SLC11A1 polymorphisms analysed with the
occurrence of autoimmune and infectious disease, respectively (Figure 7.6).
From the current meta-analysis, the association of (GT)n alleles 2 and 3 with reduced
and increased incidence of autoimmune disease, respectively, fell just outside of
statistical significance (Table 7.2). The findings of the current analysis that allele 2 is
associated with a reduced incidence of autoimmune disease is consistent with two
smaller meta-analyses assessing the association of the (GT)n alleles with autoimmune
disease, which included 7 and 15 datasets (Nishino et al., 2005, O'Brien et al., 2008)
(Table 7.7). However, the OR estimates of the association of allele 3 with autoimmune
disease have been inconsistent (Table 7.7). An estimate was not reported by Nishino et
al. (2005), suggesting that no association was found. The pooled OR estimate
determined by O’Brien et al. (2008), in the absence of asymmetry within the dataset,
was 0.88 (CI: 0.65), suggesting no association (Table 7.7). In the current analysis, a
trend for the association of allele 3 with increased incidence of autoimmune disease was
observed. While the finding was not significant, the direction of the pooled OR estimate
was opposite to that reported in O’Brien et al. (2008) but consistent with the hypothesis
of Searle and Blackwell. (1999) (Section 1.3.4). The current study has the largest
sample size to date, suggesting that the observed estimate is reflective of the true
association.
293
Table 7.7 Comparison of Pooled OR Estimates between the Current and Previously
Completed Meta-analyses with the Incidence of Autoimmune Disease and Tuberculosis.
Polymorphism
Autoimmune
Nishino et al., 2005 O'Brien et al., 2008
Current Analysis
(GT)n Allele 2
0.71 (0.53-0.96)**
0.80 (0.22)
0.90 (0.81-1.00)
0.88 (0.66)
1.11 (0.98-1.26)
0.76 (0.60-0.97)**
0.76 (0.65-0.89**
469+14G/C
1.32 (1.03-1.71)**
1.14 (0.69-1.35)
1.24 (1.09-1.40)**
1730G/A
1.15 (0.84-1.58)
1.67 (1.36-2.05)**
1.22 (1.04-1.42)**
1729+55del4
1.17 (0.82-1.67)
1.33 (1.08-1.63)**
1.28 (1.14-1.44)**
(GT)n Allele 3
Tuberculosis
Li et al., 2006
Current Analysis
1.47 (1.30-1.66)**
**Statistically significant
Prior to the completion of the current study, meta-analyses of only 4 SLC11A1
polymorphisms with the incidence of tuberculosis had been completed (Table 7.7) (Li et
al., 2006). The pooled OR estimates observed in the current meta-analyses were similar
to the OR estimates reported previously (Table 7.7). However, the magnitude of the
association at the 1730G/A polymorphism was significantly different (Table 7.8). The
current meta-analysis included 32 associations, compared to 9, and therefore is probably
more reflective of the true association (Appendix 8b). The increase in the number of
datasets in the current analyses would also account for the observed significant
association between the 469+14G/C polymorphism and the incidence of tuberculosis,
which was not observed in the previous meta-analysis (Table 7.7) (Li et al., 2006).
The current study completed 15 new meta-analyses (10 for autoimmune disease and 5
for infectious disease). Previously, only the (GT)n alleles had been assessed in metaanalyses to determine their association with the occurrence of autoimmune disease, as
there were insufficient studies to allow a meaningful analysis of the other
polymorphisms (Chapter 3). The current meta-analysis is the first to identify an
association of the T variant of the -237C/T polymorphism with a reduced incidence of
autoimmune disease. Furthermore, the less frequent variants of the 274C/T and
469+14G/C polymorphisms were significantly associated with the incidence of
autoimmune disease (Table 7.2). Additionally, the current analysis is the first to show a
strong association between (GT)n allele 2 and the incidence of tuberculosis alone and
infectious disease per se (Table 7.4).
294
Attempts to determine the source of heterogeneity of OR by logistic regression analysis,
found that factors such as the specific disease analysed, or the ethnicity/geographical
location of the population analysed, could not account for the observed heterogeneity
identified in the majority of datasets (Sections 7.3.1.4 and 7.3.2.4). This may have been
attributable, in part, to the classification of studies into groups, which did not adequately
reflect the heterogeneity present within the dataset. For example, the combined
grouping of multiple disease entities (each with their own unique pathogenesis) as a
single syndrome (e.g. inflammatory bowel disease or group “other” in the analysis of
autoimmune and infectious disease, respectively), or grouping studies based on
ethnicity/geographical location which may not take into full account the underlying
population stratifications present (Section 7.2.2.1) (Cardon and Palmer, 2003).
Alternatively, the source of the heterogeneity may be due to other confounding factors
not assessed in the logistic regression analysis, which may play a greater role in
influencing disease incidence (and thus alter the OR of the individual studies). These
may include shared environmental factors such as nutritional status and poverty, as well
as other host genetic factors (Stein and Baker, 2011, Stein et al., 2007). The
identification of heterogeneity within the datasets shows the need for the completion of
additional studies with large sample sizes conducted within a specific ethnicity and
disease type, enabling subsequent meta-analyses greater power to determine the
association of SLC11A1 polymorphisms with the occurrence of a specific disease state.
7.4.2 Functional Variants within the 5’ and 3’ LD Haplotype
Regions of SLC11A1 Influence Autoimmune and Infectious
Disease Susceptibility
The meta-analyses found that polymorphisms in the 5’ region of SLC11A1, but not the
3’ region, were associated with susceptibility/resistance to autoimmune disease (Section
7.3.1.3), while polymorphisms located throughout SLC11A1 were associated with the
incidence of infectious disease and tuberculosis alone (Section 7.3.3) (Figure 7.7).
It has previously been shown that significant LD exists around SLC11A1 (Dunstan et
al., 2001, Kim et al., 2008, Yip et al., 2003). Yip et al. (2003) found that the SLC11A1
locus contained two LD blocks (in the current study these are termed 5’ LD haplotype
295
A
Linkage Disequilibrium at the SLC11A1 Locus
0
1
1
2
(GT)n
2
3
3
4 4a
4
274C/T
-237C/T
5
6
7
5 6 78
8
9
823C/T
469+14G/C
9
10 11
10
11
12
12
13 14
13
14kb
15
1465-85G/A
1729+55del4
1730G/A
B
110kb
110kb
5’ LD haplotype end
C
Polymorphisms Associated with Autoimmune Disease
D
Polymorphisms Associated with Infectious Disease
3’ LD haplotype end
Figure 7.7 Linkage disequilibrium at the SLC11A1 locus and location of
polymorphisms associated with the incidence of autoimmune and infectious disease. (A)
Genomic organisation of SLC11A1 and location of studied sequence variants. The 15
exons of the gene are shown as black boxes with their respective numbers and the
corresponding scale above indicates the length (kb) of the gene. The grey boxes indicate
the 3’ and 5’ untranslated regions and the introns and flanking regions are represented
by a thin line. The arrows indicate the position of sequence variants. (B) LD located
within the SLC11A1 locus. The blue circles indicate the location of the SLC11A1
polymorphisms, with the thin line representing the flanking DNA regions. The two LD
blocks, identified by Yip et al. (2003) (termed 5’ LD haplotype end and 3’ LD
haplotype end) are shown, with the double dashed line designating the weak LD
observed between 5’ and 3’ SLC11A1 regions. (C) Polymorphisms within the 5’ LD
haplotype end but not the 3’ end are associated with the incidence of autoimmune
disease (red circles indicate an association, while white circles indicate no association).
(D) Polymorphisms in both the 5’ and 3’ LD haplotype blocks were found to be
associated with infectious disease. The (GT)n and 1730G/A are candidate
polymorphisms in the SLC11A1 locus influencing autoimmune and infectious disease
susceptibility at the 5’ and 3’ LD haplotype ends, respectively (arrows).
296
end and 3’ LD haplotype end) (Figure 7.7). The study identified that significant LD
existed between the (GT)n, -237C/T, 274C/T and 469+14G/C polymorphisms and
markers 110kb upstream of the SLC11A1 locus, including the IL8Rb locus (termed
5’LD haplotype end). Additional LD was found to exist between the 823C/T, 146585G/A, 1730G/A and 1729+55del4 polymorphisms and markers 110kb downstream of
the SLC11A1 locus (termed 3’LD haplotype end). However, LD was not observed
between polymorphisms located in the 5’ and 3’ LD haplotype ends of the SLC11A1
locus (Figure 7.7) (Yip et al., 2003).
The SLC11A1 polymorphisms identified in the current analysis to be significantly
associated with disease incidence may be the functional cause of the association(s) seen
in that the polymorphism(s) results in an altered phenotype which influences disease
susceptibility. Alternatively, the association observed may be due to the polymorphism
being positively or negatively selected because it is in linkage disequilibrium with the
true disease causing variant. In the latter case, a genetic variant which alters disease
incidence provides a positive/negative selective pressure for the inheritance of all of the
polymorphisms within that LD block (known as the hitchhiker effect).
The findings of the meta-analyses suggest that at least one functional polymorphism at
the 5’ end of SLC11A1 (or a polymorphism(s) in LD with the 5’ end of SLC11A1),
influences susceptibility to autoimmune disease, while at least two functional
polymorphisms, one at the 5’ end and one at the 3’ end (or in LD with each region),
influences infectious disease susceptibility. Polymorphisms in LD with the significantly
associated SLC11A1 polymorphisms should also be considered as potential functional
candidates for disease susceptibility. Functional tests are required to identify the
polymorphic variants which may result in an altered cellular phenotype to influence
infectious/autoimmune disease susceptibility.
Due to the role that SLC11A1 plays in the activation of a Th1 (pro-inflammatory)
immune response, it would be most likely that the observed associations identified with
infectious and autoimmune disease is mediated by a polymorphism(s) within the
SLC11A1 locus, and not due to a polymorphism(s) located in LD, but outside of
SLC11A1 locus (i.e. a variant in a non-immune gene). However, a significant level of
LD was found to exist between the 5’ end of SLC11A1 and the neutrophil expressed
297
Interleukin-8 receptor, beta (IL8RB) (Yip et al., 2003). Therefore, polymorphisms
located within the IL8RB locus may be responsible for the association identified at the
5’ end of SLC11A1. Further work is required to determine whether polymorphisms
located within the IL8RB locus are responsible for the observed association of the 5’ end
of SLC11A1 with infectious and autoimmune disease.
7.4.2.1 The (GT)n and 1730G/A Polymorphisms are Functional
Candidates Altering the Cellular Phenotype of SLC11A1 to Influence
Autoimmune/Infectious Disease Susceptibility
Within the SLC11A1 locus, the (GT)n and the 1730G/A polymorphisms are the most
probable candidates for the alteration of disease incidence observed at the 5’ and 3’ LD
ends, respectively (Figure 7.7). These two polymorphisms are the likely candidates as
they have putative functional effects being able to either influence the level of SLC11A1
expressed or altering the ability of SLC11A1 to transport divalent cations, respectively.
These putative functional effects result in an altered phenotype which may explain the
reason for the associations with infectious and autoimmune disease identified in this
study (Decobert et al., 2006, Gazouli et al., 2008a).
Furthermore, the findings from the meta-analyses also suggest that the (GT)n and
1730G/A polymorphisms are the candidate variants at the 5’ and 3’ ends of SLC11A1,
respectively, responsible for influencing disease incidence. The meta-analyses of the
(GT)n and 1730G/A polymorphisms were the only analyses in which the large data set
analysed by Yang et al. (unpublished) could justifiably be retained. In both of the (GT)n
and 1730G/A meta-analyses the pooled OR estimates were not biased/skewed by the
inclusion of the large study, which was not the case when this study was included in
analyses of the other SLC11A1 polymorphisms (Table 7.2). It would be expected that in
a gene that is essential for host survival, the magnitude of the effect of mutations, which
have either a detrimental or positive effect would be similar across different
populations. The fact that the Yang et al. (unpublished) study did not skew the pooled
OR estimates of the (GT)n and 1730G/A meta-analyses suggests that these
polymorphisms (and not the other polymorphisms which were skewed by the inclusion
of the analysis) are likely responsible for the observed associations at the 5’ and 3’ LD
haplotype ends of SLC11A1.
298
The putative functional (GT)n and 1730G/A polymorphisms, responsible for observed
association at the 5’ and 3’ LD haplotype ends, respectively, are located in different
regions of the SLC11A1 locus, and therefore, may function to alter disease susceptibility
through differing mechanisms. The (GT)n promoter polymorphism would influence
disease susceptibility by modulating SLC11A1 expression. During an infection, or in the
development of autoimmunity, transcription factor binding to the SLC11A1 promoter, in
association with different functional (GT)n alleles (which mediate differential
expression of SLC11A1), would alter the level of SLC11A1 expressed. Therefore, the
differing SLC11A1 levels would exert phenotypic effects to alter the Th1 proinflammatory immune response elicited. Conversely, the 1730G/A polymorphism,
located in the coding region, would alter the ability of SLC11A1 to transport divalent
cations out of the phagosome. Therefore, the phenotypic effects of this polymorphism to
alter disease susceptibility may be due to the retention of higher iron levels within the
phagosome, allowing replication of a pathogen within the phagosome. Therefore, the
(GT)n polymorphism, through the alteration of SLC11A1 expression, and 1730G/A
polymorphism, through the mediation of altered SLC11A1 function, may work to
influence disease susceptibility through differing mechanisms. While these
polymorphisms may function independently to alter the cellular phenotype, functional
variants which influence disease susceptibility may be present together, with the genetic
contribution of SLC11A1 to disease being likely due to a summation of the functional
effects of polymorphisms throughout the SLC11A1 locus (Section 7.4.4). Functional
tests are required to elucidate the mechanisms by which the (GT)n and 1730G/A
polymorphisms may influence infectious and autoimmune disease susceptibility.
7.4.3 (GT)n Allele 2 Exerts the Selective Pressure at the 5’ End
to Influence Infectious and Autoimmune Disease
Susceptibility
The (GT)n microsatellite repeat is the most likely candidate at the 5’ LD haplotype end
for influencing infectious and autoimmune disease susceptibility. Consistent with
previous reports, (GT)n allele 3 and allele 2 were significantly associated with resistance
and susceptibility to infectious disease, respectively (Li et al., 2006, Searle and
Blackwell, 1999). Overall, the most significant result identified from the current study
was the association of (GT)n allele 2 with the incidence of infectious disease (OR=1.32)
299
and specifically the incidence of tuberculosis (OR=1.47). The strength of the association
of (GT)n allele 2 with the incidence of infectious disease was greater than the protective
effect afforded by (GT)n allele 3 (Table 7.4), as the relative magnitude of the OR and
95% CI for allele 2 is further from 1, than allele 3. Consistent with these findings, a
stronger association of allele 2 with reduced incidence of autoimmune disease was also
observed, compared to an increased incidence observed with allele 3 (Table 7.2).
Reporter studies have shown that different lengths of the (GT)n microsatellite repeat
alter SLC11A1 expression levels, with (GT)n allele 3 driving higher expression than
(GT)n allele 2. Due to the important role SLC11A1 plays in initiating and perpetuating a
Th1 immune response, it was hypothesised that over expression of SLC11A1 driven by
(GT)n allele 3 would result in a heightened Th1 immune response and a subsequent
“chronic hyperactivation of macrophages” (i.e. classical activation) (Searle and
Blackwell, 1999, Shaw et al., 1996). This chronic hyperactivation of macrophages
would confer resistance to infectious disease, but also susceptibility to autoimmune
diseases (Searle and Blackwell, 1999). This hypothesis suggests that allele 3 is the
disease causing variant of the (GT)n microsatellite repeat, which exerts a selective
pressure within the SLC11A1 locus to modulate of disease susceptibility.
Due to the hypothesis that allele 3 is the disease causing variant at the (GT)n
microsatellite, case-control association studies have focused specifically on the
association of allele 3 with disease incidence, commonly grouping the other (GT)n
alleles together to report a combined allele frequency “other” (Bellamy et al., 1998,
Fitness et al., 2004a, Fitness et al., 2004b, Leung et al., 2007, Soborg et al., 2002,
Soborg et al., 2007). However, the findings of the current meta-analysis suggest that
(GT)n allele 2, and not (GT)n allele 3, has the strongest association with infectious and
autoimmune disease. Thus, it appears that (GT)n allele 2 is the disease causing variant at
the (GT)n microsatellite influencing the incidence of disease. Furthermore, homogeneity
of OR for individual studies of the meta-analysis suggest that (GT)n allele 2 is
responsible for the observed association with infectious disease (Section 7.3.2.1). Such
homogeneity of OR was absent within the allele 3 dataset (Table 7.4). Therefore, the
meta-analysis data suggests that (GT)n allele 2, and not allele 3, is the disease causing
variant at the (GT)n microsatellite, which exerts the selective pressure at the SLC11A1
locus to influence infectious and autoimmune disease susceptibility.
300
7.4.3.1 (GT)n Allele 2 May Influence Disease Incidence Due to a
Heightened Anti-inflammatory Immune Response Mediated Through
Increased IL-10 Expression
The findings of the current meta-analysis that allele 2 is the disease variant at the (GT)n
repeat, does not support the current hypothesis that a chronic hyperactivation of
macrophages driving a heightened Th1 pro-inflammatory immune response (elicited by
allele 3) is responsible for the observed associations with disease incidence (Searle and
Blackwell, 1999, Shaw et al., 1996). Therefore, how does (GT)n allele 2 function to
alter infectious and autoimmune disease susceptibility?
Human and murine studies suggest that (GT)n allele 2 may alter disease susceptibility
through higher expression of the anti-inflammatory cytokine IL-10. Macrophages or
dendritic cells, isolated from mice which lack functional Slc11a1, have higher IL-10
expression after infectious challenge or induction of a model of autoimmune disease,
compared to macrophages/dendritic cells containing functional Slc11a1 (Fritsche et al.,
2008, Jiang et al., 2009, Pie et al., 1996, Rojas et al., 1999, Smit et al., 2003, Stober et
al., 2007). While the loss of functional Slc11a1 in the murine model does not correlate
with the observed phenotype occurring with the (GT)n repeat in humans (i.e. a reduced
level of SLC11A1 expression rather than loss of function), a human based study has also
shown that individuals who carry allele 2 have a significantly increased expression of
the anti-inflammatory cytokine IL-10, compared to individuals who do not carry allele 2
(Awomoyi et al., 2002).
Therefore, it is hypothesised that allele 2 is the disease causing variant at the (GT)n
microsatellite repeat driving low SLC11A1 expression and a subsequent increase in IL10 expression. The increased IL-10 expression would produce a heightened antiinflammatory immune response, inhibiting the production of an adequate Th1 proinflammatory immune response. Specifically, IL-10 has been shown to inhibit innate
macrophage anti-microbial molecules involved in a pro-inflammatory immune response
and has also been shown to reduce antigen processing, antigen presentation and T cell
activation (Asadullah et al., 2003, Couper et al., 2008, de Waal Malefyt et al., 1991,
Gazzinelli et al., 1992, Moore et al., 2001). Thus, the inhibition of a Th1 proinflammatory immune response, in the presence of allele 2, would confer susceptibility
301
to infectious disease, however, due to the inhibition of Th1 effector molecules and T
cell activation, would confer resistance to Th1 mediated autoimmune diseases.
While the results of the meta-analyses suggest that (GT)n allele 2 is the disease causing
variant at the (GT)n repeat, putatively through increased IL-10 production and inhibition
of a pro-inflammatory immune response, it is hypothesised that (GT)n allele 3 would
drive an adequate level of SLC11A1 expression, high enough to produce a Th1 proinflammatory immune response to allow efficient resolution of infectious disease and,
due to the lack of inhibition of a pro-inflammatory immune response (as seen with allele
2), would maintain the effector molecules and cells to initiate Th1 mediated
autoimmune diseases (in genetically and environmentally permissive individuals).
7.4.4 Future Association Studies Should Complete Haplotype
Analysis of the SLC11A1 Locus
The complex LD pattern at the SLC11A1 locus, and the current finding that functional
polymorphisms in both 5’ and 3’ LD haplotype ends of SLC11A1 are associated with
the incidence of infectious disease provides evidence that future association studies
should ideally analyse cases and controls through haplotype analyses, as opposed to
adopting a narrow binomial approach of analysing only a single polymorphism. For
example, while the current meta-analyses suggest an association between the (GT)n
repeat with the incidence of infectious and autoimmune disease susceptibility, the (GT)n
repeat does not function independently to alter SLC11A1 expression levels. For
example, reporter studies have shown that both the (GT)n and -237C/T polymorphisms
function synergistically to determine the level of SLC11A1 expressed (Zaahl et al.,
2004) (Chapter 6). Therefore, association studies which analyse the effect of the (GT)n
repeat and -237C/T polymorphisms independently are not assessing the complex
interaction which is occurring to determine the level of SLC11A1 expressed.
Additionally, there are other polymorphisms within SLC11A1 which putatively exert
phenotypic effects to alter SLC11A1 expression/function (e.g. 1730G/A Section
7.4.2.1). Therefore, an individual’s propensity to develop disease would be determined
by a summation of the effects of each of the individual polymorphisms within the
SLC11A1 locus, with association studies which complete haplotype analyses able to
302
identify the complex additive factors which would be missed in association studies
which analyse single polymorphisms.
Therefore, future analyses of the association of SLC11A1 with the incidence of disease
should complete haplotype analyses based around a 5’ LD haplotype end and a 3’ LD
haplotype end (and potentially over the whole SLC11A1 locus), thus providing greater
power to identify which haplotypes, and potentially which polymorphisms, are
functionally linked to disease incidence. Testament to this, association studies, which
assess SLC11A1 haplotypes have identified more robust associations as compared to
when these studies analysed individual polymorphisms (Bellamy et al., 1998, Kim et
al., 2003, Merza et al., 2009, Qu et al., 2007, Runstadler et al., 2005, Yen et al., 2006).
7.4.5 Conclusion
The findings of the current meta-analysis have identified a positive association of
polymorphisms within the 5’ region of SLC11A1 with autoimmune disease, while
polymorphisms located in the 5’ and 3’ region were associated with the incidence of
infectious disease. Due to the LD pattern, which exists at the SLC11A1 locus, the
findings of the current study suggest that at least one functional polymorphism exists at
the 5’ LD region, which is associated with autoimmune disease, while at least two
functional polymorphisms, one in the 5’ region and a second in the 3’ region, influence
the occurrence of infectious disease (Figure 7.7). The (GT)n repeat and the 1730G/A
polymorphisms are the strongest functional candidates influencing disease incidence at
the 5’ and 3’ LD ends, respectively.
Furthermore, the findings of the current analysis suggest that allele 2, and not allele 3, is
the disease causing variant of the functional (GT)n promoter polymorphism exerting the
selective pressure at the 5’ LD region to alter infectious and autoimmune disease
susceptibility. The identification of allele 2 as the disease-associated variant challenges
the hypothesis of how the (GT)n promoter polymorphism modulates disease
susceptibility. It is hypothesised that allele 2, which drives low SLC11A1 expression,
would influence disease susceptibility through a heightened anti-inflammatory immune
response due to increased IL-10 expression and subsequent inhibition of a Th1 pro-
303
inflammatory immune response, mediating susceptibility to infectious disease, but
resistance to Th1 mediated autoimmune disease.
In the current analysis, consistent findings were observed when assessing the
association of SLC11A1 polymorphisms with infectious disease per se as compared to
studies assessing tuberculosis alone (Table 7.5). The findings suggest that SLC11A1
polymorphisms may be associated with infectious diseases other than tuberculosis.
However, the over representation of tuberculosis studies, among the association studies,
reveals the need for the completion of analyses assessing the association of SLC11A1
polymorphisms with the occurrence of infectious diseases other than tuberculosis. A
priority should be on infectious diseases which have restricted localisation to
macrophages, or infectious diseases to which SLC11A1 has been strongly associated
using animal models (for example Salmonella and Leishmania).
Additionally, while some polymorphisms have been assessed in a large number of
association studies to allow the completion of a meaningful meta-analysis, insufficient
association studies have been completed on several polymorphisms, which show a trend
with disease incidence, however, the pooled OR does not reach significance. Had more
association studies been completed significance may have been attained. This includes,
for example, analyses of the -237C/T and 1029C/T (A318V) polymorphisms with the
incidence of infectious and autoimmune disease, respectively (Figure 7.6). Both of these
polymorphisms may exert effects on SLC11A1 expression/function and show a
significant trend with disease incidence, but with a lack of sufficient numbers of studies,
the determination of the existence of a significant association cannot be made (Table
7.1).
The aim of the work presented in this chapter was to determine, based on previously
published case/control association studies, the association of SLC11A1 polymorphisms
with disease incidence. Based on the findings of the current meta-analyses, the
SLC11A1 locus does play a role in influencing susceptibility to infectious and
autoimmune diseases. Further functional analyses are required to determine the exact
polymorphisms which produce phenotypic changes that influence disease susceptibility.
While the observed association of the SLC11A1 locus identified may only be a modest
contribution to autoimmune/infectious disease incidence, as compared to other
304
identified genetic loci, for example the large role the HLA locus plays in a number of
diseases (Blackwell et al., 2009, Davies et al., 1994, Shilna et al., 2009), the current
findings of the meta-analysis are significant in helping to determine the multiple host
genetic factors involved in complex diseases. Identification of these host genetic factors
will help to prevent, control and treat these complex diseases.
305
CHAPTER 8 - GENERAL DISCUSSION
306
8.1 Introduction
With restricted localisation to the phagosomal membrane of monocytes/macrophages,
SLC11A1 elicits a range of pleiotropic effects to initiate and perpetuate a Th1 proinflammatory immune response. In murine models, a strong link between Slc11a1
function and the development of autoimmune and infectious disease has been observed,
thereby suggesting that SLC11A1 is also a strong candidate gene for influencing the
occurrence of infectious and autoimmune diseases in humans. However, a strong
association, similar to that observed in murine models, is yet to be identified in humans.
This may be attributable, in part, to the absence of a loss of function mutation in
SLC11A1, like the G169D mutation observed in murine Slc11a1. Due to the essential
role that SLC11A1 plays in macrophage function to drive pro-inflammatory immune
responses, such loss of function mutations would be detrimental to the host and would
therefore be predicted to be rare. Rather, promoter polymorphisms provide a more
subtle way of altering the cellular phenotype of the level of functional SLC11A1
expressed.
Variants at the promoter (GT)n microsatellite repeat and the -237C/T polymorphisms
have been shown to modulate SLC11A1 expression. Based on these observations, it was
hypothesised that increased SLC11A1 expression, in the presence of (GT)n allele 3,
would mediate a heightened activation status of classically activated macrophages
affording resistance to infectious diseases, but susceptibility to autoimmune diseases.
Conversely, decreased SLC11A1 expression, in the presence of (GT)n allele 2, or the
less frequent -237 T variant, would result in a low activation status of macrophages,
thereby conferring susceptibility to infectious diseases, but resistance to autoimmune
diseases. Prior to the completion of this study, the mechanism by which variants at the
(GT)n microsatellite and -237C/T polymorphisms alter SLC11A1 expression was
unknown.
Familial and case control association studies have shown inconsistent relationships
between the presence of particular SLC11A1 polymorphisms and the incidence of
infectious and autoimmune disease. The majority of these studies have included less
than 200 cases and, therefore, lack sufficient power to detect authentic associations.
Additionally, these studies attempt to determine if SLC11A1 polymorphisms are
307
associated with disease incidence without functional knowledge of the mechanism(s) by
which SLC11A1 expression/function may be modulated by these variants.
The overall aim of this project was to characterise the SLC11A1 promoter and the
mechanisms by which the (GT)n and -237C/T promoter polymorphisms regulate
SLC11A1 expression to putatively influence susceptibility to autoimmune and infectious
disease. This was achieved through several diverse approaches; namely meta-analyses,
the development and validation of a HRM genotyping methodology, and combined in
silico analyses and reporter assays.
8.2 Association of (GT)n Alleles 2 and 3 with the Incidence of
Autoimmune/Inflammatory Diseases
Initial meta-analyses of case/control association studies (conducted between 1991 and
2006; 15 datasets) were performed to determine the association of SLC11A1 promoter
(GT)n alleles 2 and 3 with the incidence of autoimmune/inflammatory disease (Chapter
3). The meta-analyses found no association between the presence of (GT)n allele 3 and
the incidence of autoimmune disease, with a random effects pooled OR of 0.88 (CI =
0.66), however, a fixed effects pooled OR of 0.80 (95% CI = 0.22) suggested a weak
predominance of disease in the absence of (GT)n allele 2. The finding that allele 2, but
not allele 3, is associated with autoimmune disease is consistent with subsequent metaanalyses suggesting allele 2 is the disease causing variant of the (GT)n microsatellite
repeat.
The observed inconsistent findings of the individual association studies, assessing the
presence of a particular SLC11A1 (GT)n allele with the incidence of
autoimmune/inflammatory disease, were determined to be attributable, in part, to the
limited statistical power (due to small sample sizes), selection bias, and/or population
diversity of the association studies. The meta-analyses highlighted the requirement for
the completion of large unbiased studies to determine the relationship between
SLC11A1 polymorphisms and the occurrence of autoimmune/inflammatory and
infectious disease.
308
8.3 Genotyping of SLC11A1 Microsatellite Polymorphisms
Using HRM
The completion of large-scale unbiased association studies have, prior to this study,
been impractical because the conventional SLC11A1 (GT)n genotyping methodologies
are time consuming, costly and cannot detect all (GT)n variants. A novel HRM
methodology for the genotyping of the SLC11A1 (GT)n and (CAAA)n microsatellite
repeats was designed, optimised, and validated (Chapter 4). This HRM methodology is
the first report of a technique enabling high-throughput genotyping of the (GT)n
microsatellite repeat with the sensitivity to differentiate all genotypes and the ability to
detect novel sequence variants. Furthermore, assay validation, using gDNA isolated
from blood or buccal cells, yielded a 100% success rate for genotyping the (GT)n and
(CAAA)n microsatellites. The HRM methodologies will facilitate the completion of
association studies analysing larger sample sizes, which are required to identify
significant associations between (GT)n promoter and (CAAA)n variants and disease
occurrence.
8.4 Localisation and Functional Evaluation of the SLC11A1
Promoter
To characterise the SLC11A1 promoter, and determine how the promoter variants may
mediate differential SLC11A1 expression, an integrated approach was undertaken, using
in silico bioinformatic analyses and in vivo reporter assays. Firstly, bioinformatic
analyses of the SLC11A1 promoter were completed to identify putative regulatory
regions involved in SLC11A1 transcription (Chapter 5, Part 1). The putative regulatory
regions were then used to define SLC11A1 promoter regions for the preparation of
promoter constructs containing different SLC11A1 promoter lengths (Chapter 5, Part 2).
Constructs containing different SLC11A1 promoter lengths enabled the identification of
promoter regions important for SLC11A1 transcription initiation and transcriptional
enhancement (Figure 5.16). The SLC11A1 promoter lengths were also cloned in both
the forward and reverse orientation to determine whether the SLC11A1 promoter could
mediate bidirectional transcription. Additionally, multiple constructs containing the
same SLC11A1 promoter length, which differed only by the variant at the (GT)n or 237C/T polymorphism, were prepared to determine how promoter variants modulate
differential SLC11A1 promoter activity. In total 42 SLC11A1 promoter constructs were
309
prepared (Table 5.6). Promoter constructs were functionally assessed for promoter
activity in a monocyte-like (THP-1) and a non-monocytic (293T) cell line, to identify
the location of promoter regions containing elements for the recruitment of monocytic
and non-monocytic factors involved in SLC11A1 transcription, respectively (Chapter 6,
Part 3).
8.4.1 Characterisation of the SLC11A1 Promoter
8.4.1.1 A 148bp Region of the SLC11A1 Promoter Defines the Minimal
Promoter Region
A 148bp minimal SLC11A1 promoter region (-99 to +49) was identified, which
contained the core elements involved in the formation of the basal transcriptional
complex, and corroborated the findings of the bioinformatic analyses. The identified
148bp minimal promoter region is the smallest identified to date, which is able to
mediate SLC11A1 transcription. Within the minimal promoter region, a 40bp region that
approached near 100% homology between eight SLC11A1 homologs (Figure 5.8), was
identified as the likely site for the formation of the basal transcriptional complex.
However, TFBS searches of this highly conserved 40bp region, and the other regions of
the SLC11A1 promoter, failed to identify any canonical core promoter elements.
The results from the current analysis suggest that SLC11A1 transcription is initiated
through a mechanism which differs from that observed for canonical promoters
containing TATA, Inr or DPE elements (Figure 6.21). This is consistent with the
observation that transcription from these non-canonical promoters is generally from
multiple transcription start sites, as observed with SLC11A1. However, TFBS searches
did identify multiple sites for the recruitment of the transcription factors, Sp1 and
C/EBP, within the minimal promoter region, suggesting that recruitment of these factors
may be responsible for the initiation of SLC11A1 transcription. This hypothesis is
consistent with observations that Sp1 is essential in Slc11a1 expression in mice (Bowen
et al., 2003, Yeung et al., 2004). Both Sp1 and C/EBP can recruit chromatin modifiers
to activate transcription, and furthermore, can directly interact with TBP and TAFs to
initiate the formation of the basal transcriptional complex.
310
8.4.1.2 Transcription Factors IRF-8 and PU.1 are Candidates for the
Transcriptional Enhancement of the -532 to -362 Promoter Region of
SLC11A1
It was determined that increasing promoter length was correlated with increasing
promoter activity, suggesting that multiple elements for the recruitment of transcription
factors are located throughout the SLC11A1 promoter, and function synergistically to
enhance transcription. Furthermore, it was found that a 170bp region (-532 to -362),
located upstream of the (GT)n repeat, displayed the greatest enhancement of promoter
activity in monocytes. Within this region, a novel IECS element, for the combined
recruitment of the transcription factors, IRF-8 and PU.1, was identified as the candidate
responsible for the increased promoter activity observed. IECS elements are localised in
genes involved in the differentiation of macrophages, especially those encoding
lysosomal/endosomal proteins (Tamura et al., 2005). Therefore, the identified IECS
element is the likely candidate for the observed increase in SLC11A1 promoter activity
by this 170bp region.
8.4.1.3 The SLC11A1 Promoter Mediates Bidirectional Transcription
Analysis of the SLC11A1 constructs containing the different promoter regions cloned in
the forward and reverse orientation determined that the SLC11A1 promoter may
function to direct transcription in a bidirectional manner. While the shorter promoter
regions displayed orientation specific promoter activity in the forward direction, the
larger SLC11A1 promoter regions showed orientation independent promoter activity.
Such bidirectional transcription may mediate the expression of a putative regulatory
transcript or may produce a cryptic unstable transcript, which is rapidly degraded (Neil
et al., 2009, Wei et al., 2011, Xu et al., 2009).
8.4.2 The Influence of Variants at the (GT)n and -237C/T Promoter
Polymorphisms on SLC11A1 Promoter Activity
8.4.2.1 The -362 to -197 Region Mediates Differential SLC11A1
Expression in the Presence of Different (GT)n Alleles in Monocytes
Variants of the (GT)n and -237C/T polymorphisms have been shown to alter SLC11A1
expression, however, the mechanism by which these variants alter expression is
unknown. The (GT)n repeat has been shown to form Z-DNA in vivo (Bayele et al.,
311
2007, Blackwell et al., 1995, Xu et al., 2011) and formation of Z-DNA has been shown
to enhance transcription by reducing the level of negative supercoiling, allowing
transcription factor binding and pol II transcription (Bates and Maxwell, 2005, Kashi
and Soller, 1999, Rich and Zhang, 2003). Therefore, it was previously thought that
differences in the basal level of SLC11A1 expression in the presence of different (GT)n
alleles were mediated through the differing abilities of the (GT)n repeats to form ZDNA. However, the current study has shown that the ability of the (GT)n repeats to
modulate SLC11A1 expression is not attributable to the differing propensities for the
specific alleles to form Z-DNA.
The results from the current study indicate that (GT)n allele 2 should provide a greater
transcriptional enhancement, as compared to allele 3. This observation is based on the
greater propensity of (GT)n allele 2 to form Z-DNA, and the higher promoter activity of
promoter constructs containing (GT)n allele 2, compared to allele 3, when tested in the
non-monocytic 293T cell line (Sections 5.3.1.5.1 and 6.3.1.2.3). However, when tested
in the monocyte-like THP-1 cell line, the promoter constructs containing (GT)n allele 3
drove a higher SLC11A1 promoter activity, compared to allele 2 (Section 6.3.2.4.3).
Together, these results indicate that SLC11A1 expression is modulated by a monocytespecific factor, binding to a 165bp region of the SLC11A1 promoter (-362 to -197),
which is differentially regulated by the (GT)n alleles to mediate higher promoter activity
in the presence of allele 3. Furthermore, it is hypothesised that removal of this
monocyte-specific factor would result in allele 2 driving higher SLC11A1 promoter
activity compared to allele 3, in monocytes. Candidate transcription factors responsible
for the modulation of SLC11A1 expression in the presence of different (GT)n alleles
include ATF-3, Sp1, KLF, GM-CSF, PEA-3 and ZBP-1.
8.4.2.2 The -237C/T Polymorphism Alters SLC11A1 Promoter Activity
Independently of the (GT)n Microsatellite Repeat
The current study identified that the -237C/T polymorphism functions to modulate
SLC11A1 expression independently of the (GT)n microsatellite repeat. This suggests
that rather than altering the endogenous enhancer ability of the (GT)n microsatellite, the
-237C/T polymorphism alters an element for the recruitment of a transcription factor.
While no TFBS were identified at the site of this polymorphism in the presence of the
more common -237 C variant, the introduction of a sequence element for the
312
recruitment of the transcription factor, Oct-1, was observed in the presence of the -237
T variant (Section 5.3.1.4.3). Recruitment of Oct-1, in the presence of the T variant,
may out-compete, or inhibit, the binding of another transcription factor, which is
required for the high SLC11A1 promoter activity in monocytes.
Overall, the promoter assays enabled the characterisation of the SLC11A1 promoter and
the determination of the mechanism(s) by which the promoter variants modulate
expression of SLC11A1. The work completed from the in silico bioinformatic analyses
and the functional reporter assays provides a basis for the determination of the
mechanism by which SLC11A1 promoter variants alter the cellular phenotype to
influence the incidence of infectious, autoimmune and other diseases.
8.5 Association of SLC11A1 Polymorphisms with the
Occurrence of Infectious and Autoimmune Disease
Since the completion of previous meta-analyses (Chapter 3) (Li et al., 2006), there has
been a significant increase in the number of case/control association studies assessing
the incidence of SLC11A1 polymorphisms with disease occurrence. Therefore, a second
meta-analysis of the association of polymorphisms located throughout the SLC11A1
locus with the incidence of both infectious and autoimmune disease was completed
(studies conducted between 1996 to the present; 83 publications containing 386
datasets) (Chapter 7). To date, this meta-analysis represents the largest and most
comprehensive completed assessing the association of SLC11A1 polymorphisms with
disease occurrence. This analysis was undertaken as there was at least a doubling in the
number of association studies that had been completed since the previously published
meta-analyses. Additionally, 15 polymorphisms (10 for the association with
autoimmune disease and 5 for infectious disease) which had not been previously
assessed, now had a significant number of association studies completed to warrant a
meta-analysis.
The meta-analyses identified an association between the presence of (GT)n alleles 2 and
3 with reduced and increased incidence of autoimmune disease, respectively, however,
this did not reach statistical significance. A significant association was identified
between the presence of alleles 2 and 3 and the occurrence of T1D and sarcoidosis.
Furthermore, it was determined for the first time, that the less common T variant at the -
313
237C/T polymorphism was associated with a reduced incidence of autoimmune disease,
and the less frequent variants of the 274C/T and 469+14G/C polymorphisms were
significantly associated with the incidence of autoimmune disease (Table 7.2).
The current study identified an association between (GT)n allele 2 and the incidence of
infectious disease per se and specifically tuberculosis, with random effects pooled OR
estimates of 1.32 (CI = 1.20-1.46) and 1.47 (CI = 1.30-1.66), respectively. A significant
association of (GT)n allele 3 in protection against infectious disease per se and
tuberculosis alone was also identified, however, this association was not as strong as
that observed for allele 2. A significant association between the less frequently
occurring variants at the 469+14G/C, 1730G/A and 1729+55del4 polymorphisms and
the incidence of infectious disease per se, and tuberculosis alone, was also identified
(Table 7.4).
8.5.1 Variants within the 5’ and 3’ LD Haplotype Regions of SLC11A1
Influence Autoimmune and Infectious Disease Susceptibility
The current meta-analysis identified a positive association between polymorphisms
within the 5’ region of SLC11A1, but not the 3’ region, and the incidence of
autoimmune disease, while polymorphisms located in the 5’ and 3’ region were
associated with the incidence of infectious disease. Due to the complex LD pattern
which exists at the SLC11A1 locus (Dunstan et al., 2001, Kim et al., 2008, Yip et al.,
2003), the findings suggested that at least one functional polymorphism exists within
the 5’ LD region of SLC11A1, which alters the cellular phenotype to influence
autoimmune disease susceptibility, while at least two functional polymorphisms, one in
the 5’ region and a second in the 3’ region, influence the occurrence of infectious
disease (Figure 7.7). Of the polymorphisms located in the different LD regions, the
(GT)n repeat and the 1730G/A polymorphisms are the strongest functional candidates at
the 5’ and 3’ LD ends, respectively, influencing disease incidence. Due to the complex
LD pattern at the SLC11A1 locus, and the finding that polymorphisms located in both
the 5’ and 3’ regions of SLC11A1 are associated with disease occurrence, future
association studies should ideally conduct haplotype analyses.
314
8.5.2 (GT)n Allele 2 Influences Disease Incidence Through a
Heightened Anti-Inflammatory Immune Response Mediated by
Increased IL-10 Expression
The strongest association found from the meta-analysis was that of (GT)n allele 2 with
the incidence of infectious disease and tuberculosis alone. Surprisingly, the observed
association of (GT)n allele 2 with the increased incidence of infectious disease and
tuberculosis was stronger than the protective effect conferred in the presence of (GT)n
allele 3. Therefore, it is now hypothesised that allele 2, and not allele 3, is the disease
causing variant of the functional (GT)n promoter polymorphism. The identification of
allele 2 as the disease-associated variant challenges the hypothesis that a heightened
activation status of classically activated macrophages, in the presence of (GT)n allele 3,
is responsible for the observed association with infectious and autoimmune disease
occurrence (Searle and Blackwell, 1999, Shaw et al., 1996).
How might (GT)n allele 2 function to modulate disease susceptibility? Allele 2, which
drives low SLC11A1 expression, may influence disease susceptibility through a
heightened anti-inflammatory immune response due to increased IL-10 expression and
subsequent inhibition of a Th1 pro-inflammatory immune response, thereby mediating
susceptibility to infectious disease, but resistance to Th1 mediated autoimmune disease.
8.6 Conclusions
Infectious and autoimmune diseases are complex multifactorial diseases, where multiple
genetic (both host and pathogen) and environmental factors play an aetiological role.
Elucidation of host genetic factors involved in these complex diseases will help to
develop new preventative and therapeutics strategies, ultimately lowering the burden of
these diseases. Prior to the completion of this study, a strong link between SLC11A1 and
disease occurrence had not been observed in humans, due to the inconsistent findings of
association studies. The findings presented in this thesis suggest that SLC11A1 does
play a role in influencing susceptibility to both infectious and autoimmune diseases.
While the observed association identified may only be a modest contribution to disease
incidence, as compared to other genetic loci (i.e. HLA locus), the current findings are
significant in elucidating the multiple host genetic factors involved in these complex
diseases.
315
The findings of the current study suggest that the presence of at least one polymorphism
in the 5’ LD region of SLC11A1 is responsible for altering the host phenotype to
influence the occurrence of both infectious and autoimmune disease. Of the
polymorphisms located in the 5’ LD region, the promoter (GT)n microsatellite repeat
and the -237C/T polymorphism, identified in this and previous studies to alter SLC11A1
expression levels, are the most likely candidates for the observed association (Decobert
et al., 2006, Gazouli et al., 2008a, Searle and Blackwell, 1999, Zaahl et al., 2004).
Furthermore, based on the findings of the bioinformatic analyses, functional reporter
assays and meta-analyses, it was observed that (GT)n allele 2 is likely to be the disease
causing variant of the (GT)n repeat, driving low SLC11A1 expression (compared to
allele 3) to putatively alter disease susceptibility due to a heightened anti-inflammatory
immune response, attributable to increased IL-10 expression. Through the use of murine
models, it has been observed that modest reductions in Slc11a1 expression can result in
significant phenotypic consequences (Kissler et al., 2006, Soe-Lin et al., 2009, Soe-Lin
et al., 2008). This suggests that a similar reduction in SLC11A1 promoter activity, as
identified with (GT)n allele 2, compared to allele 3, will also result in an altered cellular
phenotype to influence disease susceptibility.
While significant associations were observed in the meta-analyses between the (GT)n
alleles and the incidence of specific diseases (i.e. tuberculosis and Type 1 diabetes),
there is a pressing need for the completion of large unbiased studies assessing the
association of the (GT)n alleles with other specific diseases (e.g. leprosy and
salmonella). The completion of such studies will be aided through the use of the
sensitive and high-throughput HRM genotyping methodology designed and optimised
in the current study. The completion of these large studies will ensure that studies have
the power to detect true associations.
While this study has identified important regions involved in SLC11A1 expression, what
is clear is that the mechanisms controlling SLC11A1 expression are complex and this
study is the first phase in the understanding of these mechanisms. The level of SLC11A1
expression changes at different stages of monocyte to macrophage differentiation.
Furthermore, SLC11A1 plays a role in both the development of a Th1 pro-inflammatory
immune reponse and erythrophagocytosis, and the cellular levels of SLC11A1 are
altered by a range of exogenous factors (e.g. LPS, IFN-γ, EPO and iron). Putatively, the
316
mechanisms controlling expression of SLC11A1 at different stages of cellular
differentiation and function differ, adding further complexity to the regulation of
SLC11A1 expression. The current study has characterised the SLC11A1 promoter
specifically at the monocytic stage of cellular development. Due to the complexity of
SLC11A1 expression and the ability of SLC11A1 to influence disease susceptibility,
further examination of the SLC11A1 promoter is required to determine the mechanisms
by which SLC11A1 alters disease occurrence.
Through the use of multiple techniques, the current study has characterised the
SLC11A1 promoter and the mechanisms by which variants at the (GT)n and -237C/T
promoter polymorphisms regulate SLC11A1 expression. The work completed in this
thesis provides a basis for the determination of the mechanism by which SLC11A1
promoter variants alter the cellular phenotype through modulation of SLC11A1
expression to influence the incidence of infectious, autoimmune and other diseases. The
work completed in this study is significant in helping to determine the multiple host
genetic factors involved in infectious and autoimmune diseases, of which, the
involvement of SLC11A1 has become more evident.
317
APPENDIX
Appendix 1 ClustalW alignment of the promoter regions of 8 SLC11A1 homologs showing highly conserved regions.
Appendix 1
318
319
Appendix 2
Allele frequency determination from carrier frequency.
Carrier frequency describes the number of individuals who carry that allele. The allele
frequency can be determined from carrier frequency if the carrier frequency and the
total study numbers are known. If the carrier frequency of the wild type allele is A%
and the mutant is B%, then 100-B% describes the percent frequency of individuals who
are homozygous for A/A. Likewise, 100-A% describes the percent frequency of
individuals who are homozygous for B/B. Based on this, the overlap between A% and
B% is then equal to the percent frequency of individuals who are heterozygous A/B.
Taking into account the total number of individuals included in the study (n) then:
(100-B%) x n =number of individuals who are homozygous A
100
(100-A%) x n =number of individuals who are homozygous B
100
100-(100-B%)+(100-A%) x n = number of individuals who are heterozygous A/B
100
320
Appendix 3
Publications identified for inclusion in the meta-analysis of SLC11A1 polymorphisms with the incidence of
autoimmune disease
Study *
Disease
Population
John et al ., 1997
Rheumatoid arthritis
English
Stokkers et al ., 1999
Inflammatory bowel disease
Dutch
Graham et al ., 2000
Primary biliary cirrhosis
English
Maliarik et al ., 2000
Sarcoidosis
African Americans
Sanjeevi et al ., 2000
Juvenile rheumatoid arthritis
Latvian/Russian
Singal et al ., 2000
Rheumatoid arthritis
Canadian
Yang et al ., 2000a
Rheumatoid arthritis
Korean
Kojima et al ., 2001
Inflammatory bowel disease
Japanese
Kotze et al ., 2001
Multiple sclerosis
South African
Bassuny et al ., 2002
Type 1 diabetes
Japanese
Rodriguez et al ., 2002
Rheumatoid arthritis
Spanish
Akahoshi et al ., 2004
Sarcoidosis
Japanese
Comabella et al ., 2004
Multiple sclerosis
Spanish
Takahashi et al ., 2004
Type 1 diabetes
Japanese
Crawford et al ., 2005
Inflammatory bowel disease
Caucasian
Dubaniewicz et al ., 2005
Sarcoidosis
Polish
Maier et al ., 2005
Type 1 diabetes
Mixed
Nishino et al ., 2005
Type 1 diabetes
Japanese
Runstadler et al ., 2005
Juvenile rheumatoid arthritis
Finnish
Kim et al ., 2006
Behcet's disease
Korean
Sechi et al ., 2006
Crohn's disease
Sardinians
Yen et al ., 2006
Rheumatoid arthritis
Taiwanese
Zaahl et al ., 2006
Inflammatory bowel disease
South African (mixed)
Chermesh et al ., 2007
Crohn's disease
Ashkenazi Jews
Gazouli et al ., 2007
Sarcoidosis
Greek
Ates et al ., 2008
Systemic sclerosis
Turkish
Gazouli et al ., 2008a
Crohn's disease
Greek
Gazouli et al ., 2008b
Multiple sclerosis
Sardinians
Kotlowski et al ., 2008
Ulcerative colitis
Canadian
Ates et al ., 2009a
Behcet's disease
Turkish
Ates et al ., 2009b
Rheumatoid arthritis
Dutch
Paccagnini et al ., 2009
Type 1 diabetes
Italian
Ates et al ., 2010
Multiple sclerosis
Turkish
Yang et al ., unpublished
Type 1 diabetes
Great Britain
* Publications listed in chronological order and by first author.
321
Appendix 4
Publications identified for inclusion in the meta-analysis of SLC11A1 polymorphisms with the incidence of infectious disease.
Publication
Population
Disease
Liu et al ., 1995
Blackwell et al ., 1997
Bellamy et al ., 1998
Huang et al ., 1998
Roy et al ., 1999
Gao et al ., 2000
Ryu et al ., 200
Calzada et al ., 2001
Dunstan et al ., 2001
Meisner et al ., 2001
Awomoyi et al ., 2002
Delgado et al ., 2002
Ma et al ., 2002
Liaw et al ., 2002
Puzyrev et al ., 2002
Selvaraj et al ., 2002
Soborg et al ., 2002
Abe et al ., 2003
Duan et al ., 2003
Kim et al ., 2003
Liu et al ., 2003
Ouchi et al ., 2003
Akahoshi et al ., 2004
Ferreria et al ., 2004
Fitness et al ., 2004a
Fitness et al ., 2004b
Hoal et al ., 2004
Liu et al ., 2004
Dubaniewicz et al ., 2005
Koh et al ., 2005
Zhang et al ., 2005
An et al ., 2006
Bravo et al ., 2006
Druszcynska et al ., 2006
Freidin et al ., 2006
Hsu et al ., 2006
Stienstra et al ., 2006
Taype et al , 2006
Leung et al ., 2007
Nino-Moreno et al ., 2007
Sahiratmadja et al ., 2007
Soborg et al ., 2007
Tanaka et al ., 2007
Qu et al ., 2007
Vejbaesya et al ., 2007a
Vejbaesya et al ., 2007b
Asai et al ., 2008
Doorduyn et al., 2008
Farnia et al ., 2008
Ates et al ., 2009b
Chen et al ., 2009
Jin et al ., 2009
Merza et al ., 2009
Castellucci et al ., 2010
de Wit et al ., 2010
Hatta et al ., 2010
Haverkamp et al ., 2010
Motsinger-Reif et al ., 2010
Samaranayake et al ., 2010
Hong Kong/Canadian
Brazilian
Gambian
American
Indian
Japanese
Korean
Peruvian
Vietnamese
Malian
Gambian
Cambodian
American
Chinese Han & Aboriginal
Slavonic
Indian
Danish
Japanese
Chinese Han
Korean
Chinese Han
Japanese
Japanese
Brazil
Malawian
Malawian
South African coloured
Chinese Han
Polish
South Korean
Chinese
Chinese Han
Spanish
Polish
Tuvinians
Taiwanese Aboriginals/Han
Ghanaian
Peruvian
Chinese
Mexican
Indonesian
Tanzanian
Japanese
Chinese
Thai
Thai
Japanese
Dutch
Iranian
Dutch
Tibetian
Chinese Han
Iranian
Brazilian
South African coloured
Indonesian
Dutch
American
Sri Lankan
* Publications listed in chronological order and by first author.
Tuberculosis
Tuberculosis
Tuberculosis
Mycobacterium avium
Leprosy
Tuberculosis
Tuberculosis
Chagas' disease (T. Cruzi)
Typhoid Fever
Leprosy
Tuberculosis
Tuberculosis
Tuberculosis
Tuberculosis
Tuberculosis
Tuberculosis
Tuberculosis
Tuberculosis
Tuberculosis
Tuberculosis
Tuberculosis
Kawasaki
Tuberculosis
Leprosy/Mitsuda reacion
Leprosy
Tuberculosis
Tuberculosis
Tuberculosis
Tuberculosis
Non-tuberculosis mycobacteria
Tuberculosis
Tuberculosis
Brucellosis
Tuberculosis
Tuberculosis
Tuberculosis
Mycobacteria ulcerans
Tuberculosis
Tuberculosis
Tuberculosis
Tuberculosis
Tuberculosis
Mycobacterium avium
Tuberculosis
Tuberculosis
Leprosy
Tuberculosis/Mycobacterium avium
Salmonella/Campylobacter
Tuberculosis
Tuberculosis
Tuberculosis
Pediatric TB
Tuberculosis
Leishmania
Tuberculosis
Tuberculosis
Non-tuberculosis mycobacteria
Tuberculosis
Cutaneous Leishmania
322
Appendix 5
Appendix 5a SLC11A1 allele 3 frequencies (case versus controls) of all the individual association studies included in the meta-analysis.
Population
Inflammatory bowel disease
Kojima et al ., 2001
Crawford et al ., 2005
Zaahl et al ., 2006
Zaahl et al ., 2006
Zaahl et al ., 2006
Sechi et al ., 2006
Chermesh et al ., 2007
Gazouli et al ., 2008a
Kotlowski et al ., 2008
Multiple sclerosis
Kotze et al ., 2001
Comabella et al ., 2004
Gazouli et al ., 2008b
Ates et al ., 2010
Primary biliary cirrhosis
Graham et al ., 2000
Rheumatoid arthritis
John et al ., 1997
Singal et al ., 2000
Yang et al ., 2000a
Rodriguez et al ., 2002
Ates et al ., 2009b
Juvenile rhumatoid arthritis
Sanjeevi et al ., 2000
Runstadler et al ., 2005
Sarcoidosis
Maliarik et al ., 2000
Dubaniewicz et al ., 2005
Gazouli et al ., 2007
Type 1 diabetes
Bassuny et al ., 2002
Takahashi et al ., 2004
Nishino et al ., 2005
Paccagnini et al ., 2009
Yang et al ., unpublished
Systemic Sclerosis
Ates et al ., 2008
Behcet's disease
Kim et al ., 2006
Ates et al ., 2009a
Japanese
Caucasian
European/African
European
African
Sardians
Israeli
Greek
Canadian
African (Caucasian)
Spanish
Sardians
Turkish
British
American
Canadian
Korean
Spanish
Dutch
Latvian/Russian
Finnish
African American
Polish
Greek
Japanese
Japanese
Japanese
Italian
Great Britain
Study Numbers
Allele Frequencies
Allele Frequencies
OR (95% CI)
n (# people)
2n (# alleles)
Allele 3 +
Allele 3 -
Allele 3 +
Allele 3 -
Case Control
Case Control
Case Control
Case Control
Case Control
Case Control
215
324
430
648
277
90
554
180
77
110
154
220
16
57
32
114
9
25
18
50
37
34
74
68
174
131
348
262
274
200
548
400
Requested data not forthcoming.
317
423
118
27
16
53
244
324
520
136
176
89
42
49
173
196
113
131
36
5
2
21
104
224
128
44
44
25
8
19
89
204
74
76
77
84
89
72
70
59
80
76
80
78
84
72
66
49
26
24
23
16
11
28
30
41
20
24
20
22
16
28
34
51
0.69 (0.52-0.92)
1.04 (0.71-1.55)
0.82 (0.50-1.35)
1.52 (0.53-4.34)
1.52 (0.29-7.96)
0.98 (0.47-2.04)
1.21 (0.86-1.70)
1.51 (1.16-1.95)
104
195
60
100
329
125
66
104
208
390
120
200
658
250
132
208
160
260
72
139
434
178
60
148
48
130
48
61
224
72
72
60
77
67
60
69.5
66
71
45
71
23
33
40
30.5
34
29
55
29
1.72 (1.20-2.47)
0.81 (0.57-1.14)
1.80 (1.09-2.97)
0.92 (0.60-1.41)
53
78
106
156
70
110
36
46
66
71
34
29
0.81 (0.48-1.38)
85
92
74
141
98
96
88
50
194
133
170
184
148
282
196
192
176
100
388
266
129
132
115
189
151
136
131
80
277
217
41
52
33
93
45
56
45
20
111
49
76
72
78
67
77
71
74
80
71
82
24
28
22
33
23
29
26
20
29
18
1.30 (0.81-2.07)
0.87 (0.55-1.39)
0.87 (0.47-1.63)
0.81 (0.58-1.13)
0.76 (0.48-1.19)
201
155
37
67
84
70
16
30
2.35 (1.49-3.69)
253
144
114
157
136
186
61
28
86
67
46
214
81
84
57
70
75
46.5
19
16
43
30
25
53.5
1.77 (1.19-2.64)
1.74 (1.03-2.94)
1.53 (1.08-2.15)
150
359
187
205
68
50
11395 10732
40
41
24
3999
89
55
26
4010
79
82
74
74
80
79
66
73
21
18
26
26
20
21
34
27
0.93 (0.61-1.41)
1.22 (0.78-1.92)
1.47 (0.76-2.86)
1.06 (1.01-1.12)
119
111
238
222
Requested data not forthcoming.
157
86
100
112
91
200
314
172
200
224
182
400
Requested data not forthcoming.
95
224
190
448
114
130
228
260
46
38
92
76
7697 7371 15394 14742
Turkish
52
136
104
272
75
231
29
41
72
85
28
15
0.46 (0.27-0.79)
Korean
Turkish
99
102
98
102
198
204
196
204
141
161
158
168
57
43
38
36
71
79
81
82
29
21
19
18
0.59 (0.37-0.95)
0.80 (0.49-1.31)
"+" and "-" indicate the presence of allele 3 or the absence of allele 3, respectively.
323
Appendix 5b SLC11A1 allele 2 frequencies (case versus controls) of all the individual association studies included in the meta-analysis.
Population
Inflammatory bowel disease
Kojima et al ., 2001
Crawford et al ., 2005
Zaahl et al ., 2006
Zaahl et al ., 2006
Zaahl et al ., 2006
Sechi et al ., 2006
Chermesh et al ., 2007
Gazouli et al ., 2008a
Kotlowski et al ., 2008
Multiple sclerosis
Kotze et al ., 2001
Comabella et al ., 2004
Gazouli et al ., 2008b
Ates et al ., 2010
Primary biliary cirrhosis
Graham et al ., 2000
Rheumatoid Arthritis
John et al ., 1997
Singal et al ., 2000
Yang et al ., 2000a
Rodriguez et al ., 2002
Ates et al ., 2009b
Juvenile rhumatoid arthritis
Sanjeevi et al ., 2000
Runstadler et al ., 2005
Sarcoidosis
Maliarik et al ., 2000
Dubaniewicz et al ., 2005
Gazouli et al ., 2007
Type 1 diabetes
Bassuny et al ., 2002
Takahashi et al ., 2004
Nishino et al ., 2005
Paccagnini et al ., 2009
Yang et al ., unpublished
Systemic Sclerosis
Ates et al ., 2007b
Behcet's disease
Kim et al ., 2006
Ates et al ., 2008a
Japanese
Caucasian
European/African
European
African
Sardians
Israeli
Greek
Canadian
African (Caucasian)
Spanish
Sardians
Turkish
British
American
Canadian
Korean
Spanish
Dutch
Study Numbers
Allele Frequencies
n (# people)
2n (# alleles)
Case Control
Case Control
215
324
430
648
277
90
554
180
77
110
154
220
16
57
32
114
9
25
18
50
37
34
74
68
174
131
348
262
274
200
548
400
Requested data not forthcoming.
Case Control
OR (95% CI)
Allele 2 -
Allele 2 +
Allele 2 -
Case Control
Case Control
Case Control
65
131
34
5
2
13
99
150
96
42
42
23
8
9
84
132
365
423
120
27
16
61
249
398
552
138
178
91
42
59
178
268
15
24
22
16
11
18
28
27
15
23
19
20
16
13
32
33
85
76
78
84
89
82
72
73
85
77
81
80
84
87
68
67
1.02 (0.73-1.44)
1.02 (0.68-1.51)
1.20 (0.72-2.00)
0.73 (0.25-2.11)
0.66 (0.13-3.43)
1.40 (0.56-3.51)
0.84 (0.59-1.19)
0.77 (0.58-1.01)
104
195
60
100
329
125
66
104
208
390
120
200
658
250
132
208
41
127
35
58
223
71
46
56
167
263
85
142
435
179
86
152
20
33
29
29
34
28
35
27
80
67
71
71
66
72
65
73
0.48 (0.33-0.70)
1.22 (0.86-1.72)
0.77 (0.45-1.31)
1.11 (0.72-1.71)
53
78
106
156
28
42
78
114
26
27
74
73
0.97 (0.56-1.70)
85
92
74
141
98
96
88
50
194
133
170
184
148
282
196
192
176
100
388
266
41
50
25
91
43
56
45
18
108
49
129
134
123
191
153
136
131
82
280
217
41
27
17
32
22
56
25
18
28
18
129
73
83
68
78
136
74
82
72
82
0.77 (0.48-1.23)
1.09 (0.68-1.74)
0.93 (0.48-1.80)
1.24 (0.88-1.73)
1.24 (0.79-1.97)
37
65
201
157
16
29
84
71
0.44 (0.28-0.70)
28
62
46
142
144
138
136
258
16
31
25
35.5
84
69
75
64.5
0.57 (0.34-0.97)
0.82 (0.57-1.17)
49
22
21
67
3999
65
69
36
75
4010
363
335
168
379
207
224
77
43
11395 10732
12
12
9
47
26
16
15
14
64
27
88
88
91
53
74
84
85
86
36
73
0.70 (0.47-1.04)
0.72 (0.43-1.20)
0.63 (0.36-1.12)
1.21 (0.74-1.97)
0.94 (0.89-0.99)
Latvian/Russian
Finnish
119
111
238
222
Requested data not forthcoming.
African American
Polish
Greek
Requested data not forthcoming.
86
91
172
182
100
200
200
400
Japanese
Japanese
Japanese
Italian
Great Britain
Allele 2 +
Allele Frequencies
206
95
114
59
7697
200
224
130
72
7371
412
400
190
448
228
260
118
144
15394 14742
Turkish
52
136
104
272
29
41
75
231
28
15
72
85
2.18 (1.27-3.75)
Korean
Turkish
99
102
98
102
198
204
196
204
38
43
27
36
160
161
169
168
19
21
14
18
81
79
86
82
1.49 (0.87-2.55)
1.25 (0.76-2.04)
"+" and "-" indicate the presence of allele 2 or the absence of allele 2, respectively.
324
Appendix 6
Appendix 6a SLC11A1 frequencies (case versus controls) of all the individual association studies included in the meta-analyses.
Population
-237C/T
Inflammatory bowel disease
Zaahl et al ., 2006
Zaahl et al ., 2006
Zaahl et al ., 2006
Gazouli et al ., 2008a
Kotlowski et al ., 2008
Sarcoidosis
Gazouli et al ., 2007
Type 1 diabetes
Paccagnini et al ., 2009
Yang et al ., unpublished
274C/T
Inflammatory bowel disease
Stokkers et al ., 1999
Gazouli et al ., 2008a
Rheumatoid Arthritis
Yang et al ., 2000a
Singal et al ., 2000
Yen et al ., 2006
Sarcoidosis
Dubaniewicz et al ., 2005
Gazouli et al ., 2007
Type 1 diabetes
Paccagnini et al ., 2009
Yang et al ., unpublished
469+14G/C (INT4)
Inflammatory bowel disease
Sechi et al ., 2006
Gazouli et al ., 2008a
Multiple sclerosis
Ates et al ., 2010
Rheumatoid Arthritis
Yang et al ., 2000a
Singal et al ., 2000
Yen et al ., 2006
Ates et al ., 2009b
Sarcoidosis
Maliarik et al ., 2000
Dubaniewicz et al ., 2005
Gazouli et al ., 2007
Type 1 diabetes
Paccagnini et al ., 2009
Yang et al ., unpublished
Systemic Sclerosis
Ates et al ., 2008
Behcet's disease
Ates et al ., 2009a
577-18G/A
Rheumatoid arthritis
Yang et al ., 2000a
Singal et al ., 2000
Yen et al ., 2006
Sarcoidosis
Gazouli et al ., 2007
Inflammatory bowel disease
Gazouli et al ., 2008a
Type 1 diabetes
Paccagnini et al ., 2009
823C/T
Inflammatory bowel disease
Stokkers et al ., 1999
Sechi et al ., 2006
Gazouli et al ., 2008a
Rheumatoid arthritis
Yang et al ., 2000a
Singal et al ., 2000
Yen et al ., 2006
Sarcoidosis
Gazouli et al ., 2007
Type 1 diabetes
Paccagnini et al ., 2009
Study Numbers
Allele Frequencies
n (# people)
2n (# alleles)
Case Control
Case Control
Wildtype
Case Control
Allele Frequencies
OR (95% CI)
Mutant
% Wildtype
% Mutant
Case Control
Case Control
Case Control
SAfr/EurAfr desc
SAfr/Eur desc
SAfr/Afr desc
Greek
Canadian
77
16
9
274
200
110
57
25
200
100
154
32
18
548
400
220
114
50
400
200
151
30
18
537
340
198
106
47
386
164
3
2
0
11
60
22
8
3
14
36
98
94
100
98
85
90
93
94
96.5
82
2
6
0
2
15
10
7
6
3.5
18
0.18 (0.05-0.61)
0.88 (0.18-4.38)
0.02 (0.0-18875)
0.56 (0.25-1.26)
0.80 (0.51-1.26)
Greek
100
200
200
400
196
386
4
14
98
96.5
2
3.5
0.56 (0.18-1.73)
46
5649
38
6233
68
50
10651 11734
24
647
26
732
74
94
66
94
26
6
34
6
0.68 (0.35-1.32)
0.97 (0.87-1.09)
Dutch
Greek
187
274
255
200
374
548
510
400
251
460
362
354
123
88
148
46
67
84
71
88.5
33
16
29
11.5
1.20 (0.90-1.60)
1.47 (1.00-2.16)
Korean
Canadian
Taiwanese
74
92
113
53
88
74
148
184
226
106
176
148
124
128
202
85
126
137
24
56
24
21
50
11
84
69
89
80
72
93
16
31
11
20
28
7
0.94 (0.89-0.99)
1.10 (0.70-1.74)
1.48 (0.70-3.12)
Polish
Greek
69
100
84
200
138
200
168
400
105
177
132
354
33
23
36
46
76
88.5
79
88.5
24
11.5
21
11.5
1.15 (0.67-1.97)
1.00 (0.59-1.70)
59
5578
72
6048
118
144
11156 12096
43
8223
77
8765
75
2933
67
3331
36
74
53
72
64
26
47
28
2.00 (1.22-3.30)
0.94 (0.89-0.99)
Sardinian
Greek
37
274
34
200
74
548
68
400
49
450
54
352
25
98
14
48
66
82
79
88
34
18
21
12
1.97 (0.92-4.21)
1.60 (1.10-2.32)
Turkish
100
104
200
208
153
168
47
40
76.5
81
23.5
19
1.29 (0.80-2.07)
Korean
Canadian
Taiwanese
Dutch
73
92
113
98
52
88
74
133
146
184
226
196
104
176
148
266
127
123
203
153
92
133
137
234
19
61
23
43
12
43
11
32
87
67
90
78
88
76
93
88
13
33
10
22
12
24
7
12
1.15 (0.53-2.48)
1.53 (0.97-2.43)
1.41 (0.67-2.99)
2.06 (1.25-3.39)
African American
Polish
Greek
157
78
100
112
88
200
314
156
200
224
176
400
285
137
174
197
141
352
29
19
26
27
35
48
78
91
88
88
88
80
22
9
12
12
12
20
0.74 (0.43-1.29)
0.56 (0.30-1.02)
1.10 (0.66-1.83)
43
77
12883 15106
75
4691
67
6116
36
73
53
71
64
27
47
29
0.46 (0.18-1.15)
0.90 (0.86-0.94)
Italian
Great Britain
Italian
Great Britain
Italian
Great Britain
59
72
8787 10611
92
76
11298 12466
118
144
17574 21222
Turkish
52
136
104
272
77
239
27
33
87
88
13
12
2.54 (1.44-4.49)
Turkish
102
102
204
204
157
179
47
25
77
88
23
12
2.14 (1.26-3.64)
Korean
Canadian
Taiwanese
73
92
113
53
88
74
146
184
226
106
176
148
138
184
217
103
176
141
8
0
9
3
0
7
95
100
96
97
100
95
5
0
4
3
0
5
1.99 (0.52-7.69)
Zero observation
0.84 (0.30-2.29)
Greek
100
200
200
400
189
376
11
24
94.5
94
5.5
6
0.91 (0.44-1.90)
Greek
274
200
548
400
526
376
22
24
96
94
4
6
0.66 (0.36-1.19)
Italian
59
76
118
152
118
144
0
8
100
95
0
5
0.00 (0-3.1×10⁷ )
Dutch
Sardinian
Greek
189
37
274
238
34
200
378
74
548
476
68
400
352
58
403
450
66
278
26
16
145
26
2
122
93
78
74
95
97
69.5
7
22
26
5
3
30.5
Korean
Canadian
Taiwanese
73
92
113
48
88
74
146
184
226
96
176
148
132
170
187
95
159
102
14
14
39
1
17
46
90
93
83
99
90
69
10
7
17
1
10
31
Greek
100
200
200
400
143
278
57
122
71.5
69.5
28.5
30.5
0.91 (0.63-1.32)
Italian
44
70
88
140
88
139
0
1
100
99
0
1
0.01 (0-1.8×10⁸ )
1.28 (0.73-2.24)
9.10 (2.01-41.28)
0.82 (0.62-1.09)
10.08 (1.30-77.94)
0.77 (0.37-1.61)
0.46 (0.28-0.75)
325
Appendix 6b SLC11A1 frequencies (case versus controls) of all the individual association studies included in the meta-analyses.
Population
1029C/T A318V
Rheumatoid arthritis
Yang et al ., 2000a
Singal et al ., 2000
Yen et al ., 2006
Sarcoidosis
Maliarik et al ., 2000
Gazouli et al ., 2007
Behcet's disease
Kim et al ., 2006
Inflammatory bowel disease
Gazouli et al ., 2008a
Type 1 diabetes
Paccagnini et al ., 2009
1465-85G/A
Rheumatoid arthritis
Yang et al ., 2000a
Singal et al ., 2000
Runstadler et al ., 2005
Yen et al ., 2006
Sarcoidosis
Dubaniewicz et al ., 2005
Gazouli et al ., 2007
Inflammatory bowel disease
Gazouli et al ., 2008a
Type 1 diabetes
Paccagnini et al ., 2009
Yang et al ., unpublished
1730G/A (D543N)
Inflammatory bowel disease
Sechi et al ., 2006
Gazouli et al ., 2008a
Multiple sclerosis
Comabella et al ., 2004
Ates et al ., 2010
Rheumatoid Arthritis
Yang et al ., 2000a
Singal et al ., 2000
Yen et al ., 2006
Ates et al ., 2009b
Sarcoidosis
Maliarik et al ., 2000
Akahoshi et al ., 2004
Gazouli et al ., 2007
Type 1 diabetes
Paccagnini et al ., 2009
Yang et al ., unpublished
Systemic Sclerosis
Ates et al ., 2008
Behcet's disease
Kim et al ., 2006
Ates et al ., 2009a
1729+55del4 (TGTG ins/del)
Sarcoidosis
Maliarik et al ., 2000
Gazouli et al ., 2007
Rheumatoid arthritis
Yang et al ., 2000a
Singal et al ., 2000
Runstadler et al ., 2005
Yen et al ., 2006
Ates et al ., 2009b
Multiple sclerosis
Comabella et al ., 2004
Ates et al., 2010
Inflammatory bowel disease
Sechi et al ., 2006
Kotlowski et al ., 2008
Gazouli et al ., 2008a
Type 1 diabetes
Paccagnini et al ., 2009
Yang et al ., unpublished
Systemic sclerosis
Ates et al ., 2008
Behcet's disease
Ates et al ., 2009a
1729+271del4 (CAAA)n
Multiple sclerosis
Comabella et al ., 2004
Sarcoidosis
Dubaniewicz et al ., 2005
Inflammatory bowel disease
Kotlowski et al ., 2008
Study Numbers
Allele Frequencies
n (# people)
2n (# alleles)
Case Control
Case Control
Wildtype
Case Control
Allele Frequencies
OR (95% CI)
Mutant
% Wildtype
% Mutant
Case Control
Case Control
Case Control
Korean
Canadian
Taiwanese
74
92
113
53
88
74
148
184
226
106
176
148
148
184
224
106
176
147
0
0
1
0
0
2
100
100
99
100
100
99
0
0
1
0
0
1
Zero observation
Zero observation
0.32 (0.03-3.61)
Afr American
Greek
157
100
112
200
314
200
224
400
314
197
224
394
0
3
0
6
100
98.5
100
98.5
0
1.5
0
1.5
Zero observation
1.00 (0.25-4.04)
99
98
198
196
198
196
0
0
100
100
0
0
Zero observation
Greek
274
200
548
400
544
394
4
6
99
98.5
1
1.5
0.48 (0.14-1.72)
Italian
40
48
80
96
80
92
0
4
100
96
0
4
0.01 (0.00-4664)
100
113
84
113
48
71
22
63
68
61
79
64
32
39
21
36
1.83 (1.02-3.28)
1.13 (0.73-1.73)
153
100
73
48
68
68
32
32
0.99 (0.64-1.55)
Korean
Korean
Canadian
Finnish
Taiwanese
74
53
148
106
92
88
184
176
Requested data not forthcoming.
113
74
226
148
Polish
Greek
82
100
93
200
164
200
186
400
122
130
127
270
42
70
59
130
74
65
68
67.5
26
35
32
32.5
0.74 (0.46-1.18)
1.12 (0.78-1.60)
Greek
274
200
548
400
363
270
185
130
66
67.5
34
32.5
1.06 (0.80-1.39)
58
5549
59
5872
116
118
11098 11744
63
6786
78
7086
53
4312
40
4658
54
61
66
60
46
39
34
40
1.64 (0.97-2.78)
0.97 (0.92-1.02)
Sardinian
Greek
37
274
34
200
74
548
68
400
57
316
52
302
17
232
16
98
77
58
76
75.5
23
42
24
24.5
0.97 (0.44-2.11)
2.26 (1.70-3.01)
Spanish
Turkish
195
100
125
104
390
200
250
208
377
195
245
203
13
5
5
5
97
97.5
98
98
3
2.5
2
2
1.69 (0.59-4.80)
1.04 (0.30-3.65)
Korean
Canadian
Taiwanese
Dutch
74
92
113
98
51
88
74
133
148
184
226
196
102
176
148
266
126
184
185
188
98
169
106
261
22
0
41
8
4
7
42
5
85
100
82
96
96
96
72
98
15
0
18
4
4
4
28
2
4.28 (1.43-12.82)
0.00 (0.0-94237)
0.56 (0.34-0.91)
2.22 (0.72-6.90)
296
203
18
21
94
91
6
9
0.59 (0.31-1.13)
160
302
40
98
80
75.5
20
24.5
0.77 (0.51-1.17)
115
136
10755 11908
3
241
2
216
97
98
99
98
3
2
1
2
1.77 (0.29-10.80)
1.24 (1.03-1.49)
Italian
Great Britian
African American
Japanese
Greek
Italian
Great Britain
157
112
314
224
Requested data not forthcoming.
100
200
200
400
59
5498
69
6062
Turkish
52
136
104
272
103
267
1
5
99
98
1
2
0.52 (0.06-4.49)
Korean
Turkish
99
102
98
102
198
204
196
204
176
157
172
179
22
47
24
25
89
77
88
88
11
23
12
12
0.90 (0.48-1.66)
1.51 (0.25-9.12)
Afr American
Greek
157
100
112
200
314
200
224
400
257
175
171
356
57
25
53
44
82
87.5
76
89
18
12.5
24
11
0.72 (0.47-1.09)
1.16 (0.68-1.95)
125
184
98
169
23
0
4
7
84
100
96
96
16
0
4
4
154
188
82
261
72
8
66
5
68
96
55
98
32
4
45
2
0.58 (0.38-0.89)
2.22 (0.72-6.90)
2.84 (0.80-10.07)
1.04 (0.30-3.65)
Korean
Canadian
Finnish
Taiwanese
Dutch
118
138
10996 12124
74
51
148
102
92
88
184
176
Requested data not forthcoming.
113
74
226
148
98
133
196
266
4.51 (1.51-13.48)
0.00 (0.00-94237)
Spanish
Turkish
195
100
125
104
390
200
250
208
377
195
247
203
13
5
3
5
97
97.5
99
98
3
2.5
1
2
Sardinian
Canadian
Greek
37
200
274
34
100
200
74
400
548
68
200
400
52
382
491
58
191
356
22
18
57
10
9
44
70
95.5
90
85
95.5
89
30
4.5
10
15
4.5
11
59
8463
46
9835
118
92
16614 19371
0
312
0
299
100
98
100
98
0
2
0
2
Zero observation
1.22 (1.04-1.43)
Italian
Great Britian
Turkish
118
92
16926 19670
2.45 (1.06-5.66)
1.00 (0.44-2.27)
0.94 (0.62-1.42)
52
136
104
272
103
267
1
5
99
98
1
2
0.52 (0.06-4.49)
Great Britian
102
102
204
204
201
202
3
2
99
99
1
1
1.51 (0.25-9.12)
Spanish
195
125
390
250
236
160
154
90
61
64
39
36
1.16 (0.84-1.61)
85
84
170
168
114
110
56
58
67
65
33
35
0.93 (0.59-1.46)
200
100
400
200
264
124
136
76
66
62
34
38
0.84 (0.59-1.20)
Polish
Canadian
326
Appendix 7
Appendix 7a SLC11A1 allele 3 frequencies (case versus controls) of all the individual association studies included in the meta-analysis.
Population
Mycobacterium leprae
Roy et al ., 1999
Meisner et al ., 2001
Ferreria et al ., 2004
Fitness et al ., 2004b
Mycobacterium avium
Huang et al ., 1998
Tanaka et al ., 2007
Mycobacterium tuberculosis
Liu et al ., 1995
Blackwell et al ., 1997
Bellamy et al ., 1998
Gao et al ., 2000
Awomoyi et al ., 2002
Ma et al ., 2002
Selvaraj et al ., 2002
Soborg et al ., 2002
Fitness et al ., 2004a
Hoal et al ., 2004
Dubaniewicz et al ., 2005
Hsu et al ., 2006
Hsu et al ., 2006
Leung et al ., 2007
Soborg et al ., 2007
Ates et al ., 2009b
Chen et al ., 2009
de Wit et al ., 2010
Motsinger-Reif et al ., 2010
Other
Calzada et al ., 2001
Dunstan et al ., 2001
Ouchi et al ., 2003
Bravo et al ., 2006
Study Numbers
Allele Frequencies
n (# people)
2n (# alleles)
Case Control
Case Control
Allele 3 +
Case Control
Allele Frequencies
Allele 3 -
Allele 3 +
Case Control
Case Control
OR (95% CI)
Allele 3 Case Control
Indian
Malian
Brazil
Malawian
227
165
454
330
Requested data not forthcoming.
90
61
180
122
249
423
498
846
357
271
97
59
79
82
21
18
0.80 (0.56-1.15)
113
391
70
627
67
107
52
219
63
79
57
74
37
21
43
26
1.25 (0.78-2.00)
1.28 (0.98-1.66)
American
Japanese
Requested data not forthcoming.
111
177
222
354
176
281
46
73
79
79
21
21
0.99 (0.66-1.50)
Hong Kong/Canadian
Brazilian
Gambian
Japanese
Gambian
American
Indian
Danish
Malawian
South African coloured
Polish
Taiwanese (Aboriginals)
Taiwainese (Han)
Chinese
Tanzanian
Dutch
Tibetian
South African coloured
American
12
18
24
36
Requested data not forthcoming.
401
410
802
820
267
202
534
404
329
324
658
648
113
108
226
216
Requested data not forthcoming.
70
176
140
352
232
778
464 1556
226
261
452
522
83
91
166
182
101
88
202
176
110
78
220
156
278
282
556
564
428
427
856
834
112
80
224
160
140
139
280
278
498
315
996
630
Requested data not forthcoming.
Peru
Vietnam
Japansese
Spanish
79
214
71
56
85
288
110
89
158
428
142
112
170
576
220
178
22
30
2
6
92
83
8
17
2.20 (0.41-11.95)
651
405
514
158
705
345
544
174
151
129
144
68
115
59
104
42
81
76
78
70
86
85
84
81
19
24
22
30
14
15
16
19
0.70 (0.54-0.92)
0.54 (0.38-0.75)
0.68 (0.52-0.90)
0.56 (0.36-0.87)
109
361
349
121
183
190
478
676
186
184
776
231
1204
441
136
172
138
493
697
132
217
523
31
103
103
45
19
30
78
180
38
96
220
121
352
81
46
4
18
71
137
28
61
107
78
78
77
73
91
86
86
79
83
66
78
66
77
84
75
98
88
87
84
82.5
78
83
22
22
23
27
9
14
14
21
17
34
22
34
23
16
25
2
12
13
16
17.5
22
17
1.84 (1.17-2.90)
1.02 (0.80-1.31)
0.62 (0.45-0.86)
0.91 (0.56-1.47)
0.22 (0.07-0.67)
0.83 (0.44-1.54)
0.88 (0.62-1.25)
0.74 (0.58-0.94)
1.04 (0.61-1.78)
0.54 (0.37-0.78)
0.72 (0.56-0.93)
97
378
107
71
111
517
174
117
61
50
35
41
59
59
46
61
61
88
75
63
65
90
79
66
39
12
25
37
35
10
21
34
0.85 (0.54-1.33)
0.86 (0.58-1.29)
0.81 (0.49-1.33)
0.90 (0.55-1.48)
"+" and "-" indicate the presence of allele 3 or the absence of allele 3, respectively.
Appendix 7b SLC11A1 allele 2 frequencies (case versus controls) of all the individual studies association included in the meta-analysis.
Population
Mycobacterium leprae
Roy et al ., 1999
Meisner et al ., 2001
Ferreria et al ., 2004
Fitness et al ., 2004b
Mycobacterium avium
Huang et al ., 1998
Tanaka et al ., 2007
Mycobacterium tuberculosis
Liu et al ., 1995
Blackwell et al ., 1997
Bellamy et al ., 1998
Gao et al ., 2000
Awomoyi et al ., 2002
Ma et al ., 2002
Selvaraj et al ., 2002
Soborg et al ., 2002
Fitness et al ., 2004a
Hoal et al ., 2004
Dubaniewicz et al ., 2005
Hsu et al , 2006
Hsu et al , 2006
Leung et al ., 2007
Soborg et al ., 2007
Ates et al ., 2009b
Chen et al ., 2009
de Wit et al ., 2010
Motsinger-Reif et al ., 2010
Other
Calzada et al ., 2001
Dunstan et al ., 2001
Ouchi et al ., 2003
Bravo et al ., 2006
Study Numbers
Allele Frequencies
n (# people)
2n (# alleles)
Case Control
Case Control
Indian
Malian
Brazilian
Malawian
227
165
454
330
Requested data not forthcoming.
90
61
180
122
Requested data not forthcoming.*
American
Japanese
Requested data not forthcoming.
111
177
222
354
Hong Kong/Canadian
Brazilian
Gambian
Japanese
Gambian
American
Indian
Danish
Malawian
South African coloured
Polish
Taiwanese (Aboriginals)
Taiwanese (Han)
Chinese
Tanzanian
Dutch
Tibetian
South African coloured
American
12
18
24
36
Requested data not forthcoming.
Requested data not forthcoming.*
267
202
534
404
329
324
658
648
113
108
226
216
Requested data not forthcoming.
Requested data not forthcoming.*
Requested data not forthcoming.*
226
261
452
522
83
91
166
182
101
88
202
176
110
78
220
156
Requested data not forthcoming.*
Requested data not forthcoming.*
112
80
224
160
140
139
280
278
498
315
996
630
Requested data not forthcoming.
Peruvian
Vietnamese
Japansese
Spanish
79
214
71
56
85
288
110
89
158
428
142
112
170
576
220
178
Allele 2 +
Case Control
Allele Frequencies
OR (95% CI)
Allele 2 -
Allele 2 +
Allele 2 -
Case Control
Case Control
Case Control
97
59
357
271
21
18
79
82
1.25 (0.87-1.79)
59
45
121
77
33
37
67
63
0.83 (0.52-1.35)
26
48
196
306
12
14
88
86
0.85 (0.51-1.41)
2
4
22
32
8
11
92
89
0.73 (0.12-4.32)
93
121
67
50
89
42
441
537
159
354
559
174
17
18
30
12
14
19
83
82
70
88
86
81
1.49 (1.03-2.16)
1.42 (1.05-1.91)
1.75 (1.12-2.72)
103
45
15
26
81
46
1
16
349
121
187
194
441
136
175
140
23
27
7
12
16
25
1
10
77
73
93
88
84
75
99
90
1.61 (1.16-2.22)
1.10 (0.68-1.77)
14.04 (1.83-107)
1.17 (0.61-2.27)
38
96
217
28
61
106
186
184
779
132
217
524
17
34
22
17.5
22
17
83
66
78
82.5
78
83
0.96 (0.56-1.65)
1.86 (1.27-2.70)
1.38 (1.06-1.78)
60
46
19
41
58
49
39
59
98
382
123
71
112
527
181
119
38
11
13
37
34
9
18
33
58
89
87
63
66
91
82
67
1.18 (0.75-1.86)
1.30 (0.85-1.98)
0.72 (0.40-1.30)
1.16 (0.71-1.91)
"+" and "-" indicate the presence of allele 2 or the absence of allele 2, respectively. *Allele frequencies could not be determined as placed in group "other".
327
Appendix 8
Appendix 8a SLC11A1 469+14G/C frequencies (case versus controls) of all the individual association studies included in the meta-analysis.
Population
Mycobacterium leprae
Roy et al ., 1999
Meisner et al ., 2001
Vejbaesya et al ., 2007b
Hatta et al ., 2010
Mycobacterium avium
Tanaka et al ., 2007
Asai et al ., 2008
Non-TB Mycobacteria
Koh et al ., 2005
Stienstra et al ., 2006
Haverkamp et al ., 2010
Mycobacterium tuberculosis
Lui et al ., 1995
Bellamy et al ., 1998
Ryu et al , 2000
Puzyrev et al , 2002
Soborg et al ., 2002
Abe et al , 2003
Kim et al ., 2003
Liu et al ., 2003
Hoal et al ., 2004
Liu et al ., 2004
Dubaniewicz et al ., 2005
Zhang et al ., 2005
An et al ., 2006
Druszcynska et al ., 2006
Freidin et al ., 2006
Freidin et al ., 2006
Hsu et al , 2006
Hsu et al , 2006
Taype et al , 2006
Sahiratmadja et al ., 2007
Soborg et al ., 2007
Vejbaesya et al ., 2007a
Qu et al ., 2007
Asai et al ., 2008
Farnia et al ., 2008
Ates et al ., 2009b
Chen et al ., 2009
Jin et al ., 2009
Merza et al ., 2009
Hatta et al ., 2010
Motsinger-Reif et al., 2010
Other
Dunstan et al ., 2001
Castellucci et al ., 2010
Samaranayake et al ., 2010
Indian
Malian
Thai
Indonesian
Study Numbers
Allele Frequencies
n (# people)
2n (# alleles)
Case Control
Case Control
220
162
440
324
Requested data not forthcoming.
37
140
74
280
42
198
84
396
Wildtype
Case Control
Allele Frequencies
OR (95% CI)
Mutant
% Wildtype
% Mutant
Case Control
Case Control
Case Control
379
284
61
40
86
88
14
12
1.14 (0.75-1.75)
72
74
265
375
2
10
15
21
97
88
95
95
3
12
5
5
0.49 (0.11-2.20)
2.41 (1.09-5.33)
Japanese
Japanese
111
17
177
51
222
34
354
102
195
31
306
93
27
3
48
9
88
91
86
91
12
9
14
9
0.88 (0.53-1.46)
1.00 (0.25-3.93)
South Korean
Ghanaian
Dutch
41
169
81
50
184
212
82
338
162
100
368
424
64
319
112
89
350
311
18
19
50
11
18
113
78
94
69
89
95
73
22
6
31
11
5
27
2.28 (1.01-5.15)
1.16 (0.60-2.25)
1.23 (0.83-1.83)
22
718
33
768
2
84
3
54
92
90
92
93
8
10
8
7
1.00 (0.15-6.48)
1.66 (1.16-2.38)
94
154
164
62
199
396
193
132
219
164
239
154
86
321
505
377
141
167
22
54
26
20
21
82
47
26
35
44
113
26
4
21
77
103
35
15
81
74
86
76
90
83
80
84
86
79
68
86
96
94
87
79
80
92
19
26
14
24
10
17
20
16
14
21
32
14
4
6
13
21
20
8
0.87 (0.49-1.54)
0.74 (0.51-1.09)
0.94 (0.52-1.69)
6.94 (2.26-21.30)
1.61 (0.86-3.03)
1.36 (0.97-1.90)
0.89 (0.61-1.31)
0.79 (0.45-1.39)
1.78 (0.94-3.37)
196
428
452
197
190
777
419
778
279
99
91
111
189
267
226
193
110
73
180
484
232
184
165
681
704
777
278
222
93
65
141
272
747
100
375
92
56
38
106
13
26
483
3
106
19
23
23
31
35
13
46
41
6
11
48
42
42
2
19
345
16
85
16
22
9
13
19
6
123
20
21
12
78
92
81
94
88
62
99
88
94
81
80
78
84
95
83
82
95
87
79
92
85
99
90
66
98
90
95
91
91
83
88
98
86
83
95
88
22
8
19
6
12
38
1
12
6
19
20
22
16
5
17
18
5
13
21
8
15
1
10
34
2
10
5
9
10
17
12
2
14
17
5
12
1.07 (0.69-1.66)
1.02 (0.65-1.62)
1.30 (0.88-1.91)
6.07 (1.35-27.27)
1.19 (0.63-2.23)
1.23 (1.03-1.46)
0.32 (0.09-1.09)
1.25 (0.92-1.68)
1.18 (0.60-2.35)
2.34 (1.25-4.40)
2.61 (1.15-5.95)
1.40 (0.68-2.86)
1.37 (0.75-2.50)
2.21 (0.83-5.89)
1.24 (0.85-1.79)
1.06 (0.59-1.91)
0.97 (0.38-2.47)
1.16 (0.48-2.77)
203
136
21
14
91
91
9
9
1.00 (0.49-2.04)
372
374
22
22
94
94
6
6
1.01 (0.49-2.04)
Hong Kong/Canadian
Gambian
Korean
Slavonic
Danish
Japanese
Korean
Chinese Han
South African coloured
Chinese
Polish
Chinese
Chinese Han
Polish
Tuvinians
Russian
Taiwanese (Aboriginals)
Taiwanese (Han)
Peruvian
Indonesian
Tanzanian
Thai
Chinese
Japanese
Iranian
Dutch
Tibetian
Chinese Han
Iranian
Indonesian
American
12
18
24
36
401
411
802
822
Requested data not forthcoming.
58
104
116
208
104
176
208
352
95
90
190
180
41
45
82
90
110
171
220
342
239
291
478
582
120
240
240
480
79
88
158
176
127
91
254
182
Requested data not forthcoming.
126
114
252
228
233
263
466
526
279
137
558
274
105
93
210
186
108
92
216
184
630
513
1260 1026
211
360
422
720
442
431
884
862
149
147
298
294
61
122
122
244
57
51
114
102
71
39
142
78
112
80
224
160
140
139
280
278
136
435
272
870
117
60
234
120
58
198
116
396
42
52
84
104
Vietnamese
Brazilian
Sri Lankan
112
75
224
150
Requested data not forthcoming.
197
198
394
396
328
Appendix 8b SLC11A1 1730G/A frequencies (case versus controls) of all the individual association studies included in the meta-analysis.
Population
Mycobacterium leprae
Vejbaesya et al ., 2007b
Hatta et al ., 2010
Mycobacterium avium
Huang et al ., 1998
Tanaka et al ., 2007
Asai et al ., 2008
Non-TB Mycobacteria
Koh et al ., 2005
Stienstra et al ., 2006
Haverkamp et al ., 2010
Mycobacterium tuberculosis
Lui et al ., 1995
Bellamy et al ., 1998
Gao et al ., 2000
Ryu et al , 2000
Delgado et al ., 2002
Ma et al ., 2002
Liaw et al ., 2002
Salvaraj et al , 2002
Soborg et al ., 2002
Abe et al , 2003
Liu et al ., 2003
Kim et al ., 2003
Liu et al ., 2004
Zhang et al ., 2005
Freidin et al ., 2006
Freidin et al ., 2006
Hsu et al , 2006
Hsu et al , 2006
Taype et al , 2006
Leung et al ., 2007
Nino-Moreno et al ., 2007
Sahiratmadja et al ., 2007
Soborg et al ., 2007
Vejbaesya et al ., 2007a
Qu et al ., 2007
Asai et al ., 2008
Farnia et al ., 2008
Ates et al ., 2009b
Chen et al ., 2009
Merza et al ., 2009
Hatta et al ., 2010
Motsinger-Reif et al ., 2010
Other
Calzada et al ., 2001
Dunstan et al ., 2001
Ouchi et al ., 2003
Bravo et al ., 2006
Castellucci et al ., 2010
Samaranayake et al ., 2010
Thai
Indonesian
Study Numbers
Allele Frequencies
n (# people)
2n (# alleles)
Case Control
Case Control
Wildtype
Case Control
Allele Frequencies
OR (95% CI)
Mutant
% Wildtype
% Mutant
Case Control
Case Control
Case Control
37
41
140
198
74
82
280
396
61
62
238
307
13
20
42
89
82
76
85
78
18
24
15
22
1.21 (0.61-2.39)
1.11 (0.64-1.94)
American
Japanese
Japanese
8
111
17
4
424
51
16
222
34
8
848
102
16
211
29
8
756
100
0
11
5
0
92
2
100
95
85
100
89
98
0
5
14
0
11
2
Zero observation
0.43 (0.23-0.82)
8.62 (1.59-46.77)
South Korean
Ghanaian
Dutch
41
144
80
50
153
214
82
288
160
100
306
428
71
259
157
97
292
420
11
29
3
3
14
8
87
90
98
97
95
98
13
10
2
3
5
2
5.01 (1.35-18.62)
2.34 (1.21-4.52
1.00 (0.26-3.83)
Hong Kong/Canadian
Gambian
Japanese
Korean
Cambodian
American
Chinese (Han/Aboriginal)
Indian
Danish
Japanese
Chinese Han
Korean
Chinese Han
Chinese
Tuvinians
Russian
Taiwanese (aboriginals)
Taiwanese (Han)
Peruvian
Chinese
Mexican
Indonesian
Tanzanian
Thai
Chinese
Japanese
Iranian
Dutch
Tibetian
Iranian
Indonesian
American
12
405
267
192
355
135
49
157
104
95
110
37
120
127
236
278
88
83
630
278
94
205
442
149
61
57
71
112
140
117
58
40
18
417
202
192
106
108
48
112
176
90
171
45
240
91
263
139
90
86
513
282
110
350
427
147
122
51
39
80
139
60
198
52
24
810
534
384
710
270
98
314
208
190
220
74
240
254
472
556
176
166
1260
556
188
410
884
298
122
114
142
224
280
234
116
80
36
834
404
384
212
216
96
224
352
180
342
90
480
182
526
278
180
172
1026
564
220
700
854
294
244
102
78
160
278
120
396
104
20
742
471
335
571
268
79
284
191
170
203
68
229
215
421
540
145
137
1030
462
144
334
778
246
104
103
105
220
243
228
86
75
30
791
377
355
163
215
82
205
342
166
329
88
471
165
453
266
148
147
868
497
174
546
756
246
217
100
46
159
257
104
307
97
4
68
63
49
139
2
19
30
17
20
17
6
11
39
51
16
31
29
230
94
44
76
106
52
18
11
37
4
37
6
30
5
6
43
27
29
49
1
14
19
10
14
13
2
9
17
73
12
32
25
158
67
46
154
98
48
27
2
32
1
21
16
89
7
83
92
88
87
80
99
81
90
92
89
92
92
95
85
89
97
82
83
82
83
77
81
88
83
85
90
74
98
87
97
74
94
83
95
93
92
77
100
85
92
97
92
96
98
98
91
86
96
82
85
85
88
79
78
89
84
89
98
59
99
92
87
78
93
17
8
12
13
20
1
19
10
8
11
8
8
5
15
11
3
18
17
18
17
23
19
12
17
15
10
26
2
13
3
26
6
17
5
7
8
23
0
15
8
3
8
4
2
2
9
14
4
18
15
15
12
21
22
11
16
11
2
41
1
8
13
22
7
1.00 (0.25-4.00)
1.69 (1.14-2.50)
1.87 (1.17-2.99)
1.79 (1.10-2.90)
0.81 (0.56-1.17)
1.60 (0.14-17.81)
1.41 (0.66-3.00)
1.14 (0.62-2.08)
3.04 (1.37-6.78)
1.39 (0.68-2.85)
2.12 (1.01-4.46)
3.88 (0.76-19.84)
1.22 (0.63-2.40)
1.76 (0.96-3.22)
0.75 (0.51-1.10)
0.66 (0.31-1.41)
0.99 (0.57-1.70)
1.24 (0.69-2.23)
1.23 (0.98-1.53)
1.51 (1.08-2.12)
1.16 (0.72-1.85)
0.81 (0.59-1.10)
1.05 (0.76-1.41)
1.08 (0.70-1.67)
1.39 (0.73-2.64)
5.34 (1.15-24.70)
0.51 (0.28-0.91)
2.89 (0.32-26.11)
1.86 (1.06-3.27)
0.17 (0.07-0.45)
1.20 (0.75-1.94)
0.92 (0.28-3.03)
133
189
125
129
142
130
198
173
25
33
17
1
28
24
22
5
84
85
88
99
84
84
90
97
16
15
12
1
16
16
10
3
0.95 (0.53-1.72)
0.95 (0.53-1.67)
1.22 (0.63-2.40)
0.27 (0.03-2.32)
362
363
36
29
91
93
9
7
1.24 (0.75-2.07)
Peruvian
Vietnamese
Japansese
Spanish
Brazilian
Sri Lankan
79
85
158
170
111
77
222
154
71
110
142
220
65
89
130
178
Requested data not forthcoming.
199
196
398
392
329
Appendix 8c SLC11A1 1729+55del4 frequencies (case versus controls) of all the individual association studies included in the meta-analysis.
Population
Mycobacterium leprae
Roy et al ., 1999
Meisner et al ., 2001
Fitness et al ., 2004b
Vejbaesya et al ., 2007b
Hatta et al ., 2010
Mycobacterium avium
Huang et al ., 1998
Tanaka et al ., 2007
Asai et al ., 2008
Non-TB Mycobacteria
Koh et al ., 2005
Stienstra et al ., 2006
Mycobacterium tuberculosis
Lui et al ., 1995
Bellamy et al ., 1998
Ryu et al ., 2000
Delgado et al ., 2002
Liaw et al ., 2002
Ma et al ., 2002
Salvaraj et al ., 2002
Soborg et al ., 2002
Abe et al ., 2003
Duan et al ., 2003
Kim et al ., 2003
Liu et al ., 2003
Akahoshi et al ., 2004
Fitness et al ., 2004a
Hoal et al ., 2004
Liu et al ., 2004
An et al ., 2006
Taype et al ., 2006
Leung et al ., 2007
Nino-Moreno et al ., 2007
Sahiratmadja et al ., 2007
Soborg et al ., 2007
Vejbaesya et al ., 2007a
Asai et al ., 2008
Farnia et al ., 2008
Ates et al ., 2009b
Chen et al ., 2009
Merza et al ., 2009
Jin et al ., 2009
de Wit et al ., 2010
Hatta et al ., 2010
Other
Calzada et al ., 2001
Ouchi et al ., 2003
Bravo et al ., 2006
Castellucci et al ., 2010
Study Numbers
Allele Frequencies
n (# people)
2n (# alleles)
Case Control
Case Control
Wildtype
Case Control
Allele Frequencies
OR (95% CI)
Mutant
% Wildtype
% Mutant
Case Control
Case Control
Case Control
Indian
Malian
Malawian
Thai
Indonesian
222
273
258
37
41
154
201
402
140
198
444
546
516
74
82
308
402
804
280
396
422
420
356
61
62
292
307
570
238
307
22
126
160
6
20
16
95
234
13
89
95
77
69
82
76
95
76
71
85
78
5
23
31
8
24
5
24
29
5
22
0.95 (0.49-1.84)
0.97 (0.72-1.31)
1.09 (0.86-1.39)
1.81 (0.66-4.94)
1.11 (0.64-1.94)
American
Japanese
Japanese
8
111
17
4
424
51
16
222
34
8
848
102
16
211
23
8
755
77
0
11
11
0
93
25
100
95
68
100
89
75
0
5
32
0
11
25
Zero observation
0.42 (0.22-0.81)
1.47 (0.63-3.44)
South Korean
Ghanaian
41
150
50
174
82
300
100
348
60
224
97
256
22
76
3
92
73
75
97
74
27
25
3
26
11.86 (3.40-41.32)
0.94 (0.66-1.34)
20
638
335
571
80
269
282
194
170
240
68
175
30
702
355
163
78
215
194
344
166
259
88
292
4
172
49
139
18
1
32
14
20
54
8
45
6
132
29
49
18
1
30
8
14
31
2
48
83
79
87
80
82
100
90
93
89
82
89
80
83
84
92
77
81
100
87
98
92
89
98
86
17
21
13
20
18
0
10
7
11
18
11
20
17
16
8
23
19
0
13
2
8
11
2
14
1.00 (0.25-4.00)
1.43 (1.12-1.84)
1.79 (1.10-2.90)
0.81 (0.56-1.17)
0.98 (0.47-2.01)
0.80 (0.05-12.85)
0.73 (0.43-1.25)
3.10 (1.28-7.53)
1.39 (0.68-2.85)
1.88 (1.17-3.02)
5.18 (1.06-25.17)
1.56 (1.00-2.45)
315
320
192
993
422
412
121
60
48
425
56
68
72
84
80
70
88
86
28
16
20
30
12
14
0.90 (0.71-1.14)
(1.41) 0.95-2.09)
1.51 (1.01-2.28)
1031
462
104
348
648
246
76
138
220
218
227
238
871
86
876
497
119
568
646
246
77
76
159
238
117
814
570
307
229
94
42
80
236
52
38
4
4
62
7
34
113
30
150
67
47
158
216
48
25
2
1
40
3
56
54
89
82
83
71
81
73
83
67
97
98
78
97
87.5
89
74
85
88
72
78
75
84
75
97
99
86
97.5
94
91
78
18
17
29
19
27
17
33
3
2
22
3
12.5
11
26
15
12
28
22
25
16
25
3
1
14
2.5
6
9
22
1.30 (1.04-1.62)
1.51 (1.08-2.12)
1.02 (0.62-1.67)
0.83 (0.61-1.12)
1.09 (0.88-1.35)
1.81 (0.66-4.94)
1.54 (0.85-2.79)
1.10 (0.20-6.15)
2.89 (0.32-26.11)
1.69 (1.09-2.62)
1.20 (0.31-4.74)
2.08 (1.32-3.26)
1.37 (0.97-1.93)
1.20 (0.75-1.94)
133
125
129
142
198
173
25
17
1
28
22
5
84
88
99
84
90
97
16
12
1
16
10
3
0.95 (0.53-1.72)
1.22 (0.63-2.40)
0.27 (0.03-2.32)
Hong Kong/Canadian
12
18
24
36
Gambian
405
417
810
834
Korean
192
192
384
384
Cambodian
355
106
710
212
Chinese (Han/Aboriginal)
49
48
98
96
American
135
108
270
216
Indian
157
112
314
224
Danish
104
176
208
352
Japanese
95
90
190
180
Chinese Han
147
145
294
290
Korean
38
45
76
90
Chinese Han
110
170
220
340
Japanese
Requested data not forthcoming.
Malawian
218
709
436 1418
South African coloured
190
239
380
478
Chinese
120
240
240
480
Chinese Han
Requested data not forthcoming.
Peruvian
630
513
1260 1026
Chinese
278
282
556
564
Mexican
73
83
146
166
Indonesian
214
363
428
726
Tanzanian
442
431
884
862
Thai
149
147
298
294
Japanese
57
51
114
102
Iranian
71
39
142
78
Dutch
112
80
224
160
Tibetian
140
139
280
278
Iranian
117
60
234
120
Chinese Han
136
435
272
870
South African coloured
492
312
984
624
Indonesian
58
198
116
396
Peruvian
Japansese
Spanish
Brazilian
79
85
158
170
71
110
142
220
65
89
130
178
Requested data not forthcoming.
330
Appendix 9
Appendix 9 SLC11A1 polymorphisms frequencies (case versus controls) of all the individual association studies included in the meta-analysis of infectious disease.
Population
Disease
Study Numbers
Allele Frequencies
Allele Frequencies
OR (95% CI)
n (# people)
2n (# alleles)
Wildtype
Mutant
% Wildtype
% Mutant
Case Control
Case Control
Case Control
Case Control
Case Control
Case Control
-237C/T
Bellamy et al ., 1998
Calzada et al ., 2001
Hoal et al ., 2004
Bravo et al ., 2006
Hsu et al , 2006
Hsu et al , 2006
Castellucci et al ., 2010
Gambian
Peruvian
South African
Spanish
Taiwanese
Taiwanese (Han)
Brazilian
Tuberculosis
Trypanosoma
Tuberculosis
Brucellosis
Tuberculosis
Tuberculosis
Leishmainia
Requested data not forthcoming.
79
85
158
170
65
81
130
162
65
89
130
178
88
93
176
186
83
85
166
170
Requested data not forthcoming.
274C/T
Liu et al ., 1995
Dunstan et al ., 2001
Puzyrev et al , 2002
Liaw et al ., 2002
Dubaniewicz et al ., 2005
Freidin et al ., 2006
Freidin et al ., 2006
Doorduyn et al ., 2008
Doorduyn et al ., 2008
Castellucci et al ., 2010
Motsinger-Reif et al., 2010
Samaranayake et al ., 2010
Hong Kong/Canadian
Vietnamese
Slavonic
Chinese
Polish
Tuvinians
Russian
Dutch
Dutch
Brazilian
American
Sri Lankan
Tuberculosis
Typhiod Fever
Tuberculosis
Tuberculosis
Tuberculosis
Tuberculosis
Tuberculosis
Salmonella
Campylobacter
Leishmainia
Tuberculosis
Leishmania
1465-85G/A
Lui et al ., 1995
Dunstan et al ., 2001
Puzyrev et al , 2002
Dubaniewicz et al ., 2005
Freidin et al ., 2006
Freidin et al ., 2006
Castellucci et al ., 2010
Hong Kong/Canadian
Vietnamese
Slavonic
Polish
Tuvinians
Russian
Brazilian
Tuberculosis
Salmonella
Tuberculosis
Tuberculosis
Tuberculosis
Tuberculosis
Leishmainia
1729+271del4 (CAAA)n
Fitness et al ., 2004a
Fitness et al ., 2004b
Hoal et al ., 2004
Dubaniewicz et al ., 2005
Hsu et al ., 2006
Hsu et al ., 2006
Malawian
Malawian
South African
Polish
Taiwanese
Taiwanese (Han)
Tuberculosis
Leprosy
Tuberculosis
Tuberculosis
Tuberculosis
Tuberculosis
157
119
125
173
158
167
147
171
180
153
1
11
5
3
8
3
15
7
6
17
99
92
96
98
95
98
91
96
97
90
1
8
4
2
5
2
9
4
3
10
0.35 (0.04-3.44)
0.91 (0.40-2.05)
0.98 (0.30-3.15)
0.52 (0.13-2.11)
0.46 (0.19-1.09)
12
18
24
36
112
77
224
154
55
121
110
242
49
48
98
96
80
89
160
178
236
263
472
526
299
116
598
232
193
683
386 1366
454
683
908 1366
Requested data not forthcoming.
38
50
76
100
198
199
396
398
22
203
86
92
116
425
448
272
655
33
138
185
95
132
463
194
993
993
2
21
24
6
44
47
150
114
253
3
16
57
1
46
63
38
373
373
92
91
78
94
72.5
90
75
70
72
92
90
76
99
74
88
84
73
73
8
9
22
6
27.5
10
25
30
28
8
10
24
1
26
12
16
27
27
1.00 (0.15-6.48)
0.89 (0.45-1.77)
0.91 (0.53-1.56)
6.20 (0.73-52.47
1.09 (0.67-1.76)
0.81 (0.54-1.21)
1.71 (1.15-2.53)
1.12 (0.87-1.43)
1.03 (0.85-1.24)
61
344
81
342
15
52
19
56
80
87
81
86
20
13
19
14
1.05 (0.49-2.23)
0.92 (0.62-1.39)
12
18
24
36
112
77
224
154
56
127
112
254
79
93
158
186
233
263
466
526
279
135
558
270
Requested data not forthcoming.
19
163
74
111
369
378
25
114
181
127
412
193
5
61
38
47
97
180
11
40
73
59
114
77
79
73
66
70
79
68
69
74
71
68
78
71
21
27
34
30
21
32
31
26
29
32
22
29
0.60 (0.18-2.01)
1.07 (0.67-1.70)
1.27 (0.79-2.05)
0.91 (0.58-1.44)
0.95 (0.70-1.29)
1.19 (0.87-1.64)
324
329
164
103
129
126
1001
575
190
110
150
120
154
187
74
61
41
44
523
283
74
58
40
38
68
64
69
63
76
74
66
67
72
65
79
76
32
36
31
37
24
26
34
33
28
35
21
24
0.91 (0.73-1.13)
1.15 (0.92-1.45)
1.16 (0.79-1.70)
1.12 (0.72-1.76)
1.19 (0.73-1.96)
1.10 (0.67-1.82)
239
258
119
82
85
85
762
429
132
84
95
79
478
516
238
164
170
170
1524
858
264
168
190
158
331
REFERENCES
Abe, T., Iinuma, Y., Ando, M., Yokoyama, T., Yamamoto, T., Nakashima, K., Takagi,
N., Baba, H., Hasegawa, Y. & Shimokata, K. (2003) 'NRAMP1 polymorphisms,
susceptibility and clinical features of tuberculosis', The Journal of Infection,
46(4): 215-20.
Agranoff, D.D. & Krishna, S. (1998) 'Metal ion homeostasis and intracellular
parasitism', Molecular Microbiology, 28(3): 403-12.
Aidar, M. & Line, S.R. (2007) 'A simple and cost-effective protocol for DNA isolation
from buccal epithelial cells', Brazilian Dental Journal, 18(2): 148-52.
Akahoshi, M., Ishihara, M., Remus, N., Uno, K., Miyake, K., Hirota, T., Nakashima, K.,
Matsuda, A., Kanda, M., Enomoto, T., Ohno, S., Nakashima, H., Casanova, J.L.,
Hopkin, J.M., Tamari, M., Mao, X.Q. & Shirakawa, T. (2004) 'Association
between IFNA genotype and the risk of sarcoidosis', Human Genetics, 114(5):
503-9.
Akira, S., Isshiki, H., Nakajima, T., Kinoshita, S., Nishio, Y., Natsuka, S. & Kishimoto,
T. (1992) 'Regulation of expression of the interleukin 6 gene: structure and
function of the transcription factor NF-IL6', Ciba Foundation Symposium,
167(47-62): 62-7.
Alter-Koltunoff, M., Ehrlich, S., Dror, N., Azriel, A., Eilers, M., Hauser, H., Bowen, H.,
Barton, C.H., Tamura, T., Ozato, K. & Levi, B.Z. (2003) 'Nramp1-mediated
Innate Resistance to Intraphagosomal Pathogens Is Regulated by IRF-8, PU.1,
and Miz-1', The Journal of Biological Chemistry, 278(45): 44025-32.
Alter-Koltunoff, M., Goren, S., Nousbeck, J., Feng, C.G., Sher, A., Ozato, K., Azriel, A.
& Levi, B.Z. (2008) 'Innate immunity to intraphagosomal pathogens is mediated
by IRF-8 that stimulates the expression of macrophage specific NRAMP1
through antagonizing repression by C-MYC', The Journal of Biological
Chemistry, 283(5): 2724-33.
Altet, L., Francino, O., Solano-Gallego, L., Renier, C. & Sanchez, A. (2002) 'Mapping
and Sequencing of the Canine NRAMP1 Gene and Identification of Mutations in
Leishmaniasis-Susceptible Dogs', Infection and Immunity, 70(6): 2763-71.
An, Y.C., Feng, F.M., Yuan, J.X., Ji, C.M., Wang, Y.H., Guo, M., Deng, X.J., Gao,
B.X., Wang, D. & Liu, Q. (2006) 'Study on the association of INT4 and 3'UTR
polymorphism of natural-resistance-associated macrophage protein 1 gene with
susceptibility to pulmonary tuberculosis', Zhonghua Liu Xing Bing Xue Za Zhi,
27(1): 37-40.
Asadullah, K., Sterry, W. & Volk, H.D. (2003) 'Interleukin-10 Therapy-Review of a
New Approach', Pharmaceutical Reviews, 55(2): 241-69.
Asai, S., Abe, Y., Fujino, T., Masukawa, A., Arami, S., Furuya, H. & Miyachi, H.
(2008) 'Association of the SLC11A1 Gene Polymorphisms With Susceptibility
to Mycobacterium Infections in a Japanese Population', Infectious Diseases in
Clinical Practice, 16(4): 230-34.
Ateş, O., Dalyan, L., Hatemi, G., Hamuryudan, V. & Topal-Sarıkaya, A. (2009a)
'Genetic susceptibility to Behçet's syndrome is associated with NRAMP1
(SLC11A1) polymorphism in Turkish patients', Rheumatology International,
29(7): 787-91.
332
Ateş, O., Dalyan, L., Müsellim, B., Hatemi, G., Türker, H., Ongen, G., Hamuryudan, V.
& Topal-Sarıkaya, A. (2009b) 'NRAMP1 (SLC11A1) gene polymorphisms that
correlate with autoimmune versus infectious disease susceptibility in
tuberculosis and rheumatoid arthritis', International Journal of Immunogenetics,
36(1): 15-9.
Ateş, O., Kurt, S., Bozkurt, N. & Karaer, H. (2010) 'NRAMP1 (SLC11A1) Variants:
Genetic Susceptibility to Multiple Sclerosis', Journal of Clinical Immunology,
30(4): 583-6.
Ateş, O., Müsellim, B., Öngen, G. & Topal-Sarıkaya, A. (2008) 'NRAMP1 (SLC11A1):
A Plausible Candidate Gene for Systemic Sclerosis (SSc) with Interstitial Lung
Involvement', Journal of Clinical Immunology, 28(1): 73-7.
Atkinson, P.G. & Barton, C.H. (1998) 'Ectopic expression of Nramp1 in COS-1 cells
modulates iron accumulation', FEBS Letters, 425(2): 239-42.
Atkinson, P.G. & Barton, C.H. (1999) 'High level of expression of Nramp1G169 in
RAW264.7 cell transfectants: analysis of intracellular iron transport',
Immunology, 96(4): 656-62.
Atkinson, P.G., Blackwell, J.M. & Barton, C.H. (1997) 'Nramp1 locus encodes a 65kDa
interferon-γ-inducible protein in murine macrophages', The Biochemical
Journal, 325(3): 779-86.
Auwerx, J. (1991) 'The human leukemia cell line, THP-1: a multifacetted model for the
study of monocyte-macrophage differentiation', Experientia, 47(1): 22-31.
Awomoyi, A.A. (2007) 'The human solute carrier family 11 member 1 protein
(SLC11A1): linking infections, autoimmunity and cancer?' FEMS Immunology
and Medical Microbiology, 49(3): 324-9.
Awomoyi, A.A., Marchant, A., Howson, J.M., Mcadam, K.P., Blackwell, J.M. &
Newport, M.J. (2002) 'Interleukin-10, Polymorphism in SLC11A1 (formerly
NRAMP1), and Susceptibility to Tuberculosis.' Journal of Infectious Diseases,
186(12): 1808.
Awomoyi, A.A., Sirugo, G., Newport, M.J. & Tishkoff, S. (2006) 'Global distribution of
a novel trinucleotide microsatellite polymorphism (ATA)n in intron 8 of the
SLC11A1 gene and susceptibility to pulmonary tuberculosis', International
Journal of Immunogenetics, 33(1): 11-5.
Azar, S.T., Tamim, H., Beyhum, H.N., Habbal, M.Z. & Almawi, W.Y. (1999) 'Type I
(Insulin-Dependent) Diabetes Is a Th1- and Th2-Mediated Autoimmune
Disease', Clinical and Diagnostic Laboratory Immunology, 6(3): 306-10.
Bakshi, R., Benedict, R.H.B., Bermel, R.A., Caruthers, S.D., Puli, S.R., Tjoa, C.W.,
Fabiano, A.J. & Jacobs, L. (2002) 'T2 Hypointensity in the Deep Gray Matter of
Patients With Multiple Sclerosis: A Quantitative Magnetic Resonance Imaging
Study', Archives of Neurology, 59(1): 62-8.
Bakshi, R., Dmochowski, J., Shaikh, Z.A. & Jacobs, L. (2001) 'Gray matter T2
hypointensity is related to plaques and atrophy in the brains of multiple sclerosis
patients', Journal of the Neurological Sciences, 185(1): 19-26.
Barrera, L.F., Kramnik, I., Skamene, E. & Radzioch, D. (1997) 'I-A beta gene
expression regulation in macrophages derived from mice susceptible or resistant
to infection with M. bovis BCG', Molecular Immunology, 34(4): 343-55.
Barton, C.H., Biggs, T.E., Baker, S.T., Bowen, H. & Atkinson, P.G. (1999) 'Nramp1: a
link between intracellular iron transport and innate resistance to intracellular
pathogens', Journal of Leukocyte Biology, 66(5): 757-62.
333
Barton, C.H., White, J.K., Roach, T.I. & Blackwell, J.M. (1994) 'NH2-terminal
sequence of macrophage-expressed natural resistance-associated macrophage
protein (Nramp) encodes a proline/serine-rich putative Src homology 3-binding
domain', The Journal of Experimental Medicine, 179(5): 1683-7.
Barton, C.H., Whitehead, S.H. & Blackwell, J.M. (1995) 'Nramp transfection transfers
Ity/Lsh/Bcg-related pleiotropic effects on macrophage activation: influence on
oxidative burst and nitric oxide pathways', Molecular medicine, 1(3): 267-79.
Bassuny, W.M., Ihara, K., Matsuura, N., Ahmed, S., Kohno, H., Kuromaru, R., Miyako,
K. & Hara, T. (2002) 'Association study of the NRAMP1 gene promoter
polymorphism and early-onset type 1 diabetes', Immunogenetics, 54(4): 282-5.
Bates, A.D. & Maxwell, A. (2005) DNA Topology, New York, Oxford University Press.
Bayele, H.K., Peyssonnaux, C., Giatromanolaki, A., Arrais-Silva, W.W., Mohamed,
H.S., Collins, H., Giorgio, S., Koukourakis, M., Johnson, R.S., Blackwell, J.M.,
Nizet, V. & Srai, S.K.S. (2007) 'HIF-1 regulates heritable variation and allele
expression phenotypes of the macrophage immune response gene SLC11A1
from a Z-DNA-forming microsatellite', Blood, 15(8): 3039-48.
Begg, C.B. & Mazumdar, M. (1994) 'Operating characteristics of a rank correlation test
for publication bias', Biometrics, 50(4): 1088-101.
Bellamy, R., Ruwende, C., Corrah, T., Mcadam, K., Whittle, H.C. & Hill, A.V.S.
(1998) 'Variations in the Nramp1 gene and susceptibility to tuberculosis in West
Africans', The New England Journal of Medicine, 338(10): 640-4.
Berman, N.G. & Parker, R.A. (2002) 'Meta-analysis: neither quick nor easy', BMC
Medical Research Methodology, 2:10.
Berrier, A., Siu, G. & Calame, K. (1998) 'Transcription of a minimal promoter from the
NF-IL6 gene is regulated by CREB/ATF and Sp1 proteins in U937
promonocytic cells', The Journal of Immunology, 161(5): 2267-75.
Bianchi, M., Crinelli, R., Giacomini, E., Carloni, E. & Magnani, M. (2009) 'A potent
enhancer element in the 5'-UTR intron is crucial for transcriptional regulation of
the human ubiquitin C gene', Gene, 488(1): 88-101.
Biggs, T.E., Baker, S.T., Botham, M.S., Dhital, A., Barton, C.H. & Perry, V.H. (2001)
'Nramp1 modulates iron homoeostasis in vivo and in vitro: evidence for a role in
cellular iron release involving de-acidification of intracellular vesicles',
European Journal of Immunology, 31(7): 2060-70.
Blackwell, J.M. (1989) 'The macrophage resistance gene Lsh/Ity/Bcg', Research in
Immunology, 140(8): 767-9.
Blackwell, J.M. (1996) 'Structure and function of the natural-resistance-associated
macrophage protein (Nramp1), a candidate protein for infectious and
autoimmune disease susceptibility', Molecular Medicine Today, 2(5): 205-11.
Blackwell, J.M. (2001) 'Genetics and genomics in infectious disease susceptibility',
Trends in Molecular Medicine, 7(11): 521-26.
Blackwell, J.M., Barton, C.H., White, J.K., Roach, T.I., Shaw, M.A., Whitehead, S.H.,
Mock, B.A., Searle, S., Williams, H. & Baker, A.M. (1994) 'Genetic regulation
of leishmanial and mycobacterial infections: the Lsh/Ity/Bcg gene story
continues', Immunology Letters, 43(1-2): 99-107.
Blackwell, J.M., Barton, C.H., White, J.K., Searle, S., Baker, A.M., Williams, H. &
Shaw, M.A. (1995) 'Genomic organization and sequence of the human NRAMP
gene: identification and mapping of a promoter region polymorphism.'
Molecular Medicine, 1(2): 194-205.
334
Blackwell, J.M., Black, G.F., Peacock, C.S., Miller, E.N., Sibthorpe, D., Gnananandha,
D., Shaw, J.J., Silveira, F., Lins-Lainson, Z., Ramos, F., Collins, A. & Shaw,
M.A. (1997) 'Immunogenetics of leishmanial and mycobacterial infections: the
Belem Family Study', Philosophical Transactions: Biological Sciences,
352(1359): 1331-45.
Blackwell, J.M., Goswami, T., Evans, C.A.W., Sibthorpe, D., Papo, N., White, J.K.,
Searle, S., Miller, E.N., Peacock, C.S., Mohammed, H. & Ibrahim, M. (2001)
'SLC11A1 (formerly NRAMP1) and disease resistance', Cellular Microbiology,
3(12): 773-84.
Blackwell, J.M., Jamieson, S.E. & Burgner, D. (2009) 'HLA and Infectious Diseases',
Clinical Microbiology Reviews, 22(2): 370-85.
Blackwell, J.M., Searle, S., Mohamed, H. & White, J.K. (2003) 'Divalent cation
transport and susceptibility to infectious and autoimmune disease: continuation
of the Ity/Lsh/Bcg/Nramp1/Slc11a1 gene story', Immunology Letters, 85(2):
197-203.
Blackwell, J.M., Toole, S., King, M., Dawda, P., Roach, T.I. & Cooper, A. (1988)
'Analysis of Lsh gene expression in congenic B10.L-Lshr mice', Current Topics
in Microbiology and Immunology, 137:301-9.
Bowen, H., Lapham, A., Phillips, E., Yeung, I., Alter-Koltunoff, M., Levi, B.Z., Perry,
V.H., Mann, D.A. & Barton, C.H. (2003) 'Characterization of the murine
Nramp1 promoter: requirement for transactivation by Miz-1', The Journal of
Biological Chemistry, 278(38): 36017-26.
Bowlus, C.L. (2003) 'The role of iron in T cell development and autoimmunity',
Autoimmunity Reviews, 2(2): 73-8.
Bradley, D.J. (1977) 'Regulation of Leishmania populations within the host II. Genetic
control of acute susceptibility of mice to Leishmania donovani infection.'
Clinical & Experimental Immunology, 30(1): 130-40.
Bravo, M.J., Colmenero, J.D., Martin, J., Alonso, A. & Caballero Gonzalez, A. (2006)
'Variation in the NRAMP1 gene does not affect susceptibility or protection in
human brucellosis', Microbes and Infection, 8(1): 154-6.
Breslauer, K.J., Frank, R., Blocker, H. & Marky, L.A. (1986) 'Predicting DNA duplex
stability from the base sequence', Proceedings of the National Academy of
Sciences of the United States of America, 83(11): 3746-50.
Bucheton, B., Abel, L., Kheir, M.M., Mirgani, A., El-Safi, S.H., Chevillard, C. &
Dessein, A. (2003) 'Genetic control of visceral leishmaniasis in a Sudanese
population: candidate gene testing indicates a linkage to the NRAMP1 region',
Genes & Immunity, 4(2): 104-9.
Bullen, J.J. (1981) 'The Significance of Iron in Infection', Reviews of Infectious
Diseases, 3(6): 1127-38.
Burley, S.K. & Roeder, R.G. (1996) 'Biochemistry and Structural Biology of
Transcription Factor IID (TFIID)', Annual Review of Biochemistry, 65(1): 76999.
Bussmann, V., Lantier, I., Pitel, F., Patri, S., Nau, F., Gros, P., Elsen, J.M. & Lantier, F.
(1998) 'cDNA cloning, structural organization, and expression of the sheep
NRAMP1 gene', Mammalian Genome, 9(12): 1027-31.
Buu, N.T., Cellier, M., Gros, P. & Schurr, E. (1995) 'Identification of a highly
polymorphic length variant in the 3'UTR of NRAMP1', Immunogenetics, 42(5):
428-9.
335
Calzada, J.E., Nieto, A., Lopez-Nevot, M.A. & Martin, J. (2001) 'Lack of association
between NRAMP1 gene polymorphisms and Trypanosoma cruzi infection',
Tissue Antigens, 57(4): 353-57.
Canonne-Hergaux, F., Calafat, J., Richer, E., Cellier, M., Grinstein, S., Borregaard, N.
& Gros, P. (2002) 'Expression and subcellular localization of NRAMP1 in
human neutrophil granules', Blood, 100(1): 268-75.
Canonne-Hergaux, F., Fleming, M.D., Levy, J.E., Gauthier, S., Ralph, T., Picard, V.,
Andrews, N.C. & Gros, P. (2000) 'The Nramp2/DMT1 iron transporter is
induced in the duodenum of microcytic anemia mk mice but is not properly
targeted to the intestinal brush border ', Blood, 96(12): 3964-70.
Canonne-Hergaux, F., Levy, J.E., Fleming, M.D., Montross, L.K., Andrews, N.C. &
Gros, P. (2001) 'Expression of the DMT1 (NRAMP2/DCT1) iron transporter in
mice with genetic iron overload disorders', Blood, 97(4): 1138-40.
Cardon, L.R. & Palmer, L.J. (2003) 'Population stratification and spurious allelic
association', The Lancet, 361(9357): 598-604.
Carrasco-Marín, E., Alvarez-Domínguez, C., López-Mato, P., Martínez-Palencia, R. &
Leyva-Cobián, F. (1996) 'Iron Salts and Iron-Containing Porphyrins Block
Presentation of Protein Antigens by Macrophages to MHC Class II-Restricted T
Cells', Cellular Immunology, 171(2): 173-85.
Castellucci, L., Jamieson, S., Miller, E., Menezes, E., Oliveira, J., Magalhaes, A.,
Guimaraes, L., Lessa, M., Ribeiro De Jesus, A., Carvalho, E. & Blackwell, J.M.
(2010) 'CXCR1 and SLC11A1 polymorphisms affect susceptibility to cutaneous
leishmaniasis in Brazil: a case-control and family-based study', BMC Medical
Genetics, 11(1): 10.
Cellier, M., Govoni, G., Vidal, S., Kwan, T., Groulx, N., Liu, J., Sanchez, F., Skamene,
E., Schurr, E. & Gros, P. (1994) 'Human natural resistance-associated
macrophage protein: cDNA cloning, chromosomal mapping, genomic
organization, and tissue-specific expression', The Journal of Experimental
Medicine, 180(5): 1741-52.
Cellier, M., Shustik, C., Dalton, W., Rich, E., Hu, J., Malo, D., Schurr, E. & Gros, P.
(1997) 'Expression of the human NRAMP1 gene in professional primary
phagocytes: studies in blood cells and in HL-60 promyelocytic leukemia',
Journal of Leukocyte Biology, 61(1): 96-105.
Cervino, A.C.L., Lakiss, S., Sow, O. & Hill, A.V.S. (2000) 'Allelic association between
the NRAMP1 gene and susceptibility to tuberculosis in Guinea-Conakry',
Annals of Human Genetics, 64(6): 507-12.
Chen, X.R., Feng, Y.L., Ma, Y., Zhang, Z.D., Li, C.Y., Wen, F.Q., Tang, X.Y. & Su,
Z.G. (2009) 'A study on the haplotype of the solute carrier family 11 member 1
gene in Tibetan patients with pulmonary tuberculosis in China', Zhonghua Jie
He He Hu Xi Za Zhi, 32(5): 360-4.
Chermesh, I., Azriel, A., Alter-Koltunoff, M., Eliakim, R., Karban, A. & Levi, B.Z.
(2007) 'Crohn's disease and SLC11A1 promoter polymorphism', Digestive
Disease and Sciences, 52(7): 1632-5.
Chevneval, D., Christy, R.J., Geiman, D., Cornelius, P. & Lane, M.D. (1991) 'Cell-free
transciption directed by the 422 adipose P2 gene promoter: activation by the
CCAAT/enhancer binding protein', Proceedings of the National Academy of
Sciences, 88(19): 8465-9.
Comabella, M., Altet, L., Peris, F., Villoslada, P., Sánchez, A. & Montalban, X. (2004)
'Genetic analysis of SLC11A1 polymorphisms in multiple sclerosis patients',
Multiple Sclerosis, 10(6): 618-20.
336
Couper, K.N., Blount, D.G. & Riley, E.M. (2008) 'IL-10: The Master Regulator of
Immunity to Infection', The Journal of Immunology, 180(9): 5771-7.
Crawford, N.P., Eichenberger, M.R., Colliver, D.W., Lewis, R.K., Cobbs, G.A., Petras,
R.E. & Galandiuk, S. (2005) 'Evaluation of SLC11A1 as an inflammatory bowel
disease candidate gene', BMC Medical Genetics, 6:10.
Curie, C., Alonso, J.M., Le Jean, M., Ecker, J.R. & Briat, J.F. (2000) 'Involvement of
NRAMP1 from Arabidopsis thaliana in iron transport', Biochemistry Journal,
347(3): 749-55.
Darnell, J.E., Kerr, I.M. & Stark, G.R. (1994) 'Jak-STAT pathways and transcriptional
activation in response to IFNs and other extracellular signalling proteins',
Science, 264(5164): 1415-21.
Davies, J.L., Kawaguchi, Y., Bennett, S.T., Copeman, J.B., Cordell, H.J., Pritchard,
L.E., Reed, P.W., Gough, S.C.L., Jenkins, S.C., Palmer, S.M., Balfour, K.M.,
Rowe, B.R., Farrall, M., Barnett, A.H., Bain, S.C. & Todd, J.A. (1994) 'A
genome-wide search for human type 1 diabetes susceptibility genes', Nature,
371(6493): 130-6.
de Chastellier, C., Fréhel, C., Offredo, C. & Skamene, E. (1993) 'Implication of
phagosome-lysosome fusion in restriction of Mycobacterium avium growth in
bone marrow macrophages from genetically resistant mice', Infection and
Immunity, 61(9): 3775-84.
de Waal Malefyt, R., Haanen, J., Spits, H., Roncarolo, M.G., Te Velde, A., Figdor, C.,
Johnson, K., Kastelein, R., Yssel, H. & De Vries, J.E. (1991) 'Interleukin 10 (IL10) and viral IL-10 strongly reduce antigen-specific human T cell proliferation
by diminishing the antigen-presenting capacity of monocytes via downregulation
of class II major histocompatibiltiy complex expression', The Journal of
Experimental Medicine, 174(4): 915-24.
de Wit, E., van der Merwe, L., van Helden, P. & Hoal, E. (2010) 'Gene-gene interaction
between tuberculosis candidate genes in a South African population',
Mammalian Genome, 22(1-2): 100-10.
Decobert, M., Larue, H., Bergeron, A., Harel, F., Pfister, C., Rousseau, F., Lacombe, L.
& Fradet, Y. (2006) 'Polymorphisms of the human NRAMP1 gene are
associated with response to bacillus Calmette-Guerin immunotherapy for
superficial bladder cancer', The Journal of Urology, 175(4): 1506-11.
Deeks, J.J., Macaskill, P. & Irwig, L. (2005) 'The performance of tests of publication
bias and other sample size effects in systematic reviews of diagnostic test
accuracy was assessed', Journal of Clinical Epidemiology, 58(9): 882-93.
Delgado, J.C., Baena, A., Thim, S. & Goldfeld, A.E. (2002) 'Ethnic-specific genetic
associations with pulmonary tuberculosis', The Journal of Infectious Diseases,
186(10): 1463-8.
Denis, M., Forget, A., Pelletier, M. & Skamene, E. (1988) 'Pleiotropic effects of the Bcg
gene: III. Respiratory burst in Bcg-congenic macrophages', Clinical and
Experimental Immunology, 73(3): 370-5.
Direskeneli, H. (2006) 'Autoimmunity vs autoinflammation in Behcet's disease: do we
oversimplify a complex disorder?' Rheumatology, 45(12): 1461-5.
Dong, C. & Flavell, R.A. (2000) 'Cell fate decision: T-helper 1 and 2 subsets in immune
responses', Arthritis Research, 2(3): 179-88.
Donninger, H., Cashmore, T.J., Scriba, T., Petersen, D.C., Janse van Rensburg, E. &
Hayes, V.M. (2004) 'Functional analysis of novel SLC11A1 (NRAMP1)
promoter variants in susceptibility to HIV-1', Journal of Medical Genetics,
41(4): e49.
337
Donovan, A., Brownlie, A., Dorschner, M.O., Zhou, Y., Pratt, S.J., Paw, B.H., Phillips,
R.B., Thisse, C., Thisse, B. & Zon, L.I. (2002) 'The zebrafish mutant gene
chardonnay (cdy) encodes divalent metal transporter 1 (DMT1)', Blood, 100(13):
4655-9.
Doorduyn, Y., van Pelt, W., Siezen, C.L., van der Horst, F., van Duynhoven, Y.T.,
Hoebee, B. & Janssen, R. (2008) 'Novel insight in the association between
salmonellosis or campylobacteriosis and chronic illness, and the role of host
genetics in susceptibility to these diseases', Epidemiology and Infection 136(9):
1225-34.
Druszczyńska, M., Strapagiel, D., Kwiatkowska, S., Kowalewicz-Kulbat, M., Rózalska,
B., Chmiela, M. & Rudnicka, W. (2006) 'Tuberculosis bacilli still posing a
threat. Polymorphism of genes regulating anti-mycobacterial properties of
macrophages', Polish Journal of Microbiology, 55(1): 7-12.
Duan, H.F., Zhou, X.H., Ma, Y., Li, C.Y., Chen, X.Y., Gao, W.W. & Zheng, S.H.
(2003) 'A study on the association of 3'UTR polymorphisms of NRAMP1 gene
with susceptibility to tuberculosis in Hans', Zhonghua Jie He He Hu Xi Za Zhi,
26(5): 286-9.
Dubaniewicz, A., Jamieson, S.E., Dubaniewicz-Wybieralska, M., Fakiola, M., Nancy
Miller, E. & Blackwell, J.M. (2005) 'Association between SLC11A1 (formerly
NRAMP1) and the risk of sarcoidosis in Poland', European Journal of Human
Genetics, 13(7): 829-34.
Dunstan, S.J., Ho, V.A., Duc, C.M., Lanh, M.N., Phuong, C.X., Luxemburger, C.,
Wain, J., Dudbridge, F., Peacock, C.S., House, D., Parry, C., Hien, T.T.,
Dougan, G., Farrar, J. & Blackwell, J.M. (2001) 'Typhoid Fever and Genetic
Polymorphisms at the Natural Resistance Associated Macrophage Protein 1',
The Journal of Infectious Diseases, 183(7): 1156-60.
Duval, S. & Tweedie, R. (2000a) 'A non-parametric ‘trim and fill’ method of assessing
publication bias in meta-analysis', Journal of the American Statistical
Association, 95(499): 89-98.
Duval, S. & Tweedie, R. (2000b) 'Trim and fill: A simple funnel-plot-based method of
testing and adjusting for publication bias in meta-analysis', Biometrics, 56(2):
455-63.
Egger, M., Smith, G.D., Schneider, M. & Minder, C. (1997) 'Bias in meta-analysis
detected by a simple, graphical test', British Medical Journal, 315(7109): 62934.
El Baghdadi, J., Remus, N., Benslimane, A., El Annaz, H., Chentoufi, M., Abel, L. &
Schurr, E. (2003) 'Variants of the human NRAMP1 gene and susceptibility to
tuberculosis in Morocco', The International Journal of Tuberculosis and Lung
Disease, 7(6): 599-602.
Emami, K.H., Jain, A. & Smale, S.T. (1997) 'Mechanism of synergy between TATA
and initiator: synergistic binding of TFIID following a putative TFIIA-induced
isomerization', Genes & Development, 11(22): 3007-19.
Esposito, L., Hill, N.J., Pritchard, L.E., Cucca, F., Muxworthy, C., Merriman, M.E.,
Wilson, A., Julier, C., Delepine, M., Tuomilehto, J., Tuomilehto-Wolf, E.,
Ionesco-Tirgoviste, C., Nistico', L., Buzzetti, R., Pozzilli, P., Ferrari, M., Bosi,
E., Pociot, F., Nerup, J., Bain, S.C. & Todd, J.A. (1998) 'Genetic analysis of
chromosome 2 in type 1 diabetes: analysis of putative loci IDDM7, IDDM12,
and IDDM13 and candidate genes NRAMP1 and IA-2 and the interleukin-1
gene cluster', Diabetes, 47(11): 1797-9.
338
Evans, C.A.W., Harbuz, M.S., Ostenfeld, T., Norrish, A. & Blackwell, J.M. (2001)
'Nramp1 is expressed in neurons and is associated with behavioural and immune
responses to stress', Neurogenetics, 3(2): 69-78.
Farnia, P., Pajand, O., Anoosheh, S., Tabarsi, P., Dizaji, M.K., Mohammadi, F.,
Varahram, M., Baghaei, P., Bahadori, M., Masjedi, M.R. & Velayati, A.A.
(2008) 'Comparison of Nramp1 gene polymorphism among TB Health Care
workers and recently infected cases; Assessment of Host susceptibility ',
Tanaffos, 7(1): 19-24.
Feng, J., Li, Y., Hashad, M., Schurr, E., Gros, P., Adams, L.G. & Templeton, J.W.
(1996) 'Bovine natural resistance associated macrophage protein 1 (Nramp1)
gene', Genome Research, 6(10): 956-64.
Ferreira, F.R., Goulart, L.R., Silva, H.D. & Goulart, I.M. (2004) 'Susceptibility to
leprosy may be conditioned by an interaction between the NRAMP1 promoter
polymorphisms and the lepromin response', International Journal of Leprosy,
72(4): 457-67.
Fitness, J., Floyd, S., Warndorff, D.K., Sichali, L., Malema, S., Crampin, A.C., Fine,
P.E. & Hill, A.V. (2004a) 'Large-scale candidate gene study of tuberculosis
susceptibility in the Karonga district of northern Malawi', The American Journal
of Tropical Medicine and Hygiene, 71(3): 341-9.
Fitness, J., Floyd, S., Warndorff, D.K., Sichali, L., Mwaungulu, L., Crampin, A.C.,
Fine, P.E.M. & Hill, A.V.S. (2004b) 'Large-scale candidate gene study of
leprosy susceptibility in the Karonga district of northern Malawi', The American
Journal of Tropical Medicine and Hygiene, 71(3): 330-40.
Forbes, J.R. & Gros, P. (2001) 'Divalent-metal transport by NRAMP proteins at the
interface of host-pathogen interactions', Trends in Microbiology, 9(8): 397-403.
Forbes, J.R. & Gros, P. (2003) 'Iron, manganese, and cobalt transport by Nramp1
(Slc11a1) and Nramp2 (Slc11a2) expressed at the plasma membrane', Blood,
102(5): 1884-92.
Formica, S., Roach, T.I. & Blackwell, J.M. (1994) 'Interaction with extracellular matrix
proteins influences Lsh/Ity/Bcg (candidate Nramp) gene regulation of
macrophage priming/activation for tumour necrosis factor-alpha and nitrite
release', Immunology, 82(1): 42-50.
Frehel, C., Canonne-Hergaux, F., Gros, P. & de Chastellier, C. (2002) 'Effect of
Nramp1 on bacterial replication and on maturation of Mycobacterium aviumcontaining phagosomes in bone marrow-derived mouse macrophages', Cellular
Microbiology, 4(8): 541-56.
Freidin, M., Rudko, A., Kolokolova, O., Ondar, E., Strelis, A. & Puzyrev, V. (2006)
'Comparative analysis of the tuberculosis susceptibility genetic make-up in
Tuvinians and Russians', Molecular Biology, 40(2): 218-27.
Friedman, A.D. (2007) 'Transcriptional control of granulocyte and monocyte
development', Oncogene, 26(47): 6816-28.
Friedrich, J., Adhikari, N. & Beyene, J. (2007) 'Inclusion of zero total event trials in
meta-analyses maintains analytic consistency and incorporates all available
data', BMC Medical Research Methodology, 7:5.
Fritsche, G., Nairz, M., Werner, E.R., Barton, H.C. & Weiss, G. (2008) 'Nramp1functionality increases iNOS expression via repression of IL-10 formation',
European Journal of Immunology, 38(11): 3060-7.
Fritz, P., Saal, J.G., Wicherek, C., König, A., Laschner, W. & Rautenstrauch, H. (1996)
'Quantitative photometrical assessment of iron deposits in synovial membranes
in different joint diseases', Rheumatology International, 15(5): 211-6.
339
Fu, J., Ikegami, H., Kawaguchi, Y., Fujisawa, T., Kawabata, Y., Hamada, Y., Ueda, H.,
Shintani, M., Nojima, K., Babaya, N., Shen, Q.J., Uchigata, Y., Urakami, T.,
Omori, Y., Shima, K. & Ogihara, T. (1998) 'Association of distal chromosome
2q with IDDM in Japanese subjects', Diabetologia, 41(2): 228-32.
Gabriel, H.E., Crott, J.W., Ghandour, H., Dallal, G.E., Choi, S.W., Keyes, M.K., Jang,
H., Liu, Z., Nadeau, M., Johnston, A., Mager, D. & Mason, J.B. (2006) 'Chronic
cigarette smoking is associated with diminished folate status, altered folate form
distribution, and increased genetic damage in the buccal mucosa of healthy
adults', The American Journal of Clinical Nutrition, 83(4): 835-41.
Gao, P.S., Fujishima, S., Mao, X.Q., Remus, N., Kanda, M., Enomoto, T., Dake, Y.,
Bottini, N., Tabuchi, M., Hasegawa, N., Yamaguchi, K., Tiemessen, C., Hopkin,
J.M., Shirakawa, T. & Kishi, F. (2000) 'Genetic variants of NRAMP1 and active
tuberculosis in Japanese populations', Clinical Genetics, 58(1): 74-6.
Garrick, L.M., Dolan, K.G., Romano, M.A. & Garrick, M.D. (1999) 'Non-transferrinbound iron uptake in Belgrade and normal rat erythroid cells', Journal of
Cellular Physiology, 178(3): 349-58.
Gazouli, M., Atsaves, V., Mantzaris, G., Economou, M., Nasioulas, G., Evangelou, K.,
Archimandritis, A.J. & Anagnou, N.P. (2008a) 'Role of functional
polymorphisms of NRAMP1 gene for the development of Crohn's disease',
Inflammatory Bowel Diseases, 14(10): 1323-30.
Gazouli, M., Koundourakis, A., Ikonomopoulos, J., Gialafos, E.J., Papaconstantinou, I.,
Nasioulas, G., Lukas, J.C. & Gorgoulis, V.G. (2007) 'The functional
polymorphisms of NRAMP1 gene in Greeks with sarcoidosis', Sarcoidosis,
Vasculitis, and Diffuse Lung Diseases 24(2): 153-4.
Gazouli, M., Sechi, L., Paccagnini, D., Sotgiu, S., Arru, G., Nasioulas, G. &
Vassilopoulos, D. (2008b) 'NRAMP1 polymorphism and viral factors in
Sardinian multiple sclerosis patients', The Canadian Journal of Neurological
Sciences, 35(4): 491-4.
Gazzinelli, R.T., Oswald, I.P., James, S.L. & Sher, A. (1992) 'IL-10 inhibits parasite
killing and nitrogen oxide production by IFN-gamma-activated macrophages',
Journal of Immunology, 148(6): 17292-96.
Gomes, M.S. & Appelberg, R. (1998) 'Evidence for a link between iron metabolism and
Nramp1 gene function in innate resistance against Mycobacterium avium',
Immunology, 95(2): 165-168.
Gordon, S. (2003) 'Alternative activation of macrophages', Nature Reviews
Immunology, 3(1): 23-35.
Goswami, T., Bhattacharjee, A., Babal, P., Searle, S., Moore, E., Li, M. & Blackwell,
J.M. (2001) 'Natural-resistance-associated macrophage protein 1 is an
H+/bivalent cation antiporter', Biochemical Journal, 354(3): 511–19.
Govoni, G., Canonne-Hergaux, F.O., Pfeifer, C.G., Marcus, S.L., Mills, S.D., Hackam,
D.J., Grinstein, S., Malo, D., Finlay, B.B. & Gros, P. (1999) 'Functional
Expression of Nramp1 In Vitro in the Murine Macrophage Line RAW264.7',
Infection and Immunity, 67(5): 2225-32.
Govoni, G., Vidal, S., Cellier, M., Lepage, P., Malo, D. & Gros, P. (1995) 'Genomic
Structure, Promoter Sequence, and Induction of Expression of the Mouse
Nramp1 Gene in Macrophages', Genomics, 27(1): 9-19.
Govoni, G., Vidal, S., Gauthier, S., Skamene, E., Malo, D. & Gros, P. (1996) 'The
Bcg/Ity/Lsh locus: genetic transfer of resistance to infections in C57BL/6J mice
transgenic for the Nramp1 Gly169 allele', Infection and Immunity, 64(8): 29239.
340
Graham, A.M., Dollinger, M.M., Howie, S.E.M. & Harrison, D.J. (2000) 'Identification
of novel alleles at a polymorphic microsatellite repeat region in the human
NRAMP1 gene promoter: analysis of allele frequencies in primary biliary
cirrhosis', Journal of Medical Genetics, 37(2): 150-52.
Graham, F.L., Smiley, J., Russell, W.C. & Nairn, R. (1977) 'Characteristics of a Human
Cell Line Transformed by DNA from Human Adenovirus Type 5', Journal of
General Virology, 36(1): 59-72.
Graham, R., Liew, M., Meadows, C., Lyon, E. & Wittwer, C.T. (2005) 'Distinguishing
different DNA heterozygotes by high-resolution melting', Clinical Chemistry,
51(7): 1295-8.
Greenwood, C.M., Fujiwara, T.M., Boothroyd, L.J., Miller, M.A., Frappier, D.,
Fanning, E.A., Schurr, E. & Morgan, K. (2000) 'Linkage of tuberculosis to
chromosome 2q35 loci, including NRAMP1, in a large aboriginal Canadian
family.' American Journal of Human Genetics, 67(2): 405-16.
Gruenheid, S., Canonne-Hergaux, F., Gauthier, S., Hackam, D.J., Grinstein, S. & Gros,
P. (1999) 'The Iron Transport Protein NRAMP2 Is an Integral Membrane
Glycoprotein That Colocalizes with Transferrin in Recycling Endosomes', The
Journal of Experimental Medicine, 189(5): 831-41.
Gruenheid, S., Cellier, M., Vidal, S. & Gros, P. (1995) 'Identification and
characterization of a second mouse Nramp gene', Genomics, 25(2): 514-25.
Gruenheid, S. & Gros, P. (2000) 'Genetic susceptibility to intracellular infections:
Nramp1, macrophage function and divalent cations transport', Current Opinion
in Microbiology, 3(1): 43-8.
Gruenheid, S., Pinner, E., Desjardins, M. & Gros, P. (1997) 'Natural Resistance to
Infection with Intracellular Pathogens: The Nramp1 Protein Is Recruited to the
Membrane of the Phagosome', The Journal of Experimental Medicine, 185(4):
717-30.
Gundry, C.N., Vandersteen, J.G., Reed, G.H., Pryor, R.J., Chen, J. & Wittwer, C.T.
(2003) 'Amplicon melting analysis with labeled primers: a closed-tube method
for differentiating homozygotes and heterozygotes', Clinical Chemistry, 49(3):
396-406.
Ha, S.C., Lowenhaupt, K., Rich, A., Kim, Y.G. & Kim, K.K. (2005) 'Crystal structure
of a junction between B-DNA and Z-DNA reveals two extruded bases', Nature,
437(706): 1183-6.
Hackam, D.J., Rotstein, O.D., Zhang, W.J., Gruenheid, S., Gros, P. & Grinstein, S.
(1998) 'Host Resistance to Intracellular Infection: Mutation of Natural
Resistance-associated Macrophage Protein 1 (Nramp1) Impairs Phagosomal
Acidification', The Journal of Experimental Medicine, 188(2): 351-64.
Hanly, M.G. (2001) Methods in Leukocyte Cytochemistry. Hematologic Malignancies:
Methods and Techniques. New Jersey, Humana Press.
Harty, L.C., Garcia-Closas, M., Rothman, N., Reid, Y.A., Tucker, M.A. & Hartge, P.
(2000) 'Collection of buccal cell DNA using treated cards', Cancer
Epidemiology, Biomarkers & Prevention 9(5): 501-6.
Hatta, M., Ratnawati, Tanaka, M., Ito, J., Shirakawa, T. & Kawabata, M. (2010)
'NRAMP1/SLC11A1 gene polymorphisms and host susceptibility to
Mycobacterium tuberculosis and M. leprae in South Sulawesi, Indonesia', The
Southeast Asian Journal of Tropical Medicine and Public Health, 41(2): 386-94.
341
Haverkamp, M.H., Lindeboom, J.A., de Visser, A.W., Kremer, D., Kuijpers, T.W., van
de Vosse, E. & van Dissel, J.T. (2010) 'Nontuberculous mycobacterial
cervicofacial lymphadenitis in children from the multicenter, randomized,
controlled trial in The Netherlands: Relevance of polymorphisms in candidate
host immunity genes', International Journal of Pediatric Otorhinolaryngology,
74(7): 752-4.
Heath, E.M., O'Brien, D.P., Banas, R., Naylor, E.W. & Dobrowolski, S. (1999)
'Optimization of an automated DNA purification protocol for neonatal
screening', Archives of Pathology & Laboratory Medicine, 123(12): 1154-60.
Herbert, A. & Rich, A. (1999) 'Left-handed Z-DNA: structure and function', Genetica,
106(1-2): 37-47.
Herrmann, M.G., Durtschi, J.D., Bromley, L.K., Wittwer, C.T. & Voelkerding, K.V.
(2006) 'Amplicon DNA melting analysis for mutation scanning and genotyping:
cross-platform comparison of instruments and dyes', Clinical Chemistry, 52(3):
494-503.
Hill, N.J., Lyons, P.A., Armitage, N., Todd, J.A., Wicker, L.S. & Peterson, L.B. (2000)
'NOD Idd5 locus controls insulitis and diabetes and overlaps the orthologous
CTLA4/IDDM12 and NRAMP1 loci in humans', Diabetes, 49(10): 1744-7.
Ho, P.S. (1994) 'The non-B-DNA structure of d(CA/TG)n does not differ from that of
Z-DNA', Proceedings of the National Academy of Sciences of the United States
of America, 91(20): 9549-53.
Ho, P.S., Ellison, M.J., Quigley, G.J. & Rich, A. (1986) 'A computer aided
thermodynamic approach for predicting the formation of Z-DNA in naturally
occurring sequences', The EMBO Journal, 5(10): 2737-44.
Hoal, E.G., Lewis, L.A., Jamieson, S.E., Tanzer, F., Rossouw, M., Victor, T.,
Hillerman, R., Beyers, N., Blackwell, J.M. & Van Helden, P.D. (2004)
'SLC11A1 (NRAMP1) but not SLC11A2 (NRAMP2) polymorphisms are
associated with susceptibility to tuberculosis in a high-incidence community in
South Africa', The International Journal of Tuberculosis and Lung Disease
8(12): 1464-71.
Hsu, Y.H., Chen, C.W., Sun, H.S., Jou, R., Lee, J.J. & Su, I.J. (2006) 'Association of
NRAMP 1 gene polymorphism with susceptibility to tuberculosis in Taiwanese
aboriginals', Journal of the Formosan Medical Association, 105(5): 363-9.
Hu, J., Bumstead, N., Skamene, E., Gros, P. & Malo, D. (1996) 'Structural organization,
sequence, and expression of the chicken NRAMP1 gene encoding the natural
resistance-associated macrophage protein 1', DNA and Cell Biology, 15(2): 11323.
Huang, J.H., Oefner, P.J., Adi, V., Ratnam, K., Ruoss, S.J., Trako, E. & Kao, P.N.
(1998) 'Analyses of the NRAMP1 and IFN-gammaR1 genes in women with
Mycobacterium avium-intracellulare pulmonary disease', American Journal of
Respiratory and Critical Care Medicine, 157(2): 377-81.
Huber, R., Schlessinger, D. & Pilia, G. (1998) 'Multiple Sp1 sites efficiently drive
transcription of the TATA-less promoter of the human glypican 3 (GPC3) gene',
Gene, 214(1-2): 35-44.
Ince, T.A. & Scotto, K.W. (1995) 'A conserved downstream element defines a new class
of RNA polymerase II promoters', The Journal of Biological Chemistry,
270(51): 30249-52.
342
Jabado, N., Jankowski, A., Dougaparsad, S., Picard, V., Grinstein, S. & Gros, P. (2000)
'Natural resistance to intracellular infections: natural resistance-associated
macrophage protein 1 (NRAMP1) functions as a pH-dependent manganese
transporter at the phagosomal membrane', The Journal of Experimental
Medicine, 192(9): 1237-48.
Javahery, R., Khachi, A., Lo, K., Zenzie-Gregory, B. & Smale, S.T. (1994) 'DNA
sequence requirements for transcriptional initiator activity in mammalian cells',
Molecular Cell Biology, 14(1): 116-27.
Jiang, H.R., Gilchrist, D.S., Popoff, J.-F., Jamieson, S.E., Truscott, M., White, J.K. &
Blackwell, J.M. (2009) 'Influence of Slc11a1 (formerly Nramp1) on DSSinduced colitis in mice', Journal of Leukocyte Biology, 85(4): 703-10.
Jiang, J.G. & Zarnegar, R. (1997) 'A novel transcriptional regulatory region within the
core promoter of the hepatocyte growth factor gene is responsible for its
inducibility by cytokines via the C/EBP family of transcription factors',
Molecular and Cell Biology, 17(10): 5758-70.
Jin, J., Sun, L., Jiao, W., Zhao, S., Li, H., Guan, X., Jiao, A., Jiang, Z. & Shen, A.
(2009) 'SLC11A1 (Formerly NRAMP1) gene polymorphisms associated with
pediatric tuberculosis in China', Clinical Infectious Diseases, 48(6): 733-8.
Johanson, H.C., Hyland, V., Wicking, C. & Sturm, R.A. (2009) 'DNA elution from
buccal cells stored on Whatman FTA Classic Cards using a modified methanol
fixation method', Biotechniques, 46(4): 309-11.
John, S., Marlow, A., Hajeer, A., Ollier, W., Silman, A. & Worthington, J. (1997)
'Linkage and association studies of the natural resistance associated macrophage
protein 1 (NRAMP1) locus in rheumatoid arthritis', The Journal of
Rheumatology, 24(3): 452-7.
Jüni, P., Holenstein, F., Sterne, J., Bartlett, C. & Egger, M. (2002) 'Direction and impact
of language bias in meta-analyses of controlled trials: empirical study',
International Journal of Epidemiology, 31(1): 115-23.
Juven-Gershon, T., Hsu, J.Y., Theisen, J.W.M. & Kadonaga, J.T. (2008) 'The RNA
polymerase II core promoter -- the gateway to transcription', Current Opinion in
Cell Biology, 20(3): 253-9.
Kaczynski, J., Cook, T. & Urrutia, R. (2003) 'Sp1- and Kruppel-like transcription
factors', Genome Biology, 4(2): 206.
Karupiah, G., Hunt, N.H., King, N.J. & Chaudhri, G. (2000) 'NADPH oxidase, Nramp1
and nitric oxide synthase 2 in the host antimicrobial response', Reviews in
Immunogenetics, 2(3): 387-415.
Kashi, Y. & Soller, M. (1999) Functional roles of microsatellites and minisatellites. IN
Goldstein, D.B. & Schlötterer, C. (Eds.) Microsatellites: evolution and
applications. New York, Oxford University Press.
Kaye, P.M. & Blackwell, J.M. (1989) 'Lsh, antigen presentation and the development of
CMI', Research in Immunology, 140(8): 810-22.
Kaye, P.M., Patel, N.K. & Blackwell, J.M. (1988) 'Acquisition of cell-mediated
immunity to Leishmania. II. LSH gene regulation of accessory cell function',
Immunology, 65(1): 17-22.
Khanna-Gupta, A., Zibello, T., Simkevich, C., Rosmarin, A.G. & Berliner, M. (2000)
'Sp1 and C/EBP are necessary to activate the lactoferrin gene promoter during
myeloid differentiation', Blood, 95(12): 3734-41.
343
Kim, E., Kim, K., Park, S., Kim, J., Lee, W., Cha, S., Kim, C., Kang, Y., Han, S., Jung,
T. & Park, J. (2008) 'SLC11A1 Polymorphisms Are Associated with the Risk of
Chronic Obstructive Pulmonary Disease in a Korean Population', Biochemical
Genetics, 46(7): 506-19.
Kim, J.H., Lee, S.Y., Lee, S.H., Sin, C., Shim, J.J., In, K.H., Yoo, S.H. & Kang, K.H.
(2003) 'NRAMP1 genetic polymorphisms as a risk factor of tuberculous
pleurisy', The International Journal of Tuberculosis and Lung Disease, 7(4):
370-375.
Kim, S.K., Jang, W.C., Park, S.B., Park, D.Y., Bang, K.T., Lee, S.S., Jun, J.B., Yoo,
D.H. & Chang, H.K. (2006) 'SLC11A1 gene polymorphisms in Korean patients
with Behcet's disease', Scandinavian Journal of Rheumatology, 35(5): 398-401.
Kishi, F. (1994) 'Isolation and Characterization of Human NRAMP cDNA',
Biochemical and Biophysical Research Communications, 204(3): 1074-80.
Kishi, F. & Nobumoto, M. (1995) 'Identification of natural resistance-associated
macrophage protein in peripheral blood lymphocytes', Immunology Letters,
47(1): 93-6.
Kishi, F., Tanizawa, Y. & Nobumoto, M. (1996) 'Structural analysis of human natural
resistance-associated macrophage protein 1 promoter', Molecular Immunology,
33(3): 265-8.
Kissler, S., Stern, P., Takahashi, K., Hunter, K., Peterson, L.B. & Wicker, L.S. (2006)
'In vivo RNA interference demonstrates a role for Nramp1 in modifying
susceptibility to type 1 diabetes', Nature Genetics, 38(4): 479-83.
Knapp, T., Hare, E., Feng, L., Zlokarnik, G. & Negulescu, P. (2003) 'Detection of betalactamase reporter gene expression by flow cytometry', Cytometry, 51A(2): 6878.
Knutson, M. & Wessling-Resnick, M. (2003) 'Iron Metabolism in the
Reticuloendothelial System', Critical Reviews in Biochemistry and Molecular
Biology, 38(1): 61-88.
Knutson, M.D., Vafa, M.R., Haile, D.J. & Wessling-Resnick, M. (2003) 'Iron loading
and erythrophagocytosis increase ferroportin 1 (FPN1) expression in J774
macrophages', Blood, 102(12): 4191-7.
Koay, E.S.C. & Walmsley, N. (1996) A Primer of Chemical Pathology, Singapore,
World Scientific Publishing.
Koh, W.J., Kwon, O.J., Kim, E.J., Lee, K.S., Ki, C.S. & Kim, J.W. (2005) 'NRAMP1
gene polymorphism and susceptibility to nontuberculous mycobacterial lung
diseases', Chest, 128(1): 94-101.
Kojima, Y., Kinouchi, Y., Takahashi, S., Negoro, K., Hiwatashi, N. & Shimosegawa, T.
(2001) 'Inflammatory bowel disease is associated with a novel promoter
polymorphism of natural resistance-associated macrophage protein 1
(NRAMP1) gene', Tissue Antigens, 58(6): 379-84.
Kotlowski, R., Bernstein, C.N., Silverberg, M.S. & Krause, D.O. (2008) 'Populationbased case-control study of alpha 1-antitrypsin and SLC11A1 in Crohn's disease
and ulcerative colitis', Inflammatory Bowel Diseases, 14(8): 1112-7.
Kotze, M.J., De Villiers, J.N.P., Rooney, R.N., Grobbelaar, J.J., Mansvelt, E.P.G.,
Bouwens, C.S.H., Carr, J., Stander, I. & du Plessis, L. (2001) 'Analysis of the
NRAMP1 Gene Implicated in Iron Transport: Association with Multiple
Sclerosis and Age Effects', Blood Cells, Molecules, and Diseases 27(1): 44-53.
344
Lagier, A.J., Yoo, S.H., Alfonso, E.C., Meiners, S. & Fini, M.E. (2007) 'Inhibition of
human corneal epithelial production of fibrotic mediator TGF-beta2 by
basement membrane-like extracellular matrix', Investigative Ophthalmology and
Visual Science, 48(3): 1061-71.
Lang, T., Prina, E., Sibthorpe, D. & Blackwell, J.M. (1997) 'Nramp1 transfection
transfers Ity/Lsh/Bcg-related pleiotropic effects on macrophage activation:
influence on antigen processing and presentation', Infection and Immunity,
65(2): 380-86.
Latchman, D.S. (2004) Eukaryotic Transcription Factors. New York, Academic Press.
Lay, M.J. & Wittwer, C.T. (1997) 'Real-time fluorescence genotyping of factor V
Leiden during rapid-cycle PCR', Clinical Chemistry, 43(12): 2262-7.
Le Naour, F., Hohenkirk, L., Grolleau, A., Misek, D.E., Lescure, P., Geiger, J.D.,
Hanash, S. & Beretta, L. (2001) 'Profiling changes in gene expression during
differentiation and maturation of monocyte-derived dendritic cells using both
oligonucleotide microarrays and proteomics', The Journal of Biological
Chemistry, 267(21): 17920-30.
Lehtonen, A., Ahlfors, H., Veckman, V., Miettinen, M., Lahesmaa, R. & Julkunen, I.
(2007) 'Gene expression profiling during differentiation of human monocytes to
macrophages or dendritic cells', Journal of Leukocyte Biology, 82(3): 710-20.
Lema, C., Kohl-White, K., Lewis, L.R. & Dao, D.D. (2006) 'Optimized pH method for
DNA elution from buccal cells collected in Whatman FTA cards', Genetic
Testing, 10(2): 126-30.
Leung, K.H., Yip, S.P., Wong, W.S., Yiu, L.S., Chan, K.K., Lai, W.M., Chow, E.Y.,
Lin, C.K., Yam, W.C. & Chan, K.S. (2007) 'Sex- and age-dependent association
of SLC11A1 polymorphisms with tuberculosis in Chinese: a case control study',
BMC Infectious Diseases, 7:19.
Lewis, L.A., Victor, T.C., Helden, E.G., Blackwell, J.M., da Silva-Tatley, F., Tullett, S.,
Ehlers, M., Beyers, N., Donald, P.R. & van Helden, P.D. (1996) 'Identification
of C to T mutation at position -236bp in the human NRAMP1 gene promoter',
Immunogenetics, 44(4): 309-11.
Li, H.T., Zhang, T.T., Zhou, Y.Q., Huang, Q.H. & Huang, J. (2006) 'SLC11A1
(formerly NRAMP1) gene polymorphisms and tuberculosis susceptibility: a
meta-analysis', The International Journal of Tuberculosis and Lung Disease
10(1): 3-12.
Liaw, Y.S., Tsai-Wu, J.J., Wu, C.H., Hung, C.C., Lee, C.N., Yang, P.C., Luh, K.T. &
Kuo, S.H. (2002) 'Variations in the NRAMP1 gene and susceptibility of
tuberculosis in Taiwanese', The International Journal of Tuberculosis and Lung
Disease 6(5): 454-60.
Liew, M., Pryor, R., Palais, R., Meadows, C., Erali, M., Lyon, E. & Wittwer, C.T.
(2004) 'Genotyping of single-nucleotide polymorphisms by high-resolution
melting of small amplicons', Clinical Chemistry, 50(7): 1156-64.
Liu, H., Mulholland, N., Fu, H. & Zhao, K. (2006) 'Co-operative activity of BRG1 and
Z-DNA formation in chromatin remodeling', Molecular and Cell Biology, 26(7):
2550-9.
Liu, J., Fujiwara, T.M., Buu, N.T., Sanchez, F.O., Cellier, M., Paradis, A.J., Frappier,
D., Skamene, E., Gros, P. & Morgan, K. (1995) 'Identification of
polymorphisms and sequence variants in the human homologue of the mouse
natural resistance-associated macrophage protein gene', American Journal of
Human Genetics, 56(4): 845-53.
345
Liu, L.F. & Wang, J.C. (1987) 'Supercoiling of the DNA template during transcription',
Proceedings of the National Academy of Sciences of the United States of
America, 84(20): 7024-7.
Liu, W., Cao, W.C., Zhang, C.Y., Tian, L., Wu, X.M., Habbema, J.D.F., Zhao, Q.M.,
Zhang, P.H., Xin, Z.T., Li, C.Z. & Yang, H. (2004) 'VDR and NRAMP1 gene
polymorphisms in susceptibility to pulmonary tuberculosis among the Chinese
Han population: a case-control study', The International Journal of Tuberculosis
and Lung Disease, 8(4): 428-34.
Liu, W., Zhang, C.Y., Tian, L., Li, C.Z., Wu, X.M., Zhao, Q.M., Zhang, P.H., Yang,
S.M., Yang, H. & Cao, W.C. (2003) 'A case-control study on natural-resistanceassociated macrophage protein 1 gene polymorphisms and susceptibility to
pulmonary tuberculosis', Zhonghua Yu Fang Yi Xue Za Zhi, 37(6): 408-11.
Liu, Y., Nonnemacher, M.R. & Wigdahl, B. (2009) 'CCAAT/enhancer-binding proteins
and the pathogenesis of retrovirus infection', Future Microbiology, 4(3): 299321.
Lo, K. & Smale, S.T. (1996) 'Generality of a functional initiator consensus sequence',
Gene, 182(1-2): 13-22.
Lohmueller, K.E., Pearce, C.L., Pike, M., Lander, E.S. & Hirschhorn, J.N. (2003)
'Meta-analysis of genetic association studies supports a contribution of common
variants to susceptibility to common disease', Nature Genetics, 33(2): 177-182.
London, S.J., Xia, J., Lehman, T.A., Yang, J.H., Granada, E., Chunhong, L., Dubeau,
L., Li, T., David-Beabes, G.L. & Li, Y. (2001) 'Collection of Buccal Cell DNA
in Seventh-Grade Children Using Water and a Toothbrush', Cancer
Epidemiology Biomarkers and Prevention, 10(11): 1227-30.
López-Rodríguez, C., Botella, L. & Corbí, A.L. (1997) 'CCAAT/enhancer binding
proteins (C/EBP) regulate the tissue specific activity of the CD11c integrin gene
promoter through functional interactions with Sp1 proteins', The Journal of
Biological Chemistry, 272(46): 29120-6.
Lum, A. & Le Marchand, L. (1998) 'A simple mouthwash method for obtaining
genomic DNA in molecular epidemiological studies', Cancer Epidemiology,
Biomarkers & Prevention, 7(8): 719-24.
Lumley, T. (2009) Rmeta version 2.14, R package, http://cran.r-project.org.
Ma, J., Chen, T., Mandelin, J., Ceponis, A., Miller, N.E., Hukkanen, M., Ma, G.F. &
Konttinen, Y.T. (2003) 'Regulation of macrophage activation', Cellular and
Molecular Life Sciences, 60(11): 2334-46.
Ma, X., Dou, S., Wright, J.A., Reich, R.A., Teeter, L.D., El Sahly, H.M., Awe, R.J.,
Musser, J.M. & Graviss, E.A. (2002) '5 dinucleotide repeat polymorphism of
NRAMP1 and susceptibility to tuberculosis among Caucasian patients in
Houston, Texas', The International Journal of Tuberculosis and Lung Disease,
6(9): 818-23.
Mackay, J., Wright, C. & Bonfiglioli, R. (2008) 'A new approach to varietal
identification in plants by microsatellite high resolution melting analysis:
application to the verification of grapevine and olive cultivars', Plant Methods,
4(1): 8.
Mackenzie, B. & Hediger, M.A. (2004) 'SLC11 family of H+-coupled metal-ion
transporters NRAMP1 and DMT1', Pflügers Archiv European Journal of
Physiology, 447(5): 571-9.
Mader, E., Lukas, B. & Novak, J. (2008) 'A Strategy to Setup Codominant
Microsatellite Analysis for High-Resolution-Melting-Curve-Analysis (HRM)',
BMC Genetics, 9:69.
346
Maier, L.M., Smyth, D.J., Vella, A., Payne, F., Cooper, J.D., Pask, R., Lowe, C.,
Hulme, J., Smink, L.J., Fraser, H., Moule, C., Hunter, K.M., Chamberlain, G.,
Walker, N., Nutland, S., Undlien, D.E., Ronningen, K.S., Guja, C., IonescuTirgoviste, C., Savage, D.A., Strachan, D.P., Peterson, L.B., Todd, J.A., Wicker,
L.S. & Twells, R.C. (2005) 'Construction and analysis of tag single nucleotide
polymorphism maps for six human-mouse orthologous candidate genes in type 1
diabetes', BMC genetics 6:9.
Makowski, G.S., Davis, E.L., Aslanzadeh, J. & Hopfer, S.M. (1995) 'Enhanced direct
amplification of Guthrie card DNA following selective elution of PCR
inhibitors', Nucleic Acids Research, 23(18): 3788-9.
Maliarik, M.J., Chen, K.M., Sheffer, R.G., Rybicki, B.A., Major, M.L., Popovich, J., Jr.
& Iannuzzi, M.C. (2000) 'The Natural Resistance-Associated Macrophage
Protein Gene in African Americans with Sarcoidosis', American Journal of
Respiratory Cell and Molecular Biology, 22(6): 672-5.
Malo, D., Vogan, K., Vidal, S., Hu, J., Cellier, M., Schurr, E., Fuks, A., Bumstead, N.,
Morgan, K. & Gros, P. (1994) 'Haplotype Mapping and Sequence Analysis of
the Mouse Nramp Gene Predict Susceptibility to Infection with Intracellular
Parasites', Genomics, 23(1): 51-61.
Marquet, S., Lepage, P., Hudson, T.J., Musser, J.M. & Schurr, E. (2000) 'Complete
nucleotide sequence and genomic structure of the human NRAMP1 gene region
on Chromosome region 2q35', Mammalian Genome, 11(9): 755-62.
Marquet, S., Sanchez, F.O., Arias, M., Rodriguez, J., Parks, S.C., Skamene, E., Schurr,
E. & Garcia, L.F. (1999) 'Variants of the Human NRAMP1 Gene and Altered
Human Immunodeficiency Virus Infection Susceptibility', Journal of Infectious
Diseases, 180(5): 1521-25.
Martinet, W., Schrijvers, D.M. & Kockx, M.M. (2003) 'Nucleofection as an efficient
nonviral transfection method for human monocytic cells', Biotechnology Letters,
25(13): 1025-29.
Marziliano, N., Pelo, E., Minuti, B., Passerini, I., Torricelli, F. & Da Prato, L. (2000)
'Melting temperature assay for a UGT1A gene variant in Gilbert syndrome',
Clinical Chemistry, 46(3): 423-5.
Mattick, J.S. (2007) 'A new paradigm for developmental biology', The Journal of
Experimental Biology, 210(9): 1526-47.
Matutes, E., Morilla, R. & Catovsky, D. (2006) Chapter 14 - Immunophenotyping.
Dacie and Lewis Practical Haematology (Tenth Edition). Philadelphia,
Churchill Livingstone.
McDermid, J.M. & Prentice, A.M. (2006) 'Iron and infection: effects of host iron status
and the iron-regulatory genes haptoglobin and NRAMP1 (SLC11A1) on hostpathogen interactions in tuberculosis and HIV', Clinical Science, 110(5): 503-24.
McDermid, J.M., van der Loeff, M.F.S., Jaye, A., Hennig, B.J., Bates, C., Todd, J.,
Sirugo, G., Hill, A.V., Whittle, H.C. & Prentice, A.M. (2009) 'Mortality in HIV
infection is independently predicted by host iron status and SLC11A1 and HP
genotypes, with new evidence of a gene-nutrient interaction', The American
Journal of Clinical Nutrition, 90(1): 225-33.
McKeon, C., Accili, D., Chen, H., Pham, T. & Walker, G.E. (1997) 'A Conserved
Region in the First Intron of the Insulin Receptor Gene Binds Nuclear Proteins
during Adipocyte Differentiation', Biochemical and Biophysical Research
Communications, 240(3): 701-6.
347
Meisner, S.J., Mucklow, S., Warner, G., Sow, S.O., Lienhardt, C. & Hill, A.V. (2001)
'Association of NRAMP1 polymorphism with leprosy type but not susceptibility
to leprosy per se in west Africans ', American Journal of Tropical Medicine and
Hygiene, 65(6): 733-5.
Mendes, D., Correia, M., Barbedo, M., Vaio, T., Mota, M., Gonçalves, O. & Valente, J.
(2009) 'Behçet's disease - a contemporary review', Journal of Autoimmunity,
32(3-4): 178-88.
Merza, M., Farnia, P., Anoosheh, S., Varahram, M., Kazampour, M., Pajand, O., Saeif,
S., Mirsaeidi, M., Masjedi, M.R., Velayati, A.A. & Hoffner, S. (2009) 'The
NRAMP1, VDR and TNF-alpha gene polymorphisms in Iranian tuberculosis
patients: the study on host susceptibility', The Brazilian Journal of Infectious
Diseases, 13(4): 252-6.
Mhlanga, M.M. & Malmberg, L. (2001) 'Using molecular beacons to detect singlenucleotide polymorphisms with real-time PCR', Methods, 25(4): 463-71.
Milne, E., van Bockxmeer, F.M., Robertson, L., Brisbane, J.M., Ashton, L.J., Scott, R.J.
& Armstrong, B.K. (2006) 'Buccal DNA collection: comparison of buccal swabs
with FTA cards', Cancer Epidemiology, Biomarkers & Prevention, 15(4): 816-9.
Mohamed, H.S., Ibrahim, M.E., Miller, E.N., White, J.K., Cordell, H.J., Howson, J.M.,
Peacock, C.S., Khalil, E.A., El Hassan, A.M. & Blackwell, J.M. (2004)
'SLC11A1 (formerly NRAMP1) and susceptibility to visceral leishmaniasis in
The Sudan', European Journal of Human Genetics, 12(1): 66-74.
Moore, K.W., de Waal Malefyt, R., Coffman, R.L. & O'Garra, A. (2001) 'Interleukin-10
and the interleukin-10 receptor', Annual Review of Immunology, 19(1): 683-765.
Morahan, G., Huang, D., Tait, B.D., Colman, P.G. & Harrison, L.C. (1996) 'Markers on
distal chromosome 2q linked to insulin-dependent diabetes mellitus', Science,
272(5269): 1811-3.
Motsinger-Reif, A., Antas, P., Oki, N., Levy, S., Holland, S. & Sterling, T. (2010)
'Polymorphisms in IL-1beta, vitamin D receptor Fok1, and Toll-like receptor 2
are associated with extrapulmonary tuberculosis', BMC Medical Genetics, 11:37.
Mulero, V., Searle, S., Blackwell, J.M. & Brock, J.H. (2002) 'Solute carrier 11a1
(Slc11a1; formerly Nramp1) regulates metabolism and release of iron acquired
by phagocytic, but not transferrin-receptor-mediated, iron uptake', The
Biochemical Journal, 363(1): 89-94.
Mulot, C., Stucker, I., Clavel, J., Beaune, P. & Loriot, M.A. (2005) 'Collection of
human genomic DNA from buccal cells for genetics studies: comparison
between cytobrush, mouthwash, and treated card', Journal of Biomedicine &
Biotechnology, 2005(3): 291-6.
Muthukrishnan, M., Singanallur, N.B., Ralla, K. & Villuppanoor, S.A. (2008)
'Evaluation of FTA cards as a laboratory and field sampling device for the
detection of foot-and-mouth disease virus and serotyping by RT-PCR and realtime RT-PCR', Journal of Virological Methods, 151(2): 311-6.
Natsuka, S., Akira, S., Nishio, Y., Hashimoto, S., Sugita, T., Isshiki, H. & Kishimoto, T.
(1992) 'Macrophage differentiation-specific expression of NF-IL6, a
transcription factor for interleukin-6', Blood, 79(2): 460-6.
Neil, H., Malabat, C., d'Aubenton-Carafa, Y., Xu, Z., Steinmetz, L.M. & Jacquier, A.
(2009) 'Widespread bidirectional promoters are the major source of cryptic
transcripts in yeast', Nature, 457(7232): 1038-42.
Nerlov, C. & Ziff, E.B. (1995) 'CCAAT/enhancer binding protein-α amino acid motifs
with dual TBP and TFIIB binding abitiy co-operate to activate transcription in
both yeast and mammalian cells', The EMBO Journal, 14(17): 4318-28.
348
Newport, M., Levin, M., Blackwell, J.M., Shaw, M.A., Williamson, R. & Huxley, C.
(1995) 'Evidence for exclusion of a mutation in NRAMP as the cause of familial
disseminated atypical mycobacterial infection in a Maltese kindred', Journal of
Medical Genetics 32(11): 904-6.
Niedergang, F. & Chavrier, P. (2004) 'Signaling and membrane dynamics during
phagocytosis: many roads lead to the phagos(R)ome', Current Opinion in Cell
Biology, 16(4): 422-8.
Nielsen, O.J., Andersen, L.S., Hansen, N.E. & Hansen, T.M. (1994) 'Serum transferrin
receptor levels in anaemic patients with rheumatoid arthritis', Scandinavian
Journal of Clinical & Laboratory Investigation, 54(1): 75-82.
Nino-Moreno, P., Portales-Perez, D., Hernandez-Castro, B., Portales-Cervantes, L.,
Flores-Meraz, V., Baranda, L., Gomez-Gomez, A., Acuna-Alonzo, V.,
Granados, J. & Gonzalez-Amaro, R. (2007) 'P2X(7) and NRAMP1/SLC11A1
gene polymorphisms in Mexican mestizo patients with pulmonary tuberculosis',
Clinical and Experimental Immunology, 148(3): 469-77.
Nishimura, M. & Naito, S. (2008) 'Tissue-specific mRNA expression profiles of human
solute carrier transporter superfamilies', Drug Metabolism and
Pharmacokinetics, 23(1): 22-44.
Nishino, M., Ikegami, H., Fujisawa, T., Kawaguchi, Y., Kawabata, Y., Shintani, M.,
Ono, M. & Ogihara, T. (2005) 'Functional polymorphism in Z-DNA–forming
motif of promoter of SLC11A1 gene and type 1 diabetes in Japanese subjects:
Association study and meta-analysis ', Metabolism Clinical and Experimental,
54(5): 628-33.
Nordheim, A., Lafer, E.M., Peck, L.J., Wang, J.C., Stollar, B.D. & Rich, A. (1982)
'Negatively supercoiled plasmids contain left-handed Z-DNA segments as
detected by specific antibody binding', Cell, 31(1): 309-18.
O'Brien, B.A., Archer, N.S., Simpson, A.M., Torpy, F.R. & Nassif, N.T. (2008)
'Association of SLC11A1 promoter polymorphisms with the incidence of
autoimmune and inflammatory diseases: A meta-analysis', Journal of
Autoimmunity, 31(1): 42-51.
O'Shea-Greenfield, A. & Smale, S. (1992) 'Roles of TATA and initiator elements in
determining the start site location and direction of RNA polymerase II
transcription', The Journal of Biological Chemistry, 267(2): 1391-402.
Oosterom, J., van Doornmalen, E.J., Lobregt, S., Blomenröhr, M. & Zaman, G.J.R.
(2005) 'High-Throughput Screening Using beta-Lactamase Reporter-Gene
Technology for Identification of Low-Molecular-Weight Antagonists of the
Human Gonadotropin Releasing Hormone Receptor', ASSAY and Drug
Development Technologies, 3(2): 143-54.
Ouchi, K., Suzuki, Y., Shirakawa, T. & Kishi, F. (2003) 'Polymorphism of SLC11A1
(Formerly NRAMP1) Gene Confers Susceptibility to Kawasaki Disease',
Journal of Infectious Diseases, 187(2): 326-29.
Paccagnini, D., Sieswerda, L., Rosu, V., Masala, S., Pacifico, A., Gazouli, M.,
Ikonomopoulos, J., Ahmed, N., Zanetti, S. & Sechi, L.A. (2009) 'Linking
Chronic Infection and Autoimmune Diseases: Mycobacterium avium Subspecies
paratuberculosis, SLC11A1 Polymorphisms and Type-1 Diabetes Mellitus',
PLoS ONE, 4(9): e7109.
Pai, C.Y., Hsieh, L.L., Lee, T.C., Yang, S.B., Linville, J., Chou, S.L. & Yang, C.H.
(2006) 'Mitochondrial DNA sequence alterations observed between blood and
buccal cells within the same individuals having betel quid (BQ)-chewing habit',
Forensic Science International, 156(2): 124-30.
349
Pai, C.Y., Hsieh, L.L., Tsai, C.W., Chiou, F.S., Yang, C.H. & Hsu, B.D. (2002) 'Allelic
alterations at the STR markers in the buccal tissue cells of oral cancer patients
and the oral epithelial cells of healthy betel quid-chewers: an evaluation of
forensic applicability', Forensic Science International, 129(3): 158-67.
Palais, R.A., Liew, M.A. & Wittwer, C.T. (2005) 'Quantitative heteroduplex analysis for
single nucleotide polymorphism genotyping', Analytical Biochemistry, 346(1):
167-75.
Park, E., Jung, H., Yang, H., Yoo, M., Kim, C. & Kim, K. (2007) 'Optimized THP-1
differentiation is required for the detection of responses to weak stimuli',
Inflammation Research, 56(1): 45-50.
Pavesi, G., Zambelli, F. & Pesole, G. (2007) 'WeederH: an algorithm for finding
conserved regulatory motifs and regions in homologous sequences', BMC
Bioinformatics, 7(8): 46-59.
Payne, S.M. (1993) 'Iron acquisition in microbial pathogenesis', Trends in
Microbiology, 1(2): 66-9.
Payton, S.G., Whetstine, J.R., Ge, Y. & Matherly, L.H. (2005) 'Transcriptional
regulation of the human reduced folate carrier promoter C: synergistic
transactivation by Sp1 and C/EBP β and identification of a downstream
repressor', Biochimica et Biophysica Acta (BBA) - Gene Regulatory
Mechanisms, 1727(1): 45-57.
Peck, L.J., Nordheim, A., Rich, A. & Wang, J.C. (1982) 'Flipping of cloned
d(pCpG)n.d(pCpG)n DNA sequences from right- to left-handed helical structure
by salt, Co(III), or negative supercoiling', Proceedings of the National Academy
of Sciences of the United States of America, 79(15): 4560-64.
Pedersen, T.A., Kowenz-Leutz, E., Leutz, A. & Nerlov, C. (2001) 'Cooperation between
C/EBPalpha TBP/TFIIB and SWI/SNF recruiting domains is required for
adipocyte differentiation', Genes and Development, 15(23): 3208-16.
Pie, S., Matsiota-Bernard, P., Truffa-Bachi, P. & Nauciel, N. (1996) 'Gamma interferon
and interleukin-10 gene expression in innately susceptible and resistant mice
during the early phase of Salmonella typhimurium infection', Infection and
Immunity, 162(3): 6122-31.
Pirulli, D., Boniotto, M., Puzzer, D., Spano, A., Amoroso, A. & Crovella, S. (2000)
'Flexibility of melting temperature assay for rapid detection of insertions,
deletions, and single-point mutations of the AGXT gene responsible for type 1
primary hyperoxaluria', Clinical Chemistry, 46(11): 1842-4.
Plant, J. & Glynn, A.A. (1974) 'Genetics of resistance to infection with Salmonella
typhimurium in mice', The Journal of Infectious Diseases, 133(1): 72-8.
Plevy, S.E., Gemberling, J.H., Hsu, S., Dorner, A.J. & Smale, S.T. (1997) 'Multiple
control elements mediate activation of the murine and human interleukin 12 p40
promoters: evidence of functional synergy between C/EBP and Rel proteins',
Molecular and Cell Biology, 17(8): 4572-88.
Poland, D. (1974) 'Recursion relation generation of probability profiles for specificsequence macromolecules with long-range correlations', Biopolymers, 13(9):
1859-71.
Puzyrev, V.P., Freĭdin, M.B., Rudko, A.A., Strelis, A.K. & Kolokolova, O.V. (2002)
'Polymorphisms of the candidate genes for genetic susceptibility to tuberculosis
in the Slavic population of Siberia: a pilot study', Molecular Biology, 36(5): 78891.
350
Qu, Y., Tang, Y., Cao, D., Wu, F., Liu, J., Lu, G., Zhang, Z. & Xia, Z. (2007) 'Genetic
polymorphisms in alveolar macrophage response-related genes, and risk of
silicosis and pulmonary tuberculosis in Chinese iron miners', International
Journal of Hygiene and Environmental Health, 210(6): 679-89.
Qureshi, S.A. (2007) 'Beta-lactamase: an ideal reporter system for monitoring gene
expression in live eukaryotic cells', Biotechniques, 42(1): 91-6.
R Development Core Team (2008) R: A language and environment for statistical
computing, Vienna, Austria, http://www.R-project.org.
Radzioch, D., Kramnik, I. & Skamene, E. (1994) 'Molecular mechanisms of natural
resistance to mycobacterial infections', Circulatory Shock, 44(3): 115-20.
Rajendram, D., Ayenza, R., Holder, F.M., Moran, B., Long, T. & Shah, H.N. (2006)
'Long-term storage and safe retrieval of DNA from microorganisms for
molecular analysis using FTA matrix cards', Journal of Microbiological
Methods, 67(3): 582-92.
Reed, G.H., Kent, J.O. & Wittwer, C.T. (2007) 'High-resolution DNA melting analysis
for simple and efficient molecular diagnostics', Pharmacogenomics, 8(6): 597608.
Reed, G.H. & Wittwer, C.T. (2004) 'Sensitivity and specificity of single-nucleotide
polymorphism scanning by high-resolution melting analysis', Clinical
Chemistry, 50(10): 1748-54.
Resendes, K.K. & Rosmarin, A.G. (2004) 'Sp1 Control of Gene Expression in Myeloid
Cells', Critical Reviews in Eukaryotic Gene Expression, 14(3): 171-81.
Rich, A. & Zhang, S. (2003) 'Z-DNA: The long road to biological function', Nature
Reviews Genetics, 4(7): 566-72.
Richer, E., Campion, C.G., Dabbas, B., White, J.H. & Cellier, M.F. (2008)
'Transcription factors Sp1 and C/EBP regulate NRAMP1 gene expression', The
FEBS Journal, 275(20): 5074-89.
Rioja, I., Clayton, C., Graham, S., Life, P. & Dickson, M. (2005) 'Gene expression
profiles in the rat streptococcal cell wall-induced arthritis model identified using
microarray analysis', Arthritis Research and Therapy, 7(1): R101-7.
Ririe, K.M., Rasmussen, R.P. & Wittwer, C.T. (1997) 'Product differentiation by
analysis of DNA melting curves during the polymerase chain reaction',
Analytical Biochemistry, 245(2): 154-60.
Roach, T.I., Barton, C.H., Chatterjee, D. & Blackwell, J.M. (1993) 'Macrophage
activation: lipoarabinomannan from avirulent and virulent strains of
Mycobacterium tuberculosis differentially induces the early genes c-fos, KC, JE,
and tumor necrosis factor-alpha', Journal of Immunology 150(5): 1886-96.
Roach, T.I., Chatterjee, D. & Blackwell, J.M. (1994) 'Induction of early-response genes
KC and JE by mycobacterial lipoarabinomannans: regulation of KC expression
in murine macrophages by Lsh/Ity/Bcg (candidate Nramp)', Infection and
Immunity, 62(4): 1176-84.
Rodriguez, M.R., Gonzalez-Escribano, M.F., Aguilar, F., Valenzuela, A., Garcia, A. &
Nunez-Roldan, A. (2002) 'Association of NRAMP1 promoter gene
polymorphism with the susceptibility and radiological severity of rheumatoid
arthritis', Tissue Antigens, 59(4): 311-15.
Roger, M., Levee, G., Chanteau, S., Gicquel, B. & Schurr, E. (1997) 'No evidence for
linkage between leprosy susceptibility and the human natural resistanceassociated macrophage protein 1 (NRAMP1) gene in French Polynesia',
International Journal of Leprosy and Other Mycobacterial Diseases 65(2): 197202.
351
Roger, M., Sanchez, F.O. & Schurr, E. (1998) 'Comparative study of the genomic
organization of DNA repeats within the 5'-flanking region of the natural
resistance-associated macrophage protein gene (NRAMP1) between humans and
great apes', Mammalian genome, 9(6): 435-9.
Roig, E.A., Richer, E., Canonne-Hergaux, F., Gros, P. & Cellier, M.F. (2002)
'Regulation of NRAMP1 gene expression by 1alpha,25-dihydroxy-vitamin D(3)
in HL-60 phagocytes', Journal of Leukocyte Biology, 71(5): 890-904.
Rojas, M., Olivier, M., Gros, P., Barrera, L.F. & Garcia, L.F. (1999) 'TNF-α and IL-10
Modulate the Induction of Apoptosis by Virulent Mycobacterium tuberculosis in
Murine Macrophages', The Journal of Immunology, 162(10): 6122-31.
Roy, S., Frodsham, A., Saha, B., Hazra, S.K., Mascie-Taylor, C.G. & Hill, A.V. (1999)
'Association of Vitamin D Receptor Genotype with Leprosy Type', The Journal
of Infectious Diseases, 179(1): 187-91.
Runstadler, J.A., Säilä, H., Savolainen, A., Leirisalo-Repo, M., Aho, K., TuomilehtoWolf, E., Tuomilehto, J. & Seldin, M.F. (2005) 'Association of SLC11A1
(NRAMP1) with persistent oligoarticular and polyarticular rheumatoid factornegative juvenile idiopathic arthritis in Finnish patients: Haplotype analysis in
Finnish families', Arthritis & Rheumatism, 52(1): 247-56.
Rupa, D.S. & Eastmond, D.A. (1997) 'Chromosomal alterations affecting the 1cen-1q12
region in buccal mucosal cells of betel quid chewers detected using multicolor
fluorescence in situ hybridization', Carcinogenesis, 18(12): 2347-51.
Ryu, S., Park, Y.K., Bai, G.H., Kim, S.J., Park, S.N. & Kang, S. (2000) '3'UTR
polymorphisms in the NRAMP1 gene are associated with susceptibility to
tuberculosis in Koreans', The International Journal of Tuberculosis and Lung
Disease 4(6): 577-80.
Sahiratmadja, E., Wieringa, F.T., van Crevel, R., de Visser, A.W., Adnan, I.,
Alisjahbana, B., Slagboom, E., Marzuki, S., Ottenhoff, T.H., van de Vosse, E. &
Marx, J.J. (2007) 'Iron deficiency and NRAMP1 polymorphisms (INT4, D543N
and 3'UTR) do not contribute to severity of anaemia in tuberculosis in the
Indonesian population', The British Journal of Nutrition, 98(4): 684-90.
Sakitani, K., Nishizawa, M., Inoue, K., Masu, Y., Okumura, T. & Ito, S. (1998)
'Synergistic regulation of inducible nitric oxide synthase gene by
CCAAT/enhancer-binding protein β and nuclear factor-κB in hepatocytes',
Genes to Cells, 3(5): 321-30.
Samaranayake, T.N., Fernando, S.D. & Dissanayake, V.H.W. (2010) 'Candidate gene
study of susceptibility to cutaneous leishmaniasis in Sri Lanka', Tropical
Medicine & International Health, 15(5): 632-8.
Sanjeevi, C.B., Miller, E.N., Dabadghao, P., Rumba, I., Shtauvere, A., Denisova, A.,
Clayton, D. & Blackwell, J.M. (2000) 'Polymorphism at NRAMP1 and
D2S1471 loci associated with juvenile rheumatoid arthritis', Arthritis &
Rheumatism, 43(6): 1397-404.
Scheller, M., Foerster, J., Heyworth, C.M., Waring, J.F., Löhler, J., Gilmore, G.L.,
Shadduck, R.K., Dexter, T.M. & Horak, I. (1999) 'Altered development and
cytokine responses to myeliod progenitors in the absence of transcription factor,
interferon consensus sequence binding protein', Blood, 94(11): 3764-71.
Schnoor, M., Buers, I., Sietmann, A., Brodde, M.F., Hofnagel, O., Robenek, H. &
Lorkowski, S. (2009) 'Efficient non-viral transfection of THP-1 cells', Journal of
Immunological Methods, 344(2): 109-15.
352
Schroth, G.P., Chou, P.J. & Ho, P.S. (1992) 'Mapping Z-DNA in the human genome.
Computer-aided mapping reveals a nonrandom distribution of potential Z-DNAforming sequences in human genes', Journal of Biological Chemistry, 267(17):
11846-55.
Schug, J. (2003) Using TESS to Predict Transcription Factor Binding Sites in DNA
Sequence. IN Baxevanis, A.D. (Ed.) Current Protocols in Bioinformatics. J.
Wiley and Sons.
Schug, J. & Overton, C.G. (1997) 'TESS: Transcription Element Search Software on the
WWW', (Technical Report): http://www.cbil.upenn.edu/TESS.
Schurr, E., Skamene, E., Morgan, K., Chu, M.L. & Gros, P. (1990) 'Mapping of Col3a1
and Col6a3 to proximal murine chromosome 1 identifies conserved linkage of
structural protein genes between murine chromosome 1 and human chromosome
2q', Genomics, 8(3): 477-86.
Searle, S. & Blackwell, J.M. (1999) 'Evidence for a functional repeat polymorphism in
the promoter of the human NRAMP1 gene that correlates with autoimmune
versus infectious disease susceptibility', Journal of Medical Genetics, 36(4):
295-9.
Searle, S., Bright, N.A., Roach, T.I., Atkinson, P.G., Barton, C.H., Meloen, R.H. &
Blackwell, J.M. (1998) 'Localisation of Nramp1 in macrophages: modulation
with activation and infection', Journal of Cell Science, 111(19): 2855-66.
Sechi, L.A., Gazouli, M., Sieswerda, L.E., Molicotti, P., Ahmed, N., Ikonomopoulos, J.,
Scanu, A.M., Paccagnini, D. & Zanetti, S. (2006) 'Relationship between Crohn's
disease, infection with Mycobacterium avium subspecies paratuberculosis and
SLC11A1 gene polymorphisms in Sardinian patients', World Journal of
Gastroenterology 12(44): 7161-4.
Selvaraj, P. (2000) 'Role of human leucocyte antigen (HLA) and non-HLA genes in
susceptibility or resistance to pulmonary tuberculosis ', The Indian Journal of
Tuberculosis, 47(3): 133-8.
Selvaraj, P., Chandra, G., Kurian, S.M., Reetha, A.M., Charles, N. & Narayanan, P.R.
(2002) 'NRAMP1 gene polymorphism in pulmonary and spinal tuberculosis',
Current Science, 82(4): 451-4.
Shaw, M.A., Clayton, D., Atkinson, S.E., Williams, H., Miller, N., Sibthorpe, D. &
Blackwell, J.M. (1996) 'Linkage of rheumatoid arthritis to the candidate gene
NRAMP1 on 2q35', Journal of Medical Genetics, 33(8): 672-7.
Shaw, M.A., Clayton, D. & Blackwell, J.M. (1997a) 'Analysis of the candidate gene
NRAMP1 in the first 61 ARC National Repository families for rheumatoid
arthritis', The Journal of Rheumatology, 24(1): 212-4.
Shaw, M.A., Collins, A., Peacock, C.S., Miller, E.N., Black, G.F., Sibthorpe, D., LinsLainson, Z., Shaw, J.J., Ramos, F., Silveira, F. & Blackwell, J.M. (1997b)
'Evidence that genetic susceptibility to Mycobacterium tuberculosis in a
brazilian population is under oligogenic control: Linkage study of the candidate
genes NRAMP1 and TBFA', Tubercle and Lung Disease, 78(1): 35-45.
Shilna, T., Hosomichi, K., Inoko, H. & Kuiski, J.K. (2009) 'The HLA genomic loci
map: expression, interaction, diversity and disease', Journal of Human Genetics,
54(1): 15-39.
Singal, D.P., Li, J., Zhu, Y. & Zhang, G. (2000) 'NRAMP1 gene polymorphisms in
patients with rheumatoid arthritis', Tissue Antigens, 55(1): 44-7.
Skamene, E. (1994) 'The Bcg gene story', Immunobiology, 191(4-5): 451-60.
353
Skamene, E., Gros, P., Forget, A., Kongshavn, P.L.A., St Charles, C. & Taylor, B.A.
(1982) 'Genetic regulation of resistance to intracellular pathogens', Nature,
297(5866): 506-9.
Slebos, R.J.C., Li, M., Vadivelu, S., Burkey, B.B., Netterville, J.L., Sinard, R., Gilbert,
J., Murphy, B., Chung, C.H., Shyr, Y. & Yarbrough, W.G. (2008) 'Microsatellite
mutations in buccal cells are associated with aging and head and neck
carcinoma', British Journal of Cancer, 98(3): 619-26.
Smale, S.T. (1997) 'Transcription initiation from TATA-less promoters within
eukaryotic protein-coding genes', Biochimica et Biophysica Acta, 1351(1-2): 7388.
Smale, S.T. & Kadonaga, J.T. (2003) 'The RNA polymerase II core promoter', Annual
Review of Biochemistry, 72:449-79.
Smale, S.T., Schmidt, M.C., Berk, A.J. & Baltimore, D. (1990) 'Transcriptional
activation by Sp1 as directed through TATA or initiator: specific requirement
for mammalian transcription factor IID', Proceedings of the National Academy
of Sciences of the United States of America, 87(12): 4509-13.
Smit, J.J., Folkerts, G. & Nijkamp, F.P. (2004) 'Ramp-ing up allergies: Nramp1
(Slc11a1), macrophages and the hygiene hypothesis', Trends in Immunology,
25(7): 342-7.
Smit, J.J., van Loveren, H., Hoekstra, M.O., Nijkamp, F.P. & Bloksma, N. (2003)
'Influence of the macrophage bacterial resistance gene Nramp1 (Slc11a1) on the
induction of allergic asthma in the mouse', The FASEB Journal, 17(8): 958-60.
Soborg, C., Andersen, A.B., Madsen, H.O., Kok-Jensen, A., Skinhoj, P. & Garred, P.
(2002) 'Natural resistance-associated macrophage protein 1 polymorphisms are
associated with microscopy-positive tuberculosis', Journal of Infectious
Diseases, 186(4): 517-21.
Soborg, C., Andersen, A.B., Range, N., Malenganisho, W., Friis, H., Magnussen, P.,
Temu, M.M., Changalucha, J., Madsen, H.O. & Garred, P. (2007) 'Influence of
candidate susceptibility genes on tuberculosis in a high endemic region',
Molecular Immunology, 44(9): 2213-20.
Soe-Lin, S., Apte, S.S., Andriopoulos, B.J., Andrews, M.C., Schranzhofer, M.,
Kahawita, T., Garcia-Santos, D. & Ponka, P. (2009) 'Nramp1 promotes efficient
macrophage recycling of iron following erythrophagocytosis in vivo',
Proceedings of the National Academy of Sciences of the United States of
America, 106(14): 5960-5.
Soe-Lin, S., Apte, S.S., Mikhael, M.R., Kayembe, L.K., Nie, G. & Ponka, P. (2010)
'Both Nramp1 and DMT1 are necessary for efficient macrophage iron recycling',
Experimental Hematology, 38(8): 609-17.
Soe-Lin, S., Sheftel, A.D., Wasyluk, B. & Ponka, P. (2008) 'Nramp1 equips
macrophages for efficient iron recycling', Experimental Hematology, 36(8): 92937.
Soo, S.S., Villarreal-Ramos, B., Khan, C.M.A., Hormaeche, C.E. & Blackwell, J.M.
(1998) 'Genetic Control of Immune Response to Recombinant Antigens Carried
by an Attenuated Salmonella typhimurium Vaccine Strain: Nramp1 Influences
T-Helper Subset Responses and Protection against Leishmanial Challenge',
Infection and Immunity, 66(5): 1910-7.
Steger, G. (1994) 'Thermal denaturation of double-stranded nucleic acids: prediction of
temperatures critical for gradient gel electrophoresis and polymerase chain
reaction', Nucleic Acids Research, 22(14): 2760-8.
354
Stein, C. & Baker, A. (2011) 'Tuberculosis as a complex trait: impact of genetic
epidemiological study design', Mammalian Genome, 22(1-2): 91-9.
Stein, C., Zalwango, S., Chiunda, A., Millard, C., Leontiev, D., Horvath, A., Cartier, K.,
Chervenak, K., Boom, W., Elston, R., Mugerwa, R., Whalen, C. & Iyengar, S.
(2007) 'Linkage and association analysis of candidate genes for TB and TNFα
cytokine expression: evidence for association with IFNGR1, IL-10, and TNF
receptor 1 genes', Human Genetics, 121(6): 663-73.
Sterne, J.A.C., Egger, M. & Smith, G.D. (2001) 'Systematic reviews in health care:
Investigating and dealing with publication and other biases in meta-analysis',
British Medical Journal, 323(7304): 101-5.
Stienstra, Y., van der Werf, T.S., Oosterom, E., Nolte, I.M., van der Graaf, W.T.,
Etuaful, S., Raghunathan, P.L., Whitney, E.A., Ampadu, E.O., Asamoa, K.,
Klutse, E.Y., Te Meerman, G.J., Tappero, J.W., Ashford, D.A. & van der
Steege, G. (2006) 'Susceptibility to Buruli ulcer is associated with the SLC11A1
(NRAMP1) D543N polymorphism', Genes and Immunity, 7(3): 185-9.
Stober, C.B., Brode, S., White, J.K., Popoff, J.F. & Blackwell, J.M. (2007) 'Slc11a1,
Formerly Nramp1, Is Expressed in Dendritic Cells and Influences Major
Histocompatibility Complex Class II Expression and Antigen-Presenting Cell
Function', Infection and Immunity, 75(10): 5059-67.
Stokkers, P.C., de Heer, K., Leegwater, A.C., Reitsma, P.H., Tytgat, G.N. & van
Deventer, S.J. (1999) 'Inflammatory bowel disease and the genes for the natural
resistance-associated macrophage protein-1 and the interferon-gamma receptor
1.' International Journal of Colorectal Disease 14(1): 13-7.
Strom, A.C., Forsberg, M., Lillhager, P. & Westin, G. (1996) 'The transcription factors
Sp1 and Oct-1 interact physically to regulate human U2 snRNA gene
expression', Nucleic Acid Research, 24(11): 1981-6.
Strubin, M. & Struhl, K. (1992) 'Yeast and human TFIID with altered DNA-binding
specificity for TATA elements', Cell, 68(4): 721-30.
Studzinski, G.P., Garay, E., Patel, R., Zhang, J. & Wang, X. (2006) 'Vitamin D
Receptor Signaling of Monocytic Differentiation in Human Leukemia Cells:
Role of MAPK Pathways in Transcription Factor Activation', Current Topics in
Medicinal Chemistry, 6(12): 1267-71.
Sundström, C. & Nilsson, K. (1976) 'Establishment and characterization of a human
histiocytic lymphoma cell line (U-937)', International Journal of Cancer, 17(5):
565-77.
Supek, F., Supekova, L., Nelson, H. & Nelson, N. (1997) 'Function of metal-ion
homeostasis in the cell division cycle, mitochondrial protein processing,
sensitivity to mycobacterial infection and brain function', Journal of
Experimental Biology, 200(2): 321-30.
Suske, G. (1999) 'The Sp-family of transcription factors', Gene, 238(2): 291-300.
Sweeting, J.M., Sutton, J.A. & Lambert, C.P. (2004) 'What to add to nothing? Use and
avoidance of continuity corrections in meta-analysis of sparse data', Statistics in
Medicine, 23(9): 1351-75.
Tagle, D.A., Koop, B.F., Goodman, M., Slightom, J.L., Hess, D.L. & Jones, R.T. (1988)
'Embryonic epsilon and gamma globin genes of a prosimian primate (Galago
crassicaudatus) : Nucleotide and amino acid sequences, developmental
regulation and phylogenetic footprints', Journal of Molecular Biology, 203(2):
439-55.
355
Takahashi, K., Hasegawa, Y., Abe, T., Yamamoto, T., Nakashima, K., Imaizumi, K. &
Shimokata, K. (2008) 'SLC11A1 (formerly NRAMP1) polymorphisms
associated with multidrug-resistant tuberculosis', Tuberculosis, 88(1): 52-7.
Takahashi, K., Satoh, J., Kojima, Y., Negoro, K., Hirai, M., Hinokio, Y., Kinouchi, Y.,
Suzuki, S., Matsuura, N., Shimosegawa, T. & Oka, Y. (2004) 'Promoter
polymorphism of SLC11A1 (formerly NRAMP1) confers susceptibility to
autoimmune type 1 diabetes mellitus in Japanese', Tissue Antigens, 63(3): 231-6.
Takaoka, A., Wang, Z., Choi, M.K., Yanai, H., Negishi, H., Ban, T., Lu, Y., Miyagishi,
M., Kodama, T., Honda, K., Ohba, Y. & Taniguchi, T. (2007) 'DAI (DLM1/ZBP1) is a cytosolic DNA sensor and an activator of innate immune response',
Nature, 448(7152): 501-5.
Tamura, T. & Ozato, K. (2002) 'ICSBP/IRF-8: its regulatory roles in the development of
myeloid cells', Journal of Interferon and Cytokine Research, 22(1): 145-52.
Tamura, T., Thotakura, P., Tanaka, T.S., Ko, M.S. & Ozato, K. (2005) 'Identification of
target genes and a unique cis element regulated by IRF-8 in developing
macrophages', Blood, 106(6): 1938-47.
Tamura, T., Yanai, H., Savitsky, D. & Taniguchi, T. (2008) 'The IRF Family
Transcription Factors in Immunity and Oncogenesis', Annual Review of
Immunology, 26(1): 535-84.
Tan, N.Y. & Khachigian, L.M. (2009) 'Sp1 Phosphorylation and Its Regulation of Gene
Transcription', Molecular and Cell Biology, 29(10): 2483-8.
Tanaka, G., Shojima, J., Matsushita, I., Nagai, H., Kurashima, A., Nakata, K., Toyota,
E., Kobayashi, N., Kudo, K. & Keicho, N. (2007) 'Pulmonary Mycobacterium
avium complex infection: association with NRAMP1 polymorphisms', European
Respiratory Journal, 30(1): 90-6.
Taype, C.A., Castroa, J.C., Accinellib, R.A., Herrera-Velita, P., Shaw, M.A. &
Espinozaa, J.R. (2006) 'Association between SLC11A1 polymorphisms and
susceptibility to different clinical forms of tuberculosis in the Peruvian
population', Infection, Genetics and Evolution 6(5): 361-7.
Telfer, J.F. & Brock, J.H. (2002) 'Expression of ferritin, transferrin receptor, and nonspecific resistance associated macrophage proteins 1 and 2 (Nramp1 and
Nramp2) in the human rheumatoid synovium', Annals of the Rheumatic
Diseases, 61(8): 741-4.
Terrin, N., Schmid, C.H. & Lau, J. (2005) 'In an empirical evaluation of the funnel plot,
researchers could not visually identify publication bias', Journal of Clinical
Epidemiology, 58(9): 894-901.
Theurl, I., Fritsche, G., Ludwiczek, S., Garimorth, K., Bellmann-Weiler, R. & Weiss,
G.N. (2005) 'The Macrophage: A Cellular Factory at the Interphase Between
Iron and Immunity for the Control of Infections', BioMetals, 18(4): 359-67.
Todd, J, A., Farrall & M (1996) 'Panning for gold: genome-wide scanning for linkage in
type 1 diabetes', Human Molecular Genetics, 5 Spec No:1443-8.
Trinklein, N.D., Aldred, S.F., Hartman, S.J., Schroeder, D.I., Otillar, R.P. & Myers,
R.M. (2004) 'An Abundance of Bidirectional Promoters in the Human Genome',
Genome Research, 14(1): 62-6.
Tsuchiya, S., Kobayashi, Y., Goto, Y., Okumura, H., Nakae, S., Konno, T. & Tada, K.
(1982) 'Induction of maturation in cultured human monocytic leukemia cells by
a phorbol diester', Cancer Research, 42(4): 1530-6.
Tsuchiya, S., Yamabe, M., Yamaguchi, Y., Kobayashi, Y., Konno, T. & Tada, K.
(1980) 'Establishment and characterization of a human acute monocytic
leukaemia cell line (THP-1)', International Journal of Cancer, 26(2): 171-6.
356
Tsujimura, H., Nagamura-Inoue, T., Tamura, T. & Ozato, K. (2002) 'IFN consensus
sequence binding protein/interferon regulatory factor-8 guides bone marrow
progenitor cells toward the macrophage lineage', The Journal of Immunology,
169(3): 1261-9.
Turcotte, K., Gauthier, S., Malo, D., Tam, M., Stevenson, M.M. & Gros, P. (2007)
'Icsbp1/IRF-8 Is Required for Innate and Adaptive Immune Responses against
Intracellular Pathogens', Journal of Immunology, 179(4): 2467-76.
Turcotte, K., Gauthier, S., Tuite, A., Mullick, A., Malo, D. & Gros, P. (2005) 'A
mutation in the Icsbp1 gene causes susceptibility to infection and a chronic
myeloid leukemia-like syndrome in BXH-2 mice', The Journal of Experimental
Medicine, 201(6): 881-90.
Usheva, A. & Shenk, T. (1996) 'YY1 transcriptional initiator: Protein interactions and
association with a DNA site containing unpaired strands', Proceedings of the
National Academy of Sciences of the United States of America, 93(24): 13571-6.
Valberg, L.S., Flanagan, P.R., Kertesz, A. & Ebers, G.C. (1989) 'Abnormalities in iron
metabolism in multiple sclerosis', The Canadian Journal of Neurological
Sciences, 16(2): 184-6.
Vaughn, C.P. & Elenitoba-Johnson, K.S.J. (2004) 'High-Resolution Melting Analysis
for Detection of Internal Tandem Duplications', The Journal of Molecular
Diagnostics, 6(3): 211-6.
Vejbaesya, S., Chierakul, N., Luangtrakool, P. & Sermduangprateep, C. (2007a)
'NRAMP1 and TNF-alpha polymorphisms and susceptibility to tuberculosis in
Thais', Respirology, 12(2): 202-6.
Vejbaesya, S., Mahaisavariya, P., Luangtrakool, P. & Sermduangprateep, C. (2007b)
'TNF alpha and NRAMP1 polymorphisms in leprosy', Journal of the Medical
Association of Thailand, 90(6): 1188-92.
Velez, D.R., Hulme, W.F., Myers, J.L., Stryjewski, M.E., Abbate, E., Estevan, R.,
Patillo, S.G., Gilbert, J.R., Hamilton, C.D. & Scott, W.K. (2009) 'Association of
SLC11A1 with tuberculosis and interactions with NOS2A and TLR2 in AfricanAmericans and Caucasians', The International Journal of Tuberculosis and Lung
Disease, 13(9): 1068-76.
Vidal, S., Tremblay, M.L., Govoni, G., Gauthier, S., Sebastiani, G., Malo, D., Skamene,
E., Olivier, M., Jothy, S. & Gros, P. (1995) 'The Ity/Lsh/Bcg locus: natural
resistance to infection with intracellular parasites is abrogated by disruption of
the Nramp1 gene', The Journal of Experimental Medicine, 182(3): 655-66.
Vidal, S.M., Malo, D., Vogan, K., Skamene, E. & Gros, P. (1993) 'Natural resistance to
infection with intracellular parasites: Isolation of a candidate for Bcg', Cell,
73(3): 469-85.
Vidal, S.M., Pinner, E., Lepage, P., Gauthier, S. & Gros, P. (1996) 'Natural resistance to
intracellular infections: Nramp1 encodes a membrane phosphoglycoprotein
absent in macrophages from susceptible (Nramp1 D169) mouse strains', Journal
of Immunology, 157(8): 3559-68.
Vuyyuri, S.B., Ishaq, M., Kuppala, D., Grover, P. & Ahuja, Y.R. (2006) 'Evaluation of
micronucleus frequencies and DNA damage in glass workers exposed to
arsenic', Environmental and Molecular Mutagenesis, 47(7): 562-70.
Wang, A.H., Quigley, G.J., Kolpak, F.J., Crawford, J.L., van Boom, J.H., van der
Marel, G. & Rich, A. (1979) 'Molecular structure of a left-handed double helical
DNA fragment at atomic resolution', Nature, 282(5740): 680-6.
357
Weber, J., Werre, J.M., Julius, H.W. & Marx, J.J. (1988) 'Decreased iron absorption in
patients with active rheumatoid arthritis, with and without iron deficiency',
Annals of the Rheumatic Diseases, 47(5): 404-9.
Wei, W., Pelechano, V., Järvelin, A.I. & Steinmetz, L.M. (2011) 'Functional
consequences of bidirectional promoters', Trends in Genetics, 27(7): 267-76.
White, H. & Potts, G. (2006) Mutation scanning by high resolution melt curve analysis.
Evaluation of Rotor-Gene 6000 (Corbett Life Science), HR-1 and 384 well
LightScanner (Idaho Technology). National Genetics Reference Laboratory
(Wessex). http://www.ngrl.org.uk/wessex/downloads_reports.htm.
White, J.K., Shaw, M.A., Barton, C.H., Cerretti, D.P., Williams, H., Mock, B.A., Carter,
N.P., Peacock, C.S. & Blackwell, J.M. (1994) 'Genetic and Physical Mapping of
2q35 in the Region of the NRAMP and IL8R Genes: Identification of a
Polymorphic Repeat in Exon 2 of NRAMP', Genomics, 24(2): 295-302.
White, J.K., Stewart, A., Popoff, J.-F., Wilson, S. & Blackwell, J.M. (2004) 'Incomplete
glycosylation and defective intracellular targeting of mutant solute carrier family
11 member 1 (Slc11a1)', Biochemical Journal, 382(3): 811-9.
Wicker, L.S., Chamberlain, G., Hunter, K., Rainbow, D., Howlett, S., Tiffen, P., Clark,
J., Gonzalez-Munoz, A., Cumiskey, A.M., Rosa, R.L., Howson, J.M., Smink,
L.J., Kingsnorth, A., Lyons, P.A., Gregory, S., Rogers, J., Todd, J.A. &
Peterson, L.B. (2004) 'Fine mapping, gene content, comparative sequencing, and
expression analyses support Ctla4 and Nramp1 as candidates for Idd5.1 and
Idd5.2 in the nonobese diabetic mouse', Journal of Immunology, 173(1): 164-73.
Wierstra, I. (2008) 'Sp1: Emerging roles--Beyond constitutive activation of TATA-less
housekeeping genes', Biochemical and Biophysical Research Communications,
372(1): 1-13.
Wittwer, C.T., Herrmann, M.G., Moss, A.A. & Rasmussen, R.P. (1997) 'Continuous
fluorescence monitoring of rapid cycle DNA amplification', Biotechniques,
22(1): 130-8.
Wittwer, C.T., Reed, G.H., Gundry, C.N., Vandersteen, J.G. & Pryor, R.J. (2003) 'Highresolution genotyping by amplicon melting analysis using LCGreen', Clinical
Chemistry, 49(6): 853-60.
Wojciechowski, W., Desanctis, J., Skamene, E. & Radzioch, D. (1999) 'Attenuation of
MHC Class II Expression in Macrophages Infected with Mycobacterium bovis
Bacillus Calmette-Guerin Involves Class II Transactivator and Depends on the
Nramp1 Gene', The Journal of Immunology, 163(5): 2688-96.
Wu, C., Orozco, C., Boyer, J., Leglise, M., Goodale, J., Batalov, S., Hodge, C., Haase,
J., Janes, J., Huss, J. & Su, A. (2009) 'BioGPS: an extensible and customizable
portal for querying and organizing gene annotation resources', Genome Biology,
10(11): R130.
Wyllie, S., Seu, P. & Goss, J.A. (2002) 'The natural resistance-associated macrophage
protein 1 Slc11a1 (formerly Nramp1) and iron metabolism in macrophages',
Microbes and Infection, 4(3): 351-9.
Xu, Y. & Uberbacher, E.C. (1997) 'Automated gene identification in large-scale
genomic sequences', Journal of Computational Biology, 4(3): 325-38.
Xu, Y.Z., Thuraisingam, T., Marino, R. & Radzioch, D. (2011) 'Recruitment of
SWI/SNF complex is required for transcriptional activation of SLC11A1 gene
during macrophage differentiation of HL-60 cells', Journal of Biological
Chemistry, 286(15): 12839-49.
358
Xu, Y.Z., Thuraisingam, T., Morais, D.A.D.L., Rola-Pleszczynski, M. & Radzioch, D.
(2010) 'Nuclear translocation of β-actin is involved in transcriptional regulation
during macrophage differentiation of HL-60 cells', Molecular Biology of the
Cell, 21(5): 811-20.
Xu, Z., Wei, W., Gagneur, J., Perocchi, F., Clauder-Munster, S., Camblong, J., Guffanti,
E., Stutz, F., Huber, W. & Steinmetz, L.M. (2009) 'Bidirectional promoters
generate pervasive transcription in yeast', Nature, 457(7232): 1033-7.
Yang, C.H., Hsieh, L.L., Tsai, C.W., Chiou, F.S., Chou, S.L., Hsu, B.D. & Pai, C.Y.
(2003) 'Evaluation of the DNA stability of forensic markers used in betel-quid
chewers' oral swab samples and oral cancerous specimens: implications for
forensic application', Journal of Forensic Sciences, 48(1): 88-92.
Yang, J.H., Downes, K., Howson, J.M., Nutland, S., Stevens, H.E., Walker, N.M. &
Todd, J.A. (unpublished) 'Evidence of association with type 1 diabetes in the
SLC11A1 gene region', BMC Medical Genetics.
Yang, Y., Kim, S., Kim, J. & Koh, E. (2000a) 'NRAMP1 gene polymorphisms in
patients with rheumatoid arthritis in Koreans', Journal of Korean Medical
Science, 15(1): 83-7.
Yang, Z., Wara-Aswapati, N., Chen, C., Tsukada, J. & Auron, P.E. (2000b) 'NF-IL6
(C/EBPβ) vigorously activates il1b gene expression via a Spi-1 (PU.1) proteinprotein tether', The Journal of Biological Chemistry, 275(28): 21272-7.
Yen, J.H., Lin, C.H., Tsai, W.C., Ou, T.T., Wu, C.C., Hu, C.J. & Liu, H.W. (2006)
'Natural resistance-associated macrophage protein 1 gene polymorphisms in
rheumatoid arthritis', Immunology Letters, 102(1): 91-7.
Yeung, Y., Phillips, E., Mann, D.A. & Barton, C.H. (2004) 'Oxidant regulation of the
bivalent cation transporter Nramp1', Biochemical Society Transactions, 32(6):
1008-10.
Yip, S.P., Leung, K.H. & Lin, C.K. (2003) 'Extent and distribution of linkage
disequilibrium around the SLC11A1 locus', Genes and Immunity, 4(3): 212-21.
Zaahl, M.G., Robson, K.J.H., Warnich, L. & Kotze, M.J. (2004) 'Expression of the
SLC11A1 (NRAMP1) 5 '-(GT)(n) repeat: Opposite effect in the presence of237C → T', Blood Cells Molecules and Diseases, 33(1): 45-50.
Zaahl, M.G., Warnich, L., Victor, T.C. & Kotze, M.J. (2005) 'Association of functional
polymorphisms of SLC11A1 with risk of esophageal cancer in the South African
Colored population', Cancer Genetics and Cytogenetics, 159(1): 48-52.
Zaahl, M.G., Winter, T.A., Warnich, L. & Kotze, M.J. (2006) 'The 237C!T promoter
polymorphism of the SLC11A1 gene is associated with a protective effect in
relation to inflammatory bowel disease in the South African population',
International Journal of Colorectal Disease, 21(5): 402-8.
Zenzie-Gregory, B., O'Shea-Greenfield, A. & Smale, S.T. (1992) 'Similar mechanisms
for transcription initiation mediated through a TATA box or an initiator
element', The Journal of Biological Chemistry, 267(4): 2823-30.
Zhang, D.E., Hetherington, C.J., Tan, S., Dziennis, S.E., Gonzalex, D.A., Chen, H.M. &
Tenen, D.G. (1994) 'Sp1 is a critical factor for the monocytic expression of
human CD14', The Journal of Biological Chemistry, 269(15): 11425-34.
Zhang, W., Shao, L., Weng, X., Hu, Z., Jin, A., Chen, S., Pang, M. & Chen, Z.W.
(2005) 'Variants of the natural resistance-associated macrophage protein 1 gene
(NRAMP1) are associated with severe forms of pulmonary tuberculosis',
Clinical Infectious Diseases, 40(9): 1232-6.
359
Zhao, Y., Wang, S., Aunan, K., Martin Seip, H. & Hao, J. (2006) 'Air pollution and lung
cancer risks in China - a meta-analysis', Science of The Total Environment,
366(2-3): 500-13.
Zhou, L., Wang, L., Palais, R., Pryor, R. & Wittwer, C.T. (2005) 'High-resolution DNA
melting analysis for simultaneous mutation scanning and genotyping in
solution', Clinical Chemistry, 51(10): 1770-7.
Zlokarnik, G., Negulescu, P.A., Knapp, T.E., Mere, L., Burres, N., Feng, L., Whitney,
M., Roemer, K. & Tsien, R.Y. (1998) 'Quantitation of Transcription and Clonal
Selection of Single Living Cells with β-Lactamase as Reporter', Science,
279(5347): 84-8.
Zwilling, B.S., Vespa, L. & Massie, M. (1987) 'Regulation of I-A expression by murine
peritoneal macrophages: differences linked to the Bcg gene', Journal of
Immunology, 138(5): 1372-6.
Zwilling, S., Annweiler, A. & Wirth, T. (1994) 'The POU domains of the Oct1 and Oct2
transcription factors mediate specific interaction with TBP', Nucleic Acids
Research, 22(9): 1655-62.


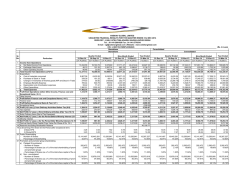
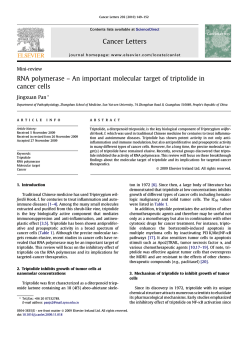
© Copyright 2026