
Antiplasmin–Based Contrast Agent
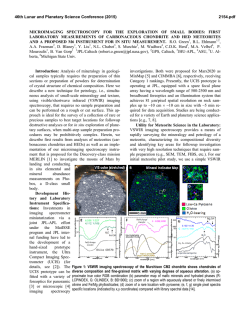
JACC: CARDIOVASCULAR IMAGING © 2009 BY THE AMERICAN COLLEGE OF CARDIOLOGY FOUNDATION PUBLISHED BY ELSEVIER INC. VOL. 2, NO. 8, 2009 ISSN 1936-878X/09/$36.00 DOI:10.1016/j.jcmg.2009.03.015 Molecular MRI of Early Thrombus Formation Using a Bimodal ␣2-Antiplasmin–Based Contrast Agent Robbert-Jan J. H. M. Miserus, MSC,*† M. Veronica Herı´as, PHD,‡ Lenneke Prinzen, MSC,†§ Marc B. I. Lobbes, MD,* Robert-Jan Van Suylen, MD, PHD‡ Anouk Dirksen, PHD,†储 Tilman M. Hackeng, PHD,†储 Johan W. M. Heemskerk, PHD,†储 Jos M. A. van Engelshoven, MD, PHD,*† Mat J. A. P. Daemen, MD, PHD,†‡ Marc A. M. J. van Zandvoort, PHD,†§ Sylvia Heeneman, PHD,†‡ Marianne Eline Kooi, PHD*† Maastricht, the Netherlands O B J E C T I V E S We aimed to investigate whether early thrombus formation can be visualized with in vivo magnetic resonance imaging (MRI) by the use of a novel bimodal ␣2-antiplasmin– based contrast agent (CA). B A C K G R O U N D Thrombus formation plays a central role in several vascular diseases. During the early phases of thrombus formation, activated factor XIII (FXIIIa) covalently cross-links ␣2-antiplasmin to fibrin, indicating the potential of ␣2-antiplasmin– based CAs in the detection of early thrombus formation. M E T H O D S A bimodal CA was synthesized by coupling gadolinium-diethylene triamine pentaacetic acid and rhodamine to an ␣2-antiplasmin– based peptide. For the control CA, a glutamine residue essential for cross-linking was replaced by alanine. In vitro-generated thrombi were exposed to both CAs and imaged by MRI and 2-photon laser-scanning microscopy. Immunohistochemistry was performed on human pulmonary thromboemboli sections to determine the presence of ␣2-antiplasmin and FXIII in different thrombus remodeling phases. In vivo feasibility of the CA in detecting early thrombus formation specifically was investigated with MRI. R E S U L T S In vitro– generated thrombi exposed to the ␣2-antiplasmin– based CA showed hyperintense magnetic resonance signal intensities at the thrombus edge. No hyperintense signal was observed when we used the ␣2-antiplasmin– based CA in the presence of FXIII inhibitor dansylcadaverine nor when we used the control CA. Two-photon laser-scanning microscopy demonstrated that the ␣2-antiplasmin– based CA bound to fibrin. Immunohistochemistry demonstrated substantial ␣2-antiplasmin staining in fresh compared with lytic and organized thrombi. The administration of CA in vivo within seconds after inducing thrombus formation increased contrast-to-noise ratios (CNRs 2.28 ⫾ 0.39, n⫽6) at the site of thrombus formation compared with the control CA (CNRs ⫺0.14 ⫾ 0.55, p ⫽ 0.003, n ⫽ 6) and ␣2-antiplasmin– based CA administration 24 to 48 h after thrombus formation (CNRs 0.11 ⫾ 0.23, p ⫽ 0.006, n ⫽ 6). C O N C L U S I O N S A bimodal CA was developed, characterized, and validated. Our results showed that this bimodal CA enabled noninvasive in vivo magnetic resonance visualization of early thrombus formation. (J Am Coll Cardiol Img 2009;2:987–96) © 2009 by the American College of Cardiology Foundation From the *Department of Radiology, †Cardiovascular Research Institute Maastricht (CARIM); ‡Department of Pathology, §Department of Biomedical Engineering; and the 储Department of Biochemistry, Maastricht University Medical Centre, Maastricht, the Netherlands. This study was financially supported by the “Besluit Subsidies Investeringen Kennisinfrastructuur” Downloaded From: http://imaging.onlinejacc.org/ on 02/06/2015 988 Miserus et al. Molecular MRI of Early Thrombus Formation T hrombotic complications such as myocardial infarction, stroke, deep venous thrombosis, and pulmonary thromboembolism are major causes of morbidity and mortality (1,2). The resistance of thrombi to fibrinolytic therapy increases with the age of the thrombus (3), and fibrinolytic agents can induce severe complications such as bleeding (4,5). It is therefore necessary to accurately diagnose early thrombus formation because it may improve the selection of patients that will benefit from fibrinolytic therapy. Currently, the noninvasive detection of early thrombus formation is a major problem in clinical practice. Several specific contrast agents (CAs) have been ABBREVIATIONS developed to visualize thrombi by the use AND ACRONYMS of molecular imaging techniques (6 – 8). Fibrin has frequently been used as a target ␣2-AP ⴝ ␣2-antiplasmin for in vivo thrombus visualization with Bi-␣2AP-CA ⴝ specific bimodal various magnetic resonance imaging (MRI) ␣2-antiplasmin– based contrast agent CAs, such as fibrin-targeted perfluorocarBi-con-CA ⴝ bimodal control bon nanoparticles (9) and fibrin-specific contrast agent peptide-based CAs (10 –17). Recently, CA ⴝ contrast agent initial results of a human study in which CNR ⴝ contrast-to-noise ratio the authors used a fibrin-specific peptideDTPA ⴝ diethylene triamine based CA (EP-2104R) were published, pentaacetic acid suggesting selective molecular MRI of FXIIIa ⴝ activated factor XIII thrombi (18). Nonetheless, these CAs MALDI-MS ⴝ matrix-assisted have low sensitivity for the estimation of laser desorption/ionization mass thrombus age. spectrometry In this study, we searched for other MRI ⴝ magnetic resonance coagulation factors that could be used as imaging targets for thrombus imaging. We focused NSA ⴝ number of signal averages on activated factor XIII (FXIIIa) because it cross-links fibrin chains and covalently PBS ⴝ phosphate-buffered saline cross-links ␣2-antiplasmin (␣2-AP) to fiTE ⴝ echo time brin (19). In this latter process, the gluTI ⴝ inversion time tamine (Gln2) substrate in the N-terminal TPLSM ⴝ 2-photon laserdomain of ␣2-AP is the primary substrate scanning microscopy site for FXIIIa (20). Robinson et al. (21) TR ⴝ repetition time have shown that the catalytic ability of FXIIIa in cross-linking ␣2-AP into formed thrombi declines with a short half-life. Therefore, an ␣2-AP– based CA might enable specific visualization of early thrombus formation. Recently, a near-infrared fluorescent (NIRF) probe (A15) and a MRI CA (A14), both based on ␣2-AP, enabled the visualization of in vitro–formed JACC: CARDIOVASCULAR IMAGING, VOL. 2, NO. 8, 2009 AUGUST 2009:987–96 thrombi with the use of NIRF and ex vivo MRI (22). Subsequently, in vivo detection of FXIII activity was achieved by intravital fluorescence microscopy using the A15 probe (23,24). However, translation of this probe to human studies in the near future is unlikely because of the limited penetration depth of NIRF microscopy. Noninvasive thrombus visualization with the use of imaging modalities such as MRI may overcome this limitation. In the present study, we analyzed the presence of FXIII and ␣2-AP in fresh, lytic, and organized human pulmonary thromboemboli by the use of immunohistochemistry. Subsequently, we investigated whether early thrombus formation can be visualized in vitro and in vivo with MRI by using a bimodal ␣2-AP– based CA. Additionally, TPLSM was used to investigate whether the ␣2-AP– based CA co-localizes with the fibrin polymers. MATERIALS AND METHODS Synthesis of the CAs. An ␣2-AP– based peptide sequence (GNQEQVSPLTLL) that binds covalently to fibrin (21,23) was synthesized by the use of tertbutyloxycarbonyl solid-phase peptide synthesis (25). The peptide was bimodally labeled with rhodamine and a diethylene triamine pentaacetic acid (DTPA)-chelate (specific bimodal ␣2-antiplasmin– based contrast agent [Bi-␣2AP-CA]) by crosslinking maleimide-DTPA (26) and succinimidylrhodamine (Invitrogen, Molecular Probes, Breda, the Netherlands) to an additional C-terminal KW dipeptide branched at the lysine -amino group with a cysteine. A control CA (Bi-con-CA) was obtained by replacing a glutamine residue essential for cross-linking by alanine (Q3¡A3) to prevent binding to fibrin (Fig. 1). Bi-␣2AP-CA and Bi-con-CA were characterized by matrix-assisted laser desorption/ionization mass spectrometry (MALDI-MS). Gadolinium chloride was added in a 0.9:1 molar ratio, after which no MALDI spectrum was observed because of poor ionization. Contrast agent validation. For r1 relaxivity measurements, the gadolinium-labeled peptides were dissolved (concentrations ranging from 25 to 150 mol/l) in phosphate-buffered saline solution (PBS). Solutions were imaged at room temperature (BSIK) program entitled Molecular Imaging of Ischemic Heart Disease (project number BSIK03033) and by the Dutch Heart Foundation, grant number 2002.B033. Drs. Daemen and Heeneman are members of the European Vascular Genomics Network (grant LSHM-CT-2003-503254). Drs. Herı´as and Prinzen contributed equally to this article. Manuscript received August 21, 2008; revised manuscript received March 11, 2009, accepted March 25, 2009. Downloaded From: http://imaging.onlinejacc.org/ on 02/06/2015 Miserus et al. Molecular MRI of Early Thrombus Formation JACC: CARDIOVASCULAR IMAGING, VOL. 2, NO. 8, 2009 AUGUST 2009:987–96 Figure 1. Structure of the Bimodal ␣2-Antiplasmin–Based Contrast Agent Schematic representation of the ␣2-AP– based peptide that is bimodally labeled with rhodamine and a diethylene triamine pentaacetic acid-chelate (Bi-␣2AP-CA) and the corresponding mass spectra. Matrix-assisted laser desorption/ionization mass spectrometry shows a molecular mass of 2,832.92 g/mol for the Bi-␣2AP-CA. Substitution of only one amino acid (Q3¡A3) results in a bimodal control CA (Bi-con-CA). with a 1.5-T MR scanner (MR Intera, Philips Healthcare, Best, the Netherlands) with the use of a commercially available head coil and a 7.0-T Bruker Biospec scanner (Bruker Biospin GmbH, Ettlingen, Germany) by the use of a 154-mm diameter quadrature transmit-receive radio-frequency coil. T1 relaxation times were obtained by the use of inversion recovery sequences with different inversion times (TI), ranging from 50 to 5,000 ms. Additional parameters were as follows: repetition time (TR), 7,500 ms; echo time (TE), 14 ms (1.5-T) or 8.4 ms (7.0-T); slice thickness, 3 mm; number of signal averages (NSA), 1; and in-plane resolution, 0.55 ⫻ 0.55 mm. Gadolinium content was determined by the use of inductively coupled plasma mass spectrometry. The effect of Bi␣2AP-CA on thrombus formation was determined with a thrombin generation assay using platelet poor plasma with different concentrations (0, 10, 20, and 40 mol/l) of Bi-␣2AP-CA. In vitro thrombus imaging. Human blood was obtained by venous puncture from a healthy volunteer and collected in vacutainer tubes containing trisodium citrate (BD Vacutainer Systems, Preanalytical solutions, Plymouth, United Kingdom). Murine blood was obtained by right ventricle puncture. Human and murine thrombi were allowed to form during 90 min at 37°C in the presence of 30 l of Downloaded From: http://imaging.onlinejacc.org/ on 02/06/2015 1.5 mg/ml Oregon Green 488-labeled fibrinogen (Invitrogen, Molecular Probes, Breda, the Netherlands). Thereafter, thrombi were incubated with 150 mol/l Bi-␣2AP-CA or Bi-con-CA for 90 min at 37°C, followed by extensive washing with PBS. To determine the effect of FXIIIa on thrombus visualization, a human thrombus was formed and exposed to Bi-␣2AP-CA in the presence of dansylcadaverine (final concentration 2 mmol/l; Fluka Chemie AG, Buchs, Switzerland) because dansylcadaverine is a competitive substrate for transglutaminases such as FXIII (27). Visualization with TPLSM was performed as previously described (28). In brief, a BioRad 2100MP (Hemel Hampstead, United Kingdom) was used in TPLSM mode. Fluorescence was detected by 3 photomultipliers. Filter settings were as follows: 420 to 470 nm (blue), 510 to 540 nm (green, fibrin network), and 570 to 590 nm (red, rhodamine detection of the CAs). After TPLSM and approximately 4 h after CA incubation, thrombi were embedded in 2% agarose gel and imaged at 1.5-T by the use of a commercially available 47-mm diameter surface coil (Philips Healthcare, Best, the Netherlands). Images were acquired with a T1-weighted inversion recovery turbo spin echo sequence with the following scanparameters: TR/TE/TI, 1,580/13/546 ms; echo 989 990 Miserus et al. Molecular MRI of Early Thrombus Formation train length, 6; NSA, 16; slice thickness, 1.5 mm; field of view, 40 ⫻ 40 mm; and matrix size, 192 ⫻ 192. Thrombus age classification. To assess whether FXIII and ␣2-AP can be seen as markers for early thrombus formation, tissue sections with pulmonary thromboemboli were evaluated by immunohistochemistry. Twenty-two paraffin-embedded blocks (15 from 8 autopsy patients and 7 from 3 lung biopsy tissues) containing pulmonary thromboemboli were used to analyze FXIII and ␣2-AP presence. All tissues were obtained from the Maastricht Pathology Tissue Collection. Collection, storage, and use of tissue and patient data were performed in agreement with the “Code for Proper Secondary Use of Human Tissue in the Netherlands.” Immunohistochemistry was performed with conventional methods. In brief, mouse monoclonal antihuman FXIII alpha subunit (1:300; clone AC1A1, Lab Vision, Fremont, California), rabbitantihuman ␣2-AP polyclonal (1:200; BiogenesisMorphoSys AG, Martinsried/Munich, Germany), and mouse monoclonal antihuman fibrin II beta chain (1:100; clone T2G1, Accurate Chemical, Westbury, New York) were used as primary antibodies. For the negative controls, no primary antibody was used. Visualization was achieved with vectastain red (alkaline phosphatase substrate kit I, Vector Laboratories, Burlingame, California). Thrombi were classified into fresh (⬍1 day; layered patterns of platelets, fibrin, erythrocytes, and intact granulocytes), lytic (1 to 5 days; areas of colliquation necrosis and karyorrhexis of granulocytes), organizing thrombi (⬎5 days; ingrowth of smooth muscle cells with or without deposition of connective tissue and capillary vessel ingrowth), or in thrombi containing more than one of these age classifications (29). Percentages of thrombi positive for FXIII, ␣2-AP, and fibrin staining were determined for the various thrombus age classifications. The degree of staining was scored for each thrombus age classification separately in no staining (score 0), slightly stained (score 1), moderately stained (score 2), and strongly stained (score 3) (by V.H., intraobserver variability ⬍10%). Clearance and biodistribution. All animal experiments were approved by the local ethical review committee. Mice were anesthetized by inhalation of air with 2% isoflurane inhalation gas. Half-life of Bi-␣2AP-CA (n ⫽ 3) and Bi-con-CA (n ⫽ 3) was determined by collecting blood samples before and at different time-points (1, 10, 15, 30, 60, and 90 min) after contrast administration (dose 5.0 Downloaded From: http://imaging.onlinejacc.org/ on 02/06/2015 JACC: CARDIOVASCULAR IMAGING, VOL. 2, NO. 8, 2009 AUGUST 2009:987–96 mol/kg body weight). With the use of TPLSM, mean fluorescence of the red channel was determined in all blood samples. Exponential fitting was used for half-life determination (GraphPad Prism 4.0, La Jolla, California). After blood collection, mice were sacrificed by an excess of pentobarbital. We determined the biodistribution of both CAs with TPLSM by studying CA uptake in excised liver, spleen, kidney, heart, lung, and intestine. Filter settings were as follows: ⱕ500 nm (blue), 500 to 560 nm (green) and 560 to 610 nm (red, rhodamine detection of the CAs). In vivo thrombus imaging. The right carotid artery was exposed by separating the sternocleidomastoid muscle from the trachea. Thrombus formation was induced by applying a strip of filter paper soaked in 10% ferric chloride (FeCl3) on the carotid artery. After 5 min, the filter paper was removed, and the carotid artery was washed with PBS. Within seconds after FeCl3-induced thrombus formation, 5.0 mol/kg body weight Bi-␣2AP-CA (n ⫽ 6) or Bi-con-CA (n ⫽ 6) was administered intravenously. In 6 other mice, Bi-␣2AP-CA was administered 24 to 48 h after FeCl3-induced thrombus formation. MRI was performed at 7.0-T by the use of a 35-mm diameter quadrature transmit-receive radiofrequency coil (Bruker Biospin GmbH, Ettlingen, Germany). After scout scans, sagittal carotid MR images were obtained approximately 90 min after CA administration by the use of a rapid acquisition with relaxation enhancement inversion recovery pulse sequence. Parameters were as follows: TR/TE/TI, 7,500/8.9/1,654 ms; 21 to 25 slices; slice thickness, 0.25 mm; interslice distance, 0.3 to 0.35 mm; NSA, 2; rare partitions, 4; field of view, 30 ⫻ 30 mm; matrix size, 312 ⫻ 312. Additionally, after Bi-␣2AP-CA administration within seconds after thrombus formation, repeated MR measurements were performed (50, 65, 85, 100, 115, and 130 min, n ⫽ 2). For TPLSM, carotid arteries (n ⫽ 4 for each group) were excised and mounted into a home-built perfusion chamber (IDEE BV, Maastricht, the Netherlands) and immersed in Hanks balanced salt solution while maintaining 60 to 80 mm Hg transmural pressure (28). Syto 13 (Invitrogen, Eugene, Oregon) was added (final concentration 2.5 mol/l) to visualize nucleic acids. Filter settings were as follows: 420 to 470 nm (blue), 510 to 530 nm (green, nucleic acid staining), and 560 to 610 nm (red, rhodamine detection of the CAs). Miserus et al. Molecular MRI of Early Thrombus Formation JACC: CARDIOVASCULAR IMAGING, VOL. 2, NO. 8, 2009 AUGUST 2009:987–96 Magnetic resonance contrast-to-noise ratios (CNRs) were calculated by dividing the difference between the mean MR signal intensities from a region of interest positioned in the thrombus and that in neighboring muscle tissue by the noise measured in air. Noise values were corrected for magnitude effects by the Rayleigh factor. Regions of interest were drawn in ParaVision 4.0 (Bruker Biospin GmbH, Ettlingen, Germany). Statistics. Data are presented as mean ⫾ standard error. Statistical analyses were performed on the histology scores using the Mann-Whitney U test. For in vivo measurements the one-way analysis of variance test was used. Because of Bonferroni correction for multiple group comparison, differences with a p value ⬍0.025 were considered significant. RESULTS Synthesis of the CAs. The use of MALDI-MS showed a molecular mass for Bi-␣2AP-CA of 2832.9 g/mol, in agreement with the theoretical average mass of 2893.1 g/mol without Gd3⫹ bound (Fig. 1). The Bi-con-CA with a Q3 to A mutation had a molecular mass of 2775.4 g/mol, corresponding to the theoretical average mass of 2776.1 g/mol without Gd3⫹ attached (data not shown). Contrast agent validation. The r1 relaxation times of the Bi-␣2AP-CA at 1.5- and 7.0-T were 5.6 ⫾ 0.4 mM⫺1s⫺1 and 3.0 ⫾ 0.3 mM⫺1s⫺1, respectively. The r1 relaxation times obtained for Bi-con-CA were 6.5⫾0.5 mM⫺1s⫺1 (1.5-T) and 3.3 ⫾ 0.2 mM⫺1s⫺1 (7.0-T). For all Bi-␣2AP-CA concentrations (0, 10, 20, and 40 mol/l) the endogenous thrombin potentials were comparable (708, 742, 733, and 717 nmol/l · min, respectively). Additionally, no effects of Bi-␣2AP-CA on thrombin peak heights or lag times of thrombin generation were observed. These results indicate that Bi-␣2AP-CA did not interfere with thrombin generation and subsequent thrombus formation. In vitro thrombus imaging. The use of TPLSM showed costaining of the rhodamine-labeled Bi␣2AP-CA (red) and the OG488-labeled fibrin network (green), resulting in yellow areas of colocalization, indicating binding of Bi-␣2AP-CA to fibrin in human and murine thrombi (Figs. 2B and 2H). In contrast, the control agent Bi-con-CA showed limited labeling and colocalization with the fibrin network (Figs. 2D and 2J). Hyperintense MRI signals were found at the edge of thrombi incubated with Bi-␣2AP-CA (Figs. 2A and 2G), Downloaded From: http://imaging.onlinejacc.org/ on 02/06/2015 Figure 2. In Vitro Results Results of TPLSM and MRI for human (A to F) and murine (G to J) thrombi incubated with the bimodal ␣2-AP– based contrast agent (Bi-␣2AP-CA) (A, B, E to H) and the bimodal control CA (Bi-con-CA) (C, D, I to J). For TPLSM, red color originates from the rhodamine-labeled CAs. Green color indicates the fibrin network due to use of fibrinogen–Oregon green 488. Yellow color illustrates colocalization of red and green. Hyperintense MR signals were found at the edge of thrombi incubated with Bi-␣2AP-CA (A, G). Lower MR signal intensities were found at the edge of a thrombus exposed to dansylcadaverine and Bi-␣2AP-CA (E). MRI ⫽ magnetic resonance imaging; TPLSM ⫽ 2-photon laser-scanning microscopy. 991 992 Miserus et al. Molecular MRI of Early Thrombus Formation JACC: CARDIOVASCULAR IMAGING, VOL. 2, NO. 8, 2009 AUGUST 2009:987–96 Figure 3. Immunohistochemical Stainings of Thrombi (A) Factor XIII staining. (B) ␣2-Antiplasmin staining. Positive staining is depicted in red/pink color. Factor XIII staining (scattered spots) was present throughout the whole thrombus while ␣2-antiplasmin staining was mainly depicted at the edge of the thrombus (arrows). Bars ⫽ 50 m. which were absent when Bi-con-CA was used (Figs. 2C and 2I). FXIIIa inhibition by dansylcadaverine decreased binding and co-localization of Bi-␣2AP-CA with fibrin, thereby lowering the MR signal intensity at the edge of a human thrombus exposed to Bi-␣2AP-CA (Figs. 2E and 2F). This finding confirms that FXIII presence is needed for Bi-␣2AP-CA binding to fibrin. Immunohistochemistry staining for FXIII and ␣2-AP on a human thrombus formed during 3 h showed that FXIII was present throughout the thrombus (Fig. 3A), whereas ␣2-AP was strongly expressed at the edge (Fig. 3B). This finding is in line with the increased MR signal intensities at the edge of thrombi exposed to Bi-␣2AP-CA. Thrombus age classification. We evaluated 44 thrombi for FXIII, 38 for ␣2-AP, and 47 for fibrin and categorized them in fresh, lytic, or organized. High percentages of positive fibrin staining were found in all categories, whereas positive ␣2-AP and FXIII staining was mainly present in fresh thrombi followed by lytic and organized thrombi. Additionally, mean ␣2-AP score was significantly greater in fresh thrombi compared with lytic and organized thrombi, and mean FXIII score was significantly greater in fresh compared with organized thrombi while no significant difference was found between fresh and lytic thrombi. Mean fibrin score was relatively high in all thrombus age classifications (Table 1). Additionally, FXIII was expressed in inflammatory cells (mainly macrophages), representing the cellular component of FXIII. A typical example of a thrombus containing fresh and organized components is shown in Figure 4. Clearance and biodistribution. Both CAs were rapidly cleared from the blood. Circulation half-lives of Bi-␣2AP-CA and Bi-con-CA were 14.1 ⫾ 8.4 min and 16.3 ⫾ 4.0 min, respectively. The use of TPLSM on excised organs showed that both CAs were mainly cleared through the kidneys, whereas limited CA was found in other organs (Fig. 5), indicating that there is no or limited accumulation of the CAs on organ level. In vivo thrombus imaging. Clear hyperintense signals from early thrombus formation were observed with in vivo MRI (CNR 2.29 ⫾ 0.39) when Bi-␣2AP-CA was administered immediately after FeCl3-induced thrombus formation. No hyperintense MR signals were found when the control agent (Bi-con-CA) was used for fresh thrombus visualization (CNR ⫺0.14 ⫾ 0.55, p ⫽ 0.003) nor when Bi-␣2AP-CA was used for the visualization of 24- to 48-h– old thrombi (CNR 0.11 ⫾ 0.23, Table 1. Percentages and Scores of ␣2-Antiplasmin, Factor XIII, and Fibrin Stainings in Lung Emboli Tissue Sections ␣2-Antiplasmin Thrombus Age Positive Staining (%) Factor XIII Mean Score ⴞ SE Fresh (⬍1 day) 95 1.4 ⫾ 0.1 Lytic (1–5 days) 29 0.3 ⫾ 0.2 Organized (⬎5 days) 20 0.2 ⫾ 0.1 *Significantly different. SE ⫽ standard error. Downloaded From: http://imaging.onlinejacc.org/ on 02/06/2015 * * Positive Staining (%) Mean Score ⴞ SE 92 1.5 ⫾ 0.1 75 31 Fibrin Positive Staining (%) Mean Score ⴞ SE 100 2.1 ⫾ 0.1 0.8 ⫾ 0.3 * 83 2.0 ⫾ 0.4 0.3 ⫾ 0.1 92 1.9 ⫾ 0.2 Miserus et al. Molecular MRI of Early Thrombus Formation JACC: CARDIOVASCULAR IMAGING, VOL. 2, NO. 8, 2009 AUGUST 2009:987–96 Figure 4. Pulmonary Thromboemboli Sections Middle panels demonstrate an overview of thromboemboli, from top to bottom: hematoxylin and eosin stained, immunohistochemically stained for fibrin, factor XIII, and ␣2-antiplasmin. Bars ⫽ 300 m. Left panels show enlargements of boxed areas indicating an organized part of the thrombo-emboli. In the enlarged FXIII stained area clear cellular FXIII staining is visable. Bars ⫽ 50 m. Right panels show enlargements of boxed areas indicating a fresh segment (arrows). Bars ⫽ 50 m. p ⫽ 0.006) (Figs. 6A to 6D). Additionally, CNR ratios as a function of time after Bi-␣2AP-CA administration (50, 65, 85, 100, 115, and 130 min) were comparable (2.65 ⫾ 0.11, 2.43 ⫾ 0.06, 2.51 ⫾ 0.15, 2.43 ⫾ 0.37, 2.24 ⫾ 0.21, and 2.01 ⫾ 0.44, respectively). The use of TPLSM on excised carotid arteries confirmed Bi-␣2AP-CA presence in the thrombi formed in the lumen of the FeCl3-treated artery when Bi-␣2AP-CA was administered within seconds after thrombus formation (Fig. 6E). Limited fluorescence was found by the use of Bi-con-CA (Fig. 6F) or when Bi-␣2AP-CA was administered 24 to 48 h after FeCl3-induced thrombus formation (Fig. 6G). Occasionally, fluorescence was found in the medial layer (predominantly smooth muscle cells) of vessels that were treated with FeCl3 24 to 48 h before imaging. No fluorescence was detected Downloaded From: http://imaging.onlinejacc.org/ on 02/06/2015 in the nontreated contralateral carotid arteries. Histology confirmed presence of thrombi in all FeCl3treated carotid arteries. DISCUSSION Because ␣2-AP covalently cross-links to fibrin during the early phases of thrombus formation, ␣2AP– based CAs might enable the noninvasive detection of early thrombus formation. We demonstrated that the ␣2-AP– based CA enabled MRI and TPLSM of in vitro– generated thrombi and that FXIII presence is required for binding of the ␣2-AP– based CA to fibrin. Additionally, we showed that ␣2-AP and FXIII are predominantly present in fresh compared with lytic and organized human pulmonary thromboemboli, indicating the potential of ␣2-AP– based CAs in detecting early 993 994 Miserus et al. Molecular MRI of Early Thrombus Formation JACC: CARDIOVASCULAR IMAGING, VOL. 2, NO. 8, 2009 AUGUST 2009:987–96 Figure 5. Clearance and Kidney Uptake of the Bi-␣2AP-CA and Bi-con-CA Relative fluorescence measured in blood samples decreases with time after contrast administration (A). Half-lives of the CAs are 14.1 ⫾ 8.4 min and 16.3 ⫾ 4.0 min for Bi-␣2AP-CA and Bi-con-CA respectively. CAs are mainly cleared through the kidney (B and C). In B and C, red indicates bimodal CA in kidney tubuli. CA ⫽ constrast agent. thrombus formation. Subsequently, we demonstrated that the ␣2-AP– based CA enabled the in vivo visualization of early thrombus formation with MRI. The use of TPLSM confirmed specific binding of the ␣2-AP– based CA to fibrin. Previously, ␣2-AP– based peptides labeled with either Alexa680 (A15) or gadolinium (A14) were used in vitro for visualization with NIRF microscopy and MRI. Both probes were tested for their ability to visualize murine (22) and human thrombi (23). Additionally, it was shown that ␣2-AP– based peptides bind covalently to fibrin (21,23), indicating that the Kd value approaches 0. These findings were confirmed by the present study because the addition of contrast 90 min after the initiation of thrombus formation resulted in a hyperintense MR signal at the edge of human and murine blood-derived thrombi. In previous murine studies, intravital fluorescence microscopy enabled visualization of carotid (23) and cerebral (24) thrombi by use of the A15 probe. This probe proved to be specific for the early phases of thrombus formation (23). Nevertheless, because of the limited penetration depth of NIRF microscopy it is Figure 6. In Vivo and Ex Vivo Results In vivo MRI (A to C) and ex vivo TPLSM results (E to G) of early thrombus formation and 24- to 48-h thrombi in murine carotid arteries after injection of the bimodal ␣2-antiplasmin– based CA (Bi-␣2AP-CA) (A, C, E, and G) and the bimodal control CA (Bi-con-CA) (B, F). Contrast-tonoise ratios (CNRs) are increased in the early phases of thrombus formation after Bi-␣2AP-CA administration (D). In E to G, red indicates Bimodal CA, and green indicates nuclear stain. Lumen is located between dotted lines. Blue arrows indicate leukocytes trapped in the thrombus. Elongated cells are smooth muscle cells (orange arrows) and endothelial cells (red arrow). Abbreviations as in Figures 2 and 5. Downloaded From: http://imaging.onlinejacc.org/ on 02/06/2015 Miserus et al. Molecular MRI of Early Thrombus Formation JACC: CARDIOVASCULAR IMAGING, VOL. 2, NO. 8, 2009 AUGUST 2009:987–96 unlikely that this probe can be used for human applications. Our ␣2-AP– based CA enabled in vivo visualization of early thrombus formation with noninvasive MRI. In our MRI study a greater CA dose was used compared with the NIRF studies (23,24). However, the present dose (5 mol/kg) is still low for MRI. Biological amplification due to the abundance of fibrin and r1 relaxivity increase upon binding may explain the observed signal enhancement achieved with this low dose. Other fibrin-targeted imaging studies used comparable CA concentrations (10 –18). Fibrin-targeted perfluorocarbon nanoparticles (9), EP-1242 (17), EP1873 (16), and EP-2104R (10 –15,18), have been proven in their ability to visualize thrombi in different animal models with MRI. Recently, initial results showed that EP-2104R allows in vivo MRI thrombus imaging in humans (18). Additionally, EP-2104R demonstrated a time-dependent thrombus enhancement, demonstrating a slow decrease in CNR during an 8-week time period (12). However, because increased CNRs were observed in all thrombi compared with precontrast imaging, it is unlikely that this CA could effectively discriminate between the early stages of thrombus formation and organized thrombi. In the present study, we demonstrated that the ␣2-AP– based CA significantly increased CNRs during early thrombus formation compared with 24- to 48-h– old thrombi. Therefore, our bimodal ␣2-AP– based CA is promising for the differentiation between the early phases of thrombus formation and organized thrombi. Immunohistochemistry showed presence of FXIII in pulmonary thromboemboli, but cellular FXIII staining also was observed. The cellular form of FXIII consists of a homodimer of A-subunits (19). We used a primary antibody addressed to the ␣-chain of FXIII, explaining the cellular FXIII staining. The importance of FXIII beyond its function in coagulation is still not well known. An in vivo study, in which an 111Inlabeled ␣2-AP– based CA was used to visualize FXIII activity in myocardial healing, suggested that FXIII plays a role in wound healing and tissue repair (30). Therefore, the fluorescence observed in the medial layer of some carotid arteries might be explained by tissue repair 24 to 48 h after FeCl3 treatment. AbdAlla et al. (31) suggested that intracellular FXIIIa-mediated monocyte adhesion during the atherosclerotic process. Noninvasive assessment of early thrombus formation versus organized thrombi could be of major clinical relevance because specific detection of early thrombus formation may improve selection of patients Downloaded From: http://imaging.onlinejacc.org/ on 02/06/2015 eligible for fibrinolytic therapy, thereby reducing serious side effects. Study limitations. First, there is only a limited time window during which this ␣2-AP– based CA can be used for thrombus detection. Second, whether our CA is able to detect thrombi that are sensitive to fibrinolytic therapy remains to be determined. Third, to prove its clinical usefulness, it remains to be established whether this ␣2-AP– based CA inhibits thrombolysis using state-of-the-art thrombolytics. However, this CA only contains the part that is responsible for binding of ␣2-AP, which on its own is insufficient to inhibit plasmin activity. Fourth, our CA binds covalently to fibrin, indicating that the Gd-complex stability is of major importance since free Gd3⫹-ions can induce nephrogenic systemic fibrosis. The ionic-macrocylic DOTA-chelate is more stable than the used DTPA-chelate; therefore, minor chelate adjustment will improve its stability and decrease the risk of nephrogenic systemic fibrosis. Fifth, to perform pre- and post-contrast MRI within the same mouse on the same exact position, anticoagulants are needed ensuring that the cannula placed for contrast administration will not become obstructed. Since anticoagulants interfere with thrombus formation, no pre-contrast images were obtained. However, the used control CA validated the increase in CNR of thrombi exposed to the ␣2-AP– based CA. Finally, determination of the optimal dosage is still needed. CONCLUSIONS Our bimodal ␣2-AP– based CA enabled specific, noninvasive visualization of the early phases of thrombus formation, whereas no hyperintense signal was observed in 24- to 48-h– old thrombi. Therefore, this bimodal ␣2-AP– based CA might be able to specifically select patients who are eligible for fibrinolytic therapy. Acknowledgments The authors thank Sander Langereis and Jeannette Smulders from Philips Research Eindhoven, the Netherlands, for performing the inductively coupled plasma mass spectrometry measurements. Reprint requests and correspondence: Dr. Marianne E. Kooi, Cardiovascular Research Institute Maastricht (CARIM), Department of Radiology, Maastricht University Medical Centre, P.O. Box 5800, 6202 AZ Maastricht, the Netherlands. E-mail: [email protected]. 995 996 Miserus et al. Molecular MRI of Early Thrombus Formation REFERENCES 1. Rosamond W, Flegal K, Friday G, et al. Heart disease and stroke statistics—2007 update: a report from the American Heart Association Statistics Committee and Stroke Statistics Subcommittee. Circulation 2007;115: e69 –171. 2. White RH. The epidemiology of venous thromboembolism. Circulation 2003;107:I4 – 8. 3. Fibrinolytic Therapy Trialists’ (FTT) Collaborative Group. Indications for fibrinolytic therapy in suspected acute myocardial infarction: collaborative overview of early mortality and major morbidity results from all randomised trials of more than 1000 patients. Lancet 1994;343:311–22. 4. Lange RA, Hillis LD. Reperfusion therapy in acute myocardial infarction. N Engl J Med 2002;346:954 –5. 5. Goldstein LB. Acute ischemic stroke treatment in 2007. Circulation 2007; 116:1504 –14. 6. Miserus RJJHM, Heeneman S, Engelshoven JMAv, Kooi ME, Daemen MJAP. Development and validation of novel imaging technologies to assist translational studies in atherosclerosis. Drug Discov Today 2006;3:195–204. 7. Wickline SA, Neubauer AM, Winter P, Caruthers S, Lanza G. Applications of nanotechnology to atherosclerosis, thrombosis, and vascular biology. Arterioscler Thromb Vasc Biol 2006;26:435– 41. 8. Jaffer FA, Weissleder R. Molecular imaging in the clinical arena. JAMA 2005;293:855– 62. 9. Flacke S, Fischer S, Scott MJ, et al. Novel MRI contrast agent for molecular imaging of fibrin: implications for detecting vulnerable plaques. Circulation 2001;104:1280 –5. 10. Botnar RM, Buecker A, Wiethoff AJ, et al. In vivo magnetic resonance imaging of coronary thrombosis using a fibrin-binding molecular magnetic resonance contrast agent. Circulation 2004;110:1463– 6. 11. Spuentrup E, Buecker A, Katoh M, et al. Molecular magnetic resonance imaging of coronary thrombosis and pulmonary emboli with a novel fibrintargeted contrast agent. Circulation 2005;111:1377– 82. Downloaded From: http://imaging.onlinejacc.org/ on 02/06/2015 JACC: CARDIOVASCULAR IMAGING, VOL. 2, NO. 8, 2009 AUGUST 2009:987–96 12. Sirol M, Fuster V, Badimon JJ, et al. Chronic thrombus detection with in vivo magnetic resonance imaging and a fibrin-targeted contrast agent. Circulation 2005;112:1594 – 600. 13. Spuentrup E, Fausten B, Kinzel S, et al. Molecular magnetic resonance imaging of atrial clots in a swine model. Circulation 2005;112:396 –9. 14. Spuentrup E, Katoh M, Buecker A, et al. Molecular MR imaging of human thrombi in a swine model of pulmonary embolism using a fibrin-specific contrast agent. Invest Radiol 2007;42: 586 –95. 15. Stracke CP, Katoh M, Wiethoff AJ, Parsons EC, Spangenberg P, Spuntrup E. Molecular MRI of cerebral venous sinus thrombosis using a new fibrin-specific MR contrast agent. Stroke 2007;38:1476 – 81. 16. Botnar RM, Perez AS, Witte S, et al. In vivo molecular imaging of acute and subacute thrombosis using a fibrin-binding magnetic resonance imaging contrast agent. Circulation 2004;109:2023–9. 17. Sirol M, Aguinaldo JG, Graham PB, et al. Fibrin-targeted contrast agent for improvement of in vivo acute thrombus detection with magnetic resonance imaging. Atherosclerosis 2005;182:79 – 85. 18. Spuentrup E, Botnar RM, Wiethoff AJ, et al. MR imaging of thrombi using EP-2104R, a fibrin-specific contrast agent: initial results in patients. Eur Radiol 2008;18:1995– 2005. 19. Muszbek L, Yee VC, Hevessy Z. Blood coagulation factor XIII: structure and function. Thromb Res 1999; 94:271–305. 20. Lee KN, Lee CS, Tae WC, Jackson KW, Christiansen VJ, McKee PA. Crosslinking of alpha 2-antiplasmin to fibrin. Ann N Y Acad Sci 2001; 936:335–9. 21. Robinson BR, Houng AK, Reed GL. Catalytic life of activated factor XIII in thrombi. Implications for fibrinolytic resistance and thrombus aging. Circulation 2000;102:1151–7. 22. Tung CH, Ho NH, Zeng Q, et al. Novel factor XIII probes for blood coagulation imaging. Chembiochem 2003;4:897–9. 23. Jaffer FA, Tung CH, Wykrzykowska JJ, et al. Molecular imaging of factor XIIIa activity in thrombosis using a novel, near-infrared fluorescent contrast agent that covalently links to thrombi. Circulation 2004;110:170 – 6. 24. Kim DE, Schellingerhout D, Jaffer FA, Weissleder R, Tung CH. Nearinfrared fluorescent imaging of cerebral thrombi and blood-brain barrier disruption in a mouse model of cerebral venous sinus thrombosis. J Cereb Blood Flow Metab 2005;25:226 –33. 25. Schnolzer M, Alewood P, Jones A, Alewood D, Kent SB. In situ neutralization in Boc-chemistry solid phase peptide synthesis. Rapid, high yield assembly of difficult sequences. Int J Pept Protein Res 1992;40:180 –93. 26. Dirksen A, Langereis S, de Waal BF, et al. Design and synthesis of a bimodal target-specific contrast agent for angiogenesis. Org Lett 2004;6: 4857– 60. 27. Kulkarni S, Jackson SP. Platelet factor XIII and calpain negatively regulate integrin alphaIIbbeta3 adhesive function and thrombus growth. J Biol Chem 2004;279:30697–706. 28. Megens RT, Reitsma S, Schiffers PH, et al. Two-photon microscopy of vital murine elastic and muscular arteries. Combined structural and functional imaging with subcellular resolution. J Vasc Res 2007;44:87–98. 29. Rittersma SZ, van der Wal AC, Koch KT, et al. Plaque instability frequently occurs days or weeks before occlusive coronary thrombosis: a pathological thrombectomy study in primary percutaneous coronary intervention. Circulation 2005;111:1160 –5. 30. Nahrendorf M, Hu K, Frantz S, et al. Factor XIII deficiency causes cardiac rupture, impairs wound healing, and aggravates cardiac remodeling in mice with myocardial infarction. Circulation 2006;113:1196 –202. 31. AbdAlla S, Lother H, Langer A, el Faramawy Y, Quitterer U. Factor XIIIA transglutaminase crosslinks AT1 receptor dimers of monocytes at the onset of atherosclerosis. Cell 2004;119:343–54. Key Words: thrombosis y magnetic resonance imaging y contrast media.
© Copyright 2026