
Canadian Research at a Glance - Investor Village: Stock Message
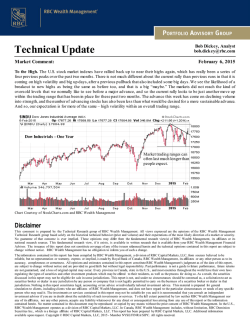
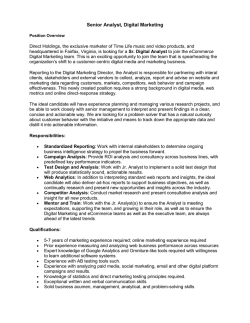
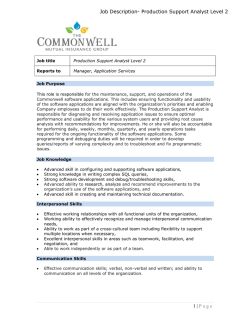
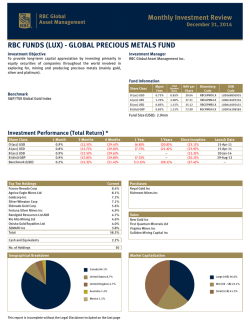
EQUITY RESEARCH
CANADIAN RESEARCH AT A GLANCE
January 30, 2015
Ratings Revisions
! Dorel Industries Inc.
Summary
Revising estimates lower on F/X headwinds; Rating to Sector Perform
Summary
Hunkering Down
Summary
Battening Down the Hatches
Summary
Fundamentals intact although risk has increased
Summary
Too early to step in
Summary
Temiscaming upgrade is done with full benefits expected in March
Summary
Another solid round of drill results from Buritica
Summary
HBI reported in-line Q4 results; positive read-through for the retail channel
Summary
Optimized Halilaga PEA focused on returns
Summary
Mixed Q4/14 results as expected
Summary
Fully financed even with higher capex
Summary
Production/reserve additions outweighed by oil price outlook
Summary
Guiding lower on weak capex
Summary
Entering the Transition Year
Summary
Highlights of the Canada Transportation Act review meeting
Summary
Railroad news + Weekly carload data
Summary
LUPE; PRE; DNO; RDSB
Summary
Upgrading our sector view
Summary
Airfreight & Surface Transportation
Summary
Technology and Consumer ideas contrasted to Financials and Energy
Price Target Revisions
! Canadian Oil Sands Limited
! Cenovus Energy Inc.
! Eldorado Gold Corporation
! Methanex Corp.
! Tembec Inc.
First Glance Notes
! Continental Gold Limited
! Gildan Activewear Inc.
! Pilot Gold
! Rogers Communications Inc.
! Torex Gold Resources Inc.
Company Comments
! BlackPearl Resources Inc.
! JDS Uniphase Corporation
! Rogers Communications Inc.
Industry Comments
! RBC Compass
! RBC Compass
! RBC International E&P Daily
! Solar
! The Weekly Haul
Technical Research
! Equity Indexes Range Bound WITH
Small-caps Improving
! - Action-Oriented Research
Priced as of prior day's market close, EST (unless otherwise noted).
For Required Non-U.S. Analyst and Conflicts Disclosures, see Page 16.
EQUITY RESEARCH
U.S. RESEARCH AT A GLANCE
January 30, 2015
Ratings Revisions
! Cameron International Corp.
! JA Solar Holdings Co., Ltd.
! SunPower Corporation
! Trina Solar Ltd.
Summary
Downgrading to Sector Perform
Summary
Upgrade to Outperform and raise PT to $13
Summary
Raise PT to $36 and upgrade to Outperform
Summary
Upgrade to Outperform from Sector Perform, Raising PT to $13
Summary
A Monetization Miss, But Still Strong Fundamentals
Summary
The future dims somewhat
Summary
Underlying Profitability Better Than Thought
Summary
Lowering FY15/FY16 Estimates; Reducing Price Target to $74
Summary
2 significant upside TAM opportunities; we're (still) very bullish - OP
Summary
Core business stronger than expected, no one asleep at switch at BRCM
Summary
Rx Segment drives strong 2Q/15; raising estimates and price target
Summary
A good 4Q but 2015 guided a bit lower
Summary
Lots of Growth Options, but It's About Consistency
Summary
Reducing EPS Post Call
Summary
Fundamentals intact although risk has increased
Summary
Transition Continues; Hit Snooze Till March-10. Maintain OP.
Summary
Raising NAV estimate, price target driven by 50 bps drop in cap rate; Reiterate SP
Summary
High Quality Miss Q4…Reiterate Outperform
Summary
M&A Poised to Be a More Meaningful Driver
Summary
Equity flows fade. Fortunately, IVZ's got so much more
Summary
Too early to step in
Summary
More of the Same: 4Q14 Earnings Recap
Summary
4Q14 – Strong revenues drive beat
Summary
2015 Cash Flow Outspend Looking More Concerning With DCP Issues
Summary
Robust Quarter; Strong Growth Story Remains On Track
Summary
Maintaining momentum; Proofpoint remains a favorite of ours
Summary
4Q14 Earnings Review
Summary
Executing Ahead of Grantley Refresh Cycle
Summary
A return to organic revenue growth but M&A and cost-cutting drive results
Summary
4Q14 – The Price of Growth
Summary
Good Q4 with plenty of runway left; Outperform
Summary
Good report, in-line guide
Price Target Revisions
! Alibaba Group Holding Limited
! Anglo American plc
! Autoliv Inc.
! Baxter International Inc.
! Biogen Idec Inc.
! Broadcom Corporation
! Cardinal Health, Inc.
! Chubb Corporation
! CMS Energy Corp.
! Core Laboratories
! Eldorado Gold Corporation
! EMC Corporation
! General Growth Properties, Inc.
! Google Inc.
! IDEX Corporation
! Invesco Ltd.
! Methanex Corp.
! NetSuite Inc.
! Northrop Grumman Corp.
! Phillips 66
! Phillips 66 Partners LP
! Proofpoint Inc.
! PulteGroup, Inc.
! QLogic Corporation
! Quest Diagnostics, Inc.
! Raytheon Company
! Robert Half International, Inc.
! Swift Transportation Company
2
EQUITY RESEARCH
! The Blackstone Group LP
! The Dow Chemical Company
! The Wendy's Company
! Triumph Group, Inc.
! Umpqua Holdings Corp.
! Valero Energy Corporation
! Valero Energy Partners, LP
! WESCO International Inc.
Summary
4Q/14: Updating Model
Summary
Specialty Portfolio Showing Margin Resilience
Summary
Perspectives, strategy, and valuation
Summary
F3Q15 – More than 99 problems
Summary
4Q14: Softer Trends But Set to Bounce Back in 1Q15
Summary
Walking The Path Of The Righteous
Summary
Dropdowns accelerated; increasing price target given high-conviction growth
Summary
Misses 4Q14 on Margins; Reaffirms 2015 with FX Caveats
Summary
A penny ahead on sound quarter; Guidance increased; Balance sheet strengthens
Summary
HBI reported in-line Q4 results; positive read-through for the retail channel
Summary
Breakthrough Therapy granted...signals FDA positively disposed on OCA - Outperform
Summary
Turn the Page: Cranes/Foodservice to split (finally)
Summary
Optimized Halilaga PEA focused on returns
Summary
Still the most defensive major, but more definition needed
Summary
Solid Q4 beat
Summary
Strong Underlying Growth Ahead for 2015
Summary
It’s Prime Time…
Summary
4Q14 – Setting Up 2015
Summary
F2Q15 – Revenue vs. Bookings
Summary
Modest 4Q14 EPS Miss, Story Stays the Same
Summary
The road to $150? We said 2020 guidance could come...here's what else could come
Summary
Going on Offense
Summary
RWA trajectory uncertain
Summary
Widespread volume decline persists
Summary
Fibre Channel Better than Feared... But Growth Remains Elusive
Summary
An easy MLP to own in a difficult energy market
Summary
Low Riding Expectations
Summary
Reducing Estimates Post Call
Summary
Guiding lower on weak capex
Summary
4Q14 – Low tax rate helps
Summary
Rolling along
Summary
Aggressively Cuts 2015 Onshore Spending; Production Growth Likely Negative In 2016
Summary
2Q15: Telfer better, but Lihir slow to improve driving minor downgrades
Summary
4Q14: Stuck in a holding pattern
First Glance Notes
! Boston Properties, Inc.
! Gildan Activewear Inc.
! Intercept Pharmaceuticals, Inc.
! Manitowoc Co., Inc.
! Pilot Gold
! Royal Dutch Shell, plc
! Selective Insurance Group
Company Comments
! Abbott Laboratories
! Amazon.com
! B/E Aerospace, Inc.
! CACI International Inc.
! Capstead Mortgage Corporation
! Celgene Corp.
! Check Point Software
! Deutsche Bank
! Diageo PLC
! Emulex Corporation
! Enterprise Products Partners
! Harley-Davidson, Inc.
! Helmerich & Payne Inc.
! JDS Uniphase Corporation
! L-3 Communications Holdings
! Landstar Systems, Inc.
! Murphy Oil Corporation
! Newcrest Mining Limited
! N.Y. Community Bancorp
3
EQUITY RESEARCH
! NextEra Energy Inc.
! Nokia Oyj
! Occidental Petroleum Corporation
! PDC Energy Inc.
! PTC Inc.
! Rogers Communications Inc.
! SAP SE
! TCF Financial Corp.
! The Hershey Company
! The Medicines Company
! Valley National Bancorp
! Visa Inc.
! Werner Enterprises, Inc.
Summary
Continued Growth Visibility, Reiterate Outperform
Summary
Steady march towards monetization
Summary
Balance Sheet Preservation Is Top Priority; Cutting 2015 CapEx Budget 33% YoY
Summary
4Q14 Production Lags Our Expectations On Weather & Midstream Issues
Summary
Lots of moving parts as the journey begins to a more ratable model
Summary
Entering the Transition Year
Summary
S4HANA: SAP's Next Big Thing
Summary
4Q core EPS ~$0.29 - Decent core trends. Putting TDRs in the rear view mirror.
Summary
Trimming estimates; Sector Perform
Summary
Raplixa PDUFA extension possible; Point is 3-4 US approvals following 3 in the EU
Summary
4Q14: Several one-time items fail to illuminate the road ahead
Summary
A good quarter essentially “as advertised”
Summary
No real surprises
Industry Comments
! Ciccarelli's Check Points
! Mining equipment: Weekly news &
Summary
!
! RBC Compass
! RBC European Industrials Daily
! RBC International E&P Daily
! Solar
! The Weekly Haul
! US Oilfield Services
Summary
Approaching Stock Valuations from Another Angle
Summary
Highlights of the Canada Transportation Act review meeting
Summary
CNH cutting Ag inventory, mixed mining messages
Summary
LUPE; PRE; DNO; RDSB
Summary
Upgrading our sector view
Summary
Airfreight & Surface Transportation
Summary
Subsea Report – More Headwinds than Tailwinds
Summary
Technology and Consumer ideas contrasted to Financials and Energy
data nuggets
Picture of the Week Vol. 5
Summary
Technical Research
! Equity Indexes Range Bound WITH
Small-caps Improving
4
EQUITY RESEARCH
UK & European Research at a Glance
January 30, 2015
Price Target Revisions
! Anglo American plc
! Core Laboratories
! Flughafen Zuerich AG
! Henderson Group Plc
! TeliaSonera AB
Summary
The future dims somewhat
Summary
Reducing EPS Post Call
Summary
Changing non-Aviation estimates for FX
Summary
Q4/14 mark-to-markets result in immaterial changes; maintain Sector Perform
Summary
B is Mightier than the C
Summary
Still the most defensive major, but more definition needed
Summary
Well placed to weather out low prices
Summary
RWA trajectory uncertain
Summary
Widespread volume decline persists
Summary
Steady march towards monetization
Summary
Signs of improvement in French Life
Summary
Searching for yield
First Glance Notes
! Royal Dutch Shell, plc
Company Comments
! Aquarius Platinum Limited
! Deutsche Bank
! Diageo PLC
! Nokia Oyj
Industry Comments
! European Insurance
! RBC European consumer staples
Find our Research at:
RBC Insight (www.rbcinsight.com): RBC's global research destination on the web. Contact your RBC Capital Markets' sales representative to
access our global research site, or use our iPad App "RBC Research"
Thomson Reuters (www.thomsononeanalytics.com)
Bloomberg (RBCR GO)
SNL Financial (www.snl.com)
FactSet (www.factset.com)
5
Ratings Revisions
Dorel Industries Inc.(TSX: DII.B; 37.20)
Sabahat Khan (Analyst)
(416) 842-7880; [email protected]
42.00
52 WEEKS
07FEB14 - 26JAN15
Rating:
Price Target:
Sector Perform (prev: Outperform)
40.00 ▼ 42.00
40.00
Revising estimates lower on F/X headwinds; Rating to Sector Perform
38.00
We are revising our 2015 EPS forecasts lower on the expectation of F/X headwinds
related to the strengthening dollar and reducing our rating to Sector Perform
(Outperform previously) to reflect: 1) modest Y/Y earnings growth in 2015; and, 2)
risk of further negative impact on 2015 earnings from continued appreciation of
the USD.
36.00
34.00
32.00
400
200
F
M
A
M
Close
J
2014
J
A
S
O
N
D
J
Rel. S&P/TSX COMPOSITE INDEXMA 40 weeks
EPS, Ops Diluted Prev.
2012A
3.33
2013A
2.34
2014E
2.66↓
2.67
2015E
2.75↓
3.14
P/E
8.9x
12.6x
11.1x
10.7x
All market data in CAD; all financial data in USD.
• Revising rating to Sector Perform (Outperform previously); target to C$40 (C$42
previously). Our price target is based on ~8x our F2015E EBITDA of $205MM
($224MM previously). Our Sector Perform rating reflects our expectation of
modest earnings growth through our forecast horizon (+3% Y/Y in 2015), and
the potential for further negative impact on 2015 earnings from continued
appreciation of the USD. DII will have to address these challenges while the
company continues to integrate the Lerado acquisition.
• Strengthening USD to be a headwind... Recall that DII generates over 50% of its
revenues outside the U.S. with the largest portion coming from Europe (~25-30%
of total company sales). The negative F/X impact results from DII's international
divisions purchasing in USD and selling in local currencies, and the results from
the international divisions also being translated back into USD for reporting
purposes.
• ... but, lower input costs/potential pricing to partially offset. At Q3 reporting, DII
management noted that material costs for a number of inputs (metals, plastics,
synthetics, etc.) had become increasingly favorable, which we expect will help
partially offset the negative impact of the stronger USD. The lower crude price
is also expected to benefit through lower freight costs. We note that DII is also
working with its retail partners to pass-through price increases to offset some of
the impact.
• 2015 EPS forecasts revised lower. Our 2015 EBITDA and EPS forecasts are now
$204.8MM and $2.75, respectively, versus $223.6MM and $3.14 previously.
Price Target Revisions
Canadian Oil Sands Limited(TSX: COS; 6.84)
Greg Pardy, CFA (Analyst)
(416) 842-7848; [email protected]
Franz Hargo Muljo, CA (Associate)
416 842 8588; [email protected]
24.00
22.00
20.00
18.00
16.00
14.00
Rating:
Price Target:
52 WEEKS
07FEB14 - 26JAN15
Underperform
10.00 ▼ 11.00
Hunkering Down
Canadian Oil Sands' fourth-quarter CFPS of $0.43 was essentially in-line with our
outlook and street consensus of $0.42. As expected, the company announced a
75% dividend cut to $0.05 per share attributable to the first-quarter of 2015.
12.00
4Q Results. COS' fourth-quarter synthetic oil sales of 108,139 b/d and oil
realizations of $81.32/b were similar to our outlook of 107,500 b/d and $79.49/b,
respectively, while its operating costs of $44/b came in 11% above our expectations.
Cash taxes of $45 million exceeded our $30 million estimate.
10.00
8.00
30000
20000
10000
F
M
A
Close
2013A
2014E
2015E
M
J
2014
J
A
S
O
N
D
J
Rel. S&P/TSX COMPOSITE INDEXMA 40 weeks
CFPS Diluted Prev.
2.78
2.28
1.33↑
0.85
P/CFPS
2.5x
3.0x
5.1x
In-Line Dividend Cut. COS announced a 75% dividend cut to a quarterly run rate
of $0.05 per share attributable to 1Q-2015, reflective of the current oil price
environment. Our annual dividend outlook for COS remains unchanged at $0.20 in
2015 and 2016.
6
2016E
1.67↑
1.51
Cost Reduction Initiatives. On a positive note, COS’ updated 2015 guidance reflects
a 20% ($113 million) cut to its capital program, which now stands at $451 million.
Syncrude’s major projects are nearing an end with the new Mildred Lake mine trains
commencing operations in 4Q-2014, and completion of the Centrifuge Tailings
Management project expected in 2015. The company has also taken steps to
reduce its 2015 operating costs by 12% ($5.50/b) to $40.19/b, reflective of lower
energy costs (25% lower) and non-energy costs (10.5% lower). Syncrude’s operating
costs should benefit from its move to reduce contract workers (and overtime),
while deferrals of its reclamation and pre-stripping activities may be somewhat
temporary in nature.
4.1x
All values in CAD unless otherwise noted.
Cenovus Energy Inc.(TSX: CVE; 22.94; NYSE: CVE)
Greg Pardy, CFA (Analyst)
(416) 842-7848; [email protected]
Franz Hargo Muljo, CA (Associate)
416 842 8588; [email protected]
34.00
32.00
30.00
28.00
26.00
Rating:
Price Target:
52 WEEKS
07FEB14 - 26JAN15
Outperform
28.00 ▼ 30.00
Battening Down the Hatches
Cenovus Energy announced a $700 million (27%) reduction to its 2015 capital
program yesterday to a mid-point of $1.9 billion in order to protect its balance
sheet amid challenging oil market conditions. The shift had little impact on its midpoint 2015 production of 276,500 boe/d (down only 1%), but will impact its future
production.
24.00
22.00
20.00
25000
20000
15000
10000
5000
F
M
A
M
Close
J
2014
J
A
S
CFPS Diluted Prev.
4.77
4.83
2.61↓
2.72
2.86↓
3.87
2013A
2014E
2015E
2016E
O
N
D
J
Rel. S&P/TSX COMPOSITE INDEXMA 40 weeks
P/CFPS
4.8x
4.7x
8.8x
8.0x
All values in CAD unless otherwise noted.
Eldorado Gold Corporation(NYSE: EGO; 5.57; TSX: ELD)
Dan Rollins, CFA (Analyst)
(416) 842-9893; [email protected]
Mark Mihaljevic (Associate)
(416) 842-3804; [email protected]
8.50
8.00
7.50
52 WEEKS
• Reducing Capital. Cenovus’ revised 2015 capital program, now ranging from
$1.8–$2.0 billion (vs. $2.5–$2.7 billion previously), will be directed towards
maintaining current production from its oil sands assets. Christina Lake’s
optimization program and Phase F expansion (25,000 b/d net) are sheltered
from this cut, along with Phase G (15,000 b/d net) at Foster Creek. Conversely,
Cenovus’ conventional drilling program in southern Alberta and Saskatchewan
has largely been suspended. Longer-dated oil sands expansions, including Foster
Creek Phase H (15,000 b/d net), Christina Lake Phase G (25,000 b/d net),
and Narrows Lake Phase A (22,500 b/d net), along with greenfield oil sands
projects have also been deferred. On the labour front, Cenovus plans to reassign
employees to core business areas and reduce the size of its contract workforce
in the coming weeks.
• Production Impacts. Cenovus’ revised 2015 mid-point production guidance of
276,500 boe/d (265,000 – 288,000 boe/d range) is down only 1% from a previous
mid-point of 278,500 boe/d (-3% growth). At the same time, we have trimmed
our 2016 production outlook by 9% to 274,000 boe/d (-1% growth) in connection
with natural production declines.
Rating:
Price Target:
07FEB14 - 26JAN15
Outperform
7.50 ▼ 8.50
Fundamentals intact although risk has increased
We maintain our Outperform rating on Eldorado as the company's strong
underlying fundamentals remain intact. However, the recent election of the Syriza
party in Greece in conjunction with lower production from Kisladag, has at the
moment, increased the overall level of risk associated with the company's shares.
7.00
6.50
6.00
5.50
Long-term fundamentals remain intact
5.00
While Eldorado released weaker than expected guidance for 2015, we believe the
company's long-term fundamentals remain intact, driven by start-up of its low cost
Eastern Dragon, Olympias II and Skouries projects.
40000
20000
F
M
A
Close
M
J
2014
J
A
S
O
Rel. S&P 500
EPS, Adj Diluted Prev.
2013A
0.28
2014E
0.21↑
0.20
N
D
J
MA 40 weeks
P/E
20.0x
27.0x
• Production expected to rebound in 2016
• Cash costs expected to decline as new projects come on line
• Free cash flow to materially improve
7
2015E
2016E
0.02↓
0.23↓
0.17
0.41
Political risk elevated following Greek elections
24.1x
We believe the election of the Syriza party in Greece heightens the political risk
associated with Eldorado's Greek assets given uncertainty around the policies/
mandates of the new government and its view towards business and mining. Given
the increased uncertainty, we now apply a 10% discount rate to the company's
Greek assets, up from 7% previously.
All values in USD unless otherwise noted.
Given Syriza's intent to restore public/social spending after ~5 years of austerity,
we believe the government could look to bolster revenues by increasing taxes/
royalties. With Eldorado employing over 2,000 people and Greece's unemployment
rate around 25%, we would expect local communities and labour unions to be
supportive of the projects.
Outperform rating maintained
We maintain our Outperform rating on Eldorado Gold given the company’s strong
underlying fundamentals and attractive risk/reward opportunity, although we note
the elevated risk may not be suitable for all investors. As a result of lower nearterm cash flow and lower NAV, we have reduced our price target on Eldorado to
$7.50 from $8.50.
Methanex Corp.(NASDAQ: MEOH; 44.39; TSX: MX)
Robert Kwan, CFA (Analyst)
(604) 257-7611; [email protected]
Michelle Zuliani (Associate)
604 257 7064; [email protected]
Rating:
Price Target:
52 WEEKS
07FEB14 - 26JAN15
70.00
Sector Perform
57.00 ▼ 69.00
Too early to step in
While we continue to like management's positive actions in terms of capital
allocation, we believe that it is too early to step into the stock due to concerns about
falling methanol prices (and more broadly, oil prices). Further, while not particularly
material in isolation, a combination of wider discounts, unplanned outages and
continued gas supply issues are expected to also weigh on sentiment.
65.00
60.00
55.00
50.00
45.00
12000
10000
8000
6000
4000
2000
F
M
A
Close
2013A
2014A
2015E
2016E
M
J
2014
J
A
S
Rel. S&P 500
EPS, Adj Basic Prev.
4.95
4.17↓
4.24
3.22↓
5.53
5.16↓
6.41
All values in USD unless otherwise noted.
Paul C. Quinn (Analyst)
(604) 257-7048; [email protected]
Hamir Patel (Analyst)
(604) 257-7145; [email protected]
O
N
D
J
MA 40 weeks
• Too early to step in. While we continue to like management's positive actions in
terms of capital allocation, we believe that it is too early to step into the stock due
to concerns about falling methanol prices (and more broadly, oil prices). Further,
while not particularly material in isolation, a combination of wider discounts,
unplanned outages and continued gas supply issues are expected to also weigh
on sentiment.
• Reducing estimates to primarily reflect lower methanol prices. We have
reduced our 2015 and 2016 normalized basic EPS estimates to $3.22 and $5.16,
respectively (down from $5.53 and $6.41, respectively). The reduction primarily
reflects a decrease in methanol pricing (more reflective of the current pricing
environment) as well as a moderation in 2015 forecast sales volumes along with
a wider discount to the posted price in Q1/15 .
• Valuation: reducing price target to $57.00 (down from $69.00). We have
reduced our price target primarily to reflect lower forecast EBITDA due to
a moderation in our pricing forecast more reflective of the current price
environment. We continue to use a 6.5x EV/EBITDA multiple as part of our
valuation.
Tembec Inc.(TSX: TMB; 2.74)
Rating:
Price Target:
Outperform
3.25 ▼ 3.50
Temiscaming upgrade is done with full benefits expected in March
Reiterating our Outperform rating but trimming our target to $3.25 (from $3.50).
We expect Tembec to benefit from FCF improvement in 2015/16 due to its
Temiscaming project (and reduced Capex). While we expect specialty DP prices to
8
3.40
52 WEEKS
07FEB14 - 26JAN15
3.20
fall again in 2016 (down ~3% following the ~8% decline in 2015E), Tembec's leverage
will drop on the weakened C$, higher lumber pricing and solid paperboard markets.
3.00
2.80
2.60
2.40
6000
4500
3000
1500
F
M
A
M
Close
J
2014
J
A
S
O
N
D
J
Rel. S&P/TSX COMPOSITE INDEXMA 40 weeks
EPS, Adj Diluted Prev.
2013A
0.13
2014A
(0.26)↓
(0.05)
2015E
0.03↓
0.52
2016E
0.17↓
1.04
P/AEPS
21.1x
NM
NM
16.1x
All values in CAD unless otherwise noted.
• The company is expecting its specialty dissolving pulp prices to decline 8% in
2015 with volumes of certain specialty grades to come under pressure – We
note that this guidance is in line with Rayonier AM's guidance for a 7-8% y/y
decline. In addition, the company is likely to reduce specialty shipments by 10K
tonnes while boosting viscose/fluff production by 20K tonnes in 2015. We have
factored in a further 3.5% specialty DP price drop in 2016.
• Management outlook – FQ215 earnings: Management estimates that, if energy
prices and FX stay at their current levels, Tembec will experience an uptick in
earnings in the fiscal second quarter (consistent with our forecast). Dissolving
pulp (DP): TMB sees no near-term improvement for commodity viscose and
expects the oversupply to persist throughout 2015. Lumber: Mgmt expects
higher lumber prices as we enter the normally stronger spring/summer months.
High-yield pulp: Anticipates marginal profitability until the market absorbs
new hardwood capacity. Paperboard: US markets remain stable and demand
expected to continue to grow with US GDP. Newsprint: Mgmt anticipates
continued downward pressure on price given weak market conditions.
• Revising estimates – CQ115E EBITDA from $29MM to $22MM, CY15 from
$140MM to $111MM and CY16 from $192MM to $133MM.
First Glance Notes
Continental Gold Limited(TSX: CNL; 2.10)
Dan Rollins, CFA (Analyst)
(416) 842-9893; [email protected]
Mark Mihaljevic (Associate)
(416) 842-3804; [email protected]
52 WEEKS
Rating:
Outperform
Risk Qualifier: Speculative Risk
07FEB14 - 26JAN15
5.00
4.00
3.00
2.00
12000
8000
4000
F
M
A
M
Close
J
2014
J
A
S
O
N
D
J
Rel. S&P/TSX COMPOSITE INDEXMA 40 weeks
All market data in CAD; all financial data in USD.
• Overall, we expect Continental’s shares to modestly outperform their peers this
morning given another solid round of drilling results from Veta Sur, one of two
primary deposits at the company’s flagship Buritica project in Colombia. Given
continuing positive results, Continental expects to deliver further growth in M&I
resources when an updated resource estimate is completed in late Q2/15.
• Key results from in-fill drilling of master veins in central Veta Sur that encountered
better grades and/or thicknesses than currently modeled.
• The company also continued to extend known mineralization with drilling in
central/western Veta Sur extending vertical and lateral extents of the northern
vein families, which is located in the proximity of planned mining development.
• In addition, Continental identified veins families that are not currently modeled
in northern Veta Sur as well as far western extensions of Yaragua.
Gildan Activewear Inc.(NYSE: GIL; 58.57; TSX: GIL.TO)
Sabahat Khan (Analyst)
(416) 842-7880; [email protected]
62.00
Another solid round of drill results from Buritica
Rating:
52 WEEKS
07FEB14 - 26JAN15
60.00
Outperform
HBI reported in-line Q4 results; positive read-through for the retail channel
Read-throughs for GIL:
58.00
56.00
54.00
52.00
50.00
6000
4500
3000
1500
F
M
A
Close
M
J
2014
J
A
S
Rel. S&P 500
All values in USD unless otherwise noted.
O
N
D
J
MA 40 weeks
• Retail environment continues to remain “choppy” but positive. The sell-through
at retail during November and December was strong versus October, and
the strength continued into the first few weeks of January, according to HBI
management. These trends provide a positive read-through for GIL's Branded
segment during the October–December quarter
• Retail inventories "well positioned" entering the new year. HBI management
noted that inventories at retail are in a good position coming out of holiday
selling season. This was driven by the positive sales trends noted above and
careful inventory management by retailers to match sell-through. This implies a
favorable starting position for suppliers (such as GIL) heading into the new year.
9
• Cotton is trending lower, but other inflationary pressures exist. In line with
previous commentary, HBI management indicated that they expect lower cotton
costs in H2 2015, but they are also experiencing cost inflation in other areas such
as labor. This is in line with our expectations for GIL over the next year and is
consistent with GIL management’s previous commentary.
2015 guidance largely in line with consensus. HBI's 2015 guidance is for sales of
$5,775–5,825MM (+9% y/y) vs. consensus of $6,029MM and EPS of $6.30–6.50
(+11-15% y/y) vs. consensus of $6.45.
Q4 results largely in line with forecasts. Q4 revenues of $1,523MM were up 18%
y/y and slightly below consensus of $1,556MM. Adjusted diluted EPS of $1.46 was
up 49% versus prior year and slightly above consensus of $1.44.
Pilot Gold(TSX: PLG; 1.15)
Dan Rollins, CFA (Analyst)
(416) 842-9893; [email protected]
Mark Mihaljevic (Associate)
(416) 842-3804; [email protected]
52 WEEKS
Rating:
Outperform
Risk Qualifier: Speculative Risk
07FEB14 - 26JAN15
1.60
1.40
1.20
1.00
0.80
2500
2000
1500
1000
500
F
M
A
Close
M
J
2014
J
A
S
O
N
D
J
Rel. S&P/TSX COMPOSITE INDEXMA 40 weeks
All market data in CAD; all financial data in USD; dividends paid in
CAD.
Drew McReynolds, CFA, CA (Analyst)
(416) 842-3805; [email protected]
Jie He (Associate)
416 842 4123; [email protected]
Haran Posner (Analyst)
(416) 842-7832; [email protected]
Optimized Halilaga PEA focused on returns
• Pilot released an optimized PEA on its Halilaga project in Turkey (Pilot 40%/Teck
60%) which, in our view, improves the underlying return potential of the project
and ability to withstand lower metal prices and/or more conservative operating/
capital estimates. We also believe the new study paves the way for a potential
divestiture or eventual development in conjunction with a new partner.
• Improved economics relative to prior PEA
• Overall, the optimized PEA outlines a more robust project than previously
envisioned by targeting the high-grade core of the deposit. Given the
optimizations, Pilot has increased the estimated after-tax IRR of the project
to 43% from 20% previously (at $1,200/oz gold and $2.90/lb copper) while
significantly reducing the upfront capital hurdle. At $1,100/oz gold and $2.25/lb
copper, the project's IRR is estimated at 20%.
• The new PEA estimates average annual payable copper and gold production of
57.2 Mlb and 67.9 Koz at by-product cash costs of $1.08/lb, based on a 25,000
tpd mill. Upfront capital is estimated at $346 million with LOM sustaining capital
of $213 million.
• Key differences between new and old PEA:
• Smaller mine size
• Use of contractor mining
• Addition of CIL circuit
• Government incentives
• In addition, we note the project economics could potentially benefit further if
it were built as part of a regional development plan, including Pilot's TV Tower
project.
Rogers Communications Inc.(TSX: RCI.B; 44.55; NYSE: RCI)
Rating:
Sector Perform
Mixed Q4/14 results as expected
• Mixed Q4/14 financial results were largely in line with expectations.
Consolidated revenue and EBITDA were $3,366MM (+3.8% YoY) and $1,233MM
(+5.7% YoY), respectively, versus our estimates of $3,390MM and $1,186MM
(consensus was $3,360MM and $1,180MM). The positive EBITDA variance was
mainly due to media ($78MM versus our $39MM estimate). Consolidated EBITDA
margins of 36.6% (+65bps YoY) were above our 35.0% estimate due mainly to
stronger media margins (14.3% versus 7.0%). Adjusted EPS was $0.57 versus our
estimate of $0.62 (consensus $0.64).
• What to look for on the 8:00am ET call (#416-644-3414). (i) an update on
progress with key Rogers 3.0 initiatives; and (ii) the extent to which postpaid
ARPU growth is now sustainably positive.
10
52 WEEKS
07FEB14 - 26JAN15
46.00
44.00
42.00
7500
6000
4500
3000
1500
F
M
A
M
Close
J
2014
J
A
S
O
N
D
J
Rel. S&P/TSX COMPOSITE INDEXMA 40 weeks
All values in CAD unless otherwise noted.
Torex Gold Resources Inc.(TSX: TXG; 1.47)
Dan Rollins, CFA (Analyst)
(416) 842-9893; [email protected]
Mark Mihaljevic (Associate)
(416) 842-3804; [email protected]
1.80
52 WEEKS
Rating:
Outperform
Risk Qualifier: Speculative Risk
07FEB14 - 26JAN15
Fully financed even with higher capex
First impression
1.60
• We expect Torex's shares could slightly underperform its peers today's as the
market digests higher capital costs at the company's El Limon-Guajes project as
well as the potential for further cost pressures related to contractor costs, given
ongoing social unrest in Mexico's Guerrero State.
Capital costs for El Limon-Guajes project have risen $75 million
1.40
1.20
1.00
60000
40000
20000
F
M
A
Close
M
J
2014
J
A
S
O
N
D
J
Rel. S&P/TSX COMPOSITE INDEXMA 40 weeks
All values in CAD unless otherwise noted.
• Torex announced this morning that the capital cost estimate for its El LimonGuajes project is now estimated at $800M, up from the previous forecast of
$725M. The increase was driven by a number of factors including:
• Development of North Nose
• Scope changes/inflationary pressures
Project remains fully funded and relatively on schedule
• With a strong balance sheet and access to additional capital, development of
El Limon-Guajes remains fully financed. With production expected to start in
Q3/15, the company should gradually begin to benefit from pre-commercial cash
flow.
Security/social challenges in Guerrero warrant watching
• As highlighted within the Q3 MD&A, social/security challenges in Guerrero
continue to present a risk for the company. Today, Torex noted the social unrest
in the state has affected "the willingness of construction contractors and their
employees to come to the state".
• In our view, these challenges could lead to incremental costs in order to
compensate contractors for the perceived risk. To date, Torex has not had any
challenges with its employees, with the site remaining secure and productive.
Company Comments
Mark J. Friesen, CFA (Analyst)
(403) 299-2389; [email protected]
Luke Davis (Associate)
403 299 5042; [email protected]
BlackPearl Resources Inc.(TSX: PXX; 0.89)
Rating:
Underperform
Risk Qualifier: Speculative Risk
Price Target: 1.25
Production/reserve additions outweighed by oil price outlook
While we view the company's strong Q4/14 production positively at the
margin, we believe weak oil prices will continue to overshadow operational
developments. In addition, the company requires material financing before
11
3.15
2.70
52 WEEKS
07FEB14 - 26JAN15
proceeding with future development, which reduces the value of incremental
reserve bookings, in our view.
2.25
1.80
1.35
0.90
25000
20000
15000
10000
5000
F
M
A
M
Close
J
2014
J
A
S
O
N
D
J
Rel. S&P/TSX COMPOSITE INDEXMA 40 weeks
Prod (boe/d) Prev.
9,494
9,039↑
8,815
8,065
10,672
2013A
2014E
2015E
2016E
• Positive reserves update; financing required for development. The company
announced reserve additions in each of its three core areas, bringing total
corporate 2P reserves to 297 mmboe, up 2% over last year. While directionally
positive, we highlight that the company cannot move forward with development
of Blackrod SAGD, its largest planned project, without material financing or a JV
partner. Given current market conditions, we do not view this as probable for the
foreseeable future.
• Q4/14 production 10% above our expectation. Fourth quarter production of
9,639 boe/d was 10% higher than our estimate of 8,750 boe/d. The difference
was primarily attributable to our assumption of higher production declines at
Onion Lake.
• NAV largely unchanged. We have rolled over our NAV model to reflect the
company's updated reserves.
All values in CAD unless otherwise noted.
JDS Uniphase Corporation(NASDAQ: JDSU; 13.26)
Mark Sue (Analyst)
(212) 428-6491; [email protected]
Spencer Green (Associate)
212 858 7153; [email protected]
Ameet Prabhu (Associate)
(212) 618-3330; [email protected]
Rating:
Price Target:
Guiding lower on weak capex
52 WEEKS
07FEB14 - 26JAN15
14.00
13.00
12.00
11.00
40000
20000
F
M
A
Close
M
J
2014
J
A
S
O
Rel. S&P 500
EPS, Ops Diluted Prev.
2013A
0.56
2014A
0.56
2015E
0.53↓
0.57
2016E
0.73↑
0.72
Outperform
17.00
N
D
J
MA 40 weeks
P/E
23.7x
23.7x
25.0x
18.2x
All values in USD unless otherwise noted.
Drew McReynolds, CFA, CA (Analyst)
(416) 842-3805; [email protected]
Jie He (Associate)
416 842 4123; [email protected]
Haran Posner (Analyst)
(416) 842-7832; [email protected]
JDSU guided to our Street-low March quarter, which explains the stock action
today. There’s a value-unlocking split coming, encouraging 100G trends, and
promised opex savings. Despite the weak capex environment, we're staying the
course. Optical seems solid while pricing is holding. Some improving trends in SE,
although NE needs work. Our $17 price target is 2.0x CY16E revenues; SOTP gets
us higher.
• Capex uncertain...yet again. Slow carrier spending impacted JDSU’s revenues
and the conservative guide implies that the weak environment persists. JDSU
delivered results below expectations with weakness mostly in NE (-15% YoY)
while SE grew +17% YoY. CCOP was flat QoQ, -4% YoY, with optical -5% YoY offset
by strong +67% YoY growth in lasers, meaning that CCOP GM/OM improved
110/70 bps YoY. Book-to-bill finished the quarter >1 across segments aside from
OSP at <1.
• Outlook below...yet again. The outlook for F3Q15 is now $408–428M, the
$418M midpoint implying revenues -4% QoQ, flat YoY. We remain conservative
at $416M considering 1H capex outlook and seasonality in commercial lasers.
Beyond current capex headwinds, metro, submarine, Web 2.0, and next-gen
lasers may help offset the NE headwinds while SE is still targeting break-even by
F4Q15.
Rogers Communications Inc.(TSX: RCI.B; 44.86; NYSE: RCI)
Rating:
Price Target:
Sector Perform
44.00
Entering the Transition Year
Mixed Q4/14 financial results and 2015 guidance were largely in line with our
expectations. 2015 will be a transition year as Rogers 3.0 initiatives gain traction.
We would remain patient for more attractive and/or timely entry points. Our $44
target is unchanged.
• Medium-term set-up remains attractive. Notwithstanding greater wireless
competition and/or higher bond yields, we see a stronger floor under the stock
reflecting renewed postpaid ARPU growth. However, we believe it is too early
to overweight the stock reflecting: (i) the likelihood of a stronger recapitalized
12
52 WEEKS
07FEB14 - 26JAN15
46.00
44.00
42.00
7500
6000
4500
3000
1500
F
M
A
Close
2013A
2014A
2015E
2016E
M
J
2014
J
A
S
O
N
D
J
Rel. S&P/TSX COMPOSITE INDEXMA 40 weeks
Revenue Prev.
12.7
12.9
13.3↓
13.4
13.5
All values in CAD unless otherwise noted.
fourth national wireless player emerging; and (ii) the timing of a return to
NAV growth that is comparable to large-cap peers. Over the medium-term, we
continue to believe the set-up for Rogers looks very attractive reflecting: (i)
eventual market share stabilization; (ii) a superior asset mix; and (iii) the likely
monetization of Rogers 3.0 initiatives, particularly with respect to customer
service and business market penetration.
• 2016 focus to shift to improved subscriber growth following a “transition year”
in 2015. With now an improving revenue trajectory and with management
setting modest subscriber expectations for 2015 and reiterating that the
turnaround “will take time”, we believe the investor focus in 2016 will
increasingly shift to evidence that initiatives under Rogers 3.0 are translating to
real improvement. The key metrics in 2016 that we believe should encapsulate
many of Rogers 3.0 initiatives are postpaid churn and cable RGU growth,
particularly the initiatives around customer service improvement, network
differentiation (i.e., shomi, NHL GameCentre LIVE / GamePlus and VICE
programming with more to come in 2015) and increased business market
penetration (i.e., SMB).
Industry Comments
Walter Spracklin, CFA (Analyst)
(416) 842-7877; [email protected]
RBC Compass
Erin Lytollis, CFA (Associate)
(416) 842-7862; [email protected]
• We were invited to attend a closed-door meeting in Ottawa as part of the Canada
Transportation Act (CTA) Review consultation process. The meeting was hosted
by the Canadian Transportation Research Forum (CTRF), and attended by David
Cardin, an Advisor on the Review committee.
• Committee is balanced. We are encouraged by the committee membership,
which is balanced with representation of the shipper, rail, port/marine, airline,
and public policy point of view. Accordingly, we are confident that the views of
each stakeholder will be given fair consideration.
• Process provides adequate time for input, analysis and recommendation.
Unlike Bill C-30, which was put together in haste during a period of high rail
congestion, cold temperatures (and hot tempers), the CTA review is an 18-month
process that is taking into account hundreds of submissions and consultations.
Accordingly, we expect the recommendations to be based on more researchbased analysis than was the case with Bill C-30.
• Our view: We do not expect forthcoming recommendations to affect our thesis
on the railroads. At this stage, we do not see any major recommendations
emerging that would fundamentally alter the railroads' operating profile. Based
on the thorough process outlined above, we expect the Review panel to produce
fact-based recommendations and we believe that emphasis will be placed
on mandating the provision of information and producing a framework for
performance monitoring. Safety will also be a component, but nothing that
would be very damaging to network fluidity.
All values in CAD unless otherwise noted.
Highlights of the Canada Transportation Act review meeting
Walter Spracklin, CFA (Analyst)
(416) 842-7877; [email protected]
RBC Compass
John Barnes (Analyst)
(804) 782-4020; [email protected]
• Volume gains boosted by easy comparisons. Total freight traffic transported by
the Class 1 railroads jumped +6%Y/Y in the week ending January 24th. While yearover-year gain have been impacted by volatile comparisons year-to-date, we are
encouraged by the positive absolute volume trend through Week 3.
Progress on dwell performance. Average train velocity reported by the Class
1 railroads (excluding CP) was flat sequentially and slightly stronger compared
to prior year results. Average terminal dwell for this group improved by 2%
sequentially, but remained 2% weaker than prior year performance. Year-overyear improvements are fueled by easy comparisons for CNR, CP and BNSF.
CSX releases details of $2.5B capital program. CSX has posted the details of its
capital budget to its website. This $2.5B plan includes: 200 new locomotives;
Mike Fountaine (Associate)
(804) 782-4013; [email protected]
Erin Lytollis, CFA (Associate)
(416) 842-7862; [email protected]
All values in CAD unless otherwise noted.
Railroad news + Weekly carload data
13
95 locomotives rebuilt; 1,000 new containers; 3,300 new / rebuilt rail cars; 200
bridge repairs; 425 miles cleared for double-stack; 500 track miles replaced; and
3.2MM ties replaced. Twenty-nine projects were identified including beginning
construction on double-stacking the Virginia Avenue Tunnel and starting work on
an intermodal facility in Pittsburgh.
Nathan Piper (Analyst)
+44 131 222 3649; [email protected]
RBC International E&P Daily
Al Stanton (Analyst)
+44 131 222 3638; [email protected]
LUPE.SS: Newsflow Surge; PRE.TO: Delay to Caribbean LNG; RDSB.L: What are the
big boys doing - Key takeaways from Shell's FY13 results and presentation; Mexico
- Data rooms opening; Saudi Arabia announces government changes; Week Ahead
Haydn Rodgers, CA (Associate)
+44 131 222 4911; [email protected]
LUPE; PRE; DNO; RDSB
Victoria McCulloch, CA (Analyst)
+44 131 222 4909; [email protected]
All values in USD unless otherwise noted.
Mahesh Sanganeria, CFA (Analyst)
(415) 633-8550; [email protected]
Solar
Shawn Yuan (Associate)
415 633 8565; [email protected]
• Solar stocks have significantly underperformed the broader market since Q1/14
due to a huge decline in oil and natural gas prices, concern about China and Japan
demand, expectation of rise in interest rates, expiration of ITC in the US, and
International trade disputes/tariffs especially US/China.
• We expect a reversal in sentiment and rerating of the sector as the companies
deliver strong earnings growth and rational capacity expansion despite these
concerns.
• We believe installation can grow in low to mid teens over next five years as
declining policy support is offset by cost reductions.
• We expect companies with strong balance sheet to expand capacity to capture
profitability from incremental demand while maintaining a supply demand
balance.
• We are upgrading Trina Solar (TSL), JA Solar Holdings (JASO), and SunPower Corp.
(SPWR) to Outperform, maintaining SunEdison (SUNE) at Outperform and Yingli
Green Energy (YGE) and First Solar (FSLR) at Sector Perform.
All values in USD unless otherwise noted.
Upgrading our sector view
John Barnes (Analyst)
(804) 782-4020; [email protected]
The Weekly Haul
Mike Fountaine (Associate)
(804) 782-4013; [email protected]
• In this week's Feature Commentary, we discuss rail capex and why it may not
translate into better rail service.
• Takeaways from the news include: ILWU, PMA reach tentative chassis agreement,
but broader issues remain; E-retailers struggling with cost of delivery and logistics
investment; more than 1,000 Mexican carriers held authority to operate in US
before border opened; trailer orders reach near high in December; DeFazio blasts
DOT over failure to finalize Tank Car Rule, calls for PHMSA Audit; and Class I
employment gains in December.
• Next week we expect 4Q/14 results from HTLD, UPS, R, CHRW, ARCB, HUBG,
CNW, and ODFL.
• Key macro data points for the week ahead include MDI, OHD & ISM
Manufacturing on Monday, Factory Orders & Auto Sales on Tuesday, ISM NonManufacturing on Wednesday, RBC COI on Thursday, and Employment Report on
Friday.
Todd Maiden (Associate)
(804) 782-4014; [email protected]
All values in USD unless otherwise noted.
Airfreight & Surface Transportation
Technical Research
Robert Sluymer, CFA (Analyst)
(212) 858-7066; [email protected]
Anna Drotman (Associate)
Equity Indexes Range Bound WITH Small-caps Improving
Technology and Consumer ideas contrasted to Financials and Energy
14
(212) 858-7065; [email protected]
• US equity indexes continue to see-saw in a narrow range this week, stalling at
the January highs (S&P 2065) and bouncing from the January/December lows
near 200-dma’s (S&P 1972). A resolution of the January trading ranges, in either
direction, should signal the next important tactical trend shift for US equity
indexes.
• Small-cap indexes remain important to monitor in the coming weeks given they
have been consolidating in the upper half of a 12-month trading range and have
potential to ‘break-out’. The improving relative performance ‘trend’ for smallcaps vs. large caps remains encouraging.
• Sector and group themes remain far more important than the market ‘call’ –
We highlight our bottom up relative performance trend tables as one technical
tool that has continued to prove useful for allocating capital between sectors
within the equity market. Financials, Industrials and Technology relative breadth
declining – Our relative performance table, on page 11, illustrates an incremental
deterioration in the number of stocks ‘working’ within Financials, Industrials and
Technology.
(+/-) Technology – Haves & have-nots. Continue to add to accelerating leadership:
AAPL, CTSH. Reduce: QCOM, MSI.
(+/-) Consumer – Remain selective favoring accelerating profiles: SBUX, UA, TAP,
DNKN. Reduce exposure: CMCSA/TWC.
(-) Financials – Performance has stalled, Insurance bellwethers: AIG, TMK, MET and
PRU are at key ‘make-or-break’ levels.
(-) Energy – Integrateds (XOM, CVX) have been sector defensive safe havens BUT
are on the cusp of breaking key support.
15
Required disclosures
Non-U.S. analyst disclosure
Mark J. Friesen;Luke Davis;Greg Pardy;Franz Hargo Muljo;Robert Kwan;Michelle Zuliani;Sabahat Khan;Paul C. Quinn;Hamir
Patel;Drew McReynolds;Jie He;Haran Posner;Dan Rollins;Mark Mihaljevic;Nathan Piper;Al Stanton;Haydn Rodgers;Victoria
McCulloch;Walter Spracklin;Erin Lytollis (i) are not registered/qualified as research analysts with the NYSE and/or FINRA and (ii)
may not be associated persons of the RBC Capital Markets, LLC and therefore may not be subject to FINRA Rule 2711 and NYSE
Rule 472 restrictions on communications with a subject company, public appearances and trading securities held by a research
analyst account.
Conflicts disclosures
This product constitutes a compendium report (covers six or more subject companies). As such, RBC Capital Markets chooses
to provide specific disclosures for the subject companies by reference. To access current disclosures for the subject companies,
clients should refer to https://www.rbccm.com/GLDisclosure/PublicWeb/DisclosureLookup.aspx?entityId=1 or send a request to
RBC CM Research Publishing, P.O. Box 50, 200 Bay Street, Royal Bank Plaza, 29th Floor, South Tower, Toronto, Ontario M5J 2W7.
Please note that current conflicts disclosures may differ from those as of the publication date on, and as set forth in, this report.
The analyst(s) responsible for preparing this research report received compensation that is based upon various factors, including
total revenues of the member companies of RBC Capital Markets and its affiliates, a portion of which are or have been generated
by investment banking activities of the member companies of RBC Capital Markets and its affiliates.
Distribution of ratings
For the purpose of ratings distributions, regulatory rules require member firms to assign ratings to one of three rating categories
- Buy, Hold/Neutral, or Sell - regardless of a firm's own rating categories. Although RBC Capital Markets' ratings of Top Pick(TP)/
Outperform (O), Sector Perform (SP), and Underperform (U) most closely correspond to Buy, Hold/Neutral and Sell, respectively,
the meanings are not the same because our ratings are determined on a relative basis (as described below).
Distribution of ratings
RBC Capital Markets, Equity Research
As of 31-Dec-2014
Rating
BUY [Top Pick & Outperform]
HOLD [Sector Perform]
SELL [Underperform]
Count
897
686
112
Percent
52.92
40.47
6.61
Investment Banking
Serv./Past 12 Mos.
Count
Percent
290
32.33
137
19.97
6
5.36
Conflicts policy
RBC Capital Markets Policy for Managing Conflicts of Interest in Relation to Investment Research is available from us on request.
To access our current policy, clients should refer to
https://www.rbccm.com/global/file-414164.pdf
or send a request to RBC Capital Markets Research Publishing, P.O. Box 50, 200 Bay Street, Royal Bank Plaza, 29th Floor, South
Tower, Toronto, Ontario M5J 2W7. We reserve the right to amend or supplement this policy at any time.
Dissemination of research and short-term trade ideas
RBC Capital Markets endeavors to make all reasonable efforts to provide research simultaneously to all eligible clients, having
regard to local time zones in overseas jurisdictions. RBC Capital Markets' equity research is posted to our proprietary website
to ensure eligible clients receive coverage initiations and changes in ratings, targets and opinions in a timely manner. Additional
distribution may be done by the sales personnel via email, fax, or other electronic means, or regular mail. Clients may also
receive our research via third party vendors. RBC Capital Markets also provides eligible clients with access to SPARC on the Firms
proprietary INSIGHT website, via email and via third-party vendors. SPARC contains market color and commentary regarding
subject companies on which the Firm currently provides equity research coverage. Research Analysts may, from time to time,
include short-term trade ideas in research reports and / or in SPARC. A short-term trade idea offers a short-term view on
16
how a security may trade, based on market and trading events, and the resulting trading opportunity that may be available. A
short-term trade idea may differ from the price targets and recommendations in our published research reports reflecting the
research analyst's views of the longer-term (one year) prospects of the subject company, as a result of the differing time horizons,
methodologies and/or other factors. Thus, it is possible that a subject company's common equity that is considered a long-term
'Sector Perform' or even an 'Underperform' might present a short-term buying opportunity as a result of temporary selling pressure
in the market; conversely, a subject company's common equity rated a long-term 'Outperform' could be considered susceptible
to a short-term downward price correction. Short-term trade ideas are not ratings, nor are they part of any ratings system, and
the firm generally does not intend, nor undertakes any obligation, to maintain or update short-term trade ideas. Short-term trade
ideas may not be suitable for all investors and have not been tailored to individual investor circumstances and objectives, and
investors should make their own independent decisions regarding any securities or strategies discussed herein. Please contact
your investment advisor or institutional salesperson for more information regarding RBC Capital Markets' research.
Analyst certification
All of the views expressed in this report accurately reflect the personal views of the responsible analyst(s) about any and all of
the subject securities or issuers. No part of the compensation of the responsible analyst(s) named herein is, or will be, directly or
indirectly, related to the specific recommendations or views expressed by the responsible analyst(s) in this report.
Disclaimer
RBC Capital Markets is the business name used by certain branches and subsidiaries of the Royal Bank of Canada, including RBC Dominion Securities Inc., RBC
Capital Markets, LLC, RBC Europe Limited, RBC Capital Markets (Hong Kong) Limited, Royal Bank of Canada, Hong Kong Branch and Royal Bank of Canada, Sydney
Branch. The information contained in this report has been compiled by RBC Capital Markets from sources believed to be reliable, but no representation or warranty,
express or implied, is made by Royal Bank of Canada, RBC Capital Markets, its affiliates or any other person as to its accuracy, completeness or correctness. All
opinions and estimates contained in this report constitute RBC Capital Markets' judgement as of the date of this report, are subject to change without notice and
are provided in good faith but without legal responsibility. Nothing in this report constitutes legal, accounting or tax advice or individually tailored investment
advice. This material is prepared for general circulation to clients and has been prepared without regard to the individual financial circumstances and objectives of
persons who receive it. The investments or services contained in this report may not be suitable for you and it is recommended that you consult an independent
investment advisor if you are in doubt about the suitability of such investments or services. This report is not an offer to sell or a solicitation of an offer to buy
any securities. Past performance is not a guide to future performance, future returns are not guaranteed, and a loss of original capital may occur. RBC Capital
Markets research analyst compensation is based in part on the overall profitability of RBC Capital Markets, which includes profits attributable to investment banking
revenues. Every province in Canada, state in the U.S., and most countries throughout the world have their own laws regulating the types of securities and other
investment products which may be offered to their residents, as well as the process for doing so. As a result, the securities discussed in this report may not be
eligible for sale in some jurisdictions. RBC Capital Markets may be restricted from publishing research reports, from time to time, due to regulatory restrictions and/
or internal compliance policies. If this is the case, the latest published research reports available to clients may not reflect recent material changes in the applicable
industry and/or applicable subject companies. RBC Capital Markets research reports are current only as of the date set forth on the research reports. This report is
not, and under no circumstances should be construed as, a solicitation to act as securities broker or dealer in any jurisdiction by any person or company that is not
legally permitted to carry on the business of a securities broker or dealer in that jurisdiction. To the full extent permitted by law neither RBC Capital Markets nor
any of its affiliates, nor any other person, accepts any liability whatsoever for any direct or consequential loss arising from any use of this report or the information
contained herein. No matter contained in this document may be reproduced or copied by any means without the prior consent of RBC Capital Markets.
Additional information is available on request.
To U.S. Residents:
This publication has been approved by RBC Capital Markets, LLC (member FINRA, NYSE, SIPC), which is a U.S. registered broker-dealer and which accepts
responsibility for this report and its dissemination in the United States. Any U.S. recipient of this report that is not a registered broker-dealer or a bank acting in
a broker or dealer capacity and that wishes further information regarding, or to effect any transaction in, any of the securities discussed in this report, should
contact and place orders with RBC Capital Markets, LLC.
To Canadian Residents:
This publication has been approved by RBC Dominion Securities Inc.(member IIROC). Any Canadian recipient of this report that is not a Designated Institution in
Ontario, an Accredited Investor in British Columbia or Alberta or a Sophisticated Purchaser in Quebec (or similar permitted purchaser in any other province) and
that wishes further information regarding, or to effect any transaction in, any of the securities discussed in this report should contact and place orders with RBC
Dominion Securities Inc., which, without in any way limiting the foregoing, accepts responsibility for this report and its dissemination in Canada.
To U.K. Residents:
This publication has been approved by RBC Europe Limited ('RBCEL') which is authorized by the Prudential Regulation Authority and regulated by the Financial
Conduct Authority ('FCA') and the Prudential Regulation Authority, in connection with its distribution in the United Kingdom. This material is not for general
distribution in the United Kingdom to retail clients, as defined under the rules of the FCA. However, targeted distribution may be made to selected retail clients of
RBC and its affiliates. RBCEL accepts responsibility for this report and its dissemination in the United Kingdom.
To Persons Receiving This Advice in Australia:
This material has been distributed in Australia by Royal Bank of Canada - Sydney Branch (ABN 86 076 940 880, AFSL No. 246521). This material has been prepared
for general circulation and does not take into account the objectives, financial situation or needs of any recipient. Accordingly, any recipient should, before acting on
this material, consider the appropriateness of this material having regard to their objectives, financial situation and needs. If this material relates to the acquisition
or possible acquisition of a particular financial product, a recipient in Australia should obtain any relevant disclosure document prepared in respect of that product
and consider that document before making any decision about whether to acquire the product. This research report is not for retail investors as defined in section
761G of the Corporations Act.
17
To Hong Kong Residents:
This publication is distributed in Hong Kong by RBC Capital Markets (Hong Kong) Limited and Royal Bank of Canada, Hong Kong Branch (both entities which are
regulated by the Hong Kong Monetary Authority ('HKMA') and the Securities and Futures Commission ('SFC')). Financial Services provided to Australia: Financial
services may be provided in Australia in accordance with applicable law. Financial services provided by the Royal Bank of Canada, Hong Kong Branch are provided
pursuant to the Royal Bank of Canada's Australian Financial Services Licence ('AFSL') (No. 246521). RBC Capital Markets (Hong Kong) Limited is exempt from the
requirement to hold an AFSL under the Corporations Act 2001 in respect of the provision of such financial services. RBC Capital Markets (Hong Kong) Limited is
regulated by the HKMA and the SFC under the laws of Hong Kong, which differ from Australian laws.
To Singapore Residents:
This publication is distributed in Singapore by the Royal Bank of Canada, Singapore Branch, a registered entity granted offshore bank licence by the Monetary
Authority of Singapore. This material has been prepared for general circulation and does not take into account the objectives, financial situation, or needs of any
recipient. You are advised to seek independent advice from a financial adviser before purchasing any product. If you do not obtain independent advice, you should
consider whether the product is suitable for you. Past performance is not indicative of future performance. If you have any questions related to this publication,
please contact the Royal Bank of Canada, Singapore Branch. Royal Bank of Canada, Singapore Branch accepts responsibility for this report and its dissemination
in Singapore.
To Japanese Residents:
Unless otherwise exempted by Japanese law, this publication is distributed in Japan by or through RBC Capital Markets (Japan) Ltd., a registered type one financial
instruments firm and/or Royal Bank of Canada, Tokyo Branch, a licensed foreign bank.
.® Registered trademark of Royal Bank of Canada. RBC Capital Markets is a trademark of Royal Bank of Canada. Used under license.
Copyright © RBC Capital Markets, LLC 2015 - Member SIPC
Copyright © RBC Dominion Securities Inc. 2015 - Member CIPF
Copyright © RBC Europe Limited 2015
Copyright © Royal Bank of Canada 2015
All rights reserved
18
© Copyright 2026