
APC 2014 10K - Earnings Release - Anadarko Petroleum Corporation
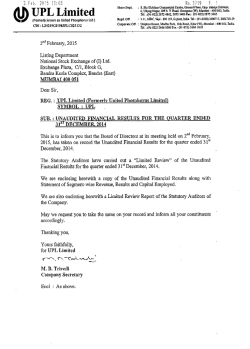
1
NEWS
ANADARKO ANNOUNCES 2014 FOURTH-QUARTER
AND FULL-YEAR RESULTS
HOUSTON, Feb. 2, 2015 - Anadarko Petroleum Corporation (NYSE: APC) today announced 2014
fourth-quarter results, reporting a net loss attributable to common stockholders of $395 million, or $0.78
per share (diluted). These results include certain items typically excluded by the investment community
in published estimates. In total, these items decreased net income by $582 million, or $1.15 per share
(diluted), on an after-tax basis.(1) Cash flow from operating activities in the fourth quarter of 2014 was
$1.952 billion, and discretionary cash flow totaled $2.412 billion.(2)
For the year ended Dec. 31, 2014, Anadarko reported a net loss attributable to common
stockholders of $1.750 billion, or $3.47 per share (diluted), which includes a net loss of $4.045 billion
associated with the settlement of the Tronox Adversary Proceeding, after tax. Full-year 2014 cash
flow from operating activities was $8.466 billion. Discretionary cash flow for the year totaled $9.404
billion.(2)
2014 HIGHLIGHTS
• Delivered sales-volume growth of more than 11 percent, increasing year-over-year sales volumes
by approximately 86,000 barrels of oil equivalent (BOE) per day on a divestiture-adjusted
basis (3)
• Achieved a reserve-replacement ratio of more than 160 percent at competitive costs
• Accelerated more than $2.5 billion of value through asset monetizations
• Achieved significant progress on several large-scale projects, highlighted by the recent startup of
the 80,000-barrels-of-oil-per-day (BOPD) Lucius spar in the deepwater Gulf of Mexico
“Anadarko’s fourth-quarter operating performance was a capstone to another terrific year for our
company,” said Anadarko Chairman, President and CEO Al Walker. “In 2014, we demonstrated the
quality of our portfolio by delivering results that exceeded the midpoint of our initial sales-volume
guidance by approximately 38,000 BOE per day,(3) while staying well within our initial range of capital
investment guidance and generating free cash flow.(2) This outperformance was primarily driven by
results in the Wattenberg field, where we enhanced efficiencies in our drilling and completions and
leveraged the competitive advantage of our expansive midstream infrastructure to significantly bolster
our growth. We believe our efficient allocation of capital, active portfolio management and commitment
2
to financial discipline position Anadarko to deliver differentiating performance in the challenging
current environment and as commodity prices recover.”
SALES VOLUMES AND PROVED RESERVES
Anadarko’s full-year sales volumes of natural gas, crude oil and natural gas liquids (NGLs) totaled a
record 306 million BOE, or an average of 838,000 BOE per day, on a divestiture-adjusted basis.(3)
Fourth-quarter 2014 sales volumes of natural gas, crude oil and NGLs totaled 79 million BOE, or an
average of 854,000 BOE per day.
Anadarko organically added 503 million BOE of proved reserves in 2014 before the effects of
price revisions and incurred oil and natural gas exploration and development costs of approximately
$8.8 billion.(2) The company estimates its proved reserves at year-end 2014 totaled approximately 2.86
billion BOE, with 69 percent of its reserves categorized as proved developed. At year-end 2014,
Anadarko’s proved reserves were comprised of 49 percent liquids and 51 percent natural gas.
U.S. ONSHORE HIGHLIGHTS
In 2014, Anadarko’s U.S. onshore operating areas achieved a 16-percent year-over-year increase in total
sales volumes, including an increase of 78,000 barrels per day in liquids volumes, and an approximate
50-percent increase, or 49,000 BOPD, in oil volumes on a divestiture-adjusted basis.(3) This growth was
driven by record production in several major growth plays, including the Wattenberg field, Eagleford
Shale and Wolfcamp Shale.
Anadarko’s Wattenberg field in Colorado continued to demonstrate excellent performance as the
company achieved year-over-year growth of approximately 55 percent, increasing sales volumes by
more than 60,000 BOE per day over its 2013 average of 109,000 BOE per day. Significant infrastructure
was placed in service in the field during the year, including the Lancaster cryogenic plant, Front Range
NGL pipeline and more than 300 million cubic feet per day of additional field compression. These
expansions, coupled with continued strong reservoir performance and enhanced drilling and completions
efficiencies, underpinned Wattenberg’s production growth.
In the Delaware Basin in West Texas, the company exited the year with ten operated rigs and
continued its successful evaluation of the extensive Wolfcamp Shale oil opportunity. Anadarko continues
to expand key infrastructure to facilitate future growth from the basin, including the integration of the
Nuevo Midstream assets acquired by Anadarko’s midstream limited partnership, Western Gas Partners,
LP (WES).
3
INTERNATIONAL AND DEEPWATER HIGHLIGHTS
In 2014, Anadarko advanced multiple significant mega projects and achieved a net production record at
the El Merk project in Algeria. The company commissioned the 80,000-BOPD Lucius facility in the
deepwater Gulf of Mexico and achieved first oil on Jan. 16, 2015 - just over three years from project
sanction. Also in the Gulf of Mexico, the 80,000-BOPD Heidelberg project remains on track for first oil
in 2016, as construction on the topsides is more than 70-percent complete, and two deepwater drilling
rigs are actively drilling development wells in the field. In addition, Anadarko’s non-operated 80,000barrels-per-day TEN development offshore Ghana also remains on schedule with first production
expected in 2016, and new gas-handling infrastructure was completed in the adjacent Jubilee field
during the fourth quarter, which is expected to enable increased oil production beginning in 2015.
During the fourth quarter, the Government of Mozambique gazetted the Decree Law, which is an
important step in providing the appropriate framework for a stable business environment for investors,
customers, financiers and construction contractors as Anadarko advances its large-scale LNG project.
Anadarko and its partners in Mozambique’s Offshore Area 1 have continued to advance long-term LNG
sales agreements with the recent addition of new non-binding Heads of Agreement (HOAs) with
customers in Asian markets. With these new agreements, the partners have HOAs in place covering a
total of more than 8 million tonnes per annum.
Anadarko also maintained an active exploration and appraisal program during the year, laying
the foundation for potential future mega projects. Appraisal activity offshore Côte d’Ivoire at the Paon
discovery and in the Gulf of Mexico at the Shenandoah discovery continued to validate the company’s
geologic models around these apparent commercial discoveries.
OPERATIONS REPORT
For additional details on Anadarko’s fourth-quarter 2014 operations and exploration program, please
refer to the comprehensive Operations Report available at www.anadarko.com.
FINANCIAL HIGHLIGHTS
Anadarko ended 2014 with approximately $7.4 billion of cash on hand and, subsequent to year-end, the
company remitted final payment to fully resolve the Tronox Adversary Proceeding, converted its secured
debt revolver to an unsecured facility and announced a commercial paper program.
During the year, the company generated approximately $150 million of free cash flow, including
$696 million of capital investments incurred by WES.(2) Anadarko also closed transactions to monetize
more than $2.5 billion of assets in 2014, including the $1.1 billion divestment of its China subsidiary,
4
the $500 million sale of its non-operated interest in the Vito Gulf of Mexico development, the $442
million Eaglebine carried-interest agreement, and most recently the $120 million divestiture of non-core
assets in the Midland Basin. This total does not include the previously announced $2.64 billion
Mozambique sell-down and $581 million Pinedale/Jonah divestiture. At year-end 2014, Anadarko’s net
debt to adjusted capitalization ratio was approximately 26 percent.(2)
CONFERENCE CALL TOMORROW AT 8 A.M. CST, 9 A.M. EST
Anadarko will host a conference call on Tuesday, Feb. 3, 2015, at 8 a.m. Central Standard Time (9 a.m.
Eastern Standard Time) to discuss fourth-quarter and full-year 2014 results. The dial-in number is
855.812.0464 in the U.S., or 970.300.2271 internationally. The confirmation number is 54428059. For
complete instructions on how to participate in the conference call, or to listen to the live audio webcast
and slide presentation, please visit www.anadarko.com. A replay of the call will be available on the
website for approximately 30 days following the conference call.
FINANCIAL DATA
Nine pages of summary financial data follow, including costs incurred, proved reserves and current
hedge positions.
(1)
See the accompanying table for details of certain items affecting comparability.
(2)
See the accompanying table for a reconciliation of GAAP to non-GAAP financial measures and a
statement indicating why management believes the non-GAAP financial measures provide useful
information for investors.
(3)
See the accompanying table for a reconciliation of “divestiture-adjusted” or “same-store” sales
volumes, which are intended to present performance of Anadarko’s continuing asset base, giving effect
to recent divestitures.
Anadarko Petroleum Corporation’s mission is to deliver a competitive and sustainable rate of return to
shareholders by exploring for, acquiring and developing oil and natural gas resources vital to the world’s
health and welfare. As of year-end 2014, the company had approximately 2.86 billion barrels-equivalent
of proved reserves, making it one of the world’s largest independent exploration and production
companies. For more information about Anadarko and APC Flash Feed updates, please visit
www.anadarko.com.
This news release contains forward-looking statements within the meaning of Section 27A of the Securities Act of
1933 and Section 21E of the Securities Exchange Act of 1934. Anadarko believes that its expectations are based
on reasonable assumptions. No assurance, however, can be given that such expectations will prove to have been
correct. A number of factors could cause actual results to differ materially from the projections, anticipated
results or other expectations expressed in this news release, including Anadarko’s ability to realize its
expectations regarding performance in this challenging economic environment, finalize year-end reserves, timely
complete and commercially operate the projects and drilling prospects identified in this news release, successfully
5
plan, secure necessary government approvals, finance, build and operate the necessary infrastructure and LNG
park and achieve production and budget expectations on its mega projects. See “Risk Factors” in the company’s
2013 Annual Report on Form 10-K, Quarterly Reports on Form 10-Q and other public filings and press releases.
Anadarko undertakes no obligation to publicly update or revise any forward-looking statements.
#
#
#
ANADARKO CONTACTS
MEDIA:
John Christiansen, [email protected], 832.636.8736
Stephanie Moreland, [email protected], 832.636.2912
Christina Ramirez, [email protected], 832.636.8687
INVESTORS:
John Colglazier, [email protected], 832.636.2306
Robin Fielder, [email protected], 832.636.1462
Jeremy Smith, [email protected], 832.636.1544
6
Anadarko Petroleum Corporation
Certain Items Affecting Comparability
millions except per-share amounts
Total gains (losses) on derivatives, net, less net cash from settlement
of commodity derivatives*
Gains (losses) on divestitures, net
Impairments, including unproved properties
Inventory impairments
Cash received in early settlement of oil derivatives
Litigation settlement
Interest expense related to Tronox settlement
Change in uncertain tax positions (FIN 48)
Quarter Ended December 31, 2014
Before
After
Per Share
Tax
Tax
(diluted)
(254) $
(303)
(548)
(60)
126
50
(22)
—
(1,011) $
$
$
(162) $
(192)
(346)
(38)
80
32
(14)
58
(582) $
(0.32)
(0.38)
(0.68)
(0.07)
0.16
0.06
(0.03)
0.11
(1.15)
* For the quarter ended December 31, 2014, this includes $40 million related to commodity derivatives, $(293) million related to other
derivatives, and $(1) million related to gathering, processing, and marketing sales.
millions except per-share amounts
Total gains (losses) on derivatives, net, less net cash from settlement
of commodity derivatives*
Gains (losses) on divestitures, net
Impairments
Third-party property well and platform decommissioning obligation
Tronox-related contingent loss
Change in uncertain tax positions (FIN 48)
Quarter Ended December 31, 2013
Before
After
Per Share
Tax
Tax
(diluted)
$
$
(52) $
(635)
(162)
(35)
(850)
—
(1,734) $
(34) $
(402)
(103)
(22)
(576)
(6)
(1,143) $
(0.07)
(0.80)
(0.21)
(0.04)
(1.14)
(0.01)
(2.27)
* For the quarter ended December 31, 2013, this includes $(155) million related to commodity derivatives, $111 million related to other
derivatives, and $(8) million related to gathering, processing, and marketing sales.
Reconciliation of GAAP to Non-GAAP Measures
Below are reconciliations of net income (loss) attributable to common stockholders (GAAP) to adjusted net income (loss) (nonGAAP), cash provided by operating activities (GAAP) to discretionary cash flow from operations (non-GAAP), as well as free
cash flow (non-GAAP) as required under Regulation G of the Securities Exchange Act of 1934. Management uses adjusted net
income (loss) to evaluate the Company’s operational trends and performance.
millions except per-share amounts
Net income (loss) attributable to common stockholders
Less certain items affecting comparability
Adjusted net income (loss)
Quarter Ended
Quarter Ended
December 31, 2014
December 31, 2013
After
Per Share
After
Per Share
Tax
(diluted)
Tax
(diluted)
(395) $
(0.78) $
$
(770) $
(1.53)
(582)
(1.15)
(1,143)
(2.27)
$
187 $
0.37 $
373 $
0.74
7
Anadarko Petroleum Corporation
Reconciliation of GAAP to Non-GAAP Measures
Management uses discretionary cash flow from operations because it is useful in comparisons of oil and gas exploration and
production companies as it excludes certain fluctuations in assets and liabilities and current taxes related to certain items affecting
comparability. Management uses free cash flow to demonstrate the Company’s ability to internally fund capital expenditures
and to service or incur additional debt.
millions
Net cash provided by operating activities
Add back
Algeria exceptional profits tax settlement
Increase (decrease) in accounts receivable
(Increase) decrease in accounts payable and accrued expenses
Other items—net
Certain nonoperating and other excluded items
Current taxes related to asset monetizations
Discretionary cash flow from operations
millions
Discretionary cash flow from operations
Less capital expenditures*
Free cash flow
Quarter Ended
December 31,
2014
2013
$
1,952 $
2,104
$
—
1
703
(153)
4
(95)
2,412 $
Year Ended
December 31,
2014
2013
$
8,466 $
8,888
—
257
(187)
(168)
43
—
2,049 $
—
(103)
(7)
81
29
938
9,404 $
(730)
11
(150)
(146)
160
—
8,033
Quarter Ended
Year Ended
December 31,
December 31,
2014
2014
2013
2013
$
2,412 $
9,404 $
2,049 $
8,033
2,169
9,256
2,612
8,523
$
243 $
148 $
(563) $
(490)
* Includes Western Gas Partners, LP (WES) capital expenditures of $206 million for the quarter ended December 31, 2014, $170 million
for the quarter ended December 31, 2013, $696 million for the year ended December 31, 2014, and $792 million for the year ended
December 31, 2013.
8
Anadarko Petroleum Corporation
Reconciliation of GAAP to Non-GAAP Measures
Presented below are reconciliations of costs incurred (GAAP) to oil and natural gas exploration and development costs (nonGAAP) and total debt (GAAP) to net debt (non-GAAP). Management believes oil and natural gas exploration and development
costs is a more accurate reflection of the expenditures incurred during the current year, excluding certain obligations to be paid
in future periods. Management uses net debt as a measure of the Company’s outstanding debt obligations that would not be
readily satisfied by its cash and cash equivalents on hand.
Year Ended
December 31,
2014
$
8,712
(347)
millions
Costs incurred
Asset retirement obligation liabilities incurred
Cash expenditures for asset retirement obligations
Oil and natural gas exploration and development costs
$
443
8,808
December 31, 2014
millions
Total debt
Less cash and cash equivalents
Net debt
millions
Net debt
Total equity
Adjusted capitalization
Net debt to adjusted capitalization ratio
Anadarko
Consolidated
$
15,092
7,369
$
7,723
WGP*
Consolidated
$
2,423
67
$
2,356
Anadarko
excluding
WGP
$
12,669
7,302
$
5,367
Anadarko
Consolidated
$
7,723
22,318
$
30,041
Anadarko
excluding
WGP
$
5,367
19,725
$
25,092
26%
21%
* Western Gas Equity Partners, LP (WGP) is a publicly traded consolidated subsidiary of Anadarko and WES is a consolidated subsidiary
of WGP.
9
Anadarko Petroleum Corporation
(Unaudited)
Summary Financial Information
millions except per-share amounts
Consolidated Statements of Income
Revenues and Other
Natural-gas sales
Oil and condensate sales
Natural-gas liquids sales
Gathering, processing, and marketing sales
Gains (losses) on divestitures and other, net
Total
Costs and Expenses
Oil and gas operating
Oil and gas transportation and other
Exploration
Gathering, processing, and marketing
General and administrative
Depreciation, depletion, and amortization
Other taxes
Impairments
Algeria exceptional profits tax settlement
Deepwater Horizon settlement and related costs
Total
Operating Income (Loss)
Other (Income) Expense
Interest expense
(Gains) losses on derivatives, net
Other (income) expense, net
Tronox-related contingent loss
Total
Income (Loss) Before Income Taxes
Income Tax Expense (Benefit)
Net Income (Loss)
Net Income (Loss) Attributable to Noncontrolling Interests
Net Income (Loss) Attributable to Common Stockholders
Per Common Share
Net income (loss) attributable to common stockholders—basic
Net income (loss) attributable to common stockholders—diluted
Average Number of Common Shares Outstanding—Basic
Average Number of Common Shares Outstanding—Diluted
Exploration Expense
Dry hole expense
Impairments of unproved properties
Geological and geophysical expense
Exploration overhead and other
Total
Quarter Ended
December 31,
2014
2013
$
$
$
$
$
$
Year Ended
December 31,
2014
2013
811 $
1,982
351
278
(245)
3,177
841 $
2,417
373
289
(582)
3,338
3,849
9,748
1,572
1,206
2,095
18,470
310
315
639
259
332
1,215
263
322
—
1
3,656
(479)
323
259
615
231
303
969
258
162
—
3
3,123
215
1,171
1,184
1,639
1,030
1,316
4,550
1,244
836
—
97
13,067
5,403
199
(256)
8
22
(27)
(452)
(102)
(350)
45
(395) $
173
(5)
20
850
1,038
(823)
(98)
(725)
45
(770) $
772
197
20
4,360
5,349
54
1,617
(1,563)
187
(1,750) $
686
(398)
89
850
1,227
2,106
1,165
941
140
801
(0.78) $
(0.78) $
507
507
(1.53) $
(1.53) $
504
504
(3.47) $
(3.47) $
506
506
1.58
1.58
502
505
235
267
75
62
639
$
$
255
186
97
77
615
$
$
762
483
168
226
1,639
$
3,388
9,178
1,262
1,039
(286)
14,581
1,092
1,022
1,329
869
1,090
3,927
1,077
794
33
15
11,248
3,333
$
$
556
308
208
257
1,329
10
Anadarko Petroleum Corporation
(Unaudited)
Quarter Ended
December 31,
2014
2013
Summary Financial Information
millions
Cash Flows from Operating Activities
Net income (loss)
Adjustments to reconcile net income (loss) to net cash
provided by operating activities
Depreciation, depletion, and amortization
Deferred income taxes
Dry hole expense and impairments of unproved properties
Impairments
(Gains) losses on divestitures, net
Total (gains) losses on derivatives, net
Operating portion of net cash received (paid) in settlement
of derivative instruments
Other
Changes in assets and liabilities
Deepwater Horizon settlement and related costs
Algeria exceptional profits tax settlement
Tronox-related contingent loss
(Increase) decrease in accounts receivable
Increase (decrease) in accounts payable and accrued
expenses
Other items—net
Net Cash Provided by Operating Activities
$
Capital Expenditures
millions
Condensed Balance Sheets
Cash and cash equivalents
Accounts receivable, net of allowance
Other current assets
Net properties and equipment
Other assets
Goodwill and other intangible assets
Total Assets
Other current liabilities
Deepwater Horizon settlement and related costs
Tronox-related contingent liability
Long-term debt
Deferred income taxes
Other long-term liabilities
(350) $
Year Ended
December 31,
2014
2013
(725) $
(1,563) $
1,215
115
502
322
303
(255)
969
(445)
441
162
635
4
4,550
(95)
1,245
836
(1,891)
207
509
123
48
72
(3)
—
22
(1)
$
(703)
153
1,952 $
187
168
2,104
$
2,169
2,612
$
$
Stockholders’ equity
Noncontrolling interests
Total Equity
Total Liabilities and Equity
Capitalization
Total debt
Total equity
Total
Capitalization Ratios
Total debt
Total equity
$
$
$
$
85
246
90
—
4,360
103
(2)
730
850
(11)
$
7
(81)
8,466 $
150
146
8,888
$
9,256
8,523
December 31,
2014
$
3,927
90
864
794
470
(392)
371
327
(5)
—
850
(257)
941
$
December 31,
2013
7,369
2,537
1,325
41,552
2,310
6,606
61,699
4,934
90
5,210
15,092
9,259
4,796
19,725
2,593
22,318
61,699
$
15,092
22,318
37,410
$
40%
60%
$
$
$
$
3,698
2,722
688
40,929
2,082
5,662
55,781
5,703
—
—
13,065
9,245
4,118
21,857
1,793
23,650
55,781
13,565
23,650
37,215
36%
64%
11
Anadarko Petroleum Corporation
(Unaudited)
Sales Volumes and Prices
Average Daily Sales Volumes
Crude Oil &
Natural Gas
Condensate
NGLs
MMcf/d
MBbls/d
MBbls/d
Sales Volumes
Crude Oil &
Natural Gas
Condensate
Bcf
MMBbls
Average Sales Price
Crude Oil &
Natural Gas
Condensate
NGLs
Per Mcf
Per Bbl
Per Bbl
NGLs
MMBbls
Quarter Ended December 31, 2014
United States
Algeria
Other International
Total
2,549
—
—
2,549
220
70
10
300
119
10
—
129
234
—
—
234
20
6
1
27
12
1
—
13
$
Quarter Ended December 31, 2013
United States
Algeria
Other International
Total
2,643
—
—
2,643
167
62
36
265
100
—
—
100
243
—
—
243
16
6
3
25
9
—
—
9
$
Year Ended December 31, 2014
United States
Algeria
Other International
Total
2,589
—
—
2,589
203
66
23
292
116
3
—
119
945
—
—
945
74
24
8
106
43
1
—
44
$
Year Ended December 31, 2013
United States
Algeria
Other International
Total
2,652
—
—
2,652
158
55
35
248
91
—
—
91
968
—
—
968
58
20
13
91
33
—
—
33
$
Average Daily Sales Volumes
MBOE/d
Sales Volumes
MMBOE
Quarter Ended December 31, 2014
Quarter Ended December 31, 2013
854
806
79
74
Year Ended December 31, 2014
Year Ended December 31, 2013
843
781
308
285
$
$
$
$
3.46
—
—
3.46
$
3.46
—
—
3.46
$
4.07
—
—
4.07
$
3.50
—
—
3.50
$
$
$
$
$
68.66
79.80
81.64
71.67
$
93.01
109.18
110.56
99.20
$
87.99
98.53
103.42
91.58
$
97.02
109.20
109.07
101.41
$
$
$
$
$
27.57
54.02
—
29.63
40.30
—
—
40.30
35.48
56.16
—
36.01
37.97
—
—
37.97
Sales Revenue and Commodity Derivatives
millions
Quarter Ended December 31, 2014
United States
Algeria
Other International
Total
Quarter Ended December 31, 2013
United States
Algeria
Other International
Total
Year Ended December 31, 2014
United States
Algeria
Other International
Total
Year Ended December 31, 2013
United States
Algeria
Other International
Total
Sales
Crude Oil &
Condensate
Natural Gas
$
$
$
$
$
$
$
$
811
—
—
811
$
841
—
—
841
$
3,849
—
—
3,849
$
3,388
—
—
3,388
$
$
$
$
$
Net Cash Received (Paid) from Settlement of Commodity Derivatives
Crude Oil &
Natural Gas
Condensate
NGLs
NGLs
1,394
514
74
1,982
$
1,426
618
373
2,417
$
6,519
2,372
857
9,748
$
5,601
2,184
1,393
9,178
$
$
$
$
$
301
50
—
351
$
373
—
—
373
$
1,509
63
—
1,572
$
1,262
—
—
1,262
$
$
$
$
$
22
—
—
22
$
42
—
—
42
$
(85)
—
—
(85)
$
133
—
—
133
$
$
$
$
$
149
335
—
484
8
(3)
—
5
$
$
$
$
81
375
—
456
$
(53)
6
—
(47)
$
$
$
3
—
—
3
2
—
—
2
6
—
—
6
9
—
—
9
12
Anadarko Petroleum Corporation
Estimated Year-End Proved Reserves 2012 - 2014
MMBOE
2014
2013
2012
Proved Reserves
Beginning of year
Reserves additions and revisions
Discoveries and extensions
Infill-drilling additions
Drilling-related reserves additions and revisions
Other non-price-related revisions
Net organic reserves additions
Acquisition of proved reserves in place
Price-related revisions
Total reserves additions and revisions
Sales in place
Production
End of year
Proved Developed Reserves
Beginning of year
End of year
2,792
2,560
2,539
63
577
640
(137)
145
410
555
(40)
82
383
465
(31)
503
—
(1)
515
36
(23)
434
4
(68)
502
(124)
(312)
528
(12)
(284)
370
(81)
(268)
2,858
2,792
2,560
2,003
1,969
1,883
2,003
1,811
1,883
13
Anadarko Petroleum Corporation
Commodity Hedge Positions
As of February 2, 2015
Volume
(thousand
MMBtu/d)
Natural Gas
Three-Way Collars
2015
Extendable Fixed Price Financial
2015*
Weighted Average Price per MMBtu
Floor Sold
635
$
2.75
170
$
4.17
Floor Purchased
$
3.75
Ceiling Sold
$
4.76
__________________________________________________________________
*
Includes an option for the counterparty to extend the contract term to December 2016 at the same price.
Interest Rate Derivatives
As of February 2, 2015
Instrument
Swap
Swap
Notional Amt.
$50 Million
$1,850 Million
Start Date
Sept. 2016
Sept. 2016
Maturity
Sept. 2026
Sept. 2046
Rate Paid
5.91%
6.05%
Rate Received
3M LIBOR
3M LIBOR
14
Anadarko Petroleum Corporation
Reconciliation of Same-Store Sales
Average Daily Sales Volumes
Quarter Ended December 31, 2014
Quarter Ended December 31, 2013
Crude Oil &
U.S. Onshore
Deepwater Gulf of Mexico
International and Alaska
Same-Store Sales
China and Pinedale/Jonah
Total
Crude Oil &
Natural Gas
Condensate
NGLs
Total
Natural Gas
Condensate
NGLs
MMcf/d
MBbls/d
MBbls/d
MBOE/d
MMcf/d
MBbls/d
MBbls/d
165
113
673
2,353
108
90
590
179
47
6
83
208
47
6
88
—
88
10
98
1
101
—
101
2,549
300
129
854
2,562
256
96
779
—
—
—
—
81
9
4
27
2,549
300
129
854
2,643
265
100
806
Year Ended December 31, 2013
Crude Oil &
Deepwater Gulf of Mexico
International and Alaska
Same-Store Sales
China and Pinedale/Jonah
Total
MBOE/d
2,370
Year Ended December 31, 2014
U.S. Onshore
Total
Crude Oil &
Natural Gas
Condensate
NGLs
Total
Natural Gas
Condensate
NGLs
Total
MMcf/d
MBbls/d
MBbls/d
MBOE/d
MMcf/d
MBbls/d
MBbls/d
MBOE/d
2,387
149
111
658
2,304
100
82
566
196
45
5
83
263
46
6
96
—
94
3
97
—
90
—
90
2,583
288
119
838
2,567
236
88
752
6
4
—
5
85
12
3
29
2,589
292
119
843
2,652
248
91
781


© Copyright 2026