
Modeling cellulase kinetics on lignocellulosic substrates
Biotechnology Advances 27 (2009) 833–848
Contents lists available at ScienceDirect
Biotechnology Advances
j o u r n a l h o m e p a g e : w w w. e l s ev i e r. c o m / l o c a t e / b i o t e c h a d v
Research review paper
Modeling cellulase kinetics on lignocellulosic substrates
Prabuddha Bansal, Mélanie Hall, Matthew J. Realff, Jay H. Lee, Andreas S. Bommarius ⁎
School of Chemical and Biomolecular Engineering, Georgia Institute of Technology, 311 Ferst Drive, N.W., Atlanta, GA 30332-0100, USA
a r t i c l e
i n f o
Article history:
Received 19 February 2009
Received in revised form 19 June 2009
Accepted 20 June 2009
Available online 3 July 2009
Keywords:
Lignocellulose
Cellulose
Cellulase
Enzymatic hydrolysis
Adsorption
Crystallinity
Accessibility
Fractal kinetics
Synergism
Kinetic model
a b s t r a c t
The enzymatic hydrolysis of cellulose to glucose by cellulases is one of the major steps involved in the conversion
of lignocellulosic biomass to yield biofuel. This hydrolysis by cellulases, a heterogeneous reaction, currently suffers
from some major limitations, most importantly a dramatic rate slowdown at high degrees of conversion. To render
the process economically viable, increases in hydrolysis rates and yields are necessary and require improvement
both in enzymes (via protein engineering) and processing, i.e. optimization of reaction conditions, reactor design,
enzyme and substrate cocktail compositions, enzyme recycling and recovery strategies. Advances in both areas in
turn strongly depend on the progress in the accurate quantification of substrate–enzyme interactions and causes
for the rate slowdown. The past five years have seen a significant increase in the number of studies on the kinetics
of the enzymatic hydrolysis of cellulose. This review provides an overview of the models published thus far,
classifies and tabulates these models, and presents an analysis of their basic assumptions. While the exact
mechanism of cellulases on lignocellulosic biomass is not completely understood yet, models in the literature
have elucidated various factors affecting the enzymatic rates and activities. Different assumptions regarding ratelimiting factors and basic substrate–enzyme interactions were employed to develop and validate these models.
However, the models need to be further tested against additional experimental data to validate or disprove any
underlying hypothesis. It should also provide better insight on additional parameters required in the case that
more substrate and enzyme properties are to be included in a model.
© 2009 Elsevier Inc. All rights reserved.
Contents
1.
2.
Introduction . . . . . . . . . . . . . . . . . . . . . . . . . .
Model classes and classification . . . . . . . . . . . . . . . . .
2.1.
Empirical models . . . . . . . . . . . . . . . . . . . .
2.2.
Michaelis–Menten based models . . . . . . . . . . . . .
2.3.
Adsorption in cellulose hydrolysis models . . . . . . . . .
2.4.
Models on soluble cello-oligosaccharides . . . . . . . . .
3.
Rate limitations and decreasing rates with increasing conversion .
3.1.
Enzyme deactivation. . . . . . . . . . . . . . . . . . .
3.2.
Two-phase substrate. . . . . . . . . . . . . . . . . . .
3.3.
Substrate reactivity . . . . . . . . . . . . . . . . . . .
3.4.
Substrate accessibility . . . . . . . . . . . . . . . . . .
3.5.
Role of fractal kinetics in cellulase kinetics . . . . . . . .
4.
Modeling synergism of cellulase components . . . . . . . . . .
5.
Models of pure cellulosic substrates and lignocellulosic substrates
6.
Conclusions and outlook . . . . . . . . . . . . . . . . . . . .
Acknowledgment . . . . . . . . . . . . . . . . . . . . . . . . . .
References . . . . . . . . . . . . . . . . . . . . . . . . . . . . .
.
.
.
.
.
.
.
.
.
.
.
.
.
.
.
.
.
.
.
.
.
.
.
.
.
.
.
.
.
.
.
.
.
.
.
.
.
.
.
.
.
.
.
.
.
.
.
.
.
.
.
.
.
.
.
.
.
.
.
.
.
.
.
.
.
.
.
.
.
.
.
.
.
.
.
.
.
.
.
.
.
.
.
.
.
.
.
.
.
.
.
.
.
.
.
.
.
.
.
.
.
.
.
.
.
.
.
.
.
.
.
.
.
.
.
.
.
.
.
.
.
.
.
.
.
.
.
.
.
.
.
.
.
.
.
.
.
.
.
.
.
.
.
.
.
.
.
.
.
.
.
.
.
.
.
.
.
.
.
.
.
.
.
.
.
.
.
.
.
.
.
.
.
.
.
.
.
.
.
.
.
.
.
.
.
.
.
.
.
.
.
.
.
.
.
.
.
.
.
.
.
.
.
.
.
.
.
.
.
.
.
.
.
.
.
.
.
.
.
.
.
.
.
.
.
.
.
.
.
.
.
.
.
.
.
.
.
.
.
.
.
.
.
.
.
.
.
.
.
.
.
.
.
.
.
.
.
.
.
.
.
.
.
.
.
.
.
.
.
.
.
.
.
.
.
.
.
.
.
.
.
.
.
.
.
.
.
.
.
.
.
.
.
.
.
.
.
.
.
.
.
.
.
.
.
.
.
.
.
.
.
.
.
.
.
.
.
.
.
.
.
.
.
.
.
.
.
.
.
.
.
.
.
.
.
.
.
.
.
.
.
.
.
.
.
.
.
.
.
.
.
.
.
.
.
.
.
.
.
.
.
.
.
.
.
.
.
.
.
.
.
.
.
.
.
.
.
.
.
.
.
.
.
.
.
.
.
.
.
.
.
.
.
.
.
.
.
.
.
.
.
.
.
.
.
.
.
.
.
.
.
.
.
.
.
.
.
.
.
.
.
.
.
.
.
.
.
.
.
.
.
.
.
.
.
.
.
.
.
.
.
.
.
.
.
.
.
.
.
.
.
.
.
.
.
.
.
.
.
.
.
.
.
.
.
.
.
.
.
.
.
.
.
.
.
.
.
.
.
.
.
.
.
.
.
.
.
.
.
.
.
.
.
.
.
.
.
.
.
.
.
.
.
.
.
.
.
.
.
.
.
.
.
.
.
.
.
.
.
.
.
.
.
.
.
.
.
.
.
.
.
.
.
.
.
.
.
.
.
.
.
.
.
.
.
.
.
.
.
.
.
.
.
.
.
.
.
.
.
.
.
.
.
.
.
.
.
.
.
.
.
.
.
.
.
.
.
.
.
.
.
.
.
.
.
.
.
.
.
.
.
.
.
.
.
.
.
.
.
.
.
.
.
.
.
.
.
.
.
.
.
.
833
834
834
838
839
840
841
841
841
842
842
843
844
845
845
846
846
1. Introduction
⁎ Corresponding author. Tel.: +1 404 385 1334; fax: +1 404 894 2295.
E-mail address: [email protected] (A.S. Bommarius).
0734-9750/$ – see front matter © 2009 Elsevier Inc. All rights reserved.
doi:10.1016/j.biotechadv.2009.06.005
The possibility of deriving fuel from the largest carbon source on
Earth — lignocellulose in various forms, such as grass, wood, trees or
husks — has resulted in large investments in the biofuel industry in
834
P. Bansal et al. / Biotechnology Advances 27 (2009) 833–848
recent past (Schubert, 2006; Sheridan, 2008; Waltz, 2007). Ethanol
derived from lignocellulose is produced via four major consecutive
steps: pretreatment, hydrolysis, fermentation, and separation. It has
been recognized by experts that major improvements have to be
made in the enzymatic hydrolysis of cellulosic biomass for cellulosic
ethanol to compete economically with corn ethanol and petroleumderived gasoline (Galbe and Zacchi, 2002; Lynd et al., 2008; Sun and
Cheng, 2002). Main challenges include decreasing rates, high cellulase costs, and little understanding of cellulase kinetics on lignocellulosic substrates. The advantages of enzymatic hydrolysis of
cellulose over other hydrolysis methods such as acid hydrolysis are
lower utility (cooling water, gas, electricity) and disposal costs and
no corrosion issues for equipment (Sun and Cheng, 2002). The huge
investments are mainly driven by the potential reduction in the cost
of cellulosic ethanol as projected by advances in cellulase-based
technology (Lynd et al., 2008). Cost-competitive technology can be
developed by improving the cellulase machinery as well as by
rendering the cellulosic substrates more susceptible to hydrolysis
(Himmel et al., 2007). To do so, it is first necessary to understand the
enzyme–substrate interactions and both identify and quantify the
contribution of various system properties to the hydrolysis process.
Cellulose is degraded synergistically into glucose by three types of
cellulases: endoglucanases (EC 3.2.1.4), that randomly cleave β-1,4glycosidic bonds on cellulose chains away from chain ends,
cellobiohydrolases (EC 3.2.1.91), that produce cellobiose by attacking cellulose from chain ends (Cel7A (cellobiohydrolase I), acts from
the reducing ends, and Cel6A (cellobiohydrolase II) acts from the
non-reducing ends of the cellulose chains) as well as β-glucosidases
(EC 3.2.1.21) that convert cellobiose to glucose (Henrissat, 1994;
Lynd et al., 2002; Rabinovich et al., 2002; Teeri, 1997; Zhang and
Lynd, 2004).
Experimental data on cellulose hydrolysis by cellulases point to
various bottlenecks that contribute to decreasing rates with conversion (see Section 3). To deconvolute the data, mathematical modeling
of the hydrolysis process is an important tool. A robust model is also
needed to develop rate expressions that can be incorporated into
process models required for large-scale biofuels production. Recent
works on simultaneous saccharification and fermentation (SSF) (Shao
et al., 2009a,b) have shown how kinetic models can be used for
modeling staged reactor configurations with different feeding
frequencies of the reaction mixture. Fed-batch strategies have also
been developed for the enzymatic hydrolysis of cellulose (Hodge et al.,
2009). Further improvement of cellulase kinetics will be guided by the
relative importance of physical parameters of the model, such as those
associated with adsorption or surface accessibility. To find and
alleviate bottlenecks, the kinetic and the physical parameters in the
model have to be estimated correctly.
The current paper reviews the various published models of
enzymatic hydrolysis of both pure cellulosic and lignocellulosic
materials, and gives an analysis of their key aspects as well as their
shortcomings to highlight their role in advancing our understanding
of this field. The experimental data present in the literature are
discussed, with the aim of understanding the kinetics and ratelimiting causes. We also discuss the experimental data that could be
generated to distinguish between the hypotheses regarding the
decreasing rates. Lee et al. (1980) in 1980 reviewed the models
published up to that point. Zhang and Lynd (2004) discussed the
potential use of various models in literature, based on the number of
substrate and enzyme variables considered. Both these articles
concluded that to achieve a more detailed and phenomenological
understanding of the hydrolysis process, more substrate and enzyme
properties have to be considered in the kinetic models. While models
which do so would be more robust, they would require more
experimental data for validation due to the increase in the number
of variables and parameters. In any case, the two main challenges of
modeling the cellulose hydrolysis process are i) to gain a more
fundamental understanding of the relevant enzyme and substrate
variables (substrate-concentration, degree of polymerization, accessibility, adsorption capacity, size distribution of chains, crystallinity;
enzyme-concentration, cellulase composition, adsorbed cellulase
concentration, synergism), and ii) to identify rate-limiting factors.
Since the last review in 2004 (Zhang and Lynd, 2004), about thirty
more works have been published on kinetic modeling of cellulose
bioconversion. This is more than one third of the number of works in
the literature on kinetic modeling of cellulose hydrolysis by cellulases.
Given the recent enthusiasm in biofuels, we believe that the time has
arrived for another review on the subject.
Product inhibition of cellulases (by cellobiose) is a phenomenon
that can be quantified by independent experiments and can be
alleviated with an excess of β-glucosidase (Bommarius et al., 2008).
The overall structure of the kinetic models of enzymatic hydrolysis of
cellulose and lignocellulose is not affected by the inclusion of product
inhibition parameters. The phenomenon has been previously
reviewed in 2002 (Lynd et al., 2002) and 2004 (Zhang and Lynd,
2004), and the state of the art in modeling product inhibition has not
advanced since then. Therefore, in this article we do not discuss the
various expressions used for product inhibition. However, we also
discuss the incorporation of adsorption of cellulases on cellulosic
substrates into the various models and the interchangeability of
models for pure cellulosic vs. lignocellulosic substrates.
2. Model classes and classification
Biohydrolysis of cellulose, due its heterogeneous nature, involves
more steps than classical enzyme kinetics. The major steps are (Fig. 1):
1. Adsorption of cellulases onto the substrate via the binding domain
(Ståhlberg et al., 1991),
2. Location of a bond susceptible to hydrolysis on the substrate surface
(Jervis et al., 1997) (chain end if cellobiohydrolase, cleavable bond if
endoglucanase),
3. Formation of enzyme–substrate complex (by threading of the chain
end into the catalytic tunnel if cellobiohydrolase, to initiate hydrolysis) (Divne et al., 1998; Mulakala and Reilly, 2005),
4. Hydrolysis of the β-glycosidic bond and simultaneous forward
sliding of the enzyme along the cellulose chain (Divne et al., 1998;
Mulakala and Reilly, 2005),
5. Desorption of cellulases from the substrate or repetition of step 4 or
steps 2/3 if only the catalytic domain detaches from chain,
6. Hydrolysis of cellobiose to glucose by β-glucosidase (if present in
the enzyme mixture). In addition, product inhibition (Bezerra and
Dias, 2005; Holtzapple et al., 1990; Xiao et al., 2004; Yue et al.,
2004) and changes in the substrate properties along the course of
hydrolysis affect the above steps (see Section 3).
Based on the fundamental approach and methodology used, the
models can broadly be divided into four classes: empirical models
(Section 2.1.), Michaelis–Menten based models (Section 2.2.), models
accounting for adsorption (Section 2.3.), and those models developed
for soluble substrates (Section 2.4.) (see Tables 1A–D). In addition,
there are two models in the literature based on jamming and fractal
kinetics (discussed in Section 3.5).
2.1. Empirical models
Empirical models help in quantifying the effects of various substrate
and enzyme properties on hydrolysis. Table 1A provides a list of
empirical models in the literature, along with their predicted and
independent variables. These empirical models have been generally
used to correlate hydrolysis with either the structural properties of the
substrate or with time (Table 1A). Though empirical models are not
applicable outside the conditions under which they are developed and
P. Bansal et al. / Biotechnology Advances 27 (2009) 833–848
835
Fig. 1. Steps 1 to 4 for a cellobiohydrolase acting on a cellulosic substrate (not drawn to scale). For endoglucanase, steps 2 and 3 are different as it does not require chain ends to act on.
Step 1 — Adsorption, step 2 — location of chain end, step 3 — formation of enzyme–substrate complex, and step 4 — hydrolysis of the β-glycosidic bond. (Note: In step 3, some authors
have suggested the possibility for the cellulose chain to thread into the catalytic domain by going over the binding domain (Reinikainen et al., 1992). Insufficient experimental
evidence is available yet to determine the exact mechanism).
do not provide any insight into the mechanistic details of the process,
they are helpful in numerous ways:
a) They can help in understanding the interactions between the
substrate properties. It has been shown that the effects of an
individual substrate property such as crystallinity, lignin content, or
acetyl content can depend on the levels of the other two (Chang and
Holtzapple, 2000; Kim and Holtzapple, 2006; O'Dwyer et al., 2008).
b) Empirical models can be useful for initial rate estimations, which are
important for resuspension experiments (described in Sections 3.2
and 3.3) and Lineweaver–Burk plots (Lineweaver and Burk, 1934)
used in the Michaelis–Menten models. The rate of hydrolysis
Table 1A
Empirical models (BG–β-glucosidase).
Reference
Y (predicted variable)
X (independent variable)
Substrate
Enzyme source
Validation range
of conversion (%)
Gharpuray et al.
(1983)
Ohmine et al.
(1983)
Sattler et al.
(1989)
Koullas et al.
(1992)
Extent of hydrolysis
(after 8 h)
Conversion
Crystallinity, lignin, specific
surface area
Time
Pretreated winter crop wheat
straw
Avicel
T. reesei
b70
T. viride
N70
Conversion
Time, fractions of easily and
difficult hydrolysable part
Time, lignin, crystallinity
Pretreated poplar wood
Ooshima et al.
(1991)
Kurakake et al.
(1995)
Parajó et al.
(1996)
Tarantili et al.
(1996)
Conversion, hydrolysis
rate, adsorbed enzyme
Conversion, hydrolysis
rate, adsorbed enzyme
Conversion
Moldes et al.,
(1999)
Maximum rate of cellulose
conversion, max. rate of
glucose generation
1 h and final conversions
of glucan and xylan content
Chang and
Holtzapple
(2000)
Park et al. (2002)
Laureano-Perez
et al. (2005)
Kim and
Holtzapple
(2006)
Vásquez et al.
(2007)
Berlin et al.
(2007)
O'Dwyer et al.
(2008)
Kim et al.
(2008)
Zhou et al.
(2009)
Conversion, maximum
conversion
Conversion
Conversion
Initial hydrolysis rate, 72 h
extent of hydrolysis
Hydrolysis yields of glucan,
xylan and holocellulose
Glucose concentration
Glucan to glucose and xylan
to xylose conversion
Slopes and intercepts of the
graphs of 1 h, 6, 72 h glucan
content vs enzyme loading
Reducing sugar concentration,
ethanol concentration
Glucose produced after 72 h
hydrolysis
Time
Time
Time, fractions of easily and
difficult hydrolysable parts
Time, maximum conversion,
time for achieving half of
maximum conversion
Enzyme to substrate ratio,
liquor to solid ratio
Celluclast + BG (Novo,
Denmark)
Ball milled Avicel, ball milled alkali- Fusarium oxysporum
treated straw, ball milled wheat
straw, alkali-treated wheat straw
Avicel
T. viride
N70
Avicel, pretreated Wilner
hardwood
NaOH pretreated pine wood
T. reesei, T. viride
N70
T. reesei + BG
b70
Ball milled Avicel, filter paper,
Greek purified cotton and hotalkali-delignified wheat straw
Pretreated wood chips
Fusarium oxysporum and
Neurospora crassa
b70
Celluclast (Novo Denmark)
b70
N70
Waste office paper
Corn Stover
Cytolase (cellulase from
Environmental BioTechnologies,
Santa Rosa, CA) + BG
T. viride, Acremonium cellulolyticus
Cellulase from NREL + BG
N70
N70
b70
Lignin content, acetyl content,
glucan content, crystallinity
index
Time, enzyme concentration
Crystallinity, Spectroscopic
features
Residual lignin
Hybrid poplar, bagasse and
switchgrass
Pretreated corn stover
Spezyme CP from NREL + BG
pH, enzyme loading,
temperature, solid percentage
Weights of xylanse, pectinase
and β-glucosidase
Acid hydrolyzed sugarcane
bagasse
Milled corn stover, dilute acid
pretreated corn stover
Crystallinity, lignin and
acetyl content
Pretreated poplar wood
GC 220 (Genencor
b70
International, Inc.)
Celluclast 1.5L +BG (Novozymes), N70
xylanse and pectinase (Genencor
International)
T. reesei
N70
pH, temperature, enzyme
Food waste
inoculation, reaction time
Concentrations of Cel7A, Cel6A, Steam-exploded corn stover
Cel6B, Cel7B,Cel12A, Cel61A
(In bold are shown the assumptions regarding the decrease in rates).
Spirizyme Plus FG
(Novozymes, Denmark)
T. viride (Cel7A, Cel6A, Cel6B,
Cel7B, Cel12A, Cel61A) + BG
N70
N70
–
b70
836
P. Bansal et al. / Biotechnology Advances 27 (2009) 833–848
Table 1B
Adsorption and Michaelis – Menten based models (M-M: Michaelis – Menten, PI — Product inhibition, QSS — Quasi Steady State assumption, Ads — Adsorption based approach, BG –
β-glucosidase).
Reference
Methodology
Substrate
Enzyme source (purified
component if any)
Declining rate reason
(in addition to PI)
Conversion range for
validation
Huang (1975)
Suga et al. (1975)
Howell and Stuck
(1975)
Maguire (1977)
Ads, QSS
M-M
M-M
Amorphous Solka Floc
Theoretical study
Solka Floc
T. viride
–
N 70%
T. viride
–
b 70%
Ads
Alpha cellulose fiber
–
b 70%
Howell (1978)
Okazaki and
Moo-Young (1978)
Peiterson and
Edward Ross (1979)
QSS
QSS, M-M
Solka Floc
Analytical Study
T. viride Cellobiohydrolase
(then known as the C1
enzyme)
T. viride
Enzyme inactivation
b 70%
Ball milled delignified
cellulose
T. reesei + BG
two phases − crystalline +
amorphous
b 70%
Ryu et al. (1982)
M-M, two phases −
crystalline +
amorphous
Ads, M-M
T. reesei
Ads
Asenjo (1983);
Asenjo (1984)
Beltrame et al. (1984)
Ads
Solka Floc
T. viride
M-M
T. viride + BG
Holtzapple et al. (1984)
Ads, QSS
Textile, cotton waste,
pretreated pulp
Solka Floc
Accessibility decreases with
increase in CrI
Decrease in Substrate
reactivity
Only a fraction is available
for attack (really a reason?)
–
b 70%
Fan and Lee (1983)
Solka Floc, Avicel,
adsorbant cotton
Solka Floc
b 70%
Scheiding et al. (1984)
M-M
Avicel
T. reesei + BG
Wald et al. (1984)
Rice straw
T. reesei + BG
Caminal et al. (1985)
Ads, QSS, Apparent
rate order
M-M
Accessibility is included as
a parameter
Enzyme deactivation,
amorphous + crystalline
fractions
–
Cellulase from Merk
Enzyme deactivation
N 70% (only fitting)
Gusakov et al. (1985)
M-M
Ads, QSS, rate constant
time dependent
M-M
Trichoderma longibrachiatum +
BG
T. viride
Enzyme inactivation, two
phase substrate model
Enzyme deactivation, bulk
mass transfer limitation
Some fraction nondegradable
Change in surface area of
substrate
N 70%
Converse et al. (1988)
Microcrystalline
cellulose form Merk
Chemically treated
cotton stalks
Microcrystalline
cellulose form Merk
Filter paper
Nakasaki et al. (1988)
Pretreated wood
Ads, accessibility
characterized by surface
area (scientific note)
Philippidis et al. (1993);
Ads
Alpha cellulose,
Philippidis et al. (1992)
cellobiose and
gluconolactone
Converse et al. (1990)
Converse and Optekar
(1993)
Ads
Avicel
Nidetzky and Steiner
(1993)
Nidetzky et al. (1993)
Ads, M-M, two
phase substrate
Psuedo 2nd order
reaction wrt substrate
M-M
Sigmacell, Avicel, alphacellulose, cotton liners
Wheat straw
Nidetzky et al.
(1994b)
South et al. (1995)
Ads
Luo et al. (1997)
Ads.
Fenske et al. (1999)
Moldes et al. (1999)
Schell et al. (1999)
Monte Carlo simulations
M-M, Empirical
Same as Philippidis
et al. (1992)
Ads, shrinking particle
theory
Ads
Movagarnejad et al.
(2000)
Moon et al. (2001)
Pettersson et al.
(2002)
Ads
Gan et al. (2003)
Ads
Whatman no. 1 Filter
paper
Data of Nutor and
Converse (1991)
Pretreated corn cob
Theoretical study
Pretreated wood chips
Dilute acid pretreated
Douglas fir
Microcrystalline
cellulose from Merck
Alpha cellulose, ball
milled and untreated
steam exploded wood
Data from Stenberg et al.
(2000) (Steam-pretreated
softwood)
Alpha-cellulose
(Sigma C802)
T. reesei + BG
T. viride + BG
Meicelase CEPB-5081
T. reesei + BG
T. reesei + BG
data from (Woodward
et al., 1988b) (T. reesei
(Cel6A, Cel7A, Cel5A))
Celluclast + BG (from Novo,
Denmark)
Celluclast + BG (from Novo,
Denmark)
T. reesei (Cel7A, Cel6A,
Cel 7B) + BG
T. reesei
Trichocherium reesei/
Aspergillus niger
Celluclast (from Novo, Denmark)
Iogen super clean cellulase
Celluclast + BG (from Novo,
Denmark)
Celluclast + BG (from Novo,
Denmark)
Cellulcast 2L + BG (from Novo,
Denmark)
T. reesei
N70%
b 70%
b 70%
b 70%
b 70%
N 70% (only fitting)
~ 70%
Fitted to initial
hydrolysis ate
Enzyme deactivation,
adsorption of cellulase
and β-glucosidase
onto lignin, substrate
reactivity coefficient
included for substrate
reactivity
–
b 70%
Enzyme desorption, two
phases of substrate
–
N 70%
-
b 70%
Decrease in substrate
reactivity
Enzyme deactivation
N 70%
b 70%
N 70%
N 70%
–
Same as (Philippidis
et al., 1992)
Inactive complexes
formed on substrate
Substrate reactivity,
enzyme deactivation
b 70%
N 70%
Decrease in cellulose
specific surface area,
adsorption of cellulase and
β-glucosidase onto lignin
Inert fraction of cellulose,
enzyme deactivation
N 70%
b 70%
b 70%
b 70%
837
P. Bansal et al. / Biotechnology Advances 27 (2009) 833–848
Table 1B (continued)
Reference
Methodology
Substrate
Enzyme source (purified
component if any)
Declining rate reason
(in addition to PI)
Conversion range for
validation
Movagharnejad (2005);
Movagharnejad and
Sohrabi (2003)
Bezerra and Dias
(2004)
Shen et al. (2004)
Ads, shrinking
particle theory
Cellulosic waste materials
Celluclast + BG (from
Novo, Denmark)
Inaccessibility of active
sites to enzyme
b 70%
Evaluation of M-M
models
Ads
Avicel
T. reesei (Cel7A)
–
b 70%
Trichoderma pseudokoningii
–
b 70%
Ding and Xu (2004)
Ads, QSS
Dried cotton, viscose
and flax yarns
PASC, Avicel, PCS
Kadam et al. (2004)
Ads
Pretreated corn stover
Lin et al. (2005)
Ads
Cellulose powder 101-F
(Sigma, USA)
Kipper et al. (2005)
Active- site
titration theory
Shin et al. (2006)
M-M
Ljunggren (2005)
Ads
Zhang and Lynd
(2006)
Ads
Bacterial cellulose (BC),
bacterial microcrystalline
cellulose, endoglucanase
pretreated BC, amorphous
cellulose
Alpha cellulose, ball
milled and untreated
steam exploded wood
Pretreated spruce,
pretreated sugar cane
bagasse
PASC, Avicel, bacterial
cellulose, cotton, filter
paper
Results compared with
literature on T. reesei cellulase
system (Cel7A, Cel6B, Cel7B)
Drissen et al. (2007)
M-M, Ads
Avicel, Whatman Filter
paper, wheat straw
Cellubrix (Novozymes
Corp., Denmark) + BG
Peri et al. (2007)
Ads
O'Dwyer et al.
(2007)
Al-Zuhair (2008)
Same model as
Holtzapple et al. (1984)
Ads
Non crystalline cellulose
(prepared from cotton
and α-cellulose), α-cellulose
Lime-pretreated corn stover
Liao et al. (2008)
Ads
Shen and Agblevor
(2008a)
Ads, QSS
Highly crystalline wood
shavings,
carboxymethylcellulose (CMC)
Lignocellulosic material
from dairy manure
Steam-exploded cotton
gin waste
Shen and Agblevor
(2008b)
Shao et al. (2009a)
Shao et al. (2009b)
Zheng et al. (2009)
Ads, QSS
Ads
Cotton gin waste, recycled
paper sludge
Waste paper sludge
Ads
Creeping wild ryegrass
T. reesei (Cel7A and Cel7B)
–
and H insolens (Cel6A and Cel7A)
CPN commercial cellulase
Substrate reactivity
(Iogen Corp.) + BG
T. reesei + BG
Adsorbed enzyme
converted irreversibly into
inactive complex
T. reesei (Cel7A, Cel6A,
–
Cel5A)
Data from (Moon et al., 2001)
(Celluclast + BG from Novo,
Denamrk)
Celluclast + BG (from Novo,
Denmark)
decreases continuously over time and to extrapolate the rate to time
zero, an empirical formulation is needed. This can be illustrated by
the empirical expression developed by Ohmine et al. (1983), where
the following equation was found to hold for Avicel (partially acid
hydrolyzed microcrystalline cellulose) and tissue paper hydrolysis
by the cellulase system from Trichoderma viride:
P=
So
lnð1 + v0 kt = So Þ
k
ð1Þ
where P is the product concentration, So is the initial substrate concentration, vo is the initial rate, k is the rate retardation constant and t is
time.
Inhibition by lignin,
enzyme deactivation
Enzyme deactivation,
β-glucosidase adsorption
to lignin
–
Evaluation of accessibility
with initial rates only
b 70%
b 70%
b 70% (Note: the purpose
of the study was to check
for burst kinetics hence
data for low hydrolysis
times was used)
b 70%
N 70%
Parameter values taken
from literature, initial
rates compared with
data from Wood (1975)
b 70%
Spezyme CP (Genencor)
Enzyme deactivation,
decreasing reactivity
of substrate
–
N 70%
T. reesei + BG
–
N 70%
Aspergillus niger
Two phase substrate
b 70%
Celluclast + BG
(from Signma)
Novozymes NS 50052
(from Novozymes) and
Spezyme AO3117 (from
Genencor International)
Spezyme AO3117
(Genencor International)
Spezyme CP (Genencor) +
BG (Sigma-Aldrich)
Celluclast + BG
(Novozymes Inc.)
Decreasing substrate
reactivity
Enzyme deactivation
N 70%
Enzyme deactivation
b 70%
Decreasing substrate
reactivity
Decreasing substrate
reactivity, adsorption
to lignin
N 70%
b 70%
N 70%
For enzymatic hydrolysis of cellulose, to avoid the effects of
product inhibition at product concentrations equal to zero, initial
rates are plotted on the y axis vs. the reciprocal of the substrate
concentration (in the Lineweaver–Burk plot) (Beltrame et al.,
1984; Gusakov et al., 1985; Huang, 1975; Maguire, 1977; Ryu et al.,
1982; Shen and Agblevor, 2008a). These initial rates can be
estimated using empirical expressions, such as:
i) Differentiating expressions by Sattler et al. (1989) (Eq. (2)) and
Koullas et al. (1992) (Eq. (4)) with respect to time to get Eqs. (3)
and (5):
Sattler et al. (1989):
Y = ðCa + Cb Þ − Ca e
−ka t
− Cb e
− kb t
ð2Þ
838
P. Bansal et al. / Biotechnology Advances 27 (2009) 833–848
(Laureano-Perez et al., 2005). The various levels of these factors
were achieved by pretreating the substrate to different extents.
Once the desired levels of the model inputs are determined,
pretreatment conditions can be set to achieve the values closest to
the optimal ones.
Table 1C
Models on soluble cello-oligosaccharides (DP — Degree of polymerization).
Reference
Substrates
Enzyme source (pure
component if any)
Fujii and Shimizu
(1986)
Schmid and
Wandrey (1989)
Trichoderma koningii
Nassar et al.
(1991)
Dean and Rollings
(1992)
Carboxy methyl cellulose and
hydroxyl ethyl cellulose
Cellodextrins with chain
lengths of 2 (cellobiose)
to 6 (cellohexaose)
Model validated with data from
Schmid and Wandrey (1989)
Dextran (polysaccharide with
α-1,6-glycosidic linkages)
Nidetzky et al.
(1994c)
Harjunpää et al.
(1996)
Cello-oligosaccharides with
DP up to 8
Cello-oligosaccharides with
DP 4–6
dY
dt
j
t=0
= Ca ka + Cb kb
β-glucosidase from T. reesei
Endodextranase (from a
Penicillium species from
Sigma) and exodextranase
from Arthrobacter globiformis
T. reesei (Cel7A and Cel6A)
T. reesei (Cel6A)
ð3Þ
where Y is the concentration of hydrolyzed cellulose, Ca and Cb
are concentrations of easily and difficult hydrolysable parts of
cellulose respectively, ka and kb are the rate constants of the
first order hydrolysis of easily and difficult hydrolysable parts
of cellulose, t is time, dY/dt (t = 0) is the initial rate.
Koullas et al. (1992):
x = xmax
dx
dt
j
t=0
t
t1 = 2 + t
ð4Þ
Xmax
t1 = 2
ð5Þ
=
where x is the conversion of cellulose to glucose, xmax is the
maximum conversion, t1/2 is the time required for 50%
conversion, t is time, dx/dt (t = 0) is the initial rate.
ii) Estimating vo in the expression by Ohmine et al. (1983) (see
above, Eq. (1)).
c) When large data sets are available, statistical models can be used to
optimize reaction conditions (Kim et al., 2008; Vásquez et al.,
2007). Two examples employed response surface methodology to
find optimal levels (to maximize cellulose conversion to glucose)
of the operating conditions (pH, temperature, enzyme loading and
solid percentage by Vásquez et al. (2007), pH, temperature and
enzyme concentration by Kim et al. (2008)). Response surface
methodology has also been used for optimizing cellulase mixtures
(Berlin et al., 2007; Zhou et al., 2009). Using steam-exploded corn
stover as the substrate, Zhou et al. (2009) optimized the
composition of a mixture of T. viride cellulases (Cel7A, Cel6A,
Cel6B, Cel7B, Cel12A, Cel61A and β-glucosidase) to maximize
glucose production. O'Dwyer et al. (2008) developed a neural
network model to predict conversion levels as a function of
crystallinity index, lignin content and acetyl content using data
from 147 poplar wood samples. Such models which interpolate
over a large range of the predicted and independent variables can
be considered to have robust parameter values and can be useful
for designing processes under various conditions.
d) Spectroscopic data — seven main peaks of the DRIFT spectra
(Diffusive Reflectance FT-IR) of the substrate, along with crystallinity and lignin content have also been used as an independent
variable (model inputs) in statistical models to predict the initial
hydrolysis rate (3 hour glucan yield) and 72 hour hydrolysis extent
2.2. Michaelis–Menten based models
The Michaelis–Menten scheme (Michaelis and Menten, 1913) is
based on mass action laws that hold for homogenous reaction
conditions and hence cannot be directly applied to the heterogeneous
reaction conditions of enzymatic hydrolysis of insoluble cellulosic
substrates. The excess substrate to enzyme ratio condition ([S] NN [E]),
which is usually employed for the quasi-steady state assumption
(Laidler, 1955; Schnell, 2003), is not achieved since the fraction of
cellulose accessible for adsorption ranges from 0.002 to 0.04 (Hong
et al., 2007). The excess substrate condition, even if ever achieved
initially, could not be retained at higher conversions as the substrate
gets depleted. It has also been pointed out by Lynd et al. (2002) that
the concentration of adsorbed cellulase depends on the substrate
concentration and that dual saturation is possible by keeping the
enzyme or substrate concentration high; these features are not
characteristic of Michaelis–Menten kinetics. Cellulose hydrolysis is a
heterogeneous reaction occurring on the substrate surface and is
therefore a reaction occurring in dimensions less than three. For
heterogeneous reaction systems, classical chemical kinetics assumption of uniformly mixed systems does not hold, resulting in apparent
rate orders, time-dependent rate constants, and non-uniform concentration variation of reacting species in the fractal or dimensionally
restricted media (Anacker and Kopelman, 1987; Kopelman, 1986;
Kopelman, 1988). Such a behavior is termed fractal kinetics. Monte
Carlo simulations have corroborated that the quasi-steady state
assumption cannot be applied in these reaction systems (Berry,
2002). Conversion of cellobiose to glucose by β-glucosidase, however,
can be modeled by Michaelis–Menten kinetics since it is a homogeneous reaction.
However, Michaelis–Menten models in the literature fit the experimental data very well under the conditions they were developed.
Bezerra and Dias (2004) have tested eight different Michaelis–Menten
models against data of Avicel hydrolysis by T. reesei Cel7A for 24
different substrate-to-enzyme ratios. A model with competitive
inhibition by cellobiose was found to fit the data best. Reasons for
the decreasing rates such as nonproductive cellulase binding,
parabolic inhibition, and enzyme deactivation were shown to be
insignificant in comparison to substrate depletion and competitive
inhibition. Another work on Avicel with a fungal cellulase system from
T. viride (Ohmine et al., 1983), however, had shown earlier that the
same Michaelis–Menten model, incorporated with changes due to
crystallinity and enzyme deactivation too, over-predicted the hydrolysis data. It was therefore suggested that either the kinetic scheme of
the reaction is completely different or rate-retarding factors related
to substrate heterogeneity are involved. The substrate heterogeneity
factors are analyzed in Section 3 (‘Rate limitations and decreasing
rates with increasing conversion’).
Table 1D
Models on jamming and fractal kinetics.
Reference
Substrate
Enzyme source (pure Range of validation
component if any)
Väljamäe
et al. (2003)
Bacterial
cellulose
T. reesei (Cel7A,
Cel5A)
Xu and Ding
(2007)
Avicel
and PASC
H. insolens (Cel7A),
T. reesei (Cel7A)
(b10%) (Note: The objective was to
fit the data to find the parameter h,
representing the fractal dimension)
N 70%
P. Bansal et al. / Biotechnology Advances 27 (2009) 833–848
2.3. Adsorption in cellulose hydrolysis models
Incorporation of adsorbed cellulase concentration into hydrolysis
models has been achieved mainly in two ways: with the Langmuir
adsorption isotherm, or with the help of kinetic equations. Fan and
Lee (1983) observed constant amount of adsorbed cellulase per
weight of cellulose along the hydrolysis and so a constant specific
adsorption amount was used in their analysis. Movagarnejad et al.
(2000) modeled the available number of active sites on the substrate surface as proportional to the surface area of the cellulose
particles.
An example of a model employing the Langmuir adsorption isotherm is the one by Kadam et al. (2004). The adsorbed amount is
given by:
Eb =
Emax Kad Ef S
1 + Kad Ef
ð6Þ
where Eb is the bound enzyme concentration, Ef is the free enzyme
concentration, Kad is the dissociation constant for adsorption, S is the
substrate concentration, and Emax is the maximum adsorption
capacity in amount of cellulase per amount of cellulose.
An example of the models using kinetic equations for the amount
of enzyme adsorbed is the one by Gan et al. (2003) where the
following equations were used for the adsorbed species:
ksc1
E + Sc ⇌ E⁎Sc
ð7Þ
dCE⁎Sc
= ksc1 CE CSc − ksc2 CE⁎Sc − kp CE⁎Sc
dt
ð8Þ
ksc2
have been shown to fit the data, only the Langmuir isotherm has
been used in hydrolysis models. However, the Langmuir isotherm
should only be used as a mathematical expression since its underlying assumptions (reversibility, non-interacting adsorbed species,
homogenous binding sites and uniform composition of adsorbed
cellulase mixture) may not be valid in all situations (Zhang and Lynd,
2004).
While using the Langmuir isotherm or any other mathematical
expression for calculating the adsorbed amount of enzyme during
hydrolysis, an implicit assumption is that the adsorption equilibrium is established very fast as compared to the hydrolysis step.
According to Steiner et al. (1988), this assumption may not be valid
under all experimental conditions. The time to reach equilibrium
adsorption has been estimated to be of the order of 5–60 min
(Bader et al., 1992; Beldman et al., 1987; Ghose and Bisaria, 1979;
Kim et al., 1994; Medve et al., 1998; Medve et al., 1994; Nidetzky
et al., 1994a; Ståhlberg et al., 1991; Steiner et al., 1988). Though the
time required for complete hydrolysis of cellulose (100% conversion) is usually 25–100 h (Bommarius et al., 2008; Bertran and Dale,
1985; Gregg and Saddler, 1996; Nutor and Converse, 1991; Tu et al.,
2007), the time for low conversion levels is two to three orders of
magnitude lower (Bommarius et al., 2008; Hong et al., 2007; Nutor
and Converse, 1991; Väljamäe et al., 1998). Also, use of the same
isotherm at all time points of the reactions assumes that adsorption
characteristics of the substrate–enzyme system do not change. If
both assumptions (equilibrium of the adsorption and a single
isotherm valid for all conversion levels) hold true, then the amount
of enzyme adsorbed per unit weight of the substrate can only
increase (see below).
Mass balance on the enzyme gives —:
STEads + Ef = Etot
where E is the enzyme, Sc is the active cellulose, E⁎Sc is the enzyme–
cellulose complex, CE is the enzyme concentration, CE⁎Sc is the
enzyme–cellulose complex concentration, CSc is the active cellulose
concentration, ksc1 is the adsorption constant on active cellulose, ksc2
is the desorption constant on active cellulose, and kp is the product
formation constant.
Some of the models (Al-Zuhair, 2008; Brown and Holtzapple, 1990;
Converse et al., 1988; Drissen et al., 2007; Fan and Lee, 1983; Gan et al.,
2003; Huang, 1975; Kadam et al., 2004; Lin et al., 2005; Moon et al.,
2001; Nidetzky and Steiner, 1993; Peri et al., 2007; Shen and Agblevor,
2008a; South et al., 1995; Wald et al., 1984) assume instantaneous
substrate–enzyme complex formation (fully productive adsorption),
so the adsorbed amount of cellulase is the same as the amount of
substrate–enzyme complexes. Some others (Asenjo, 1984; Converse
and Optekar, 1993; Ding and Xu, 2004; Holtzapple et al., 1984; Liao
et al., 2008; Luo et al., 1997; Ryu et al., 1982) assume an additional
kinetic step on the substrate surface after cellulase adsorption, as did
Luo et al. (1997), where the adsorbed cellulase combines with substrate to form a cellulase–substrate complex:
K
1
EcV + C X
EcVC
ð9Þ
where E′c is the adsorbed enzyme on the active sites, C is cellulose, K1
is the equilibrium constant, and E′c C is the cellulase–substrate
complex. Brown and Holtzapple (1990) and Holtzapple et al. (1984)
used the quasi-steady state assumption for the adsorbed enzyme and
the substrate–enzyme complex species.
While isotherms other than the Langmuir isotherm, such as the
Langmuir–Freundlich isotherm (Medve et al., 1997) and two-site
models (Medve et al., 1998; Medve et al., 1997; Ståhlberg et al., 1991),
839
ð10Þ
where S is the substrate concentration (g/L or equivalent units), Eads
is the specific adsorption amount (g cellulase/g cellulose or
equivalent units), Ef is the free enzyme concentration (g/L or
equivalent units), and Etot is the total enzyme concentration (g/L or
equivalent units).
Therefore, it follows that
Eads = ðEtot − Ef Þ = S
ð11Þ
Eads is also given by the adsorption isotherm:
Eads = Emax Kad Ef S = ð1 + Kad Ef Þ
ð12Þ
Thus Eads is determined by the intersection of Eqs. (11) and
(12). As S decreases along the course of hydrolysis, the magnitude of the slope increases and Eads increases.
840
P. Bansal et al. / Biotechnology Advances 27 (2009) 833–848
However, it is seen that Eads does not monotonically increase with
conversion, for both pure cellulosic substrates (Fan and Lee, 1983;
Huang, 1975; Jeoh et al., 2006; Kurakake et al., 1995; Nidetzky and
Steiner, 1993; Steiner et al., 1988) and lignocellulosic substrates
(Kurakake et al., 1995; Liao et al., 2008; Nutor and Converse, 1991;
Shen and Agblevor, 2008a; Steiner et al., 1988). Hong et al. (2007),
working with Avicel, have shown that the maximum adsorbable
amount (Emax in the Langmuir isotherm) decreases with conversion.
Empirical equations have also been developed for the changing
concentration of adsorbed enzyme during the hydrolysis reaction
(Kurakake et al., 1995). Lignin and hemicellulose act as barriers to
cellulases to reach the cellulose core, and thus the changes in
adsorption characteristics will be more pronounced for lignocellulosic
substrates as compared to pure cellulosic substrates. The adsorption
characteristics can depend on the type of substrate used, and since the
isotherm parameters can change with conversion, it is important to
validate the model against a measured amount of adsorbed cellulase
during the hydrolysis. Shao et al. (2009a), Liao et al. (2008), and
Nidetzky and Steiner (1993) incorporate adsorption and validate their
models against experimental values for adsorbed cellulases during
hydrolysis. Using paper sludge as the substrate, Shao et al. (2009a)
modeled adsorption of cellulases by the rate Eqs. (13) and (14), and
found that the same adsorption parameters fitted the data till 65%
conversion; whereas, Liao et al. (2008), who used lignocellulosic
material from dairy manure as the substrate, represented the change
in the adsorption constant by an empirical expression (in time) fitted
to the experimental data of adsorbed cellulase (Eq. (15)).
rCE = kfc ½Ef ð1 + σ C Þ½Cf −
rLE = kfl ½Ef ð1 + σ L Þ½Lf −
kfc
½CE
KC
kfl
½LE
KL
ð13Þ
ð14Þ
where CE denotes cellulose enzyme complex, LE denotes lignin enzyme
complex, rCE and rLE denote the rate of formation of cellulose enzyme
complex and lignin enzyme complex respectively, sC and sL denote the
adsorption capacities of cellulose and lignin respectively, kfc and kfl are
the dynamic adsorption constants, [Ef], [Cf] and [Lf] are concentrations of
free enzyme, cellulose and lignin respectively, KC and KL are the
adsorption constants.
K=
at
b+t
et al. (1996) developed a kinetic model for the hydrolysis of soluble
cello-oligosaccharides (with a degree of polymerization (DP) of 4–6)
by Cel6A from T. reesei. When cleavage patterns were revealed,
cellohexose was found to react the fastest and to inactivate Cel6A
irreversibly. Similar work earlier by Nidetzky et al. (1994c) also
revealed cleavage patterns by Cel7A and Cel6A from T. reesei. Binding
constants increased up to a DP of 6 and then remained constant for
DP of 7 and 8, providing information about the span of the active site.
Nassar et al. (1991) used a stochastic model to fit the data of Schmid
and Wandrey (1989), and it was found that β-glucosidase from T.
reesei degrades cellodextrins (starting from length 6-cellohexaose)
with the same rate down till a length 2 (cellobiose), and rate of
cellobiose degradation was estimated to be much smaller. Using
soluble cellulose derivative substrates, carboxymethyl cellulose and
hydroxylethyl cellulose, Fujii and Shimizu (1986) modeled synergism using the model developed by Fujii et al. (1981) which was
based on the Michaelis–Menten scheme. The synergistic effect of
endo-enzymes on the exo-enzymes (resulting from random cleavages giving rise to more cellulose chains for exo-enzymes to act on)
was found to exist until the molecular weight of the substrate
decreased to 4000.
While the above-mentioned models can be used to describe the
hydrolysis of soluble substrates, extension to insoluble substrates is not
straightforward. This is mainly because of the heterogeneous nature of
cellulase action on insoluble cellulosic substrates. The concentration
and distribution of accessible chain ends in insoluble substrates is also
not known. However, once the issue of accessibility of chain ends is
solved, cellulose hydrolysis can be modeled as polymer degradation
by enzymes as was achieved by Okazaki and Moo-Young (1978) (as
an example only one of the equations developed in that work is
shown):
ð15Þ
where a and b are empirical constants, t is time, and K is the adsorption
constant.
Nidetzky and Steiner (1993), who used four different cellulosic
substrates (Sigmacell, Avicel, alpha-cellulose, cotton liners), represented
the adsorption–desorption process over the conversion range as three
phases: phase 1 where cellulases are adsorbed rapidly, phase 2 where
desorption is linearly proportional to substrate conversion, and phase 3
where desorption occurs at a very low rate. The three works mentioned
here used different substrates and the validation of the adsorption
model was done independent of the kinetic model, so that the
differences in the adsorption model fitting cannot be attributed to the
different natures of the overall kinetic models. Cellulases were the only
enzymes used in these works, so the differences in adsorption
characteristics cannot be expected to be due to enzymes but are mainly
due to the different nature of the substrates. The adsorption characteristics can thus be substrate-dependent.
2.4. Models on soluble cello-oligosaccharides
Only a few models have been published on the cellulase
hydrolysis of soluble cello-oligosaccharides (Table 1C). Harjunpää
d½Ci =
dt
k1 ½E1 2
kM1 +
∞
P
i=3
∞
P
j=1 + 1
!
h i
Cj − ði − lÞ½Ci !
ðfor iz3Þ
fði − lÞ½Ci g ð1 + ½C1 = KG1 + ½C2 = KC1 Þ
ð16Þ
where [Ci] is the concentration of cellulose with chain length i, [C1]
and [C2] are concentrations of glucose and cellobiose respectively, k1 is
the reaction rate constant, [E1] is the concentration of endoglucanase,
KM1 is the Michaelis constant, KG1 and KC2 are the inhibition constants
of E1 by glucose and cellobiose respectively. Ci is degraded by
exoglucanase also and a similar expression as the one on the right
hand side can be written for it and added to the rate.
With a recent study claiming that cellulose hydrolysis leads to the
production of cello-oligosaccharides that are possibly not degraded by
endoglucanases and exoglucanases (Gupta and Lee, 2008), models on
soluble cellulosic substrates might provide more insight into the
hydrolysis mechanism.
Recently, Ting et al. (2009) developed a stochastic model which gave
insights into the modularity of the cellulases. The catalytic domain
(CD) and the cellulose binding domain (CBD) were modeled as random
walkers whose dynamics were coupled by the compression/expansion
of the linker and lifting of cellulose chain from the substrate surface.
For simplicity, only the major governing equation is shown:
dP ðx; r; t Þ
= kC ðr + 1ÞP ðx − 1; r + 1; t Þ + kB − ðr + 1ÞP ðx; r + 1; t Þ
dt
+ kBþ ðr−1ÞP ðx; r − 1; t Þ − kC ðr Þ + KBþ ðrÞ + kB − ðrÞ P ðx; r; t Þ
ð17Þ
where x denotes the position of CD, r is the separation between the CD
and CBD, P denotes the probability of CD being at position x (the first
P. Bansal et al. / Biotechnology Advances 27 (2009) 833–848
entry in the parenthesis) with separation r (second entry in the
parenthesis) from the CBD at time t (third entry in the parenthesis),
kC(r) is the transition probability per unit time (for the CD) to move
towards the CBD to a distance of r − 1 from r, kB+(r) is the probability of the CBD to move away from the CD to a distance of r + 1 from
r, kB−(r) is the probability of the CBD to move towards the CD to a
distance of r − 1 from r.
The constants in the equations are then described by the energy
dynamics arising from the compression/expansion of the linker,
energy dynamics of hydrolysis, and chain disruption from the
crystalline substrate surface. It was found that the linker flexibility/
stiffness was an important factor governing the hydrolysis rates, as
was the intrinsic hydrolytic activity of the CD. This is the first kinetic
model which has attempted to explain the dynamics of the cellulose
hydrolysis process by capturing the modular nature of the cellulases.
3. Rate limitations and decreasing rates with
increasing conversion
Most of the experimental studies showed that the rate of hydrolysis
drops by two to three orders of magnitude at high degrees of
conversions (Fig. 2, from Bommarius et al. (2008)). Even after alleviating
product inhibition from cellobiose, cellulase activities and hydrolysis
rates fall precipitously as the reaction proceeds (Bommarius et al., 2008).
To be able to increase the rates, the various bottlenecks in cellulose
hydrolysis need to be elucidated.
The contributing factors to decreasing rates (other than product inhibition) accounted for in the existing models include (see Tables 1A–D):
a) enzyme deactivation (Section 3.1), b) biphasic composition of cellulose
(Section 3.2.), c) decrease in substrate reactivity (Section 3.3.), d) decrease
in substrate accessibility (Section 3.4.), e) jamming and fractal kinetics
(Section 3.5.), and f) decrease in the synergism between cellulases
(Section 4). In this section (Section 3), we discuss these factors used in the
models for both pure cellulosic and lignocellulosic substrates. For
substrates containing lignin and other non-cellulosic components,
additional factors such as inaccessibility caused by lignin and adsorption
of cellulases to lignin will contribute to rate limitations; these aspects are
discussed in Section 5.
3.1. Enzyme deactivation
While enzyme deactivation has often been modeled as a first order
process with respect to the total enzyme concentration (Caminal et al.,
1985; Drissen et al., 2007; Ljunggren, 2005; Luo et al., 1997; Moon
et al., 2001; Oh et al., 2000; Philippidis et al., 1993; Philippidis et al.,
1992; Schell et al., 1999; Shin et al., 2006), inactivation of the adsorbed
enzyme only has also been considered (Converse et al., 1988; Gusakov
841
et al., 1985; Howell, 1978; Lin et al., 2005; Scheiding et al., 1984). Gan
et al. (2003) considered the loss of enzyme due to shear force. Shen
and Agblevor (2008a), and Shen and Agblevor (2008b) assumed
enzyme deactivation to be a second-order reaction.
As an example of the enzyme deactivation of the adsorbed enzyme,
Converse et al. (1988) used the following reaction representing enzyme
deactivation:
k1
Ea ⇌ Ed
k2
ð18Þ
where Ea is the actively adsorbed enzyme, Ed is the inactively
adsorbed enzyme, and k1 is the inactivation rate constant, k2 is the
reactivation rate constant.
Enzyme deactivation has also been related to enzyme clogging in
an erosion model (Väljamäe et al., 1998), where the cellobiohydrolases become stuck on the substrate surface when surrounding
cellulose chains prevent further processive action. Through restart
hydrolysis experiments, Yang et al. (2006) also suggested stopping
or slowdown of the enzymes on the substrate surface to account
for the reaction rate slowdown. Eriksson et al. (2002) showed that
thermal enzyme instability and product inhibition are not the major
causes for the reduction in rates. The authors proposed a model
where cellobiohydrolases encounter obstacles during their processive action while endoglucanases partially remove this hindrance
by hydrolyzing the responsible cellulose chains. This study however,
was performed with steam-pretreated spruce, a lignocellulosic substrate where non-cellulosic parts can also possibly act as obstacles to
enzymes.
3.2. Two-phase substrate
Under the assumption of a two-phase substrate, the more reactive
part reacts faster resulting in a decrease in its overall fraction and a
concomitant decrease in the overall reaction rate with time. Some
works suggested that the amorphous part of cellulose reacts first
(accompanied by an increase in crystallinity) (Chen et al., 2007; Gan
et al., 2003; Lee and Fan, 1983; Mansfield and Meder, 2003; Medve
et al., 1994; Ohmine et al., 1983; Ooshima et al., 1983; Szijártó et al.,
2008; Väljamäe et al., 1999; Zhang et al., 1999), while constant (Lenz
et al., 1990; Puls and Wood, 1991) and decreasing crystallinity
(Mansfield and Meder, 2003) along conversion have also been reported.
Zhang and Lynd (2004), and Mansfield et al. (1999) reported this
dichotomy as well. Models assuming cellulose to be divided into
crystalline and amorphous fractions have been proposed (Gusakov et al.,
1985; Peiterson and Ross, 1979; Ryu et al., 1982; Scheiding et al., 1984).
These works, however, did not verify their assumptions by measuring
Fig. 2. Conversion-time behavior of non pretreated Avicel at optimal ratio of activities of β-glucosidase/cellulase 1:20 (Bommarius et al., 2008); T = 50 °C, pH 5.0; V = 8 mL. (●) 1.5 U
Cellulase (■) 15 U Cellulase (▲) 30 U Cellulase. I, II and III denote the three kinetic phases identified.
842
P. Bansal et al. / Biotechnology Advances 27 (2009) 833–848
the crystallinity of the substrate along conversion. Based on a Michaelis–
Menten scheme of the biohydrolysis of amorphous and crystalline
fractions, Ryu et al. (1982) obtained the following two equations:
″
Vmax
=
″
KM
1
=
″
KM
!
Vmax;c
Vmax;a
Vmax;a
−
Φ+
KM;c
KM;a
KM;a
1
KM;c
−
1
KM;a
!
Φ+
1
KM;a
ð19Þ
ð20Þ
where v″max is the maximum apparent rate, vmax,c is the maximum rate
for crystalline fraction, vmax,a is the maximum rate for amorphous
″ is the apparent Michaelis constant, KM,c is the Michaelis
fraction, KM
constant for crystalline fraction, KM,a is the Michaelis constant for
amorphous fraction, and Φ is the fraction of crystalline phase.
The two-phase hypothesis, however, was emphasized to be a
simplification of the true physical complexity of cellulose. Cellulose
crystallinity was shown to affect the digestibility of cellulose by
impacting its accessibility (Jeoh et al., 2007). In the same work, the
specific activity of the adsorbed T. reesei Cel7A was higher on PASC
(phosphoric acid swollen cellulose, amorphous cellulose) than on
Avicel, implying either higher susceptibility of lesser crystalline
cellulose towards hydrolysis or lesser non-productive adsorption.
Crystallinity, therefore, is not an independent substrate property and
can affect accessibility and reactivity of the cellulose sample.
It has also been assumed that a part of the substrate is inert, with
the fraction of inert part remaining constant during conversion (AlZuhair (2008) — using CMC and wood shavings, Gan et al. (2003) —
using cellulose). This fraction, however, was an assumed constant in
the model equations. Models assuming a non-degradable fraction of
cellulose have also been developed (Asenjo, 1983; Asenjo, 1984;
Nakasaki et al., 1988). Based on the observation that 30% of the filter
paper powder remained unreacted at long residence times (approximately 340 h), Nakasaki et al. (1988) assumed the non-degradable
fraction to be 0.3. Asenjo (1983), and Asenjo (1984), however,
assuming the non degradable fraction to be 35% for Solka–Floc
(a pure cellulosic substrate), did not validate the assumption of
a non-degradable fraction by fitting the model predictions to experimental data up to the maximum theoretical conversion achievable
(65%).
An empirical model by Parajó et al. (1996) took into account two
parts of cellulose having different susceptibility towards enzymatic
attack. According to Nidetzky and Steiner (1993), the presence of a)
two parts of cellulose differing in their reactivity and b) a fraction of
substrate that is non-degradable, are important factors affecting
cellulose enzymatic hydrolysis. Resuspension experiments (where
enzymes are washed off the surface of the unreacted cellulose and the
partially hydrolyzed substrate is subjected to cellulase hydrolysis
under initial conditions) were used to show the existence of two
fractions and the authors concluded that, though no physical property
variation can explain the presence of two fractions, the possibility
cannot be ruled out. Biphasic kinetics, however, seems unlikely to be
the only cause for the rate slowdown.
3.3. Substrate reactivity
The change in substrate reactivity has been included in a number
of models to explain the reduced digestibility of hydrolyzed cellulose,
for both lignocellulosic and pure cellulosic substrates (Table 1B). Some
of these works will be discussed here. Lee and Fan (1983) (pure
cellulosic substrate) and Moon et al. (2001) (both pure cellulosic and
lignocellulosic substrates) employed the initial hydrolysis rates from
resuspension experiments of spent substrate to correlate ‘relative
digestibility’ with conversion. As an example, Lee and Fan (1983)
developed the following expression:
/ = 1− X
n
ð21Þ
where ϕ is relative digestibility, X is conversion, and n is a parameter
fitted with the help of resuspension experiments.
South et al. (1995) also expressed the reaction rate constant in terms
of conversion:
n
kðxÞ = kð1− xÞ + c
ð22Þ
where k is the reaction rate constant for hydrolysis, x is conversion, k(x)
is the reaction rate constant at conversion x, n is the exponent of
declining rate constant, c is a constant. n and c were estimated by
approximating k(x) by the ratio of rate/adsorbed enzyme and fitting it
with equation to conversion (x). This expression was later used in
modeling SSF with staged reactors and intermediate feeding of enzyme
and substrate (Shao et al., 2009a; Shao et al., 2009b). Based on the
observation that the initial rates (for pretreated corn stover) followed a
linear trend with the substrate concentration, Kadam et al. (2004) fitted
the following equation for substrate reactivity:
Rs =
S
S0
ð23Þ
where Rs is substrate reactivity, S is substrate concentration, S0 is initial
substrate concentration.
Liao et al. (2008) also used a similar expression (Eq. (24)), but the
parameters were not determined by independent experiments, and
the reason for the use of this expression was stated to be for available
cellulose for enzymes:
½C eff =
½C ½C 0
λ
½C ð24Þ
where [C]eff is the concentration of cellulose available to enzymes, [C]
is cellulose concentration, [C]0 is initial cellulose concentration, λ is a
constant. ([C]/[C]0)λ is equivalent to Rs in Eq. (23).
Although the inclusion of the rate constant or substrate reactivity
as a function of conversion may fit the data well, a physical interpretation of the constants in these equations is not possible. The
continuous decline in reactivity has been alternatively explained by
the consumption of a more reactive fraction of the substrate (Hong
et al., 2007), leading back to the assumption of a biphasic substrate.
Various studies have used resuspension experiments to study the
reactivity of partially converted cellulose (Desai and Converse, 1997;
Drissen et al., 2007; Gusakov et al., 1985; Hong et al., 2007; Lee and
Fan, 1983; Ooshima et al., 1991; Väljamäe et al., 1998; Yang et al., 2006;
Zhang et al., 1999). As pointed out by Lynd et al. (2002), there was no
consensus regarding the decline of reactivity as observed in these
experiments. Post 2002, through resuspension experiments, Hong
et al. (2007) and Drissen et al. (2007) observed a decline in reactivity
whereas Yang et al. (2006) did not. Generalization from the above
results becomes more difficult since the enzyme system and substrate
used were different.
3.4. Substrate accessibility
Due to the insoluble nature of cellulose, large domains are not
exposed to cellulases in the reaction mixture during the hydrolysis
reaction. Accessibility of cellulose can be characterized on the basis of
adsorption. Cellulases can adsorb only to the accessible portion of
the substrate, and this fraction is calculated based on the maximum
adsorption capacity of the substrate (Hong et al., 2007; Zhang and
P. Bansal et al. / Biotechnology Advances 27 (2009) 833–848
Lynd, 2004):
Fa = 2αAmax MWanhydroglucose
ð25Þ
where Fa is the fraction of the β-glycosidic bonds accessible to cellulase, α is the number of cellobiose lattice occupied by the cellulase,
Amax is the maximum adsorption concentration of cellulase, and
MWanhydroglucose is the molecular weight of anhydroglucose.
This fraction fell by approximately 50% from 0.002 until a
conversion of around 85% (conversion of Avicel with T. reesei cellulase
system) (Hong et al., 2007). In light of these findings, it might be
important to take into account the reduced accessibility and
adsorption capacity of the substrate as the conversion proceeds
(also discussed in Section 2). Ding and Xu (2004) have estimated the
‘kinetic accessibility’ of Avicel and PASC to T. reesei and H. insolens
cellulases from initial rate data (Eqs. (26) and (27)).
u=
½S 0
½St
ð26Þ
where [S]0 is the concentration of cellulose available to cellulases for
productive adsorption, [S]t is the total concentration of cellulose, φ is
the ratio of [S]0 to [S]t and represents the kinetic accessibility of
cellulose.
φ was estimated by the following expression:
u=β
½Es0
½S t
ð27Þ
1975). It is not clear whether it is possible to classify a part of the
substrate in just two categories: accessible and inaccessible. Accessibility as a substrate property could possibly be a continuous variable.
3.5. Role of fractal kinetics in cellulase kinetics
Fractal kinetics is said to occur when reactions take place in spatially
constrained media; such reaction conditions give rise to non-uniformly
mixed reaction species, apparent rate orders, and time-dependent rate
constants (Anacker and Kopelman, 1987; Kopelman, 1986; Kopelman,
1988). Since cellulase hydrolysis of insoluble cellulosic substrates can be
thought of as a one-dimensional heterogeneous reaction along a
cellulosic fiber, it can result in fractal kinetics. Though reactions
occurring on a supported catalyst can be modeled using Langmuir–
Hinshelwood kinetics (Fogler, 2005), fractal kinetics must be considered
for catalytic reactions involving diffusion of two species (for bimolecular
reactions) on the non-ideal substrate surfaces (surfaces with obstacles
resulting in segregation of species, non-uniform concentrations).
Example of a simple bimolecular reaction, occurring on a catalyst
surface modeled by Langmuir Hinshelwood kinetics, is shown below.
k1
A + S ⇌ AS
ð31Þ
k−1
k2
B + S ⇌ BS
ð32Þ
k−2
k3
AS + BS ⇌ CS + S
k−3
k4
[E]0 denotes initial substrate concentration. At low [E]0, v0 is directly
proportional to [E]0 (i.e. v0 =k[E]0)and at high concentrations v0 is
constant. The intersection of v0 =k[E]0 and v0 = constant gives [E]s0.
β(=39) is the number of cellobiosyl units covered by an adsorbed CBH.
The results showed that φ can be different for different cellulases
for the same substrate, e.g. for Avicel, φ was 0.014 for Cel7A but only
0.0012 for Cel7B. The order of magnitude of φ and Fa is the same:
Fa = 0.002 and φ = 0.0012-0.014 for four different enzymes.
The importance of productive adsorption can be illustrated by a
simple analysis of the data from Zhang and Lynd (2005), and Hong
et al. (2007):
Accessible fraction of the β-glycosidic bonds in Whatman Filter
paper (as calculated by Eq. (25)) ~0.0095, DP ~ 2000. Therefore:
½C r =
1
½C = 0:0005⁎½C b
2000 b
and ½C a = 0:0095⁎½C b
ð28Þ
ð29Þ
where [C]r is the concentration of reducing ends, [C]b is the concentration of all β-glycosidic bonds, [C]a is the concentration of accessible βglycosidic bonds.
If all the chain ends are occupied at maximum adsorption, there
would still be a large fraction of non-productively bound cellobiohydrolase given by:
½C a −½C r
0:0095 − 0:005
f0:95
=
0:0095
½C a
ð30Þ
As cellulose chains are hydrolyzed, the chains located below, which
were not exposed to cellulases, can undergo hydrolysis. Based on this
idea, accessibility parameters have been included in the rate equations
(Al-Zuhair, 2008; Converse and Optekar, 1993; Gan et al., 2003; Wood,
843
CS ⇌ C + S
ð33Þ
ð34Þ
k−4
where A and B are reacting species, C is product, S is a vacant
adsorption site on the substrate.
If the surface reaction step is rate limiting, and the substrate
surface is ideal, permitting free diffusion of the species, uniform
mixing and no obstacles, we get the following expression for the rate:
−r =
St ðk3 KA KB CA CB − k − 3 KC CC Þ
ð1 + KA CA + KB CB + KC CC Þ2
ð35Þ
where −r denotes the rate, St is the total site concentration, C denotes
concentration of the species in the subscript, KA = k1/k− 1, KB = k2/k− 2
and KC = k4/k− 4.
Michaelis–Menten kinetics in fractal media was first studied using
the power law formalism (Savageau, 1995), where the classical
enzyme catalysis reaction (Eq. (36)) in fractal media was described
by apparent rate orders (Eqs. (39) and (40)).
k1
k2
E + S ⇌ ES→ E + P
k−1
ð36Þ
where E is enzyme, S is substrate, ES is enzyme–substrate complex, P
is product, k1 is the forward rate constant for the association of the
enzyme and substrate, k− 1 is the dissociation constant of the enzyme–
substrate complex and k2 is the product formation rate constant.
Classical equations —
dðESÞ
= k1 ⁎E⁎S − ðk − 1 + k2 ÞðESÞ
dt
ð37Þ
dP
= vP = k2 ðESÞ
dt
ð38Þ
844
P. Bansal et al. / Biotechnology Advances 27 (2009) 833–848
enzymes (referred to as ‘jamming’) was also studied by the use of the
following equation:
Power law equations —
dðESÞ
g1
g2
= α 1 ⁎E ⁎S − ðβ1 + α 2 ÞðESÞ
dt
ð39Þ
dP
= vp = α 2 ðESÞ
dt
ð40Þ
where vp is the product formation rate, α1, α2 and β1are new
constants introduced for the power law formulation, g1 and g2 are the
apparent rate orders with respect to E and S.
Using Monte Carlo simulations, the classical enzyme kinetics
scheme (Eq. (36)), has been studied in two dimensions in the
presence of surface obstacles by Berry (2002). The fractal nature of the
reaction system was shown to increase as the obstacle density was
increased. k1 (rate constant of a bimolecular reaction requiring the
diffusion of enzyme and substrate on the surface) was shown to
decrease with time, whereas k− 1 and k2 were time-invariant, as the
uni-molecular reaction did not require diffusion. It was also shown
that the quasi-steady state assumption cannot be applied in these
conditions.
Enzymatic hydrolysis of lignocellulosic biomass is a heterogeneous
reaction since it occurs on the substrate surface (large enough to
accommodate a large number of enzyme molecules). After adsorption,
cellulases have to diffuse on the surface of the substrate to reach the
reactive sites (a chain end in the case of cellobiohydrolases). The
inaccessible and non-reactive portions of the substrate can be
considered as obstacles increasing the fractal character of the
hydrolysis reaction. The first work to study cellulose hydrolysis by
fractal kinetics was performed by Väljamäe et al. (2003). Using an
empirical first-order product formation equation for cellobiose
production (Eq. (41)), the parameter h, which represents the fractal
dimension, was shown to increase with increasing substrate concentration for Cel7A core protein (catalytic domain only) plus Cel5A
endoglucanase (0.1 to ~0.45) but to decrease for Cel7A intact protein
plus Cel5A endoglucanase (0.6 to ~ 0.35).
ð1 − hÞ
P ðt Þ = ½So 1 − exp − k⁎ t
ð41Þ
where P(t) is the product concentration at time t, [S]o is the initial
substrate concentration, k is the reaction rate constant, and t is time.
It was thus concluded that the intact Cel7A acts in a 2-D surface
phenomenon, where diffusion time would be expected to increase with
increasing substrate concentration. Similarly, the action of the Cel7A
core (catalytic domain) was stated to be a 3-D phenomenon since the
diffusion time decreases with increasing substrate concentration.
Contrary to the classical enzyme reaction scheme, the product
formation step can also be diffusion-controlled since cellobiohydrolases have to process along the cellulose chain while cleaving β-1,4glycosidic bonds. This was incorporated in the study by Xu and Ding
(2007) who derived the following equation:
k2 ½Et 1 − f
½P = ½P − Km ln 1 −
½S
1− f
1−f
E k2 ½Et
½P 1−
= ½P − Km 1n 1 −
j½S
½S 1− f
ð43Þ
where j is the jamming parameter. The jamming parameter was found
to be around 0.0004.
The above-mentioned two works are only semi-quantitative. They
have, however, helped in understanding the role of fractal kinetics in
enzymatic cellulose hydrolysis.
There is no conclusive evidence on whether enzyme diffusion on
the cellulose surface is rate-limiting for the cellulose hydrolysis
process or not. By measuring the diffusion rates of Cellulomonas fimi
cellulases on Valonia ventricosa microcrystalline cellulose, Jervis et al.
(1997) concluded that the surface diffusion of enzymes was unlikely
to be rate-limiting. According to the diffusion rates measured, each
cellulase traverses several hundred lattice sites in a minute. These
were compared with the hydrolysis rates of C. fimi endoglucanase
(CenA) on bacterial microcrystalline cellulose (BMCC) — 0.23 mol
glucose/mol enzyme/min (Meinke et al., 1993), which are lower than
the diffusion rates. However, as the authors have stated, the
importance of the diffusion step also depends on how the hydrolysable sites on the substrate are distributed. The substrate used in this
work was highly crystalline; for other cellulosic substrates such as
Avicel or Solka Floc, and those consisting of lignin and hemicellulose,
it is possible that substrate heterogeneity and partial crystallinity
result in rate-limiting diffusion rates. Since jamming occurs when
there is overcrowding of cellulases on the substrate surface, it would
be valuable to observe how the hydrolysis rates vary as the amount of
adsorbed cellulase increases. Igarashi et al. (2006) measured the
hydrolysis rates and specific activity of Cel7A from T. viride as its
surface density was increased on cellulose samples from Cladophora
and Halocynthia. The hydrolysis rates went through a maximum,
whereas the specific activity declined continuously; this was
attributed to overcrowding of enzymes on the substrate surface.
As of now, it cannot be concluded which of the above mentioned
rate limitations are predominant. While the role of enzyme deactivation, biphasic composition of the substrate, substrate reactivity, and
substrate accessibility have long been stated to play a major role,
fractal kinetics and jamming have only recently been shown to be
important (Bommarius et al., 2008; Väljamäe et al., 2003; Xu and
Ding, 2007). In addition to the above-mentioned causes for the
declining rates (Section 3.1 to 3.5), decrease in synergism (Ooshima
et al., 1991) and inhibition due to lignin (Mansfield et al., 1999; Zhang
and Lynd, 2004) have also been reported to reduce cellulase activities
on cellulose. According to Ooshima et al. (1991), the decrease in
specific activities of the adsorbed enzymes (with conversion) can be
explained by the decrease in synergism between endoglucanase and
exoglucanase resulting from a change in the ratio of their adsorbed
quantities. Modeling synergism and lignin contribution are discussed
in the subsequent sections.
4. Modeling synergism of cellulase components
ð42Þ
where f is the fractal dimension, k2 is the product formation rate
constant, [E] is the enzyme concentration, [P] is the product
concentration, [S] is the substrate concentration, and Km is the
Michaelis constant. The spectral dimension ds of a bimolecular
reaction is defined by ds = 2(1 − f) (Kopelman, 1988). Values of f
were found to be 0.44 (ds = 1.12) and 0.22 (ds = 1.56) for T. reesei
Cel7A and H. insolens Cel7A respectively, implying a higher processive
action for the T. reesei Cel7A. The effect of overcrowding of the
A mixture of cellulase components, cellobiohydrolases and
endoglucanases, has higher activity than the individual components
alone (Beldman et al., 1988; Fujii and Shimizu, 1986; Gusakov et al.,
2007; Henrissat et al., 1985; Kleman-Leyer et al., 1996; Nidetzky et al.,
1994b; Schell et al., 1999; Wood and McCrae, 1978; Woodward et al.,
1988a; Woodward et al., 1988b). Modeling synergistic kinetics of the
cellulases requires separate mathematical expressions for the individual components and the inclusion of cellulose chain ends as a
variable in the model. The earliest of such models was proposed by
Suga et al. (1975) for exo and endo-enzyme depolymerization of
P. Bansal et al. / Biotechnology Advances 27 (2009) 833–848
polysaccharides based on the Michaelis–Menten scheme. This model
was extended by Okazaki and Moo-Young (1978) to include product
inhibition and β-glucosidase activity. Based on these theoretical
studies, Dean and Rollings (1992) developed a model that was
inconsistent with the experimental data at longer times. The following
data were analyzed: conversion, polydispersity of polysaccharides,
synergism, weight-averaged and number-averaged molecular weights
of polysaccharides. Substrate and product inhibition, and enzyme
deactivation were stated to be possible causes for the lesser predictive
capability of the model at longer times. It is also possible that the
model class by itself is not correct, therefore, as the authors
themselves state, the above mentioned additional kinetic factors
need to be incorporated in the models to ascertain the validity/
invalidity.
Using substrate concentration as the only substrate variable, Fujii
et al. (1981) developed a model where the endo and exo activities
were represented by Michaelis–Menten expressions. The model was
evaluated for carboxymethyl cellulose and hydroxylethyl cellulose
(Fujii and Shimizu, 1986). Another Michaelis–Menten based model for
synergism was proposed by Nidetzky et al. (1994b) where an
additional term for synergism was added to the equation:
v E1; E2 = vðE1 Þ + vðE2 Þ + Vsyn: ðE1 ; E2 Þ
ð44Þ
where v(E1,E2) is the hydrolysis rate in the presence of two enzymes
E1 and E2, v(E1) and v(E2) are the individual hydrolysis rates, and vsyn.
(E1,E2) is the synergistic hydrolysis rate. However, these models based
on the Michaelis–Menten scheme have limitations, as discussed in the
Section 2.2 ‘Michaelis–Menten based models’.
Converse and Optekar (1993) took into account enzyme adsorption, degree of polymerization, and accessibility of the substrate to
model cellulose hydrolysis by cellobiohydrolase and endoglucanase.
The model matched the experimental data well till a conversion level
of approximately 40% (data from Woodward et al. (1988b)). The
adsorption and DP variations were not, however, validated by
experiments. The degree of synergism, which was shown to go
through a maximum as the cellulase concentration increased, has
been explained by the ‘substrate inhibition’ phenomenon (Väljamäe
et al., 2001). At low surface coverage of the substrate (a condition
achieved at high substrate concentration relative to enzyme),
synergism is low as cellobiohydrolases do not benefit from the new
chain ends created by endoglucanases. Substrate inhibition was also
observed by Liaw and Penner (1990), and Huang and Penner (1991),
but no implications of synergism were discussed. At high surface
coverage (low substrate/high enzyme concentrations) competition
among enzyme species for adsorption results in a decrease in
synergism. Fenske et al. (1999) used Monte Carlo simulations for an
enzyme that featured both endo and exo activity. Hydrolysis rates
were shown to be lower at low surface coverage of the substrate due
to the partial endo activity of the enzyme and went through a
maximum as the substrate concentration increased. This phenomenon was termed ‘auto-synergism’.
A deeper understanding of enzyme synergism is needed to
optimize the mixtures of endoglucanases and cellobiohydrolases.
Since the adsorbed amount of cellulases is susceptible to change along
conversion, it is crucial to study these variations and their implications
on synergism. Experimental data that corroborate model predictions
on variations in DP and chain size distributions are required to get
accurate parameter values associated with these substrate properties.
So far no work has successfully achieved such a validation. Dean and
Rollings (1992) attempted to validate their model for non-cellulosic
substrates (dextran-polysaccharide with α-1,6-glycosidic linkages)
but were unable to match the experimental data at longer residence
times. As the reaction proceeded, a change in the type of pattern in the
size distribution was observed (Kleman-Leyer et al., 1994; Kleman-
845
Leyer et al., 1996; Mansfield and Meder, 2003; Pala et al., 2007;
Rammos et al., 1993). This shows that the susceptibility of a substrate
to enzymatic attack can vary with chain size. The complexity
associated with the accessibility of the available chain ends on the
heterogeneous substrate is clearly a key issue that needs to be
addressed before depolymerization models become informative.
5. Models of pure cellulosic substrates and
lignocellulosic substrates
Lignin reduces the accessibility of cellulose to cellulases and also
adsorbs cellulases, resulting in lower hydrolysis rates (Mansfield et al.,
1999). The effect of lignin content is also evident from numerous
empirical models (see Table 1A). Since the presence of lignin can
significantly affect the hydrolysis rates, models developed for pure
cellulosic substrates cannot be extended to substrates having high
lignin content. For example, in the presence of lignin, a two-phase
model might be applicable, whereas for pure cellulosic substrate it is
not apparent. Adsorption of cellulase and β-glucosidase onto lignin
has been incorporated into a few models with rate equations (Shao
et al., 2009a) (see Eqs. (13) and (14)) and Langmuir isotherms
(Ljunggren, 2005; Pettersson et al., 2002; Philippidis et al., 1993;
Philippidis et al., 1992; Zheng et al., 2009). It was shown by Zheng
et al. (2009) that their model did not match the experimental data if
the negative role of lignin was ignored. Shin et al. (2006) accounted
for the presence of non-cellulosic materials in steam-exploded wood
by including an inhibition parameter. It has been shown that cellulases
having similar activity on pure cellulosic substrates can have different
affinities for lignin (Berlin et al., 2005). Synergism results for pure
cellulosic substrates might also be different for more realistic
substrates since the affinity of various cellulases for non-cellulosic
parts can vary. Changes in crystallinity can also be affected by lignin
(Zhang and Lynd, 2004), and hence the observation of crystallinity
variations along conversion must be interpreted carefully. The extent
to which crystallinity limits the enzymatic conversion of biomass into
sugars can depend on the lignin level and vice-versa (Zhu et al., 2008).
Since lignin is not degraded by cellulases, it can act as a barrier
resulting in stoppage of the enzymes on the substrate. In terms of
fractal kinetics, lignin and hemicellulose act as obstacles and hence
increase the fractal nature of the reaction system.
Deeper understanding of the role of lignin in enzymatic digestion
of lignocellulose and its interaction with enzymes is needed not just
for improving pretreatment technologies but also for engineering
enzymes that have lesser affinity for lignin (Berlin et al., 2005). This is
possible through quantification and modeling of lignin contribution in
various steps of the hydrolysis process.
6. Conclusions and outlook
Cellulase hydrolysis of cellulose is a reaction in heterogeneous
medium. Classical homogenous enzyme catalysis is modeled by
Michaelis–Menten kinetics and heterogeneous catalysis on a catalyst
support, by Langmuir–Hinshelwood kinetics. Cellulase kinetics on
insoluble lignocellulosic substrates is a combination of the above two
kinds of reactions and also involves other factors (product inhibition,
enzyme deactivation, substrate crystallinity, substrate accessibility
changes, substrate reactivity changes, fractal nature of the reaction,
changes in enzyme synergism, lignin inhibition), which result in
retarding the rates at higher degrees of conversion. While the models
in literature have not pinpointed the exact mechanism of enzymatic
action on lignocellulosic materials, they have helped in understanding the various factors that are at play. Additional insight will
be made possible by models consisting of the major substrate and
enzyme properties (substrate-concentration, DP, accessible fraction,
size-distribution of chains, crystallinity; enzyme-concentration,
synergistic/competitive factors, and adsorbed concentration of
846
P. Bansal et al. / Biotechnology Advances 27 (2009) 833–848
individual components). However, due to the increase in the
number of parameters, such models need to be validated with
experimental data other than conversion-time profiles to distinguish between the various causes of decreasing rates. It is clear from
the research reviewed in this article that adsorption, substrate
reactivity, and accessibility can change along conversion. Therefore,
their dynamic nature must be taken into consideration when
building models. The range of conversion for checking the predictive
ability of a model is also important, since major slowdowns are
observed at high conversions. Only one-third of the models
reported have been validated with data beyond 70% conversion
(see Tables 1A–D).
Improvements in enzyme catalysis have mainly been guided by the
engineering of the active site or amino acid residues identified as
playing an important role. In the case of cellulases and their kinetics
on insoluble lignocellulosic substrates, rate limitations cannot be
explained solely by active-site considerations, mostly because of the
heterogeneity of the substrate. Information regarding the catalytic
domain, the binding domain, and the linker region (the three domains
of a cellulase) through advances in structural biology will certainly
contribute to a more complete understanding of the operation of
cellulases at the molecular level. Additionally, to significantly improve
the enzymatic process, contributions of the various substrate
characteristics need to be quantified to specifically target the enzyme
and substrate features that need improvement.
Acknowledgment
The authors thank the Chevron Corporation for the financial support.
References
Al-Zuhair S. The effect of crystallinity of cellulose on the rate of reducing sugars
production by heterogeneous enzymatic hydrolysis. Bioresource Technol 2008;99:
4078–85.
Anacker LW, Kopelman R. Steady-state chemical kinetics on fractals: segregation of
reactants. Phys Rev Lett 1987;58:289–91.
Asenjo JA. Maximizing the formation of glucose in the enzymatic hydrolysis of insoluble
cellulose. Biotechnol Bioeng 1983;25:3185–90.
Asenjo JA. Modelling the bioconversion of cellulose into microbial products: rate
limitations. Process Biochem 1984;19:217–24.
Bader J, Bellgardt KH, Singh A, Kumar PKR, Schugerl K. Modelling and simulation of
cellulase adsorption and recycling during enzymatic hydrolysis of cellulosic
materials. Bioprocess Eng 1992;7:235–40.
Beldman G, Voragen AGJ, Rombouts FM, MFS-v Leeuwen, Pilnik W. Adsorption and
kinetic behaviour of purified endoglucanases and exoglucanases from Trichoderma
viride. Biotechnol Bioeng 1987;30:251–7.
Beldman G, Voragen AGJ, Rombouts FM, Pilnik W. Synergism in cellulose hydrolysis by
endoglucanases and exoglucanases purified from Trichoderma viride. Biotechnol
Bioeng 1988;31:173–8.
Beltrame PL, Carniti P, Focher B, Marzetti A, Sarto V. Enzymatic hydrolysis of cellulosic
materials: a kinetic study. Biotechnol Bioeng 1984;26:1233–8.
Berlin A, Gilkes N, Kurabi A, Bura R, Tu M, Kilburn D, et al. Weak lignin-binding enzymes.
Appl Biochem Biotech 2005;121–124:163–70.
Berlin A, Maximenko V, Gilkes N, Saddler J. Optimization of enzyme complexes for
lignocellulose hydrolysis. Biotechnol Bioeng 2007;97:287–96.
Berry H. Monte Carlo simulations of enzyme reactions in two dimensions: fractal
kinetics and spatial segregation. Biophys J 2002;83:1891–901.
Bertran MS, Dale BE. Enzymatic hydrolysis and recrystallization behaviour of initially
amorphous cellulose. Biotechnol Bioeng 1985;27:177–81.
Bezerra RMF, Dias AA. Discrimination among eight modified Michaelis–Menten kinetics
models of cellulose hydrolysis with a large range of substrate/enzyme ratios. Appl
Biochem Biotech 2004;112:173–84.
Bezerra RMF, Dias AA. Enzymatic kinetic of cellulose hydrolysis. Appl Environ Microb
2005;126:49–59.
Bommarius AS, Katona A, Cheben SE, Patel AS, Ragauskas AJ, Knudson K, et al. Cellulase
kinetics as a function of cellulose pretreatment. Metab Eng 2008;10:370–81.
Brown RF, Holtzapple MT. A comparison of the Michaelis–Menten and HCH-1 models.
Biotechnol Bioeng 1990;36:1151–4.
Caminal G, López-Santín J, Solà C. Kinetic modeling of the enzymatic hydrolysis of
pretreated cellulose. Biotechnol Bioeng 1985;27:1282–90.
Chang VS, Holtzapple MT. Fundamental factors affecting biomass enzymatic reactivity.
Appl Biochem Biotech 2000;84–86:5-37.
Chen Y, Stipanovic AJ, Winter WT, Wilson DB, Kim YJ. Effect of digestion by pure
cellulases on crystallinity and average chain length for bacterial and microcrystalline celluloses. Cellulose 2007;14:283–93.
Converse AO, Matsuno R, Tanaka M, Taniguchi M. A model of enzyme adsorption and
hydrolysis of microcrystalline cellulose with slow deactivation of the adsorbed
enzyme. Biotechnol Bioeng 1988;32:38–45.
Converse AO, Ooshima H, Burns DS. Kinetics of enzymatic hydrolysis of lignocellulosic
materials based on surface area of cellulose accessible to enzyme and enzyme
adsorption on lignin and cellulose. Appl Biochem Biotech 1990;24/25:67–73.
Converse AO, Optekar JD. A synergistic kinetics model for enzymatic cellulose
hydrolysis compared to degree-of-synergism experimental results. Biotechnol
Bioeng 1993;42:145–8.
Dean III SW, Rollings JE. Analysis and quantification of a mixed exo-acting and endo-acting
polysaccharide depolymerization system. Biotechnol Bioeng 1992;39:968–76.
Desai SG, Converse AO. Substrate reactivity as a function of the extent of reaction in the
enzymatic hydrolysis of lignocellulose. Biotechnol Bioeng 1997;56:650–5.
Ding H, Xu F. Productive cellulase adsorption on cellulose. ACS sym ser 2004;889:154–69.
Divne C, Ståhlberg J, Teeri TT, Jones TA. High-resolution crystal structures reveal how a
cellulose chain is bound in the 50 Å long tunnel of cellobiohydrolase I from Trichoderma reesei. J Mol Biol 1998;275:309–25.
Drissen RET, Maas RHW, Maarel MJECVD, Kabel MA, Schols HA, Tramper J, et al. A generic
model for glucose production from various cellulose sources by a commercial cellulase
complex. Biocatal Biotransfor 2007;25:419–29.
Eriksson T, Karlsson J, Tjerneld F. A model explaining declining rate in hydrolysis of
lignocellulose substrates with cellobiohydrolase I (Cel7A) and endoglucanase I
(Cel7B) of Trichoderma reesei. Appl Biochem Biotech 2002;101:41–60.
Fan LT, Lee YH. Kinetic studies of enzymatic hydrolysis of insoluble cellulose: derivation
of a mechanistic kinetic model. Biotechnol Bioeng 1983;25:2707–33.
Fenske JJ, Penner MH, Bolt JP. A simple individual-based model of insoluble polysaccharide
hydrolysis: the potential for autosynergism with dual-activity glycosidases. J Theor
Biol 1999;199:113–8.
Fogler HS. Elements of Chemical Reaction Engineering. Prentice Hall; 2005.
Fujii M, Murakami S, Yamada Y, Ona T, Nakamura T. A kinetic equation for hydrolysis of
polysaccharides by mixed exo- and endoenzyme systems. Biotechnol Bioeng
1981;23:1393–8.
Fujii M, Shimizu M. Synergism of endoenzyme and exoenzyme on hydrolysis of soluble
cellulose derivatives. Biotechnol Bioeng 1986;28:878–82.
Galbe M, Zacchi G. A review of the production of ethanol from softwood. Appl Microbiol
Biotechnol 2002;59:618–28.
Gan Q, Allen SJ, Taylor G. Kinetic dynamics in heterogeneous enzymatic hydrolysis of
cellulose: an overview, an experimental study and mathematical modeling. Process
Biochem 2003;38:1003–18.
Gharpuray MM, Lee YH, Fan LT. Structural modification of lignocellulosics by pretreatments
to enhance enzymatic hydrolysis. Biotechnol Bioeng 1983;25:157–72.
Ghose TK, Bisaria VS. Studies on the mechanism of enzymatic hydrolysis of cellulosic
substances. Biotechnol Bioeng 1979;21:131–46.
Gregg DJ, Saddler JN. Factors affecting cellulose hydrolysis and the potential of enzyme
recycle to enhance the efficiency of an integrated wood to ethanol process.
Biotechnol Bioeng 1996;51:375–83.
Gupta R, Lee YY. Mechanism of cellulose reaction on pure cellulosic substrates.
Biotechnol Bioeng 2008;102:1570–81.
Gusakov AV, Salanovich TN, Antonov AI, Ustinov BB, Okunev ON, Burlingame R, et al.
Design of highly efficient cellulase mixtures for enzymatic hydrolysis of cellulose.
Biotechnol Bioeng 2007;97:1028–38.
Gusakov AV, Sinitsyn AP, Klyosov AA. Kinetics of the enzymatic hydrolysis of cellulose:
1. A mathematical model for a batch reactor process. Enzyme Microb Technol
1985;7:346–52.
Harjunpää V, Teleman A, Koivula A, Ruohonen L, Teeri TT, Teleman O, et al. Cellooligosaccharide hydrolysis by cellobiohydrolase II from Trichoderma reesei. Eur J
Biochem 1996;240:584–91.
Henrissat B. Cellulases and their interaction with cellulose. Cellulose 1994;1:169–96.
Henrissat B, Driguez H, Viet C, Schülein M. Synergism of cellulases from Trichoderma
reesei in the degradation of cellulose. Bio/Technology 1985;3:722–6.
Himmel ME, Ding SY, Johnson DK, Adney WS, Nimlos MR, Brady JW, et al. Biomass
recalcitrance: engineering plants and enzymes for biofuels production. Science
2007;315:804–7.
Hodge DB, Karim MN, Schell DJ, McMillan JD. Model-based fed-batch for high-solids
enzymatic cellulose hydrolysis. Appl Biochem Biotech 2009;152:88-107.
Holtzapple M, Cognata M, Shu Y, Hendrickson C. Inhibition of Trichoderma reesei
cellulase by sugars and solvents. Biotechnol Bioeng 1990;36:275–87.
Holtzapple MT, Caram HS, Humphrey AE. The HCH-1 model of enzymatic cellulose
hydrolysis. Biotechnol Bioeng 1984;26:775–80.
Hong J, Ye X, Zhang YHP. Quantitative determination of cellulose accessibility to
cellulase based on adsorption of a nonhydrolytic fusion protein containing CBM and
GFP with its applications. Langmuir 2007;23:12535–40.
Howell JA. Enzyme deactivation during cellulose hydrolysis. Biotechnol Bioeng
1978;20:847–63.
Howell JA, Stuck JD. Kinetics of solka floc cellulose hydrolysis by Trichoderma viride
cellulase. Biotechnol Bioeng 1975;17:873–93.
Huang AA. Kinetic studies on insoluble cellulose–cellulase system. Biotechnol Bioeng
1975;17:1421–33.
Huang X, Penner MH. Apparent substrate inhibition of the Trichoderma reesei cellulase
system. J Agr Food Chem 1991;39:2096–100.
Igarashi K, Wada M, Hori R, Samejima M. Surface density of cellobiohydrolase on
crystalline celluloses A critical parameter to evaluate enzymatic kinetics at a solid–
liquid interface. FEBS J 2006;273:2869–78.
Jeoh T, Ishizawa CI, Davis MF, Himmel M, Adney WS, Johnson DK. Cellulase digestibility of
pretreated biomass is limited by cellulase accessibility. Biotechnol Bioeng 2007;98:
112–22.
P. Bansal et al. / Biotechnology Advances 27 (2009) 833–848
Jeoh T, Wilson DB, Walker LP. Effect of cellulase mole fraction and cellulose recalcitrance
on synergism in cellulose hydrolysis and binding. Biotechnol Progr 2006;22:270–7.
Jervis EJ, Haynes CA, Kilburn DG. Surface diffusion of cellulases and their isolated
binding domains on cellulose. J Biol Chem 1997;272:24016–23.
Kadam KL, Rydholm EC, McMillan JD. Development and validation of a kinetic model for
enzymatic saccharification of lignocellulosic biomass. Biotechnol Progr 2004;20:
698–705.
Kim DW, Jeong YK, Lee JK. Adsorption kinetics of exoglucanase in combination with
endoglucanase from Trichoderma viride on microcrystalline cellulose and its
influence on synergistic degradation. Enzyme Microb Technol 1994;16:649–58.
Kim JK, Oh BR, Shin HJ, Eom CY, Kim SW. Statistical optimization of enzymatic
saccharification and ethanol fermentation using food waste. Process Biochem 2008;43:
1308–12.
Kim S, Holtzapple MT. Effect of structural features on enzyme digestibility of corn
stover. Bioresource Technol 2006;97:583–91.
Kipper K, Väljamäe P, Johansson G. Processive action of cellobiohydrolase Cel7A from
Trichoderma reesei is revealed as ‘burst’ kinetics on fluorescent polymeric model
substrates. Biochem J 2005;385:527–35.
Kleman-Leyer KM, Gilkes NR, Jr. RCM, Kirk TK. Changes in the molecular-size
distribution of insoluble celluloses by the action of recombinant Cellulomonas
fimi cellulases. Biochem J 1994;302:463–9.
Kleman-Leyer KM, Siika-Aho M, Teeri TT, Kirk TK. The cellulases endoglucanase I and
cellobiohydrolase II of Trichoderma reesei act synergistically to solubilize native cotton
cellulose but not to decrease its molecular size. Appl Environ Microb 1996;62: 2883–7.
Kopelman R. Rate processes on fractals: theory, simulations and experiments. J Stat Phys
1986;42:185–200.
Kopelman R. Fractal reaction kinetics. Science 1988;241:1620–6.
Koullas DP, Christakopoulos P, Kekos D, Macris BJ, Koukios EG. Correlating the effect of
pretreatment on the enzymatic hydrolysis of straw. Biotechnol Bioeng 1992;39:113–6.
Kurakake M, Shirasawa T, Ooshima H, Converse AO, Kato J. An extension of the Harano–
Ooshima rate expression for enzymatic hydrolysis of cellulose to account for changes
in the amount of adsorbed cellulase. Appl Biochem Biotech 1995;50:231–41.
Laidler KJ. Theory of the transient phase in kinetics, with special reference to enzyme
systems. Can J Chemistry 1955;33:1614–24.
Laureano-Perez L, Teymouri F, Alizadeh H, Dale BE. Understanding factors that limit
enzymatic hydrolysis of biomass. Appl Biochem Biotech 2005;121–124:1081–99.
Lee YH, Fan LT. Kinetic studies of enzymatic-hydrolysis of insoluble cellulose. (2).
Analysis of extended hydrolysis times. Biotechnol Bioeng 1983;25:939–66.
Lee YH, Fan LT, Fan LS. Kinetics of hydrolysis of insoluble cellulose by cellulase. Adv
Biochem Eng Biot 1980;17:131–68.
Lenz J, Esterbauer H, Sattler W, Schurz J, Wrentschur E. Changes of structure and
morphology of regenerated cellulose caused by acid and enzymatic hydrolysis. J Appl
Polym Sci 1990;41:1315–26.
Liao W, Liu Y, Wen Z, Frear C, Chen S. Kinetic modeling of enzymatic hydrolysis of
cellulose in differently pretreated fibers from dairy manure. Biotechnol Bioeng
2008;101:441–51.
Liaw ET, Penner MH. Substrate–velocity relationships for the Trichoderma viride
cellulase-catalyzed hydrolysis of cellulose. Appl Environ Microb 1990;56:2311–8.
Lin JianQiang, Lee SM, Koo YM. Modeling and simulation of simultaneous saccharification and fermentation of paper mill sludge to lactic acid. J Microbiol Biotechn
2005;15:40–7.
Lineweaver H, Burk D. The determination of enzyme dissociation constants. J Am Chem
Soc 1934;56:658–66.
Ljunggren M. Kinetic Analysis and modeling of enzymatic hydrolysis and SSF; 2005.
http://www.chemeng.lth.se/exjobb/061.pdf.
Luo J, Xia L, Lin J, Cen P. Kinetics of simultaneous saccharification and lactic acid
fermentation processes. Biotechnol Progr 1997;13:762–7.
Lynd LR, Laser MS, Bransby D, Dale BE, Davison B, Hamilton R, et al. How biotech can
transform biofuels. Nat Biotechnol 2008;26:169–72.
Lynd LR, Weimer PJ, WHv Zyl, Pretorius IS. Microbial cellulose utilization: fundamentals
and biotechnology. Microbiol Mol Biol R 2002;66:506–77.
Maguire RJ. Kinetics of the hydrolysis of cellulose by beta-1,4-glucan cellobiohydrolase
of Trichoderma viride. Can J Biochem 1977;55:644–50.
Mansfield SD, Meder R. Cellulose hydrolysis — the role of monocomponent cellulases in
crystalline cellulose degradation. Cellulose 2003;10:159–69.
Mansfield SD, Mooney C, Saddler JN. Substrate and enzyme characteristics that limit
cellulose hydrolysis. Biotechnol Progr 1999;15:804–16.
Medve J, Karlsson J, Lee D, Tjerneld F. Hydrolysis of microcrystalline cellulose by
cellobiohydrolase I and endoglucanase II from Trichoderma reesei: adsorption, sugar
production, and synergism of the enzymes. Biotechnol Bioeng 1998;59:621–34.
Medve J, Ståhlberg J, Tjerneld F. Adsorption and synergism of cellobiohydrolase I and II
of Trichoderma reesei during hydrolysis of microcrystalline cellulose. Biotechnol
Bioeng 1994;44:1064–73.
Medve J, Ståhlberg J, Tjerneld F. Isotherms for adsorption of cellobiohydrolase I and II from
trichoderma reesei on microcrystalline cellulose. Appl Biochem Biotech 1997;66:
39–56.
Meinke A, Gilkes NR, Kilburn DG, Jr. RCM, Warren RAJ. Cellulose-binding polypeptides
from Cellulomonas fimi: endoglucanase D (CenD), a family A β-1,4-glucanase.
J Bacteriol 1993;175:1910–8.
Michaelis L, Menten ML. Die kinetik der invertinwirkung. Biochem Z 1913;49:333–69.
Moldes AB, Alonso JL, Parajó JC. Cogeneration of cellobiose and glucose from pretreated
wood and bioconversion to lactic acid: a kinetic study. J Biosci Bioeng 1999;87:787–92.
Moon H, Kim JS, Oh KK, Kim SW, Hong SI. Kinetic modeling of simultaneous
saccharification and fermentation for ethanol production using steam-exploded
wood with glucose- and cellobiose-fermenting yeast, Brettanomyces custersii. J
Microbiol Biotechn 2001;11:598–606.
847
Movagarnejad K, Sohrabi M, Kaghazchi T, Vahabzadeh F. A model for the rate of
enzymatic hydrolysis of cellulose in heterogeneous solid–liquid systems. Biochem
Eng J 2000;4:197–206.
Movagharnejad K. Modified shrinking particle model for the rate of enzymatic
hydrolysis of impure cellulosic waste materials with enzyme reuse by the substrate
replacement. Biochem Eng J 2005;24:217–23.
Movagharnejad K, Sohrabi M. A model for the rate of enzymatic hydrolysis of some
cellulosic waste materials in heterogeneous solid–liquid systems. Biochem Eng J
2003;14:1–8.
Mulakala C, Reilly PJ. Hypocrea jecorina (Trichoderma reesei) Cel7A as a molecular
machine: a docking study. Proteins Struct Funct Bioinf 2005;60:598–605.
Nakasaki K, Murai T, Akiyama T. Kinetic modeling of simultaneous saccharification and
fermentation of cellulose. J Chem Eng Jpn 1988;21:436–8.
Nassar R, Chou ST, Fan LT. Stochastic anaysis of stepwise cellulose degradation. Chem
Eng Sci 1991;46:1651–7.
Nidetzky B, Steiner W. A new approach for modeling cellulase–cellulose adsorption and
the kinetics of the enzymatic hydrolysis of microcrystalline cellulose. Biotechnol
Bioeng 1993;42:469–79.
Nidetzky B, Steiner W, Claeyssens M. Cellulose hydrolysis by the cellulases from Trichoderma reesei: adsorptions of two cellobiohydrolases, two endocellulases and
their core proteins on filter paper and their relation to hydrolysis. Biochem J
1994a;308:817–23.
Nidetzky B, Steiner W, Hayn M, Claeyssens M. Cellulose hydrolysis by the cellulases from
Trichoderma reesei: a new model for synergistic interaction. Biochem J 1994b;298:
705–10.
Nidetzky B, Steiner W, Hayn M, Esterbauer H. Enzymatic hydrolysis of wheat straw after
steam pretreatment: experimental data and kinetic modeling. Bioresource Technol
1993;44:25–32.
Nidetzky B, Zachariae W, Gercken G, Hayn M, Steiner W. Hydrolysis of cellooligosaccharides by Trichoderma ressei cellobiohydrolases: experimental data and kinetic
modeling. Enzyme Microb Technol 1994c;16:43–52.
Nutor JRK, Converse AO. The effect of enzyme and substrate levels on the specific hydrolysis
rate of pretreated poplar wood. Appl Biochem Biotech 1991;28/29:757–71.
O'Dwyer JP, Zhu L, Granda CB, Chang VS, Holtzapple MT. Neural network prediction of
biomass digestibility based on structural features. Biotechnol Progr 2008;24:283–92.
O'Dwyer JP, Zhu L, Granda CB, Holtzapple MT. Enzymatic hydrolysis of lime-pretreated corn
stover and investigation of the HCH-1 Model: inhibition pattern, degree of inhibition,
validity of simplified HCH-1 Model. Bioresource Technol 2007;98:2969–77.
Oh KK, Kim SW, Jeong YS, Hong SI. Bioconversion of cellulose into ethanol by
nonisothermal simultaneous saccharification and fermentation. Appl Biochem Biotech
2000;89:15–30.
Ohmine K, Ooshima H, Harano Y. Kinetic study on enzymatic hydrolysis of cellulose by
cellulase from Trichoderma Viride. Biotechnol Bioeng 1983;25:2041–53.
Okazaki M, Moo-Young M. Kinetics of enzymatic hydrolysis of cellulose: analytical
description of a mechanistic model. Biotechnol Bioeng 1978;20:637–63.
Ooshima H, Kurakake M, Kato J, Harano Y. Enzymatic activity of cellulose adsorbed on
cellulose and its change during hydrolysis. Appl Biochem Biotech 1991;31:253–66.
Ooshima H, Sakata M, Harano Y. Adsorption of cellulase from Trichoderma viride on
cellulose. Biotechnol Bioeng 1983;25:3103–14.
Pala H, Mota M, Gama FM. Enzymatic depolymerisation of cellulose. Carbohyd Polym
2007;68:101–8.
Parajó JC, Alonso JL, Santos V. Development of a generalized phenomenological model
describing the kinetics of the enzymatic hydrolysis of NaOH-treated pine wood.
Appl Biochem Biotech 1996;56:289–99.
Park EY, Ikeda Y, Okuda N. Empirical evaluation of cellulase on enzymatic hydrolysis of
waste office paper. Biotechol Bioproc E 2002;7:268–74.
Peiterson N, Ross Edward WJ. Mathematical model for enzymatic hydrolysis and
fermentation of cellulose by Trichoderma. Biotechnol Bioeng 1979:997-1017.
Peri S, Karra S, Lee YY, Karim MN. Modeling intrinsic kinetics of enzymatic cellulose
hydrolysis. Biotechnol Progr 2007;23:626–37.
Pettersson PO, Eklund R, Zacchi G. Modeling simultaneous saccharification and
fermentation of softwood. Appl Biochem Biotech 2002;98–100:733–46.
Philippidis GP, Smith TK, Wyman CE. Study of the enzymatic hydrolysis of cellulose for
production of fuel ethanol by the simultaneous saccharification and fermentation
process. Biotechnol Bioeng 1993;41:846–53.
Philippidis GP, Spindler DD, Wyman CE. Mathematical modeling of cellulose conversion
to ethanol by the simultaneous saccharification and fermentation process. Appl
Biochem Biotech 1992;34/35:543–56.
Puls J, Wood TM. The degradation pattern of cellulose by extracellular cellulases of
aerobic and anaerobic microorganisms. Bioresource Technol 1991;36:15–9.
Rabinovich ML, Melnick MS, Bolobova AV. The structure and mechanism of action of
cellulolytic enzymes. Biochemistry-Moscow 2002;67:850–71.
Rammos LP, Nazhad MM, Saddler JN. Effect of enzymatic hydrolysis on the morphology and
fine structure of pretreated cellulosic residues. Enzyme Microb Technol 1993;15:821–31.
Reinikainen T, Ruohonen L, Nevanen T, Laaksonen L, Kraulis P, Jones TA, et al.
Investigation of the function of mutated cellulose-binding domains of Trichoderma
reesei Cellobiohydrolase I. Proteins Struct Funct Bioinf 1992;14:475–82.
Ryu DDY, Lee SB, Tassinari T, Macy C. Effect of compression milling on cellulose structure
and on enzymatic hydrolysis kinetics. Biotechnol Bioeng 1982;24:1047–67.
Sattler W, Esterbauer H, Glatter O, Steiner W. The effect enzyme concentration on the
rate of the hydrolysis of cellulose. Biotechnol Bioeng 1989;33:1221–34.
Savageau MA. Michaelis–Menten mechanism reconsidered: implications of fractal
kinetics. J Theor Biol 1995;176:115–24.
Scheiding W, Thoma M, Ross A, Schugerl K. Modelling of the enzymatic hydrolysis of
cellobiose and cellulose by a complex enzyme mixture of Trichoderma reesei
QM9414. Appl Microbiol Biotechnol 1984;20:176–82.
848
P. Bansal et al. / Biotechnology Advances 27 (2009) 833–848
Schell DJ, Ruth MF, Tucker MP. Modeling the enzymatic hydrolysis of dilute-acid
pretreated douglas fir. Appl Biochem Biotech 1999;77–79:67–81.
Schmid G, Wandrey C. Characterization of a cellodextrin glucohydrolase with soluble
oligomeric substrate: experimental results and modeling concentration-timecourse data. Biotechnol Bioeng 1989;33:1445–60.
Schnell S. A century of enzyme kinetics: reliability of the KM and vmax estimates.
Comment Theor Biol 2003;8:169–87.
Schubert C. Can biofuels finally take center stage? Nat Biotechnol 2006;24:777–84.
Shao X, Lynd L, Wyman C. Kinetic modeling of cellulosic biomass to ethanol via
simultaneous saccharification and fermentation: Part II. Experimental Validation
using waste paper sludge and anticipation of CFD analysis. Biotechnol Bioeng
2009a;102:66–72.
Shao X, Lynd L, Wyman C, Bakker A. Kinetic modeling of cellulosic biomass to ethanol via
simultaneous saccharification and fermentation: Part I. Accomodation of intermittent
feeding and analysis of staged reactors. Biotechnol Bioeng 2009b;102:59–65.
Shen J, Agblevor FA. Kinetics of enzymatic hydrolysis of steam-exploded cotton gin
waste. Chem Eng Commun 2008a;195:1107–21.
Shen J, Agblevor FA. Optimization of enzyme loading and hydrolytic time in the
hydrolysis of mixtures of cotton gin waste and recycled paper sludge for the
maximum profit rate. Biochem Eng J 2008b;41:241–50.
Shen Y, Wang LM, Sun K. Kinetics of the cellulase catalyzed hydrolysis of cellulose fibres.
Text Res J 2004;74:539–45.
Sheridan C. Europe lags, US leads 2nd-generation biofuels. Nat Biotechnol 2008;26:
1319–21.
Shin Donggyun, Yoo A, Kim SW, Yang DR. Cybernetic modeling of simultaneous
saccharification and fermentation for ethanol production from steam-exploded
wood with Brettanomyces custersii. J Microbiol Biotechn 2006;16:1355–61.
South CR, Hogsett DAL, Lynd LR. Modeling simultaneous saccharification and
fermentation of lignocellulose to ethanol in batch and continuous reactors. Enzyme
Microb Technol 1995;17:797–803.
Ståhlberg J, Johannson G, Pettersson G. A new model for enzymatic hydrolysis of
cellulose based on the two-domain structure of cellobiohydrolase I. Nat Biotechnol
1991;9:286–90.
Steiner W, Sattler W, Esterbauer H. Adsorption of Trichoderma reesei cellulase on
cellulose: experimental data and their analysis by different equations. Biotechnol
Bioeng 1988;32:853–65.
Stenberg K, Bollók M, Réczey K, Galbe M, Zacchi G. Effect of substrate and cellulase
concentration on simultaneous saccharification and fermentation of steampretreated softwood for ethanol production. Biotechnol Bioeng 2000;68:204–10.
Suga K, Gv Dedem, Moo-Young M. Degradation of polysaccharides by endo and exo
enzymes: a theoretical analysis. Biotechnol Bioeng 1975;17:433–9.
Sun Y, Cheng J. Hydrolysis of lignocellulosic materials for ethanol production: a review.
Bioresource Technol 2002;83:1-11.
Szijártó N, Siika-aho M, Tenkanen M, Alapuranen M, Vehmaanperä J, Réczey K, et al.
Hydrolysis of amorphous and crystalline cellulose by heterologously produced
cellulases of Melanocarpus albomyces. J Biotechnol 2008;136:140–7.
Tarantili PA, Koullas DP, Christakopoulos P, Kekos D, Koukios EG, Macris BJ. Crosssynergism in enzymatic hydrolysis of lignocellulosics: mathematical correlations
according to a hyperbolic model. Biomass Bioenerg 1996;10:213–9.
Teeri TT. Crystalline cellulose degradation: new insight into the function of
cellobiohydrolases. Trends Biotechnol 1997;15:160–7.
Ting CL, Marakov DE, Wang ZG. A kinetic model for the enzymatic action of cellulase. J
Phys Chem B 2009;113:4970–7.
Tu M, Chandra RP, Saddler JN. Evaluating the distribution of cellulases and the recycling
of free cellulases during the hydrolysis of lignocellulosic substrates. Biotechnol
Progr 2007;23:398–406.
Väljamäe P, Kipper K, Petterson G, Johansson G. Synergistic cellulose hydrolysis can be
described in terms of fractal-like kinetics. Biotechnol Bioeng 2003;84:254–7.
Väljamäe P, Petterson G, Johansson G. Mechanism of substrate inhibition in cellulose
synergistic degradation. Eur J Biochem 2001;268:4520–6.
Väljamäe P, Sild V, Nutt A, Pettersson G, Johansson G. Acid hydrolysis of bacterial
cellulose reveals different modes of synergistic action between cellobiohydrolase I
and endoglucanase I. Eur J Biochem 1999;266:327–34.
Väljamäe P, Sild V, Pettersson G, Johansson G. The initial kinetics of hydrolysis by
cellobiohydrolases I and II is consistent with a cellulose surface — erosion model.
Eur J Biochem 1998;253:469–75.
Vásquez MP, Silva JNCd Jr, MBdS, Jr. NP. Enzymatic hydrolysis optimization to ethanol
production by simultaneous saccharification and fermentation. Appl Biochem
Biotech 2007;136–140:141–53.
Wald S, Wilke CR, Blanch HW. Kinetics of the enzymatic hydrolysis of cellulose.
Biotechnol Bioeng 1984;26:221–30.
Waltz E. Will the current biofuels boom go bust? Nat Biotechnol 2007;25:491–2.
Wood TM. Properties and modes of action of cellulases. Biotechnol Bioeng Symp 1975;5:
111–37.
Wood TM, McCrae SI. The cellulase of Trichoderma koningii. Purification and properties
of some endoglucanase components with special reference to their action on
cellulose when acting alone and in synergism with the cellobiohydrolase. Biochem J
1978;171:61–72.
Woodward J, Hayes MK, Lee NE. Hydrolysis of cellulose by saturating and non-saturating
concentrations of cellulase: implications for synergism. Bio/Technology 1988a;6:
301–4.
Woodward J, Lima M, Lee NE. The role of cellulase concentration in determining the degree
of synergism in the hydrolysis of microcrystalline cellulose. Biochem J 1988b;255:
895–9.
Xiao Z, Zhang X, Gregg DJ, Saddler JN. Effects of sugar inhibition on cellulases and
glucosidase during enzymatic hydrolysis of softwood substrates. Appl Environ
Microb 2004;113–116:1115–26.
Xu F, Ding H. A new kinetic model for heterogeneous (or spatially confined) enzymatic
catalysis: contributions from the fractal and jamming (overcrowding) effects. Appl
Catal A-Gen 2007;317:70–81.
Yang B, Willies DM, Wyman CE. Changes in the enzymatic hydrolysis rate of avicel
cellulose with conversion. Biotechnol Bioeng 2006;94:1122–8.
Yue Z, Bin W, Baixu Y, Peiji G. Mechanism of cellobiose inhibition in cellulose hydrolysis
by cellobiohydrolase. Sci China Ser C 2004;47:18–24.
Zhang S, Wolfgang DE, Wilson DB. substrate heterogeneity causes the nonlinear kinetics
of insoluble cellulose hydrolysis. Biotechnol Bioeng 1999;66:35–41.
Zhang YHP, Lynd LR. Toward an aggregated understanding of enzymatic hydrolysis of
cellulose: noncomplexed cellulase systems. Biotechnol Bioeng 2004;88:797–824.
Zhang YHP, Lynd LR. Determination of the number-average degree of polymerization of
cellodextrins and cellulose with application to enzymatic hydrolysis. Biomacromolecules 2005;6:1510–5.
Zhang YHP, Lynd LR. A functionally based model for hydrolysis of cellulose by fungal
cellulase. Biotechnol Bioeng 2006.
Zheng Y, Pan Z, Zhang R, Jenkins BM. Kinetic modeling for enzymatic hydrolysis of
pretreated creeping wild ryegrass. Biotechnol Bioeng 2009;102:1558–69.
Zhou J, Wang YH, Chu J, Luo LZ, Zhuang YP, Zhang SL. Optimization of cellulase mixture
for efficient hydrolysis of steam-exploded corn stover by statistically designed
experiments. Bioresource Technol 2009;100:819–25.
Zhu L, O'Dwyer JP, Chang VS, Granda CB, Holtzapple MT. Structural features affecting
biomass enzymatic digestibility. Bioresource Technol 2008;99:3817–28.
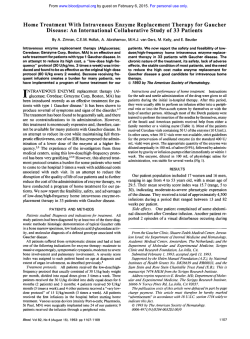
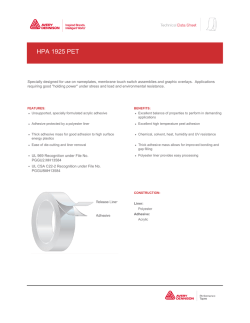
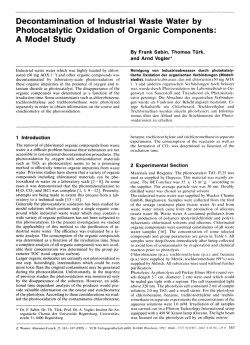
© Copyright 2026