
Federal Reserve Bank of San Francisco | San Francisco Fed, SF
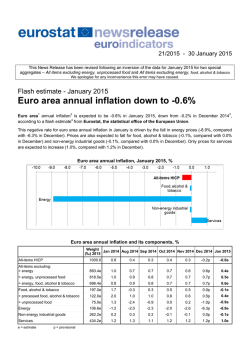
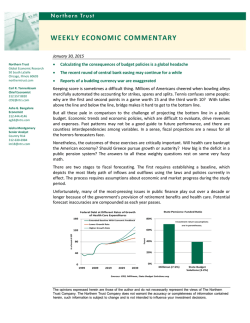
FRBSF ECONOMIC LETTER
2010-02
January 19, 2010
Inflation: Mind the Gap
BY
ZHENG LIU AND GLENN RUDEBUSCH
Monetary policymakers have long debated the usefulness of the Phillips curve, which relates
inflation to measures of economic slack. Since the recession started in late 2007, evidence
suggests that, consistent with the Phillips curve, a high level of unemployment has contributed to
a decline in inflation.
Since the fourth quarter of 2007, inflation has declined substantially. During the same period, the
unemployment rate has more than doubled. Are these two developments connected?
The well-known Phillips curve model suggests that that the high level of unemployment and pervasive
slack in the economy could contribute to the decline in inflation. Many economists argue that the Phillips
curve relationship between unemployment and inflation is a key part of the linkage between the
monetary policy instrument—the short-term interest rate—and the monetary policy objective of price
stability (Rudebusch and Svensson 1999). However, Phillips curve skeptics maintain that there is little
empirical evidence of a relationship between economic slack and inflation. For example, Atkeson and
Ohanian (2001) find that, from 1984 to 1999, Phillips curve forecasts are no better than naive forecasts
that assume inflation will not change, that is that it will be the same over the next year as it has been over
the past year.
The issue of whether the Phillips curve is useful for understanding inflation behavior has figured
prominently in monetary policy discussions, with Federal Open Market Committee (FOMC) members
expressing opposing views. The following quote from the FOMC minutes in August 2009 reflects this
disagreement:
Most participants anticipated that substantial slack in resource utilization would lead to subdued
and potentially declining wage and price inflation over the next few years; a few saw a risk of
substantial disinflation. However, some other participants were skeptical that temporarily low levels
of resource utilization would reduce inflation appreciably, given [the] loose empirical relationship of
economic slack to inflation and the fact that the public did not appear to have reduced its
expectations of inflation.
This Economic Letter examines recent evidence concerning the connection between unemployment and
inflation. We argue that, in a deep economic downturn such as the current one, inflation and
unemployment do tend to move together in a manner consistent with the Phillips curve. But, outside of
such severe recessions, fluctuations in the inflation and unemployment rates do not line up particularly
well. Inflation appears to be buffeted by many other factors. This explains why some studies find only a
“loose empirical relationship” between economic slack and inflation. Thus, compared with the relatively
tranquil period between the mid-1980s and the mid-2000s, evidence suggests that recent high
FRBSF Economic Letter 2010-02
January 19, 2010
unemployment rates are broadly consistent with the sizable decline in core inflation since the fourth
quarter of 2007, a relationship that broadly fits the Phillips curve model.
Unemployment and inflation
A simple economic rationale explains why changes in the unemployment rate help determine
movements in inflation. The law of supply and demand suggests that excess supply of a good tends to
push down its price, while excess demand tends to push up the price. The unemployment rate is a key
indicator of the balance of supply and demand in the labor market. During periods of high
unemployment, the abundance of jobless workers and the scarcity of job vacancies put downward
pressure on wages. With labor costs well contained, businesses have less need to raise prices. And with
weak demand for goods and services in such periods, businesses often can’t raise prices.
Change in Q4/Q4 core PCE inflation
Figure 1 illustrates the Phillips curve
Figure 1
by plotting the historical relationship
Unemployment and change in inflation
between annual unemployment rates
Change in inflation=
2.5
and changes in year-over-year core
1.6 - .3 x Unemployment
2
R 2 = .27
80
inflation rates for each year during the
1.5
past three decades. (Core inflation is
1
measured by changes in the personal
90
04
88
79
0.5
00
consumption expenditures (PCE) price
86
07 05
02 94
0
99 06
85
index excluding food and energy, a key
980197 9695 87
0803
-0.5
84
09
inflation indicator followed by
91
93 92
89
-1
monetary policymakers.) The figure
83
-1.5
shows a clear negative relationship, as
81
-2
82
indicated by the downward-sloping
-2.5
regression line. For example, years
3.5
4.5
5.5
6.5
7.5
8.5
9.5
with high unemployment also typically
Unemployment rate, annual average
post declines in inflation (notably 1981
through 1983). In the past few years, the relationship between unemployment and inflation has been
very close to that predicted by the historical data. (The observations for 2007, 2008, and 2009 in Figure
1 are given in bold.)
Here, we examine the extent to which the sharp run-up of the unemployment rate since late 2007 has
contributed to declines in core inflation. To be specific, suppose we had all the data up to the end of 2007
before the onset of the recession and we believed that the unemployment rate in the next year and a half
would double. Would we have anticipated the large declines in core inflation since late 2007, as the
Phillips curve would suggest?
To address this issue, we develop a statistical model that assumes that changes in inflation in a given
period depend on two factors: previous changes in inflation and the previous unemployment gap. We
measure inflation by the quarterly growth rate of the core PCE price index. The unemployment gap is the
difference between the actual unemployment rate and the nonaccelerating inflation rate of
unemployment (NAIRU) provided by the Congressional Budget Office (CBO), which is a comparison of
the actual unemployment rate with an equilibrium unemployment rate that would tend neither to
increase nor decrease the inflation rate. (The CBO has estimated NAIRU at 4.8% since 2001.)
The model is a version of the Phillips curve studied by Atkeson and Ohanian (2001) and Stock and
Watson (2008). We first put in time series data on inflation and the unemployment gap for a sample
FRBSF Economic Letter 2010-02
January 19, 2010
period from the first quarter of 1984 to the fourth quarter of 2007, a period with relatively small
fluctuations in both inflation and the unemployment gap. We then use the model to calculate values for
changes in inflation from the first quarter of 2008 to the fourth quarter of 2010. To do this calculation,
we use actual data on the unemployment gap for the periods up to the third quarter of 2009 and, after
that, data from the December 2009 Consensus Blue Chip Forecast. We finally convert the changes in
inflation into levels of the inflation rate, using the actual inflation rate in the fourth quarter of 2007 as
the initial value. For comparison, we also calculate the inflation forecast from a naive model, in which
changes in the inflation rate depend only on previous changes in inflation and not on the unemployment
gap.
Figure 2 displays the inflation forecasts from the two models after the fourth quarter of 2007. In
displaying the forecast results, we have converted quarterly inflation rates into four-quarter percentage
changes in the price level. The Phillips
Figure 2
curve model with the unemployment
Inflation forecasts
gap captures the large decline in the
(Four-quarter percent change, seasonally adjusted)
inflation rate for the period from the
%
3
first quarter of 2008 to the third
Naive m odel: Without unemployment
quarter of 2009. But the alternative
2.5
model without the unemployment gap
completely misses it. For the period
2
Phillips curve m odel:
from the fourth quarter of 2009 to the
Core PCE
1.5
With unem ployment
fourth quarter of 2010, the Phillips
curve model suggests that inflation
1
should continue to go down and
0.5
remain low, as the unemployment rate
is likely to remain high. In contrast,
0
the alternative model without
Q1 Q2 Q3 Q4 Q1 Q2 Q3 Q4 Q1 Q2 Q3 Q4
2009
2010
2008
unemployment gaps predicts that
Note: Regression sample is 1984:Q1 to 2007:Q4.
inflation should remain elevated at
around 2.5%.
To evaluate the accuracies of the forecasts, we use a statistical technique known as root mean squared
error (RMSE) for each model. The RMSE measures the distance between a model’s forecast inflation
path and the actual inflation path. Thus, the smaller the value of the RMSE, the more accurate the
forecast. Based on this measure, the Phillips curve produces substantially more accurate forecasts than
does the alternative model without unemployment gap measures. The RMSE of the Phillips curve model
is about 25% of that of the naive model without the gaps. The Phillips curve model does better because it
takes into account the large increase in the unemployment rate as a signal for lower future inflation,
whereas the alternative model ignores information from the unemployment gap.
Similar results are obtained when alternative measures of the inflation rate and unemployment gaps are
used. The results also are similar when changes in real oil prices are factored in as an additional control
variable.
Our findings are consistent with Stock and Watson (2009), who argue that measures of economic
activity such as unemployment gaps do not seem to help improve the accuracy of inflation forecasts in
relatively tranquil periods, but do help forecast inflation in periods with large deviations of the
unemployment rate from the NAIRU. In this sense, our findings do not contradict those in Atkeson and
FRBSF Economic Letter 2010-02
January 19, 2010
Ohanian (2001) and others, who focus on the sample period during which the U.S. economy experienced
relatively tranquil business cycles, a period often referred to as the Great Moderation.
Cautionary note
Our statistical evidence should be interpreted with some caution. Our evidence does not imply that
inflation cannot run up as long as unemployment remains low. Other factors determine inflation beside
the unemployment gap. This is an important and painful lesson that we have learned from the
experience of the 1970s. For example, supply shocks and commodity price increases can push inflation
up. Furthermore, inflation expectations are also likely to be an important inflation driver and are
incorporated in modern Phillips curve theories.
Still, survey data and financial market data do not seem to suggest elevated inflation risks or a running
up of inflation expectations for the next five to ten years (Christensen, Lopez, and Rudebusch 2008). As
an additional control variable, we have examined the forecast accuracy of our benchmark Phillips curve
model using measures of inflation expectations. In particular, we use the long-term forecasts of headline
consumer price index inflation from the Survey of Professional Forecasters. Our main results do not
change when we include inflation expectations as a control variable.
But it does not follow that inflation expectations cannot run up. So far, inflation expectations have likely
remained stable despite the unprecedented expansion of the size of the Federal Reserve balance sheet
mainly because the Fed has clearly communicated its commitment to price stability and, more
importantly, market participants view this commitment as credible. To keep inflation expectations under
control, it is essential to maintain the Fed’s credibility and the independence of monetary policy from
politics.
Conclusion
We have examined the connection between inflation and unemployment—a relationship that many
consider central to the conduct of monetary policy—in the context of the most recent recession that
started in late 2007. Our findings suggest that the high level of the unemployment rate over the past year
likely contributed to the substantial declines in the inflation rate, as the Phillips curve would predict.
Zheng Liu is research advisor at the Federal Reserve Bank of San Francisco.
Glenn Rudebusch is senior vice president and associate director of research at the Federal Reserve
Bank of San Francisco.
References
Atkeson, Andrew, and Lee E. Ohanian. 2001. “Are Phillips Curves Useful for Forecasting Inflation?” FRB
Minneapolis Quarterly Review 25(1): 2-11.
http://www.minneapolisfed.org/publications_papers/pub_display.cfm?id=853
Christensen, Jens H. E., Jose A. Lopez, and Glenn D. Rudebusch. 2008. “Inflation Expectations and Risk Premiums
in an Arbitrage-Free Model of Nominal and Real Bond Yields.” FRB San Francisco Working Paper 2008-34.
http://www.frbsf.org/publications/economics/papers/2008/wp08-34bk.pdf
Rudebusch, Glenn, and Lars E.O. Svensson. 1999. “Policy Rules for Inflation Targeting.” In Monetary Policy Rules,
ed. J. Taylor. Chicago: University of Chicago Press, pp. 203-246
Stock, James, and Mark Watson. 2009. “Phillips Curve Inflation Forecasts.” In Understanding Inflation and the
Implications for Monetary Policy: A Phillips Curve Retrospective, proceedings of FRB Boston’s 2008 annual
economic conference. Cambridge, MA: MIT Press.
1
FRBSF Economic Letter 2010-02
January 19, 2010
Recent issues of FRBSF Economic Letter are available at
http://www.frbsf.org/publications/economics/letter/
2010-01
Global Household Leverage, House Prices, and Consumption
Glick / Lansing
http://www.frbsf.org/publications/economics/letter/2010/el2010-01.html
2009-38
Bank Relationships and the Depth of the Current Economic Crisis
http://www.frbsf.org/publications/economics/letter/2009/el2009-38.html
2009-37
Capital Structure in Banking
Caballero/Candelaria /
Hale
Kwan
http://www.frbsf.org/publications/economics/letter/2009/el2009-37.html
2009-36
Linkages between Monetary and Regulatory Policy:
Lessons from the Crisis
Yellen
http://www.frbsf.org/publications/economics/letter/2009/el2009-36.html
2009-35
Talking about Tomorrow’s Monetary Policy Today
Chehal / Trehan
http://www.frbsf.org/publications/economics/letter/2009/el2009-35.html
2009-34
Inflation Expectations and the Risk of Deflation
Christensen
http://www.frbsf.org/publications/economics/letter/2009/el2009-34.html
2009-33
Recent Developments in Mortgage Finance
Krainer
http://www.frbsf.org/publications/economics/letter/2009/el2009-33.html
2009-32
Gauging Aggregate Credit Market Conditions
Lopez
http://www.frbsf.org/publications/economics/letter/2009/el2009-32.html
2009-31
Disagreement about the Inflation Outlook
http://www.frbsf.org/publications/economics/letter/2009/el2009-31.html
2009-30
Predicting Crises, Part II: Did Anything Matter (to Everybody)?
Leduc / Rudebusch /
Weidner
Rose / Spiegel
http://www.frbsf.org/publications/economics/letter/2009/el2009-30.html
2009-29
Predicting Crises, Part I: Do Coming Crises Cast Their Shadows Before?
Trehan
http://www.frbsf.org/publications/economics/letter/2009/el2009-29.html
2009-28
New Highs in Unemployment Insurance Claims
Cleary / Kwok / Valletta
http://www.frbsf.org/publications/economics/letter/2009/el2009-28.html
2009-27
Credit Market Conditions and the Use of Bank Lines of Credit
James
http://www.frbsf.org/publications/economics/letter/2009/el2009-27.html
2009-26
Growth Accounting, Potential Output, and the Current Recession
Fernald / Matoba
http://www.frbsf.org/publications/economics/letter/2009/el2009-26.html
2009-25
Have the Fed Liquidity Facilities Had an Effect on Libor?
Christensen
http://www.frbsf.org/publications/economics/letter/2009/el2009-25.html
2009-24
Did Welfare Reform Work for Everyone? A Look at Young Single Mothers Daly / Kwok
http://www.frbsf.org/publications/economics/letter/2009/el2009-24.html
2009-23
Macroeconomic Models for Monetary Policy: Conferenc e Summary
Swanson
http://www.frbsf.org/publications/economics/letter/2009/el2009-23.html
2009-22
A View of the Economic Crisis and the Federal Reserve’s Response
Yellen
http://www.frbsf.org/publications/economics/letter/2009/el2009-22.html
Opinions expressed in FRBSF Economic Letter do not necessarily reflect the views of the management of the Federal Reserve Bank of
San Francisco or of the Board of Governors of the Federal Reserve System. This publication is edited by Sam Zuckerman and Anita
Todd. Permission to reprint portions of articles or whole articles must be obtained in writing. Please send editorial comments and
requests for reprint permission to [email protected].


© Copyright 2026