
P.B.Gawali, S.Y.Waghmare, L.Carlo and A.G.Patil
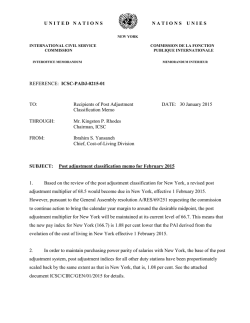
J. Ind. Geophys. Union ( April 2011 ) Vol.15, No.2, pp.61-76 Geomagnetic secular variation anomalies investigated through tectonomagnetic monitoring in the seismoactive zone of the Narmada-Son Lineament, Central India P.B.Gawali, S.Y.Waghmare, L.Carlo and A.G.Patil Indian Institute of Geomagnetism, New Panvel (W), Navi Mumbai - 410 218 E-mail: [email protected] ABSTRACT Data from repeated geomagnetic observations at seventy stations on the five profiles have revealed secular variation anomalies of the total geomagnetic field in the seismically active area of Jabalpur and adjoining regions, in the Narmada-Son Lineament (NSL), Central India. For this tectonomagnetic monitoring, a reference base station was established within study area at seismic observatory Jabalpur. Using proton precession magnetometers with sensitivity 0.1 nT, simultaneous measurements of the total geomagnetic field were made annually at the base station and all field stations. Seven cycles of repeated observations have been performed between 2003 and 2009. For data analysis, a difference method has been applied and the residuals calculated as secular variations of the total geomagnetic field with values ranging from ±0.1 nT/yr to ±9.5 nT/yr over different stations. The anomalies in secular variation of the total geomagnetic field may be related to anomalous accumulation of tectonic stresses and tensions on the deep fault zones and crustal blocks of the NSL as a piezomagnetic effect. However, the geomagnetic depth sounding data have revealed high electrical conductivity anomaly due to saline fluids in the deep crust of Jabalpur area. The fluids related to electrokinetic effect can not be ruled out for causing the anomalies in the secular variation of total geomagnetic field. Thus, tectonomagnetic phenomenon such as piezomagnetic and/or electrokinetic effect or, both these mechanisms may have caused the secular variation anomalies in the seismoactive zone of NSL. INTRODUCTION The study of geomagnetic changes associated with various kinds of tectonic activity such as earthquakes, volcanic eruption, gradual crustal movement and so on, was named as “Tectonomagnetism” (Nagata 1969). Stress-induced tectonomagnetic (piezomagnetic) anomalies have been studied by many researchers because it can give information on stress changes within the crust independently of mechanical means. Analytical and numerical modelings have progressed considerably since the 1960’s to provide powerful tools for calculating the piezomagnetic fields for various types of pressure sources (e.g. Stacey 1964; Yukutake and Tachinaka 1967; Sasai 1980, 1991, 1994, 2001; Zlotnicki & Cornet 1986; Oshiman 1990; Utsugi 2000; Nishida et al., 2004; Djadkov et al., 2007). The piezomagnetic effect associated with tectonomagnetism or seismomagnetism comes into play as soon as stress build up starts and hence introduces long-term precursors that can be detected through systematic repeated geomagnetic measurements carried out at regular intervals (days, months, years etc.) for extended periods in a specified region (Rikitake & Honkura 1985). Another mechanism proposed to explain tectonomagnetic anomalies is based on the circulation of electric currents as a result of variable potentials induced by fluids percolating through solid rocks such as electrokinetic effects (Mizutani et al., 1976; Zlotnicki & Le Mouel 1990). However, the electrokinetic effects would be weaker than the piezomagnetic effects in normal geodynamic conditions (Kormiltsev & Retushniak 1997). Laboratory experiments have revealed stress sensitivity of piezomagnetism is of the order of 10-3 MPa-1 for stiff rocks such as basalts and andesites (Kapitsa 1955; Nagata & Kinoshita 1967). On the other hand, Hamano (1983) found some porous rocks such as tuff have the stress sensitivity of about 10-2 MPa-1 and concluded that stress sensitivity increases with porosity of rocks. Stress sensitivity also depends on titanium content in titanomagnetites (Stacey & Johnston 1972). Many field observations associated with seismic and other tectonic activities have succeeded in detecting the piezomagnetic changes as in examples such as the San Andreas fault system, USA, (Johnston et al., 1985), The Landers earthquake, USA, (Johnston, Mueller & Sasai 1994), a Parkfield P.B.Gawali et al. fault model, USA, (Stuart et al., 1995), Izu Peninsula earthquake, central Japan (Sasai & Ishikawa 1997) and so on. In some cases, however, tectonic activity failed to generate expected magnetic changes (Sasai & Ishikawa 1980). A number of earthquakes of various magnitudes (M) on Richter scale have occurred in the past with epicenters in and around Jabalpur. Some of these are 1846 (6.5 M), 1903 (4.7 M), 1973 (3.7 M), 1993 (3.8 M), 1997 (6.0 M) and 2000 (5.2 M) as reported by India Meteorological Department (1998) and Pimprikar & Devarajan (2003). Jabalpur area has been known for its seismic activity for a long time, because of which a project entitled “Tectonomagnetic study in JabalpurKosamghat and adjoining areas in Central India” was launched by Indian Institute of Geomagnetism (IIG), Navi Mumbai, in 2002. TECTONIC STRUCTURE AND GEOPHYSICAL INVESTIGATIONS IN NSL Molnar, Kunangyi & Liang (1987) reported the northeast drift rate of India plate and southeast flow of the Tibetan plateau to be of the same order, i.e. 18 ± 7 mm/year. The tectonic background of Central Indian region is greatly influenced by the east-west trending NSL, which is a conspicuous linear tectonic feature about 1600 km long extending towards Murray ridge (Arabian Sea) and the eastern syntaxial bend of Himalayas (Mishra 1977). This feature is invariably visualized as a continental rift reactivated since Precambrian times (Choubey 1971). In contrast, Ghosh (1976) has considered the Narmada-Son lineament as representing an erosional post - Deccan Trap Narmada valley formed at the crest of a domal upwarp. The faults bounding the Narmada zone are believed to have played a significant role in deposition of the Vindhyan (Meso-Neoproterozoic) sediments on the northern side and Gondwana (PermoCarboniferous) sediments on the southern side of Narmada zone. West (1962) concluded that the land masses on either side of the lineament must have undergone relative vertical movement several times during the geological past. The boundary faults limiting this zone have been identified to the east of 76o E, as Narmada north and Narmada south fault (Jain, Nair & Yedekar 1995). Major cities and towns along with geological and tectonic background of the NSL are shown in Fig.1 During the past few decades, several geophysical studies have been undertaken along this major lineament. Qureshy (1964) made qualitative studies of gravity anomalies along the lineament and concluded that the Satpura ranges in the western parts 62 (associated with gravity high) represent a horst-type structure. The Bouguer gravity high suggests copious high-density material in lower crust, which might be the result of large-scale asthenospheric upwelling and basic intrusions along Moho, and in the crust. The large scale asthenospheric upwelling south of Narmada appears to be related to several rift systems of these regions such as Tapti graben, Godavari graben, Satpura and South-Rewa-Mahanadi-Gondwana rifts etc. (Mishra 1977). Verma & Banerjee (1992) have shown the Jabalpur Bouguer gravity high (22o 46´N, 78o48´E) is elliptical in shape and with an amplitude of 40 mgal, trending NE-SW and extending over a length of nearly 250 km, with maximum width of nearly 70 km. The high gravity appears to be related to the tectonic framework of the NSL. A massive high-density intrusive body in the upper crust with density contrast of + 0.1 g/cm3 with respect to the normal crustal density is envisaged in order to explain the Jabalpur high. To understand the crustal structure and tectonic framework with its geophysical implication, five Deep Seismic Sounding (DSS) profiles, each about 250 km long, were shot across the NSL by National Geophysical Research Institute (NGRI), Hyderabad, India. Among these DSS profiles, only HirapurMandla profile passes through the present study area. The depth of Moho along the Hirapur-Mandla DSS profile varies from 39.5 km near Tikaria to about 45 km at Narsighgarh. Narmada alluvial deposits cover the central part of DSS profile between Katangi and Jabalpur. In south, Deccan Trap is exposed as an outlier between Jabalpur and Mandla. The DSS data has established a basement of uplifted horst zone between Katangi and Jabalpur (Kaila et al., 1987). Satpura region is characterized by high heat flow as a result of both the conductive and advective heat transfer, with values that range from 70 to 100 mW/m2 (Ravi Shankar 1988; Mahadevan 1994). On the basis of rheological models, thermomechanical structure of the Central Indian shield of such a high heat flow regime do not support occurrence of deep crustal seismicity. Occurrence of Jabalpur earthquake with a focus very close to the crust-mantle boundary provides a constraint on the thermo-mechanical structure of the Central Indian shield, by favouring a low mantle heat flow (Manglik & Singh 2002). Magnetotelluric (MT) studies over the Damoh-Jabalpur-Mandla-Anjaneya Profile, Central India, by Gokarn & Singh (2000) show geoelectric structure in the depth range of 0-25 km and inferred a resistivity in a range of 2- 700 Ohm-m in the Damoh-Jabalpur-Mandla region using two dimensional modeling. They interpreted the results as the lower crustal intrusive rising southeast from below Jabalpur Geomagnetic secular variation anomalies investigated through tectonomagnetic monitoring in the seismoactive zone of the Narmada-Son Lineament, Central India Figure 1. The principal tectonic elements of the Narmada-Son Lineament (NSL) and adjoining areas (adopted from tectonic map of India, Eremenko and Negi, 1968). The area under tectonomagnetic study is roughly drawn. Hatched area of Satpura conductivity anomaly (SCA) and location of cities and towns (*) and location (O) of Kosamghat, the epicenter of the Jabalpur earthquake of May 22, 1997 are also shown in map. into the upper crust leading to Tikaria gravity high. In another paper, Gokarn et al., (2001) showed some vertical conductivity contrast as the geoelectrical crosssection in the depth range 30-40 km throughout the Damoh-Jabalpur-Mandla-Anjaneya profile and the resistivity variations are in a narrow range of 200-500 Ohm-m. They interpreted the results that the conductivity anomaly and high gravity may have different causative mechanisms. The high conductivity may be due to the presence of crustal fluids, whereas the gravity high seems to be predominantly due to the upwarping of the Moho. A long-wavelength magnetic anomaly map was compiled through rectangular harmonic analysis in Central India; the NSL is characterized by a regional low, embodying a weak positive anomaly (Arora & Waghmare 1984). A linear Geomagnetic Depth Sounding (GDS) experiment was carried out along Hirapur-Mandla-Bhandara magnetic profile for studying the lateral extent and geometrical configuration of Satpura electrical Conductivity Anomaly (SCA). The lateral extent of SCA is bounded between Jabalpur and Paraswada and its centre is located beneath Kalpi, which is shown as hatched area in Fig.1. The SCA was interpreted as trapped fluids in the crust (Arora, Waghmare & Mahashabde 1995; Waghmare, Arora & Pecova 1996). The correlation of SCA with the Jabalpur earthquake of May 22, 1997 was shown by Waghmare (2003). 63 P.B.Gawali et al. DATA COLLECTION A network of 70 field stations on the natural ground and far from man-made structures, with interdistances of less than 10 km, were selected through geomagnetic measurements to ensure stations are located in low-gradient areas. Non-magnetic sandstone pillars have been installed as stable benchmarks over which magnetometer sensor is placed for total geomagnetic field measurements. The locations of the stations comprise areas of Jabalpur, Katangi, Mandla, Seoni, Lakhnadon and Narsimhapur in Madhya Pradesh, Central India. Fig.2 shows a layout map of repeat survey stations covering five geomagnetic profiles. The Narmada north fault and south fault are also roughly drawn in the figure. For measurements of total geomagnetic field intensity T, two drift-free and absolute measurable Proton Precession Magnetometers (PPMs) were used. The PPMs were specially developed in IIG’s instrumentation laboratory having a sensitivity of 0.1 nT, a long- term stability of ~0.2 nT and thermal drift under ~0.03 nT per 10o . One PPM was deployed at base station while other was used at field stations. The same instruments were used for all repeat surveys. Before an observation, PPMs were calibrated at exactly the same time by portable GPS receivers and sample scanning intervals were set for 15 seconds. The observations were taken early in the morning and afternoon hours to avoid extant overhead ionospheric current system. Both the PPMs were operated simultaneously at the base and field stations for half an hour and a total of 120 values of total geomagnetic field intensity T were recorded on auto mode and Figure 2. Map showing layout of geomagnetic repeat stations in Narmada-Son Lineament (NSL), Central India. Location of Narmada North Fault and Narmada South Fault (as reported by India Meteorological Department,1998) along with five geomagnetic profiles and station codes are shown in map. 64 Geomagnetic secular variation anomalies investigated through tectonomagnetic monitoring in the seismoactive zone of the Narmada-Son Lineament, Central India saved in PPMs memory, later downloaded to the personal computer at the base station. This procedure was adopted for covering all survey points and entire survey was completed within 30-40 days during each campaign. Seven phases of surveys were completed starting from March–April 2003, which were repeated in February-March 2004, February-March 2005, January-February 2006, January-February 2007, January-February 2008 and January-February 2009. DATA ANALYSIS The geomagnetic field is subjected to various kinds of variations which originate in ionosphere and magnetosphere as well as within the Earth. However, these variations can approximately be treated as being spatially spread over areas of local extent. On the basis of this approximation, it is possible to detect changes associated with tectonomagnetic phenomena in the Earth by taking a simple difference between the magnetic fields observed simultaneously at two or more stations (Stacey & Westcott 1965; Rikitake 1966b; Honkura 1981). In addition Stacey & Westcott (1965) have suggested that at least initially it is necessary to avoid completely auroral zones, where ionospheric currents are highly variable and strong gradients occur in geomagnetic disturbances. While studying electromagnetic induction within the Earth by natural external variation of magnetic field, Gough (1973) indicated that external fields incident on most of the Earth’s surface are those of distant currents of ionosphere/magnetosphere and have wavelengths of thousands of kilometres. The external source field can be contaminated in the auroral and equatorial zone due to auroral and equatorial electrojets. Thus, external magnetic source fields may be considered as uniform to certain extent in the low and middle latitudes of the Earth. Moreover, Nishida et al., (2004) have indicated that the contributions from Earth’s core main field and ionospheric / magnetospheric origin are ruled out as source mechanisms because of local distribution of the anomalous stations. Also, Honkura & Koyama (1976) pointed out that the distance between survey sites and reference base station should be less than 100 km to avoid apparent changes of the secular variations exceeding 1 nT/yr. If we consider the external source field uniformity, according to Gough (1973) indications, our tectonomagnetic study area in the NSL is in the low latitudes between 22o N and 24o N and necessarily the external magnetic source field is uniform without any contamination due to the influence of electrojets. Also our reference base station is located in the study area within about < 100 km aerial distance from the field stations and the external source field will have similar contributions at the base and field stations. Hence, simple difference method can be applied to data analysis for eliminating the ionospheric/magnetospheric contributions. However, the most disturbing factor is the presence of lateral inhomogeneities that exist in the crust, which cause electrical conductivity anomalies by electromagnetic induction from external varying geomagnetic field. The electromagnetic induction within the Earth is the frequency (period) dependent phenomenon, which follows the skin depth relationship Ds = 0.5t km, where is resistivity in Ohm-m and t is time in seconds (Gough 1992). There is a working rule that longer the time of external variation field, deeper is the penetration of induced current within the Earth. But we are interested in probing crustal depth, so short period variations of the field are used. For short period variations of micropulsation type, total magnetic field data for 10 minute averaging procedure is satisfactory, and the ‘noise’ component due to electrical conductivity inhomogeneities in the surrounding rocks does not contribute significantly to the variations of T (Skovorodkin, Bezuglaya & Guseva 1978). They also suggested that when high sensitivity (0.1 nT) absolute proton precession magnetometers are used then the mean square error of a single observation of T for 10 minutes is ±0.2 nT, when data samples are taken between 20 and 30. As per Skovorodkin, Bezuglaya & Guseva (1978), for the area under investigation, tectonomagnetic variation may be judged as significant when the change in T exceeds 0.6 nT. It is not possible to determine the actual error of calculation in geomagnetic field secular variations at each site (Grabowska & Bojdys 2004). In this study, maximum care was taken in data selection for the analysis by precision measuring, and limiting associated noise level during detection of tectonomagnetic effect, which on theoretical considerations is not expected to exceed 10 nT (Rikitake 1976a; Zlotnicki & Cornet 1986). In present case, difference method for data analysis is followed (Skovorodkin, Bezuglaya & Guseva 1978; Kuznetsova & Klymkovych, 2001). The efficacy of the difference method and data reduction process was earlier tested with repeat surveys undertaken in seismically active regions of Koyana, Maharashtra (Arora 1988) and Garhwal Himalayas (Arora & Singh 1992). Some workers have used night-time data in this type of studies assuming the solar quiet daily variation (Sq) is close to zero. However, Rikitake (1966b) found that daily fluctuation even in the night- 65 P.B.Gawali et al. time values are not same at two stations. Day-time data in terms of micro–pulsation (Pc5) type were used in present study, which ranges between 150-600 seconds (Samson 1991). Continuous string of 20 values i.e., 300 seconds simultaneous data for the base and field station were selected for averaging and calculation of standard deviations. The accuracy of the estimate would certainly be improved by taking an average of 20 values. The difference was obtained by subtracting average value of base station from the average value of field station. Finally, a single value for a particular station is determined as the residual field, which can be interpreted as tectonomagnetic signal with respect to reference base station. Thus, the residuals were calculated for all field stations with respect to the reference base station for all repeated data sets. The theoretical interpretation is given as follows: On the basis of a long series of repeat total geomagnetic field surveys, anomalies of temporal geomagnetic field changes T = F, i.e. tectonomagnetic anomalies are detected within a given time interval of observations. Within the profile and spatial observations of repeat surveys following quantities were followed: Fi and Fo - total geomagnetic field intensity in the i-th point and basic point (for all points of network), respectively. If Fi* and Fo* are values for the first cycle of the observations, then ”F* = Fi* - Fo*. If Fi** and Fo** are values with a repeat cycle of the observation (within a chosen time interval, e.g. day, month, year, etc.), then ”F** = Fi** - Fo**. The tectonomagnetic anomaly is characterized by F = F* - F**. If no local changes of the field of tectonomagnetic origin occurs, then F 0 (within the measurement errors and outer field identity). The values F 0 indicate the availability of recent tectonic processes, which seem to be revealed due to repeat surveys (Kuznetsova & Klymkovych 2001). RESULTS AND DISCUSSION The statistical results of the observational data show that the mean standard deviation associated with residual field T values range between 0.3 – 2 nT. The static secular variation anomalies of the geomagnetic field of the crustal origin range from ± 0.1 nT/yr to ± 9.5 nT/yr at different stations in various profiles. Despite lack of any seismic event during repeat survey period, the secular variation anomalies nevertheless have signified that the stresses are building in the crust of survey area. Our results seem to be reasonable compared to other 66 results obtained in seismoactive region of Middle Asia as shown by Shapiro et al., (1978). Much of the interpretation to follow is based on the pattern resulting from T of the annual changes at particular station by selecting some stations on each profile for the period of 2003-2009. To resolve stress related temporal magnetic changes of the crustal origin, the difference technique is used to present the results as shown in Figs. 3-7 where the residual field at each site are obtained as the difference between successive repeat surveys and are examined in space domain, i.e. with differencing second year residual field from first year and third year from second year and so on. Also the linear least-squares regression (Y= A*X +B) lines are drawn for the period 2003 to 2009 at each station in Figs. 3-7. The increase and decrease of the trends of regression lines may be judged as the increase or decrease of the level of the yearly secular changes at the station with respect to the increase or decrease of stress level. In majority of cases tectonomagnetic anomalies generally show relation with earthquakes and volcanic events. However, it is suggested that the gradual crustal movement can cause stress and tension in the vicinity of faults and weaker zones resulting in the magnetization changes and the signatures can be seen on the magnetic anomaly (Sasai 1991, 1994). If the slower crustal movement develops the stress gradually, then the Central Indian crustal zone comprising NSL is most susceptible to stress development. The stress fields are due to the cumulative effects of the plate boundary forces of which the back-thrust from the Himalayan collision may be the most prominent (Gupta et al., 1997). As is shown by Oshiman (1990), spatial pattern of negative and positive changes in total geomagnetic field can also be expected on a boundary between different blocks in the direction of crustal magnetization resulting in anomalous changes in the total geomagnetic field. The anomalies in the secular variations are shown in Figs. 3-7, which is an evidence for anomalous stress distribution within the crust. In the present study we have used limited period data of the total geomagnetic field, so the electromagnetic inductions within the Earth by external sources are neglected. However, if the fluids are present in the crust, their motion is possible due to stress differentials within the crust. The fluids are capable of forcing through a porous medium thereby producing the electrokinetic charge separation. The resulting potential difference (terms a streaming potential) then causes current to flow, which is considered as electrokinetic phenomena (Mizutani et al., 1976). Hence, for the secular variation anomalies Geomagnetic secular variation anomalies investigated through tectonomagnetic monitoring in the seismoactive zone of the Narmada-Son Lineament, Central India in the total geomagnetic field in our study area, the contribution of electrokinetic effect cannot be ruled out. Secular variation anomalies at the stations along AA’ profile AA’ profile covers 29 stations between Katangi and Mandla with inter-station distance of about 5 km. All station results are not shown in Fig. 3, but only selected 10 stations along the AA’ profile are depicted. The abbreviated station’s name appear in Fig. 3 whose codes are given in Fig.2. The small-scale amplitude of the anomaly falls in the range of fraction to 8.5 nT with positive and negative sign at some stations. Fig.3 shows 10 plots, in which year to year continuous changes for 7 years of the geomagnetic field between 2003 to 2009, i.e. the ”T difference (2003-2004), (20042005), (2005-2006) and (2006-2007), (2007-2008) and (2008-2009) are plotted on same scale. A decrease is seen in the trend of linear least-square regression line at Bor (J8) station whereas Nag (J7) station shows increase from beginning to end. The decrease in secular variation at Bor (J8) is speculated to be due to drop in stress level whereas the stress levels are increasing at Nag (J7). Similarly increase or decrease of the trend of linear fit lines can be observed in respective stations on the AA’ profile. The distinctive Figure 3. Annual secular changes of the total geomagnetic field (“T) are shown at 10 stations along the KatangiMandla (AA’) profile. Linear least-square regression dash lines are also drawn at each station. 67 P.B.Gawali et al. pattern of ”T differences observed in fig. 3 may be because of some manifestation of stress and tension variations due to geodynamic processes and anomalous movements of crustal blocks with Mahakoshal belt, Satpura horst and graben like structures of the Narmada fault systems. Moreover, it is interesting to note that along this profile Satpura electrical conductivity anomaly (SCA) was characterized by conductivity 0.2 S/m (resistivity 5 Ohm-m) investigated by Geomagnetic Depth Sounding (GDS) method (Arora, Waghmare & Mahashabde 1995; Waghmare 2003). This conductivity anomaly was interpreted due to the fluids/saline water in the deep crust of Jabalpur-Mandla area. The inter-cavity porous fluids of the rocks generate the electric currents which are responsible for the Satpura conductor. There is also a possibility that the fluids flow can produce electrokinetic effect which has contributed to the secular variation of the total geomagnetic field along the AA’ profile. Coincident deep reflector/refractor studies in Central India have shown presence of upper and lower crustal low-velocity layers. These low velocity layers, high heat flow, hot springs, significant reflectivity character north and south of Central India suture and seismic activities in Central India strongly suggest neo-tectonic activity in the region, including along the horst structure between Katangi and Jabalpur (Reddy, Sain & Murty 1997). Figure 4. Annual secular changes of the total geomagnetic field (“T) are shown at 10 stations along the MandlaLakhnadon (BB’) profile. Linear least-square regression dash lines are also drawn at each station. 68 Geomagnetic secular variation anomalies investigated through tectonomagnetic monitoring in the seismoactive zone of the Narmada-Son Lineament, Central India Secular variation anomalies at the stations along BB’ profile BB’ profile covers 13 stations between Mandla and Lakhnadon with inter-station distance of about 10 km. Fig.4 shows changes in geomagnetic field along the BB’ profile. Results are not shown in Figure 4 for all stations, but we have chosen 10 stations along the BB’ profile. The abbreviated station’s name appears in Fig.4 with their codes in Fig.2. In Fig. 4, yearly ”T differences have been taken for (2003-2004), (20042005), (2005-2006), (2006-2007), (2007-2008) and (2008-2009). The amplitude of geomagnetic anomalies falls in the range of a fraction to ± 9.5 nT. The trend of linear least-squares regression lines at the stations for secular changes in the total geomagnetic field, may suggest increase or decrease of stress level at the stations in the profile. The area between Mandla and Lakhnadon is covered by Deccan Traps. The interface between Deccan trap and underlying Archaean (basement) is interpreted to be at a depth of 900 m near Lakhnadon (Naskar et al., 2003). One more fault is inferred at 13 km south of Lakhnadon called Gavilgarh fault (Jain, Nair & Yedekar 1995), which may be influencing the geomagnetic secular variation anomalies in the region. As anomaly is more pronounced the geological structure underlying this profile is more mobile as compared to AA’ profile. Secular variation anomalies at the stations along CC’ profile This profile covers only 5 stations between Lakhnadon and Narsimhapur with inter-station spacing of about Figure 5. Annual secular changes of the total geomagnetic field (“T) are shown at 5 stations along the LakhnadonNarsimhapur (CC’) profile. Linear least-square regression dash lines are also drawn at each station. 69 P.B.Gawali et al. 10 km. For all the stations results are shown in Fig. 5. The abbreviated stations name appear in Fig.5 with their codes in Fig.2. Fig.5 gives changes of the geomagnetic field along CC’ profile with an amplitude in the range of ± 0.2 nT to ± 9.4 nT. The trend of linear least-squares regression lines at the stations for the secular changes in the total geomagnetic field may suggest the increase or decrease of stress level at the stations in the profile. Thus, year-to-year changes in ”T in this profile also may be related to the stress/ tension building in the vicinity of the Narmada south fault and adjoining areas of the Narmada rift system. Secular variation anomalies at the stations along DD’ Profile This is another small profile covering 8 stations between Narsimhapur and Jabalpur with inter-station spacing of about 10 km. Fig.6 gives 6 plots each with amplitude ranging from ± 0.6 nT to ± 7.7 nT. The trend of linear least-squares regression lines at the stations for the secular changes in the total geomagnetic field may suggest increase or decrease of stress level at the stations in the profile. The region is more or less in the Mahakoshal group with alluvial deposits between Narsimhapur and Jabalpur (Jain, Nair & Yedekar 1995). Active Narmada south fault passes along this profile. Since whole area of NSL is under stress it may cause changes in the total geomagnetic field along the profile. Secular variation anomalies at the stations along EE’ profile This profile covers 19 stations between Jabalpur and Seoni and inter-station spacing is about 10 km. Results of all station are not shown in Fig.7, but only 10 stations along the EE’ profile are depicted. The abbreviated stations name appear in Fig. 7 whose codes are given in Fig. 2. Fig.7 gives ”T difference of 10 plots with amplitudes ranging from ± 0.3 nT to ± 6.5 nT. The trend of linear least-squares regression lines at the stations for the secular changes in the total geomagnetic field may suggest increase or decrease of stress level at the stations in the profile. Jabalpur to Seoni area is mostly covered by Lameta sediments, Deccan basalt and intrusives (Jain, Nair & Yedekar 1995). The Archaeans include the older metamorphites, some ultramafic/basic intrusives and unclassified granite gneisses intruded at places by quartz, pegmatite and aplite veins in south of Seoni area (Naskar et al., 2003). The swarm type seismic Figure 6. Annual secular changes of the total geomagnetic field (“T) are shown at 6 stations along the NarsimhapurJabalpur (DD’) profile. Linear least-square regression dash lines are also drawn at each station. 70 Geomagnetic secular variation anomalies investigated through tectonomagnetic monitoring in the seismoactive zone of the Narmada-Son Lineament, Central India Figure 7. Annual secular changes of the total geomagnetic field (“T) are shown at 10 stations along the JabalpurSeoni (EE’) profile. Linear least-squares regression dash lines are also drawn at each station. activities were experienced around Bamhori, Seoni district in April-May 2000. The hidden basement fault beneath the Deccan Traps may be causing swarm type seismic activity around Bamhori village (Pimprikar & Devarajan 2003). The secular changes in the total geomagnetic field may be related to stresses building due to active geological inhomogeneities in this profile. No major seismic activity or volcanic activity was recorded during the tectonomagnetic observation period for March-April 2003 to January-February 2009. Hence, significant correlations have not been observed between seismic events and obtained values of secular variation of geomagnetic field in the survey area. Figs. 3-7 suggest the changes of the geomagnetic field in the survey area are probably anomalous. Seismicity associated with NSL is due to the strike-slip fault movement or thrust mechanism, consistent with the compressive stresses transmitted from plate boundaries as well as internal fabrics of crustal blocks (Mall, Singh & Sarkar 2005). Further, they suggested that influence of uplift processes such as horst like structures in the form of Satpura mountain ranges that possibly originate through lithosphere-mantle interaction, perhaps are not uniform in magnitude and direction because of plate tectonic stresses. The obtained data gives evidence to stress-strained state variations in the crust of NSL leading to temporal anomalous variations of the geomagnetic field. CONCLUSIONS In the AA’ profile the fluid flow has produced the electrokinetic effect contributing to the secular variation of the total geomagnetic field. In BB’ profile the increase/decrease in stress levels have caused the secular changes in the total geomagnetic field. As the anomaly here is more pronounced, the geological structure underlying this profile is more mobile compared to AA’ profile. The stations in the CC’ profile behave similar to the ones in BB’, whereas the 71 P.B.Gawali et al. secular changes at DD’ and EE’ more or less follow a similar trend. Since the whole area of NSL is under stress it may cause changes in the total geomagnetic field or it could also be that the stresses are building due to active geological inhomogeneities along these profiles. The space-time pattern of residual geomagnetic field around Jabalpur and adjoining areas in NSL indicates certain characteristic features which have been interpreted as stress change in the crust. The small-scale secular variation anomalies of the crustal origin may be a manifestation of tectonically active parts and joints of different tectonic crustal blocks of NSL. The secular variation anomalies of total geomagnetic field may have resulted in response to the gradual movement of Indian plate in NE-SW direction and collision with Eurasian plate building stresses and tension on the fault systems of the NSL zone. However, dominant contribution for secular changes in the total geomagnetic field in the crust originating from the stress induced tectonomagnetic (piezomagnetic) effect rather than fluids produced electrokinetic effect. In the present scenario taking into account the long tectonic and seismicity history of the NSL belt, it seems possible that both piezomagnetic and electrokinetic mechanisms may be operative. But, since no earthquake of measurable magnitude occurred in the surveyed region during the duration of experiment, such general conclusions may be premature. However, data gathered in present surveys will help in investigating the tectonomagnetic effect of the impending seismic activity. ACKNOWLEDGEMENTS The authors are thankful to the Director, Indian Institute of Geomagnetism, New Panvel (W), Navi Mumbai for encouraging and supporting the project “Tectonomagnetic investigation in Jabalpur-Kosamghat area in Central India” and permission to publish this work. The authors are also thankful to the Director, Geological Survey of India, Jabalpur (M.P.) for providing necessary help during fieldwork. Mr. S.B.Waknis and Mr.B.I. Panchal are gratefully acknowledged for drawing the figures. REFERENCES Arora, B.R., 1988. Tectonomagnetic studies in India. In: Guha, S.K.K., Patwardhan, A.M. ( Eds.) Earthquake Prediction-Present Status. Deptt. of Geology, University of Poona, Pune, India pp. 53-62. Arora, B.R.& Singh, B.P., 1992. Geomagnetic and geoelectric 72 investigations for seismicity and seismotectonics of the Himalayan region. Mem. Geol. Soc. India 23, 223-263. Arora, B.R. & Waghmare, S.Y., 1984. Delineation of longwavelength magnetic anomalies over Central India by Rectangular Harmonic analysis, Proc. Indian Acad. Sci. (Earth Planet. Sci.) 93, 353-362. Arora, B.R., Waghmare, S.Y. & Mahashabde, M.V., 1995. Geomagnetic depth sounding along the Hirapur– Mandla-Bhandara profile, Central India, Mem. Geol. Soc. India 31, 519-535. Choubey, V.D., 1971. Narmada-Son lineament, India. Nature Phys. Sci., 232, 38-40. Djadkov, P.G., Mikheev, O.A., Minenko, M.I. & Sobolev O.A., 2007. Some results of tectonomagnetic monitoring in the epicentral zone of the M7.5 Altay earthquake, September 27, 200, Annals of Geophysics, 50, 31-37. Eremenco, N.A. & Negi, B.S., 1968. Tectonic map of India, Oil and Natural Gas Commission, Dehradun, Printed at the 101(H.L.O.) printing group of Survey of India. Ghosh, D.B., 1976. The nature of Narmada-Son lineament. In: Seminar volume on Tectonics and Metallurgy of South and East Asia, Geol. Surv. India Misc. Publ., 34, 119-132. Gokarn, S.G. & Singh, B.P., 2000. Magnetotelluric technique. In:Varma, O.P., Mahadevan, T.M. (Eds.) Research highlights in Earth System Science, DST’s Spl. Publication, Ind. Geol. Cong., 1, 123-142. Gokarn, S.G., Rao, C.K., Gupta, G., Singh, B.P. & Yamashita, M., 2001. Deep crustal structure in Central India using Magnetotelluric studies, Geophys. J. Int., 144, 685-694. Gough, D.I., 1973. The interpretation of magnetometer array studies. Geophys, J. R. Ast. Soc., 35, 83-98. Gough, D.I., 1992. Electromagnetic exploration for fluids in the Earth’s crust, Earth Science Review 32, 3-18. Grabowska, T. & Bojdys, G., 2004. Analysis of geomagnetic field along seismic profile P4 of the International project POLONAISE’ 97, Tectonophysics, 383, 15-28. Gupta, H.K., Chadha,R.K., Rao, M.N., Narayana, B.L., Mandal, P., Ravi Kumar, M. & Kumar, N., 1997. The Jabalpur Earthquake of May 22, 1997, Jour. Geol. Soc. India, 50, 85-91. Hamano, Y., 1983. Experiment on the stress sensitivity of natural remanent magnetization , J. Geomag. Geoelectr., 35, 155-172. Honkura, Y., 1981. Electric and magnetic approach to earthquake prediction: In: Rikitake, T. (Ed.), Current research in earthquake prediction I, DEPS02, Reidel Publication Co., Center of Academic publication, Tokyo, Japan, pp 301-383. Honkura, Y. & Koyama, S., 1976. On a problem in earthquake prediction research based on the survey Geomagnetic secular variation anomalies investigated through tectonomagnetic monitoring in the seismoactive zone of the Narmada-Son Lineament, Central India of the geomagnetic total intensity, Proc. Conductivity Anomaly Symp. Geol. Survey Japan, 145-150. India Meteorological Department, New Delhi, 1998. Jabalpur earthquake of 22nd May 1997 and its aftershocks (a consolidated document), pp.1-70. Jain, S.C., Nair, K.K.K. & Yedekar, D.B., 1995. Geology of the Son-Narmada-Tapti Lineament Zone in Central India, Spl. Publ. Geol. Survey India, 10, 1-154. Johnston, M.J.S., Silverman, S.A., Mueller, R.J. & Breckenridge, K.S., 1985. Secular variation, crustal contribution, and tectonic activity in California, 19761984, J. Geophysics. Res., 90, 8707-8717. Johnston, M.J.S. Mueller, R.J. & Sasai, Y., 1994. Magnetic field observation in the near-field of the 28 June1992 MW 7.3 Landers, California. Earthquake, Bull. Seism. Soc. Amer., 84, 792-798. Kaila, K.L., Murthy, P.R.K., Mall, D.M. & Dixit, M.M., 1987. Deep seismic sounding along Hirapur –Mandla profile, Central India , Geophys J.R. Ast. Soc., 89, 399-404. Kapitsa, S.P., 1955. Magnetic properties of eruptive rocks under mechanical stresses, Izv. Akad. Nauk U.S.S.R., 86, 521-523. Kormiltsev, V.V. & Ratushniak, A.N., 1997. Electric and magnetic field induced by fluids in porous solids with local herogeneities of permeability and electric properties, Izv. RAN, Ser. Fizika Zemli, 8, 81-87. Kuznetsova, V. & Klymkovych, T., 2001. Application of high-accuracy magnetometry to study recent geodynamic processes and earthquake precursors, Contributions of Geophysics and Geodesy, 31, 383388. Mahadevan, T.M., 1994. Deep continental structure of India: A review. Mem. Geol. Soc. India, 28, 1-562. Mall, D.M., Singh, A.P.& Sarkar, D., 2005. Structure and Seismotectonic of Satpura, Central India, Current Science, 88, 1621-1627. Manglik, A.&Singh, R.N., 2002.Thermomechanical structure of the Central Indian shield : Constrains from deep crustal seismicity, Current Science, 82, 1151-1157. Mishra, D.C., 1977. Possible extensions of the NarmadaSon lineament towards Murray ridge (Arabian Sea) and the eastern syntaxial bend of the Himalayas, Earth and Planet. Sci. Lett., 36, 301-308. Mizutani, H., Ishido, T., Yokokura, Y. & Ohnishi, S., 1976. Electrokinetic phenomena associated with earthquakes, Geophys. Res. Lett., 3, 365-368. Molnar, P., Kunangyi, C.B. & Liang, Z.Z., 1987. Geomorphic evidence for active faulting in the Altyn Tagh and northern Tibet quantitative estimates of its contribution to the convergence of India and Eurasia, Geology, 15, 403-406. Nagata, T. & Kinoshita, H., 1967. Effect of the hydrostatic pressure on magnetostriction and magnetocrystalline anisotropy of magnetite, Phys. Earth Planet. Int., 1, 44-48. Nagata, T., 1969. Tectonomagnetism, I.A.G.A. Bull., 27, 1243. Naskar, D,C., Mujumdar, R.K., Choudhury, K. & Das, L.K., 2003. Magnetic profiles across NSL in part of Central India, Indian Minerals, 57, 53-60. Nishida, Y., Sagisaki, Y., Takahashi, K., Utsugi. M. & Oshima, H., 2004. Tectonomagnetic study in the eastern part of Hokkaido, NE Japan: Discrepancy between observed and calculated results, Earth Planets Space, 56, 1049-1056. Oshiman, N., 1990. Enhancement of tectonomagnetic changes due to non-uniform magnetization in the Earth’s crust – two –dimensional case studies, J Geomag. Geolectr., 42, 607-619. Pimprikar, S.D. & Devarajan, M.K., 2003. Earthquake swarm activity around village Bamhori, Seoni District, Madhya Pradesh : A preliminary study, Jour. Geol. Soc. India, 62, 498-502. Qureshy, M.N., 1964. Gravity anomalies as related to regional tectonic of peninsula India. Rep. 22nd Int. Geol. Congr. New Delhi, India Pt. IV, 490-506. Ravi Shankar, 1988. Heat flow map of India and discussions on its geological and economics significance, Indian Miner., 42, 89-110. Reddy, P.R., Sain, K. & Murty, A.S.N., 1997. On the seismic vulnerability of Jabalpur region: Evidence from deep seismic sounding, Current Science, 73, 796-800. Rikitake, T., 1976a. Earthquake Prediction, Elsevier, Amsterdam, pp. 357 Rikitake, T., 1966b. Elimination of non local changes from total intensity values of the geomagnetic field, Bull. Earthq. Res.Inst. Univ. Tokyo, 44, 1041-1070. Rikitake, T. & Honkura, Y., 1985 Solid Earth Geomagnetism. Terra Scientific Publ. Co. Japan, pp. 400 Samson, J.C., 1991. Geomagnetic pulsations and plasma waves in the Earth’s Magnetosphere, In: Jacobs J.A. (Ed.) Geomagnetism Vol. 4, Academic Press. Harcourt Brace Jovanovich, Publ., London, pp.481590. Sasai,Y., 1980. Application of the elasticity theory of dislocation of tectonomagnetic Modelling, Bull. Eaerhq. Res. Inst. Univ. Tokyo, 55, 387-447. Sasai, Y., 1991. Tectonomagnetic modeling on the basic of the linear piezomagnetic Effect, Bull. Earthq. Res. Inst. Univ. Tokyo, 66, 585-722. Sasai,Y., 1994. Piezomagnetic fields produced by dislocation sources, Surveys in Geophysics, 15, 363382. Sasai, Y., 2001. Tectonomagnetic modeling based on the piezomagnetism, A review, Annali Di Geofisica, 44 73 P.B.Gawali et al. (2), 361-268. Sasai, Y.& Ishikawa, Y., 1997. Seosmomagnetic models for earthquakes in the eastern part of Izu Peninsula, Central Japan , Annali Di Geofisica, 40 (2), 463-478. Sasai, Y.& Ishikawa.Y., 1980. Changes in the geomagnetic total force intensity associated with the anomalous crustal activity in the eastern part of the Izu Peninsula (3) – The off Izu Peninsula earthquake of 1980, Bull. Earthq. Res. Inst. Univ. Tokyo, 55, 1101 - 1113. Scholz, C.H., Sykes, L.R., Agarwal, Y.P., 1973. Earthquake prediction : A Physical Basis, Science, 81, 803-809. Shapiro, V.A., Pushkov. A.N., Abdullabekov, K.N., Berdallev, E.B. & Muminov, M. Yu., 1978. Geomagnetic investigations in the seismoactive regions of Middle Asia, J. Geomag. Geoelectr., 30, 503-509. Skovorodkin, Yu. P., Bezuglaya, L.S. & Guseva, T.V. 1978. Tectonomagnetic studies in Tajikistan, J. Geomag. Geoelectr., 30, 481-486. Stacey, F.D., 1964. The seismomagnetic effect, Pageoph, 58, 5-22. Stacey, F.D. & Johnston, M.J.S., 1972. Theory of the piezomagnetic effect in Titanomagnetic bearing rocks, Pageoph, 97, 146-155. Stacey, F.D. & Westcott, P., 1965. Seismomagnetic effectlimit of observability imposed by local variations in geomagnetic disturbances, Nature, 206, 1209-1211. Stuart, W.D., Banks, P.O., Sasai. Y. & Liu S.W.,1995. Piezomagnetic field for Parkfield fault model, J. Geophys. Res., 100, 146-155. Utsugi, M., 2000. A computer program for the calculation of piezomagnetic field due to a spherical pressure source ( Mogi model) in the inhomogeneously magnetized crust, J. Fac. Sci. Hokkaido Univ. Ser. 7, 11, 739-751. Verma, R.K. & Banerjee, P., 1992. Nature of continental crust along the Narmada-Son lineament inferred from gravity and deep seismic sounding data, Tectonophysics, 202, 375-397. Waghmare, S.Y., 2003. Correlation of Satpura electrical conductivity anomaly with the Jabalpur earthquake of May 22, 1997, Jour. Geol. Soc. India, 62, 74-82. Waghmare, S.Y. & Arora, B.R., Pecova, J., 1996. Estimation of structural geometry of Satpura conductivity anomaly through the Hilbert Transformation of magnetovariational fields, Jour. Assoc. Expl. Geophys., 17, 165-175. Waghmare, S.Y., Carlo, L., Gawali, P.B. & Patil, A.G., 2008. Geomagnetic investigation in the seismoactive area of Narmada-Son Lineament, Central India, J. Ind. Geophys. Union, 12, 1-10. West, W.D., 1962. The line of Narmada-Valleys, Curr. Sci., 31, 143-144. Yukutake, T. & Tachinaka, H., 1967. Geomagnetic variation associated with stress change within a semi-infinite elastic earth caused by a cylindrical force source, Bull. Earthq. Res. Inst. Univ. Tokyo, 45, 785-798. Zlotnicki, J. & Cornet, F.H., 1986. A numerical model of earthquake induced piezomagnetic anomalies, J. Geophys. Res., 91, 709-718. Zlotnicki, J. & Le Mouel, J.L., 1990. Possible electrokinetic origin of large magnetic variations at La Fournaise volcano, Nature, 343 (62590), 633-636. (Revised accepted2011 March 1, Received 2010 November 24) 74 Geomagnetic secular variation anomalies investigated through tectonomagnetic monitoring in the seismoactive zone of the Narmada-Son Lineament, Central India Mr. Praveen B. Gawali was born in November 1967 at Kolhapur, Maharashtra. He obtained his M.Sc. from Karnataka University, Dharwar in 1992 and joined Indian Institute of Geomagnetism in 1993. Currently, he is working as a Technical Officer-II and his area of interest includes Environmental Magnetism. He has several research papers and popular science articles to his credit. Dr. S.Y. Waghmare was born in February 1951 at Pahadi, Maharashtra. He obtained his Ph.D. in Physics from Mumbai University in 1996. At present he holds a post of Associate Professor in Indian Institute of Geomagnetism. He has about 32 years of experience in the area of Solid Earth Geomagnetism, particularly research by Geomagnetic Depth Sounding (GDS) by conducting magnetometer arrays in specified regions in Himalayas and Central India. He was a Principal Investigator for tectonomagnetic studies in Earthquake prone Jabalpur area in the Narmada-Son Lineament, Central India. A number of research papers are to his credit, published in national and international journals. Mr. Louis Carlo was born in November 1953 at Mangalore, Karnataka. He joined the Indian Institute of Geomagnetism in 1975 and at present holds a post of Technical OfficerIII. His areas of research interest consisted of Solid Earth Geomagnetism, Night Airglow, Tectonomagnetism and Environmental Magnetic Studies. He has contributed for many papers in Solid Earth Geomagnetism and Night Airglow. Mr. Arun Govind Patil was born in November 1955 at Mumbai. He got his B.Sc. degree from Mumbai University in 1973. He joined Indian Institute of Geomagnetism in 1980 in the Instrumentation section. He has worked on the development of proton magnetometer. He has published two papers on data processing techniques using proton magnetometer. Currently, he is working as a Technical Officer –II. 75 P.B.Gawali et al. 76


![Download [ PDF ] - Journal of Evolution of Medical and Dental](http://s2.esdocs.com/store/data/000490633_1-79d27cd27762477b75f0b1e9ea895fb0-250x500.png)


© Copyright 2026