
T e m p e ra tu re (K ) Relative Humidity RH (%)
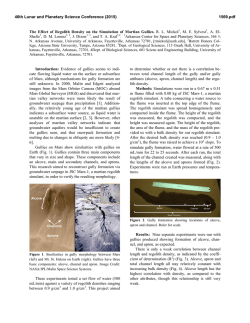
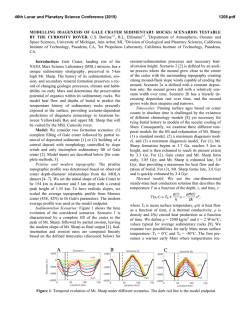
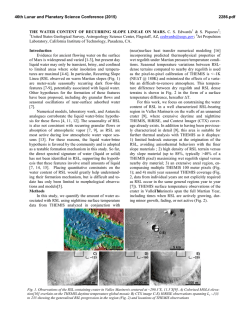
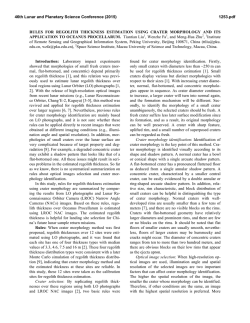
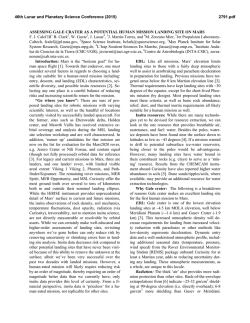
46th Lunar and Planetary Science Conference (2015)
1110.pdf
REGOLITH-ATMOSPHERE WATER VAPOR TRANSFER ON MARS: COMPARISON BETWEEN
PHOENIX AND MSL DATA. M. B. Conner1,2, H. N. Farris1, V. F. Chevrier1, 1Arkansas Center for Space and
Planetary Science, MUSE 202, University of Arkansas, Fayetteville, AR 72701, USA, 2Reed College 3203 Woodstock Blvd, Portland, OR, 97202. [email protected].
280
Langmuir
BET
260
Temperature (K)
Introduction: The relative humidity (RH) data returned by Phoenix [1, 2] allowed the first detailed investigation of the diurnal water cycle in the polar region of Mars. Much has been discussed with regards to
the water cycle on Mars, including an evaporationadsorption cycle where water molecules alternate between thin layers on the surface of regolith and water
vapor in the air (Fig. 1).
The most recent rover to visit Mars, Mars Science
Laboratory (MSL), also returned detailed RH data in an
equatorial region across a full Martian year. A comparison of the two data sets is warranted since the rovers
are located in the two geographic extremes of the surface (polar vs. equatorial), which suggests that the two
data sets should bracket the climate on the Martian
surface.
This abstract analyzes the Phoenix data using adsorption theories built on the foundation of regolith parameters [3]. The results of this analysis will then be compared to the MSL data.
240
220
200
180
100
10
1
0.1
0.01
Relative Humidity RH (%)
Figure 2. Fit of Phoenix lander data using the Langmuir adsorption theory (blue line) for one monolayer of water molecules,
and the BET theory (red line) for multilayer. The fit uses JSC
Mars-1 simulant parameters shown in (Table 1) and ΔH ≈ 56 kJ
mol-1. The resulting surface coverages are 0.15 and 0.32, respectively.
At first glance the data (Fig. 2) suggest a logarithmic
fit. To explain this relationship, two theoretical paths
were taken: Langmuir and BET. Both are theories of
adsorption that involve modeling liquids by layers;
Langmuir only assumes a monolayer, while the more
rigorous BET method allows for a multilayer construction. Beginning with the definition of RH for a Langmuir isotherm:
(1)
Figure 1. Comparison between top: the distribution of
nanophase ferric oxides as seen by Mars Express OMEGA
(high abundance: white, low: blue) [4] and bottom: the humidity in the atmosphere, ranging from 0 (blue) to ~30 (red),
as observed by MGS-TES in the equatorial regions [5,
6]. The similarity of both maps suggests the ferric oxides
abundant in the regolith could control the atmospheric humidity through adsorption and desorption [7].
Phoenix data: RH from Phoenix was taken with the
Thermal and Electrical Conductivity Probe (TECP)
instrument. The data came from the PDS for sols
0–150. Saturation vapor pressure (Psat) [8] was calculated using the board temperature, T, and will suffice
as the atmospheric pressure. Computing the vapor
pressure at the frost point temperature allowed for the
calculation of the pressure of water (PH2O). Using these
two calculations, RH (Eqn. 1) could then be found and
plotted against the temperature (Fig. 2).
where Psat has been shown to be a function of temperature and PH2O is the saturation vapor pressure for water
ice and is given by rearranging the Langmuir equation:
(2)
Here θ is the surface coverage (or the fraction of the
surface covered by water) and α is a parameter describing the regolith at a specific temperature. Knowing α at
one temperature, one can find it at other temperatures
with:
(3)
where R is the ideal gas constant, T is temperature, ΔH
is the enthalpy, and Psat(T) is the saturation pressure at
temperature T. The α values were calculated from C
values given in (Pommerol et al., 2009) at T = 243K,
46th Lunar and Planetary Science Conference (2015)
so α at any temperature could be calculated [7]. With
this variable taken care of, a fit of the data could be
made by adjusting the only two remaining variables: θ
and ΔH. For the regolith JSC Mars-1 (α0 = 2.06), the
curve fit the data at values of θ = 0.32 and ΔH ≈ 56
kJ (Fig. 2).
A BET approach is analogous. Rearranging the BET
equation and solving for RH
1110.pdf
(6)
where Psat,ice has been shown to be a function of temperature. At the frost point water vapor changes into
ice, rather than liquid water like at higher temperatures, and becomes the dominant form of transfer.
(4)
Here θ is the volumetric coverage, and C is a constant
that is defined as α times the saturation pressure. C can
also be expressed as:
(5)
Equations (4) and (5), combined with C values for different regolith types again taken from (Pommerol et
al., 2009), allowed for adjustment of θ and ΔH parameters in order to find the lind of best fit [7]. For the
regolith JSC Mars-1 (C = 103.4 at T = 243 K), the
curve fit the data at values of θ = 0.32 and ΔH ≈ 56 kJ
(Fig. 2). Visually, the BET curve fits better than the
Langmuir one and it encompasses the data points at the
edge of the set.
Figure 3. MSL data (green) and Phoenix data (orange) fit
using the multilayer BET theory (blue) for JSC Mars-1 simulant parameters shown in Table 1 and, has a ΔH ≈ 56 kJ/mol
and θ ≈ 0.33.
MSL data: RH from MSL was taken with the Rover
Environmental Monitoring Station (REMS) instrument. The data showed a similar trend of increasing
humidity with decreasing temperature, though the
trend of the data is much broader than the Phoenix data
(Fig. 3). The fit using BET theory for the MSL data
was not as clean and an additional component had to
be added: the frost point. For the regolith JSC Mars1(C = 103.4 at T = 243 K), the BET curve fit the data
at values of θ = 0.46 and ΔH ≈ 42 kJ (Fig. 4). At the
triple point, the frost point takes over and accounts for
the high humidities at low temperatures. The relative
humidity at the frost point is given by the equation:
Figure 4. MSL data represented using a point density display
(yellow is high density, red low density). The majority of
data points fall along the multilayer BET theory line (black)
and a new frost point line (blue). The new fit follows the
solid section of both lines. For JSC Mars-1 simulant parameters shown in Table 1 and fit produced ΔH ≈ 42 kJ/mol and θ
≈ 0.46.
Conclusions: The trend in the data collected with
Phoenix can be explained with the multilayer BET
theory. This explanation holds when applying it to the
MSL data, though a frost point must be included.
The BET model describing the Phoenix data points
results in θ ≈ 0.33 layers, and for MSL we find θ ≈
0.46. These values are relatively consistent, and account for the “warmer” effects of MSL’s equatorial
location. These values suggest liquid water can adsorb
onto the surface, but in very small amounts.
It should also be noted that one of the reasons we
might see higher variability in the MSL data is that
MSL is travelling, so the rover could encounter a variety to different climates and regolith types.
References: [1] Hecht M. H. et al. (2009) Science 325,
64-67. [2] Chevrier V. et al. (2008) Icarus 196 (2),
459-476. [3] Brunauer S. et al. (1938) Journal of
American Chemical Society 60 (2). 309-319. [4] Poulet
F. et al. (2007) Journal of Geophysical Research. 112.
[5] Jakosky B. M. et al. (2005) Icarus. 175, 58-67. [6]
Smith, M. D. (2002) Journal of Geophysical Research.
107. [7] Pommerol et al. (2009) Icarus 204(1), 134136. [8] Feistel R., W. Wagner (2007) Geochim. Cosmochim. Acta 71, 36-45.


© Copyright 2026