
USING METEORITE SAMPLES AS A TEST FOR CORRELATION
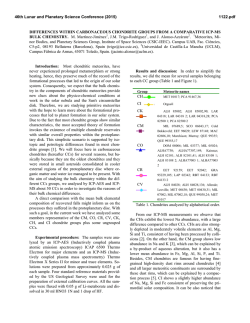
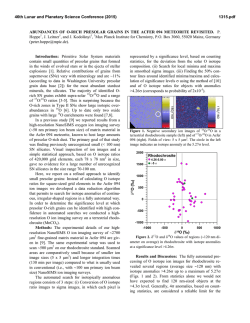
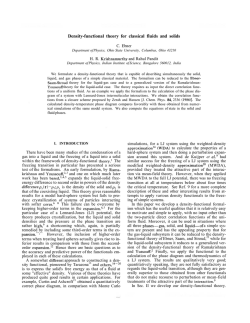
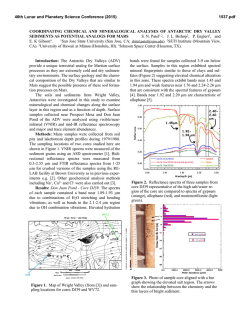
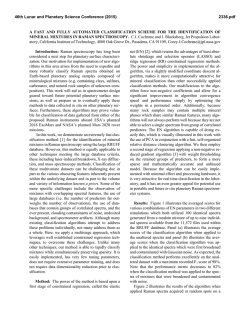
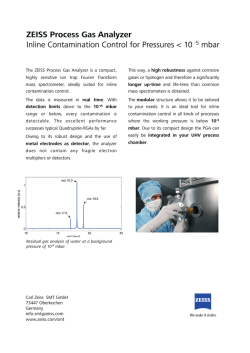
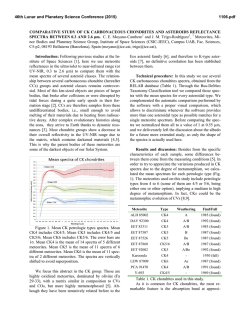
46th Lunar and Planetary Science Conference (2015)
2200.pdf
USING METEORITE SAMPLES AS A TEST FOR CORRELATION BASED ANALYSIS OF SIMS DATA
FROM COMETARY GRAINS. O.J. Stenzel1, K. Varmuza2, C. Engrand3, L. Ferrière4, F. Brandstätter 4, C. Koeberl4,5, P. Filzmoser2, J. Paquette1, and M. Hilchenbach1. 1Max Planck Institute for Solar System Research, Justus-von-Liebig-Weg 3, 37077 Göttingen, Germany ([email protected]), 2 Vienna University of Technology, Department of Statistics and Probability Theory, A-1040 Vienna, Austria, 3Centre de Sciences Nucléaires et de
Sciences de la Matière - CSNSM, Bat. 104, 91 405 Orsay, France, 4Natural History Museum, Burgring 7, A-1010
Vienna, Austria, 5Department of Lithospheric Research, University of Vienna, A-1090 Vienna, Austria.
Introduction: The time-of-flight secondary ion
mass spectrometer COSIMA on board the Rosetta
spacecraft is analysing cometary grains ejected off the
nucleus of comet 67P/Churyumov-Gerasimenko since
August 2014 [1]. In our effort to understand the composition and the history of these cometary grains, we
studied the characteristics of different meteorite
samples with the COSIMA reference instruments at the
Max Planck Institute for Solar System Research in
Goettingen (Germany), with the goal to separate individual compounds and their fragmentation patterns.
Material and Methods: Different types of meteorite samples were prepared in the laboratory. Among
these were one ordinary chondrite H4 (Ochansk), one
unequilibrated ordinary chondrite H3 (Tieschitz), one
carbonaceous chondrite CR (Renazzo) [2], and a Martian shergottite (Tissint) [3]. Grains of sizes up to 100
µm were pressed into a blank gold metal target. The
grains were identified with the instrument microscope
and positive and negative secondary ion mass spectra
were accumulated on different positions on selected
grains. The mass spectra are accumulating all secondary ions up to mass 300 with reasonable detection efficiency and a mass resolution of 1400@ 100 u/q (unified atomic mass units per elementary charge). This
mass resolution is sufficient to separate organic (hydrogen rich) molecule peaks from minerals or elemental mass peaks.
The obtained mass spectra were aligned to a reference mass spectrum taken from the same target but
pointing the ion beam at the gold substrate instead of
at the meteorite samples. This involves the remapping
of the time/mass scale for each single spectrum used.
The cross calibration is mandatory to get meaningful
correlations between time of flight channels across different spectra.
The rebinned spectra were then used to construct a
correlation matrix S in which each element rij is the
correlation of the counts in time slot i with the counts
in time slot j across a specific sample. Taking an individual column or row of the matrix, yields the correlation of a single time slot with every other time slot. As
the time slots translate to specific mass to charge ratios, this method allows to gain information on which
elements and molecules are related in the investigated
sample.
Results: In this abstract, we show the correlation
analysis of samples from Tissint and Renazzo. Figures
1-5 show the Pearson correlations of counts at the time
slots, which translate to the masses of 23Na+, 24Mg+,
28
Si+, and 56Fe+, with the counts across different
time/mass ranges for the Tissint sample on the left side
and the Renazzo sample on the right side. To keep the
text concise from now on, we just write of “correlation
of ion abundance at mass x with masses from range y
to z”.
Discussion and Conclusion: As can be seen from
the figures above, there are some subtle and some larger differences between the samples from the Martian
Shergottite and the CR chondrite. Especially the correlations with different masses in the 20 u to 30 u
range that 56Fe+ (mass 55.93 u) show that iron may be
associated with different elements in Tissint and in
Renazzo. In turn 24Mg+ shows a strong correlation
with all Fe isotopes for Renazzo but not for Tissint.
Mg shows no correlation with Al in the Tissint sample
but in the Renazzo one.
These few elements already show that the two distinct samples can clearly been distinguished from each
other by correlation analysis. This makes us confident
in our use of this technique to further characterize the
spectra of the cometary dust particles. However, the
correlation analysis is just one step to really identify
compounds from the samples. Other methods are also
needed, e.g., to look at absolute and relative abundance
of specific elements, etc. We continue to apply and improve these tools for the use with cometary data.
Acknowledgments:
Supported by DLR (grant 50 QP 1302)
Supported by the Austrian Science Fund (FWF),
project P26871-N20.
References: [1] Kissel J. et al. (2007), Space Sci
Rev, 128, 823-867. [2] Mason BH and Wiik HB
(1962), American Museum Novitates 2106. [3] Ibhi A.
et al. (2012), J. Mater. Environ. Sci. 4 (2) 293-298.
46th Lunar and Planetary Science Conference (2015)
2200.pdf
Figure 1: Correlation of ion abundance at mass 22.99 u (sodium) with masses between 0 u and 80 u from the Tissint (left) and
Renazzo samples (right).
Figure 2: Correlation of ion abundance at mass 23.98 u (magnesium) with masses between 20 u and 40 u from the Tissint (left)
and Renazzo samples (right).
Figure 3: Correlation of ion abundance at mass 23.98 u (magnesium) with masses between 50 u and 60 u from the Tissint (left)
and Renazzo samples (right).
Figure 4: Correlation of ion abundance at mass 27.98 u (silicon) with masses between 50 u and 60 u from the Tissint (left) and
Renazzo samples (right).
Figure 5: Correlation of ion abundance at mass 55.93 u (iron) with masses between 20 u and 30 u from the from the Tissint (left)
and Renazzo sample (right), in which iron seems to be correlated with all three Mg isotopes, but different from the Tissint
sample, there are positive correlations with Al and Si, too.


© Copyright 2026