
Sample Selection Models in R: Package sampleSelection
Sample Selection Models in R:
Package˜sampleSelection
Ott Toomet
Arne Henningsen
Tartu University
University of Copenhagen
Abstract
This introduction to the R package sampleSelection is a slightly modified version of
Toomet and Henningsen (2008b), published in the Journal of Statistical Software.
This paper describes the implementation of Heckman-type sample selection models
in R. We discuss the sample selection problem as well as the Heckman solution to it,
and argue that although modern econometrics has non- and semiparametric estimation
methods in its toolbox, Heckman models are an integral part of the modern applied
analysis and econometrics syllabus. We describe the implementation of these models in
the package sampleSelection and illustrate the usage of the package on several simulation
and real data examples. Our examples demonstrate the effect of exclusion restrictions,
identification at infinity and misspecification. We argue that the package can be used
both in applied research and teaching.
Keywords:˜sample selection models, Heckman selection models, econometrics, R.
1. Introduction
Social scientists are often interested in causal effects—what is the impact of a new drug,
a certain type of school or being born as a twin. Many of these cases are not under the
researcher’s control. Often, the subjects can decide themselves, whether they take a drug or
which school they attend. They cannot control whether they are twins, but neither can the
researcher—the twins may tend to be born in different types of families than singles. All these
cases are similar from the statistical point of view. Whatever is the sampling mechanism, from
an initial “random” sample we extract a sample of interest, which may not be representative
of the population as a whole (see Heckman and MaCurdy 1986, p.˜1937, for a discussion).
This problem—people who are “treated” may be different than the rest of the population—is
usually referred to as a sample selection or self-selection problem. We cannot estimate the
causal effect, unless we solve the selection problem1 . Otherwise, we will never know which
part of the observable outcome is related to the causal relationship and which part is due to
the fact that different people were selected for the treatment and control groups.
Solving sample selection problems requires additional information. This information may be
in different forms, each of which may or may not be feasible or useful for any particular case.
1
Correcting for selectivity is necessary but not always sufficient for estimating the causal effect. Another
common problem is the lack of common support between the treated and untreated population. We are grateful
to a referee for pointing this out.
2
Sample Selection Models in R: Package˜sampleSelection
Here we list a few popular choices:
❼ Random experiment, the situation where the participants do not have control over their
status but the researcher does. Randomisation is often the best possible method as it is
easy to analyse and understand. However, this method is seldom feasible for practical
and ethical reasons. Even more, the experimental environment may add additional
interference which complicates the analysis.
❼ Instruments (exclusion restrictions) are in many ways similar to randomisation. These
are variables, observable to the researcher, and which determine the treatment status
but not the outcome. Unfortunately, these two requirements tend to contradict each
other, and only rarely do we have instruments of reasonable quality.
❼ Information about the functional form of the selection and outcome processes, such as
the distribution of the disturbance terms. The original Heckman’s solution belongs to
this group. However, the functional form assumptions are usually hard to justify.
During recent decades, either randomisation or pseudo-randomisation (natural experiments)
have become state of the art for estimating causal effects. However, methods relying on
distributional assumptions are still widely used. The reason is obvious—these methods are
simple, widely available in software packages, and they are part of the common econometrics
syllabus. This is true even though reasonable instruments and parametric assumptions can
only seldom be justified, and therefore, it may be hard to disentangle real causal effects from
(artificial) effects of parametric assumptions.
Heckman-type selection models also serve as excellent teaching tools. They are extensively
explained in many recent econometric text books (e.g. Johnston and DiNardo 1997; Verbeek
2000; Greene 2002; Wooldridge 2003; Cameron and Trivedi 2005) and they are standard procedures in popular software packages like Limdep (Greene 2007) and Stata (StataCorp. 2007).
These models easily allow us to experiment with selection bias, misspecification, exclusion
restrictions etc. They are easy to implement, to visualize, and to understand.
The aim of this paper is to describe the R (R Development Core Team 2008) package sampleSelection (version˜0.6-0), which is available on the Comprehensive R Archive Network
at http://CRAN.R-project.org/package=sampleSelection. The package implements two
types of more popular Heckman selection models which, as far as we know, were not available
for R before. Our presentation is geared toward teaching because we believe that one of the
advantages of these types of models lies in econometrics training.
The paper is organized as follows: In the next section we introduce the Heckman (1976) solution to the sample selection problem. Section˜3 briefly describes the current implementation
of the model in sampleSelection and its possible generalisations. In Section˜4 we illustrate
the usage of the package on various simulated data sets. Section˜5 is devoted to replication
exercises where we compare our results to examples in the literature. Section˜6 describes
robustness issues of the method and our implementation of it; and the last section concludes.
2. Heckman’s solution
The most popular solutions for sample selection problems are based on Heckman (1976). A
variety of generalisations of Heckman’s standard sample selection model can be found in the
Ott Toomet, Arne Henningsen
3
literature. These models are also called “generalized Tobit models” (Amemiya 1984, 1985). A
comprehensive classification of these models has been proposed by Amemiya (1984, 1985).
2.1. Tobit-2 models
Heckman’s standard sample selection model is also called “Tobit-2” model (Amemiya 1984,
1985). It consists of the following (unobserved) structural process:
yiS∗ = β S xSi + εSi
(1)
O
yiO∗ = β O xO
i + εi ,
(2)
where yiS∗ is the realisation of the the latent value of the selection “tendency” for the individual
i, and yiO∗ is the latent outcome. xSi and xO
i are explanatory variables for the selection and
outcome equation, respectively. xS and xO may or may not be equal. We observe
yiS =
0
1
yiO =
0
yiO∗
if yiS∗ < 0
otherwise
(3)
if yiS = 0
otherwise,
(4)
i.e. we observe the outcome only if the latent selection variable y S∗ is positive. The observed
dependence between y O and xO can now be written as
S
S S
O O
O S
S S
E[y O |xO = xO
i , x = xi , y = 1] = β xi + E[ε |ε ≥ −β xi ].
(5)
Estimating the model above by OLS gives in general biased results, as E[εO |εS ≥ −β S xSi ] = 0,
unless εO and εS are mean independent (in this case = 0 in equation˜(6) below).
Assuming the error terms follow a bivariate normal distribution:
εS
εO
∼N
0
1
,
0
σ2
,
(6)
we may employ the following simple strategy: find the expectations E[εO |εS ≥ −β S xSi ], also
called the control function, by estimating the selection equations (1) and (3) by probit, and
thereafter insert these expectations into equation (2) as additional covariates (see Greene 2002
for details). Accordingly, we may write:
O S
S S
O O
S S
yiO = β O xO
i + E[ε |ε ≥ −β xi ] + ηi ≡ β xi + σλ(β xi ) + ηi
(7)
where λ(·) = φ(·)/Φ(·) is commonly referred to as inverse Mill’s ratio, φ(·) and Φ(·) are
standard normal density and cumulative distribution functions and η is a new disturbance
term, independent of xO and xS . The unknown multiplicator σ can be estimated by OLS
(βˆλ ). Essentially, we describe the selection problem as an omitted variable problem, with λ(·)
as the omitted variable. Since the true λ(·)s in equation (7) are generally unknown, they are
replaced by estimated values based on the probit estimation in the first step.
The relations (6) and (7) also reveal the interpretation of . If > 0, the third term in the
right hand side of (7) is positive as the observable observations tend to have above average
4
Sample Selection Models in R: Package˜sampleSelection
realizations of εO . This is usually referred to as “positive selection” in a sense that the observed
outcomes are “better” than the average. In this case, the OLS estimates are upward biased.
An estimator of the variance of εO can be obtained by
σ
ˆ2 =
ˆη
ˆ
δˆi
η
2
+ iO βˆλ
O
n
n
(8)
ˆ is the vector of residuals from the OLS estimation of˜(7), nO is the number of
where η
ˆ i (λ
ˆi + β
ˆ S xS ). Finally, an estimator of the
observations in this estimation, and δˆi = λ
i
correlation between εS and εO can be obtained by ˆ = βˆλ /ˆ
σ . Note that ˆ can be outside of
the [−1, 1] interval.
Since the estimation of (7) is not based on the true but on estimated values of λ(·), the standard OLS formula for the coefficient variance-covariance matrix is not appropriate (Heckman
1979, p.˜157). A consistent estimate of the variance-covariance matrix can be obtained by
O
ˆ O, β
ˆλ = σ
VAR β
ˆ 2 XO
λ Xλ
where
−1
ˆ XO + Q
I − ˆ2 ∆
λ
XO
λ
ˆS
ˆ S VAR β
Q = ˆ2 XO
λ ∆X
ˆ O ,
XS ∆X
λ
O
XO
λ Xλ
−1
(9)
(10)
O
ˆ
XS is the matrix of all observations of xS , XO
λ is the matrix of all observations of x and λ,
S
ˆ is
ˆ is a diagonal matrix with all δˆi on its diagonal, and VAR β
I is an identity matrix, ∆
the estimated variance covariance matrix of the probit estimate (Greene 1981, 2002).
This is the original idea by Heckman (1976). As the model is fully parametric, it is straightforward to construct a more efficient maximum likelihood (ML) estimator. Using the properties
of a bivariate normal distribution, it is easy to show that the log-likelihood can be written as
log Φ(−β S xSi )+
=
(11)
{i:yiS =0}
+
log Φ
{i:yiS =1}
β S xSi +
(yiO − β O xO
i )
σ
1−
2
O − β O xO )2
1
1
(y
i
i
− log 2π − log σ −
.
2
2
σ2
(12)
The original article suggests using the two-step solution for exploratory work and as initial
values for ML estimation, since in those days the cost of the two-step solution was $15 while
that of the maximum-likelihood solution was $700 (Heckman 1976, p.˜490). Nowadays, costs
are no longer an issue, however, the two-step solution allows certain generalisations more
easily than ML, and is more robust in certain circumstances (see Section˜6 below).
This model and its derivations were introduced in the 1970s and 1980s. The model is well
identified if the exclusion restriction is fulfilled, i.e. if xS includes a component with a substantial explanatory power but which is not present in xO . This means essentially that we
have a valid instrument. If this is not the case, the identification is related to the non-linearity
of the inverse Mill’s ratio λ(·). The exact form of it stems from the distributional assumptions. During the recent decades, various semiparametric estimation techniques have been
Ott Toomet, Arne Henningsen
5
increasingly used in addition to the Heckman model (see Powell 1994, Pagan and Ullah 1999,
and Li and Racine 2007 for a review).
2.2. Tobit-5 models
A straightforward generalisation of the standard sample selection model (Tobit-2) is the
switching regression (Tobit-5) model. In this case, we have two outcome variables, where
only one of them is observable, depending on the selection process. Switching regression
problems arise in a wide variety of contexts, e.g. in treatment effect, migration or schooling
choice analysis. This type of model consists of a system of three simultaneous latent equations:
yiS∗ = β S xSi + εSi
yiO1∗
yiO2∗
=β
O1
xO1
i
=β
O2
xO2
i
(13)
+
εO1
i
(14)
+
εO2
i ,
(15)
where y S∗ is the selection “tendency” as in the case of Tobit-2 models, and y O1∗ and y O2∗ are
the latent outcomes, only one of which is observable, depending on the sign of y S∗ . Hence we
observe
yiS =
0
1
yiO =
yiO1∗
yiO2∗
if yiS∗ < 0
otherwise
(16)
if yiS = 0
otherwise.
(17)
Assuming that the disturbance terms have a 3-dimensional normal distribution,
S
ε
0
1
1 σ1
2 σ2
εO1 ∼ N 0 , 1 σ1
σ12
12 σ1 σ2 ,
O2
ε
0
σ22
2 σ2
12 σ1 σ2
(18)
it is straightforward to construct analogous two-step estimators as in˜(7). We may write
S
S S
O1 O1
E[y O |xO1 = xO1
xi + E[εO1 |εS < −β S xSi ]
i , x = xi , y = 0] = β
(19)
S
S S
O2 O2
E[y O |xO2 = xO2
xi + E[εO2 |εS ≥ −β S xSi ]
i , x = xi , y = 1] = β
(20)
and hence
yiO =
β O1 xO1
i −
O2 O2
β xi +
S S
1
1 σ1 λ(−β xi ) + ηi
S S
2
2 σ2 λ(β xi ) + ηi
if yiS = 0
otherwise,
(21)
where E[η 1 ] = E[η 2 ] = 0 and λ(·) = φ(·)/Φ(·) is the inverse Mill’s ratio which can be calculated
using the probit estimate of˜(16). This system can be estimated as two independent linear
models, one for the case y S = 0 and another for y S = 1.
Note that the inverse Mill’s ratio enters (21) with opposite signs. If 2 > 0, we find that those,
for whom we observe the outcome 2, have more positive realizations of εO2 in average. As
the outcome 1 being observable is in the opposite end of the latent y S∗ scale, upward bias for
y O1 occurs when 1 < 0. This is what we expect to observe in case of endogenous selection,
6
Sample Selection Models in R: Package˜sampleSelection
a situation where the individuals try to select the “best” one between two possible options,
based on some private information about y O1∗ and y O2∗ .
The log-likelihood for this problem can be written as
N
log 2π+
2
+
− log σ1 −
S
{i:yi =0}
+
− log σ2 −
S
{i:y =1}
=−
1
2
yiO
1
2
yiO
O1
−β
σ1
O2
−β
σ2
xO1
i
xO2
i
2
β S xSi +
+ log Φ −
2
+ log Φ
1
σ1
yiO − β O1 xO1
i
1−
β S xSi +
2
σ2
2
1
yiO − β O2 xO2
i
1−
i
2
2
(22)
where N is the total number of observations. Note that 12 plays no role in this model; the
observable distributions are determined by the correlations 1 and 2 between the disturbances
of the selection equation (εS ) and the corresponding outcome equation (εO1 and εO2 ).
3. Implementation in sampleSelection
3.1. Current implementation
The main frontend for the estimation of selection models in sampleSelection is the command
selection. It requires a formula for the selection equation (argument selection), and a
formula (or a list of two for switching regression models) for the outcome equation (outcome).
One can choose the method (method) to be either "ml" for the ML estimation, or "2step" for
the two-step method. If the user does not provide initial values (start) for the ML estimation,
selection calculates consistent initial values by the corresponding two-step method.
While the actual two-step estimation is done by the function heckit2fit or heckit5fit
(depending on the model), the ML estimation is done by tobit2fit or tobit5fit. Note that
log-likelihood functions of selection models are in general not globally concave, and hence one
should use a good choice of initial values (see the example in Section˜6.1).
The likelihood maximisation is performed by the maxLik package (Toomet and Henningsen
2008a), where the Newton-Raphson algorithm (implemented as the function maxNR) using an
analytic score vector and an analytic Hessian matrix is used by default. This results in a
reasonably fast computation even in cases of tens of thousands observations. A well-defined
model should converge in less than 15 iterations; in the case of weak identification this number
may be considerably larger. Convergence issues may appear at the boundary of the parameter
space (if | | → 1, see Section˜6.1). Other maximisation algorithms can be chosen by argument maxMethod, e.g. maxMethod="SANN" uses a variant of the robust “simulated annealing”
stochastic global optimization algorithm proposed by B´elisle (1992) and maxMethod="BHHH"
uses the Berndt-Hall-Hall-Hausman algorithm (Berndt, Hall, Hall, and Hausman 1974).
The command selection returns an object of class selection. The sampleSelection package
provides several methods for objects of this class: a print method prints the estimation results, summary method (and associated print method) calculate and print summary results,
Ott Toomet, Arne Henningsen
7
coef methods extract the estimated coefficients, a vcov method extracts their covariance matrix, a fitted method extracts the fitted values, a residuals method extracts the residuals,
a model.frame method extracts the model frame, and a model.matrix method extracts the
model matrix.
The coef and vcov methods for selection objects, as well as the print method for
summary.selection objects include an extra argument part, which specifies which part of the
model is returned or printed. One may choose either the full model (part="full", default), or
the outcome equation only (part="outcome"). The fitted, residuals, and model.matrix
methods also include a part argument. However, for these functions the part argument specifies whether the objects of the outcome part (part="outcome", default) or of the selection
part (part="selection") should be returned.
Currently, the variance-covariance matrix of the two-step estimators is only partially implemented with NA-s in place of the unimplemented components.
The package is written completely in R which should minimize the portability issues. It
depends on packages maxLik (Toomet and Henningsen 2008a), systemfit (Henningsen and
Hamann 2007a,b), and mvtnorm (Genz, Bretz, and Hothorn 2005), where mvtnorm is used
for examples only. All these packages are available from the Comprehensive R Archive Network
at http://CRAN.R-project.org/.
3.2. Current API and a wider range of selection models
We now briefly discuss possible ways of introducing more general selection models using a
slightly generalized version of the current API.
First, the current argument selection can be used for specifying more general selection conditions. selection might contain an interval for interval censoring (for instance selection
= c(0, Inf) in case of the standard Tobit model), more than one formula (for multiple treatment models), or an indicator for the selection mechanism (like "max" or "min" for switching
regression with unobserved separator). In this way, all generalized Tobit models listed by
Amemiya (1984, 1985) can be specified.
Another possible generalisation is allowing for discrete dependent variable models. While
the case of binary-choice can be easily distinguished from continuous response, we need an
additional parameter in the multiple-choice case. This parameter (possibly a vector where
components correspond to the individual equations) will allow the user to specify the exact
type of the response (like multinominal, ordered or Poissonian).
Third, different distributions of the disturbance terms can be specified in a similar way using
an additional parameter. It may be a vector if different marginal distributions for different
outcome equations are necessary.
Finally, as the selection currently supports only two easily distinguishable models, we have
not provided a way to specify the model explicitly. However, explicit specification would allow
users to locate the programming problems more easily, and lessen the complications related
to automatic guess of the correct model type.
4. Using the selection function
This section provides selected illustrative simulation experiments which illustrate both the
8
Sample Selection Models in R: Package˜sampleSelection
strong and weak sides of the method, and the typical usage of selection.
4.1. Tobit-2 models
First, we estimate a correctly specified Tobit-2 model with exclusion restriction:
R>
set.seed(0)
R>
library("sampleSelection")
R>
library("mvtnorm")
R>
eps <- rmvnorm(500, c(0,0), matrix(c(1,-0.7,-0.7,1), 2, 2))
R>
xs <- runif(500)
R>
ys <- xs + eps[,1] > 0
R>
xo <- runif(500)
R> yoX <- xo + eps[,2]
R> yo <- yoX*(ys > 0)
We use mvtnorm in order to create bivariate normal disturbances with correlation −0.7. Next,
we generate a uniformly distributed explanatory variable for the selection equation, xs, the
selection outcome ys by probit data generating process, and the explanatory variable for the
outcome equation xo. All our true intercepts are equal to 0 and our true slopes are equal to 1,
both in this and the following examples. We retain the latent outcome variable (yoX) for the
figure below, and calculate the observable outcome yo. Note that the vectors of explanatory
variables for the selection (xs) and outcome equation (xo) are independent and hence the
exclusion restriction is fulfilled. This can also be seen from the fact that the estimates are
reasonably precise:
R>
summary( selection(ys~xs, yo ~xo))
-------------------------------------------Tobit 2 model (sample selection model)
Maximum Likelihood estimation
Newton-Raphson maximisation, 5 iterations
Return code 1: gradient close to zero
Log-Likelihood: -744.5918
500 observations (168 censored and 332 observed)
6 free parameters (df = 494)
Probit selection equation:
Estimate Std. error t value Pr(> t)
(Intercept) -0.12840
0.09983 -1.286
0.198
xs
1.20850
0.18474
6.542 6.09e-11 ***
Outcome equation:
Estimate Std. error t value Pr(> t)
(Intercept)
0.1732
0.1289
1.343
0.179
xo
0.8154
0.1714
4.757 1.97e-06 ***
Error terms:
Estimate Std. error t value Pr(> t)
sigma 1.11939
0.08104 13.813 <2e-16 ***
Ott Toomet, Arne Henningsen
9
3
●
●
●
●
●
2
●
●●
●
●
●
●
yoX
0
1
−1
●
●
●
●
●
●
●
●
●
●
●●
●
●
●
●
●
●
●
●
●
●
●
●
●
●
●
●
●
●●
●
●●
●
●
● ●
●
●
●
●●
●
●
●
●
●
●
●●
●
●
●
●
●
● ●
●
●
●
●
●
●
●
●
●
●
●
●
●
●
●
●
●
●
●
●
●
● ●
●
●
●
● ●
●
●
●
●●
●
● ●
●
●
●
●
●
●
●
●
●●
●
●
●
●●
●
●
● ●
●
●
●
●● ●
●
● ●
●●
●
●
●
●
●
●
●
●● ●
● ●
●
●●
● ● ●
●
●
●
●
●
●
●
●
●
●
● ●
●
●
●
●
●
●
●
● ●
● ●
●
●
●
●
●
●
●
●
●
●
●
● ●
● ●
●
●
●●
●
●
● ●
●
●
● ●
●
●
●● ●
●
●
● ●
●
●
● ●
●
●
●
●
●
● ● ●
●
●●
●
●
●
●
●
● ●
●
●
● ●
●
●
●
●
●
●
●
●
●
●
● ●
●
●
●
●
●●
● ●
●
●
●
●
●
●
●
●
●●
●
●
●
● ●
●
● ●
● ●
●
●
●
●
●●●
●
●
●
● ●
●
●
●
●
● ●●
●
●
●●
●
●
●
●
●
● ● ●
●●
●●●
● ●●
●
●
● ● ●
● ●
●
●
●●
●
●
●●
●●
●●
●
● ●
●
●
●
●
●
●
●
●
●
●●
●
●
●
●
●
●
●
●
●
●
●
● ●●
●
●
●
●
●
●
●
●
●
●
●
● ●
●
●
●
● ●
●
●●
●
●
●
●
●
●
●
●
●
●
●
●
●
●
●
●
●
●
●
● ●●
●
●
●
●
● ●
●
●
●
●
● ●
●
●
●
●
●
●
●
●
●
●
●
●
●
●
●
● ●
●
●●
●
●●
●
●
●
●
●
●
●
●
●●
●
●
●
●
●
●
●
●
●
●
●
●
●
●
●
●
● ●
−2
●
●
●
●
●
●
●
●
●
●
●
● ●
●●
●
● ●
●
●
●
●
●
0.0
0.2
0.4
0.6
0.8
1.0
xo
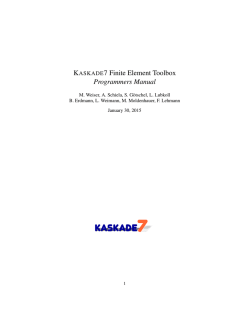
Figure 1: Sample selection example with exclusion restriction (filled circles = observable
outcomes, empty circles = unobservable outcomes, solid line = true dependence, dashed line
(partly overlapping the solid) = ML estimate above, dotted line = OLS estimate based on
observable outcomes only).
rho
-0.79796
0.09334 -8.549 <2e-16 ***
--Signif. codes: 0 ‘***’ 0.001 ‘**’ 0.01 ‘*’ 0.05 ‘.’ 0.1 ‘ ’ 1
-------------------------------------------One can see that all the true values are within the 95% confidence intervals of the corresponding estimates.
Now look at the graphical representation of the data (Figure˜1). We can see that the unobserved values (empty circles) tend to have higher y O∗ realisations than the observed ones
(filled circles). This is because < 0. The OLS estimate (dotted line) is substantially downward biased – it does not take into account the fact, that we tend to observe the observations
with low realisations of εO . The slope, however, remains unbiased because E[εO |εS ≥ −β S xSi ]
does not depend on xO .
Now we repeat the same exercise, but without the exclusion restriction, generating yo using
xs instead of xo.
R> yoX <- xs + eps[,2]
R> yo <- yoX*(ys > 0)
R> summary(selection(ys ~ xs, yo ~ xs))
-------------------------------------------Tobit 2 model (sample selection model)
10
Sample Selection Models in R: Package˜sampleSelection
Maximum Likelihood estimation
Newton-Raphson maximisation, 10 iterations
Return code 1: gradient close to zero
Log-Likelihood: -744.6869
500 observations (168 censored and 332 observed)
6 free parameters (df = 494)
Probit selection equation:
Estimate Std. error t value Pr(> t)
(Intercept) -0.1793
0.1093 -1.641
0.101
xs
1.3093
0.2040
6.417 1.39e-10 ***
Outcome equation:
Estimate Std. error t value Pr(> t)
(Intercept)
0.2319
0.1695
1.369 0.171140
xs
0.7881
0.2172
3.629 0.000284 ***
Error terms:
Estimate Std. error t value Pr(> t)
sigma 1.15542
0.07979
14.48 <2e-16 ***
rho
-0.83562
0.07258 -11.51 <2e-16 ***
--Signif. codes: 0 ‘***’ 0.001 ‘**’ 0.01 ‘*’ 0.05 ‘.’ 0.1 ‘ ’ 1
-------------------------------------------The estimates are still unbiased but standard errors are substantially larger in this case.
The exclusion restriction—independent information about the selection process—has a certain identifying power that we now have lost. We are solely relying on the functional form
identification.
We illustrate this case with an analogous figure (Figure˜2). The selection model uncovers the
true dependence very well. The OLS estimate is downward biased because of < 0, as in
the previous case. However, now the slope is upward biased because E[εO |εS ≥ −β S xSi ] is
increasing in the single explanatory variable in the outcome model, xS .
In order to identify β λ and β O without the exclusion restriction, λ(·) must differ from a linear
combination of xO components (see Leung and Yu 1996). The degree of non-linearity in λ(·)
depends on the variability in β S xS as λ(·) is a smooth convex function (see Figure˜4). Hence
the standard errors of the estimates depend on the variation in the latent selection equation
(1), even without the exclusion restriction fulfilled. More variation gives smaller standard
errors2 . We demonstrate this below: Change the support of xS from [0, 1] to [−5, 5]:
R>
xs <- runif(500, -5, 5)
R>
ys <- xs + eps[,1] > 0
R> yoX <- xs + eps[,2]
R>
yo <- yoX*(ys > 0)
R>
summary( selection(ys ~ xs, yo ~ xs))
2
The exact shape of the function λ(·) is dependent on the distribution of the disturbances. However,
E[ε |εS ≥ −β S xS ] → 0 as β S xS → ∞ under a wide set of distribution functions. Hence the estimator is less
dependent on functional form assumptions if the variability in the latent selection equation is larger. This is
related to identification at infinity (Chamberlain 1986).
O
Ott Toomet, Arne Henningsen
11
3
●
●
●
●
●
●
●
●
2
●
●
●
● ●●
1
● ●
yoX
0
●
●
●
−1
●
●
●
●
●
●
●
●●
●
●
●
●
● ●
● ● ●
●
●
●
●
●
●
●
●
●●
●
●
●
●
●●
● ●
●
●
●
●
●
● ●
●
●●
●
●
● ● ●
●
●
●
●
● ●
●
● ●
●●
●
●
● ●
● ●
●
●
●● ●
●
●
●
●
●
●
●
●
●
●
●
●●
●
●
●
●
●
●
● ●
●
●
●
●●
●
●
●
● ●● ●
●
●
●
●
●
● ●
●
●
●
●
●
●
●
●
●
●
●
●
●
●
●
● ● ●
●
●
●
●
●
●●
●
●
● ●
●● ●
●●
●
●
●
●
●
●
●
●
● ●●
●
●
●
●
●
●
● ●
●● ●
●
●
●●
●
●●
●
●
●● ●
●
●
●
●
●
●
●
●
●
●●
●
●●
●
●
●
●
●●
●
●
●
●
●
●
● ● ●●
●
●
●
●
●
●●
●
●
●
●
●
●
●
●
●
●
●●
●
●
●
●●
● ●
● ●
●
●
●
●
● ●
● ●
●
●
●
●
●
●
●
●
●
●
●
●
●
●
●
●
●
●
●
●
●● ●
●
● ●
●
●
●
● ●
● ●
● ● ●●
●
●
●
● ●
● ●
●●
●
●
●
●
●
●
●
●
●
●
●
●
●
●
●
●
●
●● ●
●
●●
●
●
●
●
●
●
●
●
●
●●
●
●
●
●
● ●
● ●
●● ●
●
●
●● ●
●
●
●
●
●
● ●
●
●
●
● ●
●
●
●
●
●
●
●
●
●
●
●
●
●
● ● ●●
●
●
● ● ●
●
●
● ●
●
●
●
●
●
●
●
●
●
●
●●
●
●
● ●
● ●
●
●
●
●
●
● ●
●
●
●
●
●
●
● ●
●
●
●
●
●●
●
●
●
●
●
● ●
●
●
●●
●
●
●●
●
●
●
●
●
●
●
●
●
●
●
−2
●
●
●
●
●
●●
●
●
●
● ●
●
●
●
● ●
●
●
●
●
●
●
●
●
●
●
●
●
−3
●
●
0.0
0.2
0.4
0.6
0.8
1.0
xs
Figure 2: Sample selection example without exclusion restriction (for symbols see Figure˜1).
-------------------------------------------Tobit 2 model (sample selection model)
Maximum Likelihood estimation
Newton-Raphson maximisation, 6 iterations
Return code 1: gradient close to zero
Log-Likelihood: -459.9949
500 observations (239 censored and 261 observed)
6 free parameters (df = 494)
Probit selection equation:
Estimate Std. error t value Pr(> t)
(Intercept) 0.09035
0.10529
0.858
0.391
xs
1.01253
0.09107 11.119 <2e-16 ***
Outcome equation:
Estimate Std. error t value Pr(> t)
(Intercept) 0.01690
0.13621
0.124
0.901
xs
0.98180
0.04381 22.408 <2e-16 ***
Error terms:
Estimate Std. error t value Pr(> t)
sigma 1.06801
0.04977 21.461 <2e-16 ***
rho
-0.77823
0.09052 -8.597 <2e-16 ***
--Signif. codes: 0 ‘***’ 0.001 ‘**’ 0.01 ‘*’ 0.05 ‘.’ 0.1 ‘ ’ 1
-------------------------------------------Now all the parameters are precisely estimated, with even higher precision than in the first
Sample Selection Models in R: Package˜sampleSelection
●●
●
6
12
●
●
●
●●
●
●
●
●●
● ●
●
●
● ●●
●
●●
● ●● ●
●● ● ● ●
●
●
● ●●
●
● ● ●
● ●
● ●
●
●
● ●●
● ●
●●
●
●
●
●● ●
●
●
● ●
●
●
●
●
●
●
●
● ● ●●
●
●
●● ● ●
●
●●
●
●
●
● ●●
●
●
●
●
●
●● ● ●
●
●
●
●
●
●●
● ●
●
●● ●
●
●
●
●
●
●
● ●
●
●
●
●●
●
●
●
●
●
●
●
● ●
●
●
●
●
● ●
●
●●
●
●●
● ●●
●
●
●
●
●
● ●
●●
●
●
●
●
●
● ● ● ●
● ● ● ●
●
●
●
●●
●
●
●
●
●
●● ● ●
●
●
●
●
●
●
●
●
●
●●
●●
●
●
●●
●
●
● ●
●●
●
●
●
●
● ●
●
●●
●
●
●
●
●
●
●
●
●●
●● ●
● ●
●
●
●
●
●
● ●●
● ●
●●
●
●
● ●● ●
● ●
●
● ●
●
●●
● ●
●
● ●
●
●
●
● ● ●
●
● ●
● ●
● ●● ●
●
●
● ●● ●●● ● ● ●
●
●
●
● ●●
● ●
●
●
●
●
●
●
●
●
● ●●
●
●● ● ●
●
●●
●● ●
●
●
●
●
●
●
●
●
●
●●●
● ●
●
●
● ●●
● ●●●
● ● ● ●● ●
●
● ●
●
●
● ●
●
●
●
● ●
●
●
● ●
●
●●
yoX
0
2
4
●
●
●
−2
●
●●●
●
●
●
● ●●
●
●
●
●
●
● ●
● ●
●
●
●
●
●
●●
● ●
●
●
●
● ●
●
●
● ●
●●
● ●
●
●
●
●
●
●
●
● ● ●● ●
● ● ● ●●
●
●
●
●● ●●● ●
●
●
●
● ●● ●
●
●
● ● ●●
●
● ●
●
●
●
●
● ●
●
●●
●●
●●
●
●
●●●
●
● ● ●
●
●● ●
●
●● ● ●
● ●
●
●
●
−6
−4
●
−4
●
●
●
−2
0
xs
2
4
Figure 3: Sample selection example with more variation in xS (for symbols see Figure˜1).
example where the exclusion restriction is fulfilled. The reason is simple: As one can see from
Figure˜3, selection is not an issue if xS > 2 while virtually nothing is observed if xS < −2.
Here λ(β S xS ) differs enough from a linear function.
4.2. Switching regression models
Now let us focus on the Tobit-5 examples. We create the following simple switching regression
problem:
R>
R>
R>
R>
R>
R>
R>
R>
R>
R>
R>
set.seed(0)
vc <- diag(3)
vc[lower.tri(vc)] <- c(0.9, 0.5, 0.1)
vc[upper.tri(vc)] <- vc[lower.tri(vc)]
eps <- rmvnorm(500, c(0,0,0), vc)
xs <- runif(500)
ys <- xs + eps[,1] > 0
xo1 <- runif(500)
yo1 <- xo1 + eps[,2]
xo2 <- runif(500)
yo2 <- xo2 + eps[,3]
We generate 3 disturbance vectors by a 3-dimensional normal distribution using rmvnorm.
We set the correlation between εS and εO1 equal to 0.9 and between εS and εO2 to 0.5. The
third correlation, 0.1, takes care of the positive definiteness of the covariance matrix and
does not affect the results. Further, we create three independent explanatory variables (xs,
xo1 and xo2, uniformly distributed on [0, 1]), and hence the exclusion restriction is fulfilled.
Ott Toomet, Arne Henningsen
13
selection now expects three formulas, one for the selection equation, as before, and a list of
two for the outcome equation. Note that we do not have to equalize the unobserved values
to zero, those are simply ignored. The results look as follows:
R>
summary(selection(ys~xs, list(yo1 ~ xo1, yo2 ~ xo2)))
-------------------------------------------Tobit 5 model (switching regression model)
Maximum Likelihood estimation
Newton-Raphson maximisation, 11 iterations
Return code 1: gradient close to zero
Log-Likelihood: -917.7664
500 observations: 162 selection 1 (FALSE) and 338 selection 2 (TRUE)
10 free parameters (df = 490)
Probit selection equation:
Estimate Std. error t value Pr(> t)
(Intercept) 0.03987
0.09670
0.412
0.68
xs
0.83689
0.15269
5.481 4.23e-08 ***
Outcome equation 1:
Estimate Std. error t value Pr(> t)
(Intercept)
0.1165
0.1933
0.603
0.547
xo1
0.8627
0.1477
5.840 5.21e-09 ***
Outcome equation 2:
Estimate Std. error t value Pr(> t)
(Intercept) 0.04171
0.21933
0.19
0.849
xo2
1.04577
0.18093
5.78 7.48e-09 ***
Error terms:
Estimate Std. error t value Pr(> t)
sigma1 1.00201
0.11252
8.905 <2e-16 ***
sigma2 0.97477
0.05244 18.587 <2e-16 ***
rho1
0.93979
0.04019 23.387 <2e-16 ***
rho2
0.19248
0.38029
0.506
0.613
--Signif. codes: 0 ‘***’ 0.001 ‘**’ 0.01 ‘*’ 0.05 ‘.’ 0.1 ‘ ’ 1
-------------------------------------------We can see that the parameters are fairly well estimated. All the estimates are close to the
true values.
Next, take an example of functional form misspecification. We create the disturbances as
3-variate χ21 random variables (we subtract 1 in order to get the mean zero disturbances),
and generate xs to be in the interval [−1, 0] in order to get an asymmetric distribution over
observed choices:
R>
R>
R>
R>
set.seed(5)
eps <- rmvnorm(1000, rep(0, 3), vc)
eps <- eps^2 - 1
xs <- runif(1000, -1, 0)
14
R>
R>
R>
R>
R>
R>
Sample Selection Models in R: Package˜sampleSelection
ys <- xs + eps[,1] > 0
xo1 <- runif(1000)
yo1 <- xo1 + eps[,2]
xo2 <- runif(1000)
yo2 <- xo2 + eps[,3]
summary(selection(ys~xs, list(yo1 ~ xo1, yo2 ~ xo2), iterlim=20))
-------------------------------------------Tobit 5 model (switching regression model)
Maximum Likelihood estimation
Newton-Raphson maximisation, 17 iterations
Return code 1: gradient close to zero
Log-Likelihood: -1855.251
1000 observations: 762 selection 1 (FALSE) and 238 selection 2 (TRUE)
10 free parameters (df = 990)
Probit selection equation:
Estimate Std. error t value Pr(> t)
(Intercept) -0.49589
0.08741 -5.673 1.4e-08 ***
xs
0.43837
0.15492
2.830 0.00466 **
Outcome equation 1:
Estimate Std. error t value Pr(> t)
(Intercept) -0.46262
0.06242 -7.412 1.25e-13 ***
xo1
1.02529
0.08661 11.838 < 2e-16 ***
Outcome equation 2:
Estimate Std. error t value Pr(> t)
(Intercept)
0.9294
0.7204
1.290 0.19701
xo2
1.4425
0.4574
3.154 0.00161 **
Error terms:
Estimate Std. error t value Pr(> t)
sigma1 0.68491
0.01835 37.329 <2e-16 ***
sigma2 2.18255
0.12784 17.073 <2e-16 ***
rho1
0.11962
0.13523
0.885
0.376
rho2
-0.19528
0.22978 -0.850
0.395
--Signif. codes: 0 ‘***’ 0.001 ‘**’ 0.01 ‘*’ 0.05 ‘.’ 0.1 ‘ ’ 1
-------------------------------------------Although we still have an exclusion restriction, now serious problems appear—most intercepts
are statistically significantly different from the true values zero. This model has serious
convergence problems and often it does not converge at all (this is why we increased the
iterlim and used set.seed(5)).
As the last Tobit example, we repeat the previous exercise without the exclusion restriction,
and a slightly larger variance of xs:
R> set.seed(6)
R> xs <- runif(1000, -1, 1)
R>
ys <- xs + eps[,1] > 0
Ott Toomet, Arne Henningsen
15
R>
yo1 <- xs + eps[,2]
R>
yo2 <- xs + eps[,3]
R> summary(tmp <- selection(ys~xs, list(yo1 ~ xs, yo2 ~ xs), iterlim=20))
-------------------------------------------Tobit 5 model (switching regression model)
Maximum Likelihood estimation
Newton-Raphson maximisation, 17 iterations
Return code 1: gradient close to zero
Log-Likelihood: -1925.452
1000 observations: 638 selection 1 (FALSE) and 362 selection 2 (TRUE)
10 free parameters (df = 990)
Probit selection equation:
Estimate Std. error t value Pr(> t)
(Intercept) -0.38884
0.04269 -9.108 <2e-16 ***
xs
0.84888
0.07598 11.172 <2e-16 ***
Outcome equation 1:
Estimate Std. error t value Pr(> t)
(Intercept) -0.52629
0.06691 -7.865 3.68e-15 ***
xs
0.86920
0.06443 13.491 < 2e-16 ***
Outcome equation 2:
Estimate Std. error t value Pr(> t)
(Intercept)
0.5103
0.4507
1.132
0.258
xs
0.4423
0.2946
1.501
0.133
Error terms:
Estimate Std. error t value Pr(> t)
sigma1 0.616616
0.019019 32.421 <2e-16 ***
sigma2 1.892170
0.070344 26.899 <2e-16 ***
rho1
0.145916
0.167331
0.872
0.383
rho2
-0.006313
0.213519 -0.030
0.976
--Signif. codes: 0 ‘***’ 0.001 ‘**’ 0.01 ‘*’ 0.05 ‘.’ 0.1 ‘ ’ 1
-------------------------------------------In most cases, this model does not converge. However, if it does (like in this case, where we use
set.seed(6)), the results may be seriously biased. Note that the first outcome parameters
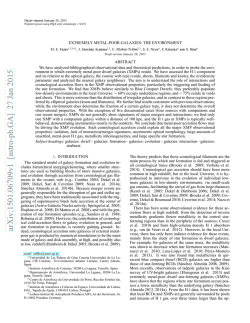
have low standard errors, but a substantial bias. We present the graph of the correct control
function, based on the χ2 distribution, and one where we assume the normal distribution of
the disturbance terms in Figure˜4. We use the estimated parameters for constructing the
latter, however, we scale the normal control functions (inverse Mill’s ratios) to a roughly
similar scale as the correct ones.
One can see that the functions differ substantially in the relevant range of xS ∈ [−1, 1]. In
particular, the true E[εO2 |εS ≥ −β S xS ] decreases substantially faster close to xS = 1 than the
normal approximation while the correct E[εO1 |εS < −β S xS ] is decreasing slower compared
to the approximation.
It is instructive to estimate the same model as two independent OLS equations:
Sample Selection Models in R: Package˜sampleSelection
2
16
1
assumed E[εO2|εS > − βS′xS]
0
correct E[εO2|εS > − βS′xS]
−1
correct E[εO1|εS < − βS′xS]
assumed E[εO1|εS < − βS′xS]
−4
−2
0
xS
2
4
Figure 4: Correct and assumed control functions. Dotted vertical lines denote the support of
xS in the simulation experiment; correct control functions are based on the χ2 (1) distribution;
assumed control functions are based on the normal distribution.
R>
coef(summary(lm(yo1~xs, subset=ys==0)))
Estimate Std. Error
t value
Pr(>|t|)
(Intercept) -0.5796887 0.02541779 -22.80641 1.366462e-84
xs
0.8299731 0.04581920 18.11409 1.898523e-59
R>
coef(summary(lm(yo2~xs, subset=ys==1)))
Estimate Std. Error t value
Pr(>|t|)
(Intercept) 0.4974033 0.1108867 4.485689 9.789056e-06
xs
0.4492282 0.1774365 2.531769 1.177356e-02
One can see that the OLS estimates are very close to the ML ones. This is related to the fact
that none of the s is statistically significantly different from zero.
5. Two replication exercises
In this section we test the reliability of the results from selection by applying the twostep and the ML estimation method re-estimating selected models already published in the
literature.
5.1. Greene (2002): Example 22.8, page 786
Ott Toomet, Arne Henningsen
17
The first test is example 22.8 from Greene (2002, p.˜786). The data set used in this example
is included in sampleSelection; it is called Mroz87. This data set was used by Mroz (1987)
for analysing female labour supply. In this example, labour force participation (described by
dummy lfp) is modelled by a quadratic polynomial in age (age), family income (faminc, in
1975 dollars), presence of children (kids), and education in years (educ). The wage equation includes a quadratic polynomial in experience (exper), education in years (educ), and
residence in a big city (city). First, we have to create a dummy variable for presence of
children.
R> data( "Mroz87" )
R> Mroz87$kids <- ( Mroz87$kids5 + Mroz87$kids618 > 0 )
Now, we estimate the model by the two-step method.
R> greeneTS <- selection( lfp ~ age + I( age^2 ) + faminc + kids + educ,
+
wage ~ exper + I( exper^2 ) + educ + city,
+
data = Mroz87, method = "2step" )
Most results are identical to the values reported by Greene (2002, p.˜786). Only the coefficient
of the inverse Mill’s ratio (β λ = σ), its standard error, and deviate from the published
results, but all differences are less than one percent.3
Finally, we repeat the analysis with the ML estimation method:
R> greeneML <- selection( lfp ~ age + I( age^2 ) + faminc + kids + educ,
+
wage ~ exper + I( exper^2 ) + educ + city, data = Mroz87,
+
maxMethod = "BHHH", iterlim = 500 )
Again, the estimated coefficients and standard errors are almost identical to the values published in Greene (2006). While we can obtain the same coefficients with the Newton-Raphson
(NR) maximisation method, we have to use the Berndt-Hall-Hall-Hausman (BHHH) method
to obtain the published standard errors4 . This is because different ways of calculating the
Hessian matrix may result in substantially different standard errors (Calzolari and Fiorentini
1993). The NR algorithm uses exact analytic Hessian, BHHH uses outer product approximation.
5.2. Cameron and Trivedi (2005): Section 16.6, page 553
The data set used in this example is based on the “RAND Health Insurance Experiment”
(Newhouse 1999). It is included in sampleSelection, where it is called RandHIE. Cameron
and Trivedi (2005, p.˜553) use these data to analyse health expenditures. The endogenous
variable of the outcome equation measures the log of the medical expenses of the individual (lnmeddol) and the endogenous variable of the selection equation indicates whether the
medical expenses are positive (binexp). The regressors are the log of the coinsurance rate
plus 1 (logc = log(coins+1)), a dummy for individual deductible plans (idp), the log of
the participation incentive payment (lpi), an artificial variable (fmde that is 0 if idp = 1 and
3
Note that the standard error of the coefficient of the inverse Mill’s ratio (β λ = σ) is wrong in Greene
(2002, p.˜786) (see Greene 2006).
4
We are grateful to William Greene for pointing this out.
18
Sample Selection Models in R: Package˜sampleSelection
ln(max(1,mde/(0.01*coins))) otherwise (where mde is the maximum expenditure offer),
physical limitations (physlm), the number of chronic diseases (disea), dummy variables for
good (hlthg), fair (hlthf), and poor (hlthp) self-rated health (where the baseline is excellent
self-rated health), the log of family income (linc), the log of family size (lfam), education
of household head in years (educdec), age of the individual in years (xage), a dummy variable for female individuals (female), a dummy variable for individuals younger than 18 years
(child), a dummy variable for female individuals younger than 18 years (fchild), and a
dummy variable for black household heads (black). First, we select the subsample (study
year year equal to 2 and education information present) that is used by Cameron and Trivedi
(2005) and specify the selection as well as the outcome equation.
R>
R>
R>
+
+
R>
+
+
data( "RandHIE" )
subsample <- RandHIE$year == 2 & !is.na( RandHIE$educdec )
selectEq <- binexp ~ logc + idp + lpi + fmde + physlm + disea +
hlthg + hlthf + hlthp + linc + lfam + educdec + xage + female +
child + fchild + black
outcomeEq <- lnmeddol ~ logc + idp + lpi + fmde + physlm + disea +
hlthg + hlthf + hlthp + linc + lfam + educdec + xage + female +
child + fchild + black
Now, we estimate the model by the two-step method (reporting only the coefficients):
R> rhieTS <- selection( selectEq, outcomeEq, data = RandHIE[ subsample, ],
+
method = "2step" )
All coefficients and standard errors are fully identical to the results reported by Cameron and
Trivedi (2005) — even if they are compared with the seven-digit values in their Stata output
that is available on http://cameron.econ.ucdavis.edu/mmabook/mma16p3selection.txt.5
Again, we repeat the analysis with the ML estimation method:
R> rhieML <- selection( selectEq, outcomeEq, data = RandHIE[ subsample, ] )
All coefficients and standard errors of the ML estimation are nearly identical to the values
reported in Table˜16.1 of Cameron and Trivedi (2005) as well as to the seven-digit values in
their Stata output. Only a few coefficients deviate at the seventh decimal place.
6. Robustness issues
6.1. Convergence
The log-likelihood function of the models above is not globally concave. The model may not
converge, or it may converge to a local maximum, if the initial values are not chosen well
enough. This may easily happen as we illustrate below. Recall example 22.8 from Greene
(2002, p.˜786) (section:˜5.1). This model gives reasonable results, but these are sensitive to
the start values. Now we re-estimate the model specifying start values “by hand” (note that
you have to supply a positive initial value for the variance):
5
The coefficient and t-value of idp in column lnmed of Cameron and Trivedi’s Table˜16.1 seem to be wrong,
because they differ from their Stata output as well as from our results.
Ott Toomet, Arne Henningsen
19
R> greeneStart <- selection( lfp ~ age + I( age^2 ) + faminc + kids + educ,
+
wage ~ exper + I( exper^2 ) + educ + city,
+
data = Mroz87, start = c(0, 0, 0, 0, 0, 0, 0, 0, 0, 0, 0, 0.5, 0.9))
R> cat( greeneStart$message )
Last step could not find a value above the current.
Boundary of parameter space?
Consider switching to a more robust optimisation method temporarily.
R> coef( summary( greeneStart ) )[ "rho", ]
Estimate Std. error
0.9999997
Inf
t value
0.0000000
Pr(> t)
1.0000000
The process did not converge. In the current case the problem lies with the numerical problems
at the boundary of the parameter space (note that is close to 1). A workaround is to use a
more robust maximisation method. For instance, one may choose to run the SANN maximizer
for 10 000 iterations, and then use the returned coefficients as start values for the NewtonRaphson algorithm.6
R>
R>
+
+
+
R>
+
+
R>
set.seed(0)
greeneSANN <- selection( lfp ~ age + I( age^2 ) + faminc + kids + educ,
wage ~ exper + I( exper^2 ) + educ + city,
data = Mroz87, start = c(0, 0, 0, 0, 0, 0, 0, 0, 0, 0, 0, 0.5, 0.9),
maxMethod="SANN", parscale = 0.001 )
greeneStartSANN <- selection( lfp ~ age + I( age^2 ) + faminc + kids + educ,
wage ~ exper + I( exper^2 ) + educ + city,
data = Mroz87, start = coef( greeneSANN ) )
cat( greeneStartSANN$message )
successive function values within tolerance limit
The new Newton-Raphson estimate converged to another maximum with a log-likehood value
even higher than the one of the original estimate published in Greene (2002, p.˜786) (see
Section˜5.1):
R> logLik( greeneML )
[1] -1581.258
R> logLik( greeneStartSANN )
[1] -1479.654
6
One has to choose a suitable value for parscale; parscale=0.001 worked well for this example.
20
Sample Selection Models in R: Package˜sampleSelection
However, in most cases the 2-step method does a good job in calculating initial values.
6.2. Boundary of the parameter space
In general, one should prefer method="ml" instead of "2step". However, ML estimators may
have problems at the boundary of the parameter space. Take the textbook Tobit example:
yi∗ = β xi + εi ;
yi =
yi∗
0
if yi∗ > 0
otherwise.
(23)
This model can be written as a Tobit-2 model where the error term of the selection and
outcome equation are perfectly correlated. In this case the ML estimator may not converge:
R>
R>
R>
R>
R>
R>
set.seed(0)
x <- runif(1000)
y <- x + rnorm(1000)
ys <- y > 0
tobitML <- selection(ys~x, y~x)
cat( tobitML$message )
Last step could not find a value above the current.
Boundary of parameter space?
Consider switching to a more robust optimisation method temporarily.
R> coef( summary( tobitML ) )[ "rho", ]
Estimate
Std. error
t value
Pr(> t)
1.000000e+00 1.088594e-04 9.186161e+03 0.000000e+00
The reason, as in the previous example, is that = 1 lies at the boundary of the parameter
space. However, the 2-step method still works, although standard errors are large and ρ ∈
/
[−1, 1]:
R> tobitTS <- selection(ys~x, y~x, method="2step")
R> coef( summary( tobitTS ) )[ "rho", ]
Estimate Std. Error
1.150939
NA
t value
NA
Pr(>|t|)
NA
7. Conclusions
This paper describes Heckman-type selection models and their implementation in the package
sampleSelection for the programming language R. These models are popular in estimating
impacts of various factors in economics and other social sciences. We argue that they also
serve as useful teaching tools because they are easy to implement and understand.
Ott Toomet, Arne Henningsen
21
We describe the implementation and usage of standard sample selection (Tobit-2) and switching regression (Tobit-5) models in sampleSelection, and possible generalisations of our selection
function. We demonstrate the usage of the package using a number of simulated and real data
examples. The examples illustrate several important issues related to exclusion restrictions,
identification at infinity, and functional form specification. Our implementation works well
for correctly specified cases with the exclusion restriction fulfilled. The problems appearing
in the case of misspecification or weak identification are related to the model itself. In these
problematic cases, the user may gain from a more robust maximisation algorithm. In some
cases, the two-step estimator is preferable.
Acknowledgments
The authors thank Roger Koenker, Achim Zeileis, and two anonymous referees for helpful
comments and suggestions. Ott Toomet is grateful to the project TMJRI 0525 2003-2007 of
the Estonian Ministry of Education and Science.
References
Amemiya T (1984). “Tobit Models: A Survey.” Journal of Econometrics, 24, 3–61.
Amemiya T (1985). Advanced Econometrics. Harvard University Press, Cambridge, Massachusetts.
B´elisle CJP (1992). “Convergence Theorems for a Class of Simulated Annealing Algorithms
on Rd .” Journal of Applied Probability, 29, 885–895.
Berndt EK, Hall BH, Hall RE, Hausman JA (1974). “Estimation and Inference in Nonlinear
Structural Models.” Annals of Economic and Social Measurement, 3(4), 653–665.
Calzolari G, Fiorentini G (1993). “Alternative Covariance Estimators of the Standard Tobit
Model.” Economics Letters, 42(1), 5–13.
Cameron AC, Trivedi PK (2005). Microeconometrics: Methods and Applications. Cambridge
University Press, New York.
Chamberlain G (1986). “Asymptotic Efficiency in Semi-Parametric Models with Censoring.”
Journal of Econometrics, 32, 189–218.
Genz A, Bretz F, Hothorn T (2005). mvtnorm: Multivariate Normal and t Distribution.
R˜package version˜0.7-6, URL http://CRAN.R-project.org/package=mvtnorm.
Greene WH (1981). “Sample Selection Bias as a Specification Error: A Comment.” Econometrica, 49(3), 795–798.
Greene WH (2002). Econometric Analysis. 5th edition. Prentice Hall. ISBN 0130661899.
Greene WH (2006). “Errata and Discussion of Econometric Analysis, 5th edition.” http:
//pages.stern.nyu.edu/~wgreene/Text/Errata/ERRATA5.htm.
22
Sample Selection Models in R: Package˜sampleSelection
Greene WH (2007). Limdep˜9.0 Econometric Modeling Guide, Volume 1. Econometric
Software, Inc., Plainview, NY. URL http://www.Limdep.com/.
Heckman JJ (1976). “The Common Structure of Statistical Models of Truncation, Sample
Selection and Limited Dependent Variables and a Simple Estimator for Such Models.”
Annals of Economic and Social Measurement, 5(4), 475–492.
Heckman JJ (1979). “Sample Selection Bias as a Specification Error.” Econometrica, 47(1),
153–161.
Heckman JJ, MaCurdy TE (1986). “Labor Econometrics.” In Z˜Griliches, MD˜Intriligator
(eds.), Handbook of Econometrics, volume˜3, chapter˜32, pp. 1917–1977. Elsevier, Amsterdam.
Henningsen A, Hamann JD (2007a). “systemfit: A Package for Estimating Systems of Simultaneous Equations in R.” Journal of Statistical Software, 23(4), 1–40. URL http:
//www.jstatsoft.org/v23/i04/.
Henningsen A, Hamann JD (2007b). systemfit: Simultaneous Equation Estimation.
R˜package version˜1.0, URL http://CRAN.R-project.org/package=systemfit.
Johnston J, DiNardo J (1997). Econometric Methods. 4th edition. McGraw-Hill.
Leung SF, Yu S (1996). “On the Choice Between Sample Selection and Two-Part Models.”
Journal of Econometrics, 72, 197–229.
Li Q, Racine JS (2007). Nonparametric Econometrics: Theory and Practice. Princeton
University Press, Princeton.
Mroz TA (1987). “The Sensitivity of an Empirical Model of Married Women’s Hours to Work
to Economic and Statistical Assumptions.” Econometrica, 55(4), 765–799.
Newhouse JP (1999). “RAND Health Insurance Experiment [in Metropolitan and NonMetropolitan Areas of the United States], 1974–1982.” Aggregated Claims Series, Volume 1:
Codebook for Fee-for-Service Annual Expenditures and Visit Counts ICPSR 6439, ICPSR
Inter-university Consortium for Political and Social Research.
Pagan A, Ullah A (1999). Nonparametric Econometrics. Themes in Modern Econometrics.
Cambridge University Press, Cambridge.
Powell JL (1994). “Estimation of Semiparametric Models.” In RF˜Engle, DL˜McFadden
(eds.), Handbook of Econometrics, volume˜4, chapter˜41, pp. 2443–2521. Elsevier.
R Development Core Team (2008). R: A Language and Environment for Statistical Computing.
R Foundation for Statistical Computing, Vienna, Austria. ISBN 3-900051-07-0, URL http:
//www.R-project.org/.
StataCorp (2007). Stata Statistical Software: Release˜10. StataCorp LP, College Station,
Texas. URL http://www.Stata.com/.
Toomet O, Henningsen A (2008a). maxLik: Maximum Likelihood Estimation. R˜package
version˜0.5, URL http://CRAN.R-project.org/package=maxLik.
Ott Toomet, Arne Henningsen
23
Toomet O, Henningsen A (2008b). “Sample Selection Models in R: Package sampleSelection.”
Journal of Statistical Software, 27(7). URL http://www.jstatsoft.org/v27/i07/.
Verbeek M (2000). A Guide to Modern Econometrics. John Wiley & Sons, Hoboken, NJ.
Wooldridge JM (2003). Introductory Econometrics. A Modern Approach. 2nd edition. Thomson South-Western.
Affiliation:
Ott Toomet
Department of Economics
Tartu University
Narva 4-A123
Tartu 51009, Estonia
Telephone: +372/737.6348
E-mail: [email protected]
URL: http://www.obs.ee/~siim/
Arne Henningsen
Institute of Food and Resource Economics
University of Copenhagen
Rolighedsvej 25
1958 Frederiksberg C, Denmark
E-mail: [email protected]
URL: http://www.arne-henningsen.name/


© Copyright 2026