
Micro-Raman and Micro-FTIR Spectroscopy of Experimentally
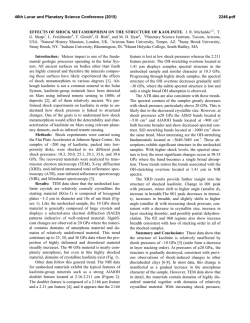
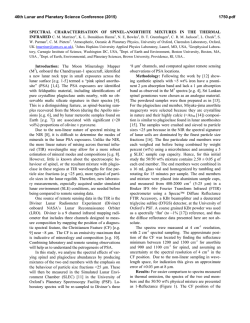
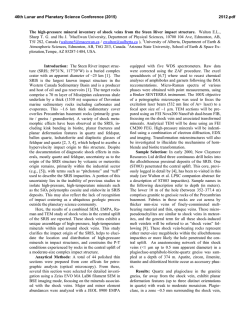
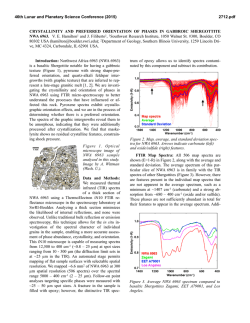
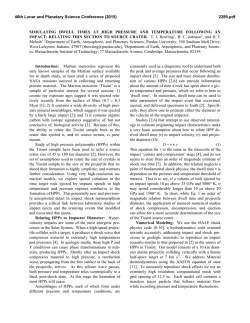
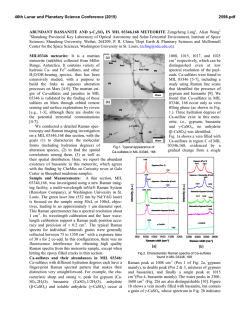
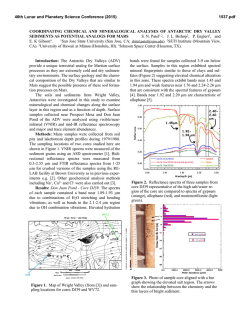
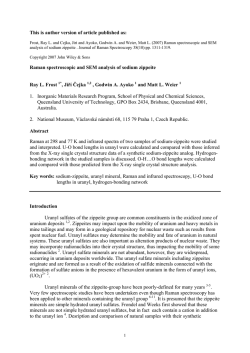
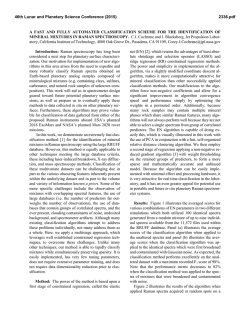
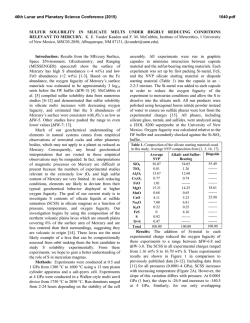
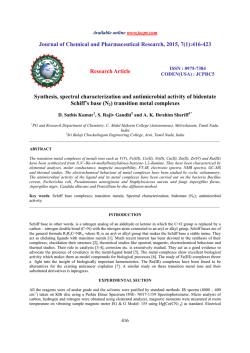
46th Lunar and Planetary Science Conference (2015) 2056.pdf MICRO-RAMAN AND MICRO-FTIR SPECTROSCOPY OF EXPERIMENTALLY SHOCKED ANDESINE. S. J. Jaret1, T. D. Glotch1, and J. R. Johnson2,1Department of Geosciences, Stony Brook University 255 ESS Building, Stony Brook, NY 11794-2100, 2Applied Physics Laboratory, Johns Hopkins University. [email protected] Introduction: As part of an ongoing study to characterize shock deformation effects in plagioclase, we conducted optical petrography, micro-Raman and micro-FTIR spectroscopy on experimentally shocked andesine that were previously studied with thermal infrared spectroscopy [1]. Analyzing the same samples with multiple techniques will enhance our ability to sense shock deformation, particularly given recent results [2], which suggest the apparent level of deformation in a sample may be technique dependent. Samples: We analyzed 15 samples of andesine experimentally shocked to 15.8, 24.9, 26.4, 28.4, 29.4, 29.6, 30.6, 33.8, 34.5, 35.3, 37.6, 47.5, 50.0, 53.0, and 56.5 GPa, as well as one unshocked sample [1]. The shock experiments were conducted on discs of cored section from an andesine anorthosite, with multiple grains at random orientations to the shock wave. Methods: We conducted optical petrography on doubly polished thin sections taken from the experimentally shocked chips using a standard Olympus petrographic microscope. The same thin sections were used for micro-FTIR and micro-Raman analyses. We collected micro-Raman spectra using a WiTec alpha300R confocal imaging system equipped with 532 nm Nd YAG laser with 50 mW nominal power at the sample surface, and a 50X objective (spot size of 763 nm). Each analysis consisted of 240 0.7-second exposures. We used the WiTec Control4 software for background subtraction and removal of cosmic rays. The same background removal technique was applied to all spectra. We collected micro-FTIR spectra using a Nicolet iN10MX FTIR microscope, equipped with a liquid nitrogen-cooled MCT array detector capable of acquiring images between 715 and 7000 cm-1, with a spatial resolution of 25 m/pixel. Optical Petrography: Samples can be grouped into three petrographic types. Samples in the first group (0 – 34.5 GPa) do not show any traditional petrographic shock effects in either plane- or cross-polarized light (e.g., no planar deformation features (PDFs). In crosspolarized light, these samples show typical birefringence of andesine. Group 2 samples (35.3 – 47.5 GPa) show no effects of shock in plane-polarized light. In cross-polarized light, however, weak decreases in birefringence are common, and some grains show partial isotropization. These samples are somewhat heterogeneous and decreases in birefringence are not uniform throughout the thin section. Group 3 samples (50.0 – 56.5 GPa) show no shock effects in plane-polarized light, but are mostly isotropic in cross-polarized light, with minor heterogeneity along the edge of the section. Micro-Raman Spectroscopy: Unshocked andesine exhibits cation lattice modes at 284 and 407 cm-1, and T-O-T stretching modes at 479 and 507 cm-1 [3]. With the exception of the 30.6 GPa sample micro-Raman spectroscopy shows a progression of degradation of the Raman spectra with increased shock (Figure 1). (As described by [1], the 30.6 GPa sample was anomalous.) At low-shock (below 26.4 GPa) this manifests itself as a decrease in intensity and eventually loss of a characteristic peak at 479 cm-1. With increasing shock pressure, the overall intensity of all peaks decreases, and therefore we compared intensity ratios of peaks at 479 and 507 cm-1 which changes from 0.36 in unshocked to 0.61 by 28.4 GPa (Figure 2). Samples > 28.4 GPa have higher 479:507 ratios, but also show the emergence of a broad peak near 850 cm-1, reflecting a new T-T stretch [3]. Above 29.4 GPa, Raman spectra are nearly identical, marked by very low signal-to-noise ratios with only two broad T-O-T stretching modes centered near 492 and 583 cm-1, and a T-T stretching mode centered near 1000 cm-1 [3]. Micro-FTIR Spectroscopy: The micro-FTIR spectra show a decrease in intensity and ultimate loss of a characteristic peak near 1150 cm-1 at higher pressures (Figure 1) and a decrease in differences due to orientation [4]. Unshocked andesine shows two peaks reflecting asymmetric stretching modes at 1150, and 1000 cm1 [5], both of which can vary in position by up to 100 cm-1. By 26.4 GPa, the 1150 cm-1 peak has decreased in intensity (and in some orientations is even lost), and the positional shift is decreased. Additionally, the variation in position of the 1000 cm-1 peak has also decreased. At 29.5 GPa, the 1150 cm-1 peak is almost entirely lost (only visible in one orientation) and variation in position of the 1000 cm-1 peak is under 50 cm-1. At 35.3 GPa and above, no 1150 cm-1 peak remains, and there is minor (less than 5 cm-1) variation in the position of the 1000 cm-1 peak (Figure 4). There is variation in peak intensity, but this reflects differences in polishing of the sample. Discussion and Conculsions: Interestingly, microRaman, micro-FTIR, and optical petrography provide slightly different views of shock in andesine. Micro-Raman spectroscopy appears to be more sensitive to low- 46th Lunar and Planetary Science Conference (2015) 2056.pdf shock regimes than either optical petrography or microFTIR spectroscopy. Between 15.8 and 28.4 GPa, there is a steady and systematic decrease in intensity ratios of the 479:507 peak (Figure 2). Above 29.4 GPa, however, mirco-Raman is not capable of detecting differences in level of deformation. the micro-FTIR and micro-Raman spectra. It is surprising that we do not see PDFs in these samples, since PDFs are common in quartz at shock pressures below 25 GPa, and are commonly reported in natural and experimentally shocked feldspars [6]. However, majority of PDFs in feldspars are in alkali feldspar. PDFs are exceedingly rare in lunar and terrestrial plagioclase. As hypothesized by [7], there may be compositional dependency on PDF formation in feldspars. We will continue to investigate this during our similar studies of experimentally shocked albite and bytownite [8-10]. Figure 1: Micro-Raman spectra showing a progression of degradation with increased shock. The interpretation of micro-FTIR spectra is somewhat complicated by changes in peak position due to Figure 3: Micro-FTIR spectra showing a progression of spectral degradation. Because of dependency on orientation, multiple measurements across the section were taken in order to capture the multiple orientations of andesine grains. Figure 2: Intensity ratios of the 479 and 507 cm-1 peaks. orientation. Because of this, multiple analyses taken from multiple orientations are necessary. Micro-FTIR spectroscopy appears most informative at pressures between 26.4 and 35.3 GPa, where systematic decreases in intensity of the 1150 cm-1 peak are observed, as well as decreases in variation of the position of the higher wavenumber peak. Below this pressure, major orientation effects still exist making it difficult to attribute spectral differences to shock. Above this pressure, spectra are not distinguishable in this work, which is contrary to emissivity spectra from [1] and requires further study. None of the samples show traditional petrographic indicators of shock (e.g., PDFs), despite both changes to Figure 4: Band depth of the 1007 cm-1 peak as a function of pressure. Above 35 GPa, band depth stabilizes. References: [1] Johnson, 2012. Icarus, 221 359–364. [2] Friedlander et al., 2014. JGR, submitted. [3] Sharma et al., 1983. Am. Min. 68, 1113-1125. [4] Jaret et al., 2014. JGR submitted. [5] Iiishi et al., Neues Jahrbuch fuer Mineralogie. Abhandlungen, 115:98-119 [6] French and Koeberl, 2010. Earth Sci. Rev. 98, 123-170. [7] Pickersgill, A.E. 2014. Masters Thesis, Univ. Western Ontario; [8] Johnson et al., JGR, 107(E10), 2001JE001517, 2002; [9] Johnson at al., 2003. Amer. Min., 88, 1575-1582 [10] Johnson, et al. 2007, Amer. Min., 92, 1148-1157, 2007.

© Copyright 2026