
Full PDF
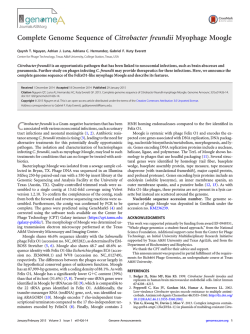
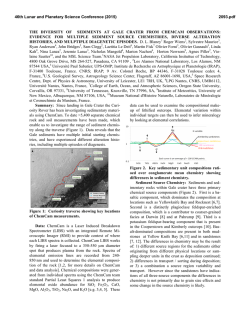
Evolutionary biology
rsbl.royalsocietypublishing.org
Developmental mode influences
diversification in ascidians
Max E. Maliska1,2,3, Matthew W. Pennell3,4,5 and Billie J. Swalla1,2,3
1
Department of Biology, University of Washington, 24 Kincaid Hall, Seattle, WA 98195, USA
Friday Harbor Laboratories, 620 University Road, Friday Harbor, WA 98250, USA
3
BEACON Center for Evolution in Action, Michigan State University, 1441 Biomedical and Physical Sciences
Building, East Lansing, MI 48824, USA
4
Institute for Bioinformatics and Computational Biology (IBEST), University of Idaho, 441B Life Science South,
Moscow, ID 83844, USA
5
National Evolutionary Synthesis Center, 2024 W. Main Street, Durham, NC 27705, USA
2
Research
Cite this article: Maliska ME, Pennell MW,
Swalla BJ. 2013 Developmental mode influences diversification in ascidians. Biol Lett 9:
20130068.
http://dx.doi.org/10.1098/rsbl.2013.0068
Received: 23 January 2013
Accepted: 13 March 2013
Subject Areas:
developmental biology, evolution,
taxonomy and systematics
Keywords:
speciation, marine invertebrates, binary-state
speciation and extinction, larval development
Author for correspondence:
Max E. Maliska
e-mail: [email protected]
Electronic supplementary material is available
at http://dx.doi.org/10.1098/rsbl.2013.0068 or
via http://rsbl.royalsocietypublishing.org.
Ascidian species (Tunicata: Ascidiacea) usually have tailed, hatching tadpole
larvae. In several lineages, species have evolved larvae that completely lack
any tail tissues and are unable to disperse actively. Some tailless species
hatch, but some do not hatch before going through metamorphosis. We
show here that ascidian species with the highest speciation rates are those
with the largest range sizes and tailed hatching larval development. We
use methods for examining diversification in binary characters across a posterior
distribution of trees, and show that mode of larval development predicts
geographical range sizes. Conversely, we find that species with the least dispersive larval development (tailless, non-hatching) have the lowest speciation rates
and smallest geographical ranges. Our speciation rate results are contrary to
findings from sea urchins and snails examined in the fossil record, and further
work is necessary to reconcile these disparate results.
1. Introduction
Marine species have evolved modes of larval development that differ in
dispersal potential. Thorson asserted that the primary advantage of swimming
larvae for sessile or sedentary marine invertebrates is increased dispersal
capabilities [1]. However, an alternative hypothesis suggests that planktonic
larval development may have evolved in some lineages as an adaptation for
escaping from benthic predators [2]. Nevertheless, studies of sister species in
divergent metazoan phyla have shown that greater dispersal potential in feeding larvae often positively correlates with higher rates of gene flow between
populations [3].
Studies explicitly examining the relationship between larval development
and geographical range in extant marine metazoan species have found a positive correlation between larval dispersal potential and geographical range [4,5].
Marine invertebrates species with higher dispersal potential positively correlate
with longer species durations and larger geographical ranges [6–9]. Fossil
snails and urchins with the derived non-planktonic or less dispersive larval
phase show higher speciation rates than planktonic species [6– 10]. In fossil
studies, examining the evolution of larval development has often not been
done in a phylogenetic framework [6–8], which may overestimate trait effects.
Most of the 3000 described ascidians (Tunicata: Ascidiacea) develop as nonfeeding tadpole larvae that swim for a short period (hours to days), then settle
and metamorphose into sessile, filter-feeding adults [11]. The Styelidae and
Molgulidae show at least five independent origins of tailless larval development [12]. Some tailless species develop indirectly by hatching from the
chorion before metamorphosis, and some hatch from the chorion only during
metamorphosis (see the electronic supplementary material, tables S1 and S2).
& 2013 The Author(s) Published by the Royal Society. All rights reserved.
Trees were generated from 1840 bp of 18S rDNA for 45
ingroup taxa of Styelidae and Molgulidae from Genbank and
from the phlebobranch outgroup, Ciona intestinalis. Sequences
were aligned using MAFFT v. 6 [16]. We used a GTR þ G þ I
substitution model selected using the Akaike Information Criterion (AIC; [17]) in MRMODELTEST v. 2.3 [18]. Because ascidians
have a scanty fossil record [19], we used an uncorrelated,
relaxed-clock phylogenetic estimation in BEAST [20] for 100
million generations.
Data on tailed and tailless larval development, and hatching
and non-hatching tailless larvae (see the electronic supplementary material, tables S1 and S2) were used to examine how
these categorical traits influence speciation rates using a binarystate speciation and extinction (BiSSE) and multi-state speciation
and extinction model (MuSSE) [13,14] in the R package diversitree [15]. The BiSSE framework compared models where
diversification differed between tailed and tailless larval development, hatching and non-hatching as well as the combination
of these characters in the MuSSE framework.
AIC [17] was used to test between different models on the
consensus tree in BEAST and 100 posterior trees. We compared
only speciation rates in the BiSSE and MuSSE analyses because
simulation studies have shown extinction rates are difficult to
estimate assuming a birth – death model of speciation, and extinction as in BiSSE and MuSSE [21]. The ‘skeletal trees’ incomplete
sampling method was used to account for the missing taxa in our
tree when estimating rates using BiSSE and MuSSE [14]. Extinction rates were set to be the same rates, given the potential for
mis-estimation and parameter correlation. However, it is possible
that if extinction rates were widely divergent between species
with different larvae, then our model would not be an adequate
description of the process, and our inferences may be misled.
While we acknowledge this possibility, given how notoriously
unreliable estimates of extinction rates are [21], and that estimates
derived from molecular phylogenies tend to be very low (often
close to 0), we do not think this is a likely scenario.
Geographical range sizes were estimated using current species
distribution records (see the electronic supplementary material for
more information). In brief, we estimated range sizes by removing
outlier points, then used a longest straight line distance (rhumbline) or ellipsoidal area. We then tested to see if either binary or
additively larval traits were a predictor of geographical range
size using Bayesian phylogenetic mixed models in the R package
MCMCglmm [22]. The posterior probability of different models
were estimated using a MCMC approach, running the chains for
10 million iterations with a one million iteration burn-in.
3. Results
All 100 trees show higher speciation rates in tailed species
compared with tailless species (figure 1a), and 99/100 trees
show higher speciation rates in hatching species compared
with non-hatching species (figure 1b).
4. Discussion
Our results demonstrate that species with tailed, hatching
larval development have higher speciation rates than ascidian
species with tailless hatching, and tailless non-hatching larval
development (figure 1), based on the available phylogeny
(figure 2). Data for 45 of an estimated 762 described species
in the Molgulidae and Styelidae were used, but we did use
an incomplete sampling method to take this missing data
into account [14]. Nevertheless, the small sample of species
could bias our results. We also have to be cautious that the
phylogeny used for this study may not be the true species
tree owing to the coalescent process [23]. However, most
clades are reflective of taxonomic and morphological relationships [24], and are in agreement with a phylogeny we
inferred on a subset of taxa at 18S and 28S rRNA genes.
We accounted for low support for species relationships in
our phylogeny by comparing BiSSE and MuSSE analyses
across 100 posterior trees.
A simulation study examining the ability to detect
differences in rates of speciation, extinction and character
transitions found there to be a decrease in the ability to
detect the true simulated differences using BiSSE when phylogenies were moderately sized [25]. However, low power
should tend to reduce our ability to detect differences
between parameters, rather than exacerbate them. We have
found that when we simulate trees with a 2.5 times difference
2
Biol Lett 9: 20130068
2. Material and methods
We tested to see if a combination of our two sets of binary
larval traits (tailed and taillessness, hatching and non-hatching) is better for assessing speciation rates using a recently
developed test [15]. All 100 trees show a better AIC fit for a
model where speciation is estimated as a combination of
these binary traits (table 1). 94/100 trees and 100/100 trees
show higher speciation rate estimates in the interaction
model when compared with speciation rate estimates for
tailed and tailless alone, or for hatching and non-hatching
alone, respectively. 100/100 posterior trees show the highest
speciation rates in tailed hatching species when compared
with tailless hatching and tailless non-hatching species.
Tailless hatching species show higher speciation rates when
compared with tailless non-hatching species in 65/100
posterior trees.
Mean rhumbline range sizes for all tailed, hatching species
used in the study were 2425+ a standard error (s.e.) of
1201 km. Range sizes were 2164+ s.e. of 1038 km, and 201.4 +
239.9 km for tailless, hatching, and tailless, non-hatching species,
respectively (see the electronic supplementary material). For
rhumbline range sizes (see the electronic supplementary
material, figure S2), we found species with hatching larval
development to have larger range sizes than species with nonhatching larval development (b ¼ 2.51 + s.e. 2.12; p ¼ 0.0212).
We found similar results for total range sizes comparing species
with hatching and non-hatching larvae (b ¼ 5.066 + 2.56;
p , 0.001). We found mean range sizes for species with
tailed hatching larval development to be the largest, mean
range sizes for species with tailless hatching larval development
to be intermediate and mean range sizes for species with
tailless non-hatching larval development to be the smallest
(b ¼ 4.80 + 3.41; p ¼ 0.0067). Results were consistent with analyses on ellipsoid ranges (see the electronic supplementary
material for more details).
rsbl.royalsocietypublishing.org
Likelihood models have been developed recently for
examining how discrete characters influence diversification
rates inferred from incompletely sampled phylogenies
[13 –15]. Using a phylogeny of 45 ascidian species in the
Molgulidae and Styelidae, and current distribution records
of these species to estimate geographical range sizes, we
find that species with less dispersive larval development
(tailless non-hatching species) have lower speciation rates
and smaller geographical ranges.
(a)
(b)
(c)
3
rsbl.royalsocietypublishing.org
30
40
20
25
15
20
Biol Lett 9: 20130068
posterior probability density
30
15
20
10
10
10
5
5
0
0
0
50
100 150
speciation rate
0
0
100 200 300
speciation rate
0
50 100 150 200
speciation rate
Figure 1. Speciation rates (in speciation events per substitution per site) for different larval character states using BiSSE and MuSSE. (a) Speciation rates from BiSSE
analyses of tailed and tailless species; (b) speciation rates from BiSSE analyses of hatching and non-hatching species; (c) MuSSE model for species with tailed
hatching, tailless hatching and tailless non-hatching larval development. The line below each speciation rate distribution is the 95% credible interval. Species
with tailed larvae have a tail and eyespot, tailless species that hatch have a dotted circle and tailless species that do not hatch have a solid circle.
Table 1. Model comparison using AIC for BiSSE and MuSSE analyses. The best-fit model from the BEAST consensus tree is in italic, and the numbers of 100
posterior trees that agree with the best-fit model from the consensus tree are given. Td, tailed; Tl, tailless; H, hatching; NH, non-hatching; SI, state independent;
SD, state dependent; q, transition.
BiSSE Td versus Tl
BiSSE H versus NH
MuSSE Td 1 H versus Tl 1 H
versus Tl 1 NH
MuSSE interaction
model
AIC
model
AIC
model
AIC
model
AIC
SD
SD-qTl-Td
2212.08
2209.38
SD
SD-qNH-H
2223.82
2226.12
SI
SD
2174.58
2145.94
SD
SD-q21
2183.72
2186.84
SD-qH-NH
2225.58
interaction
2191.26
SD-q31
SD-q32
2188.30
2184.95
SD-q21, q31
2190.43
SD-q21, q32
no. 100 trees
2192.38
54/100
no. 100 trees
agree
80/100
no. 100 trees
61/100
agree
in speciation rates between the ancestral and the derived
state, the power to detect different rates decreases in trees
of 23 species (77/100 trees). However, our tree size of 45 tips
is enough to detect similar results in large trees (95/100 trees
with 45 tips show higher speciation rates in the ancestral
no. 100 trees
agree
100/100
agree
character compared to 98/100 trees with 450 tips; see
electronic supplementary materials for more details).
We believe that tailed, hatching species cannot evolve
from a tailless ancestor because there is molecular evidence
to show that pseudogenes are formed in proteins critical for
1
Biol Lett 9: 20130068
1
rsbl.royalsocietypublishing.org
1
4
Molgula citrina
1 0.95 Molgula occulta
Molgula bleizi
0.92 Molgula pugetiensis
0.66 Molgula pacifica
1 Molgula oculata
Molgula occidentalis
0.97
Eugyra arenosa
1
Bostrichobranchus digonas
0.83
Molgula tectiformis
1
Molgula complanata
0.79
Molgula socialis
Molgula retortiformis
1
1 Molgula manhattensis
0.92 Molgula arenata
1 Molgula provisionalis
Botryllus schlosseri BS8 A
1
Botryllus schlosseri BS19 E
1
Botryllus schlosseri BS31 D
Polyandrocarpa zorritensis
1
Cnemidocarpa humilis
0.8
Pelonaia corrugata
1
Styela plicata
1
Styela montereyensis
0.99 Styela gibbsii
Symplegma rubra
0.46 Symplegma reptans
1
1 Symplegma viride
0.64
Botryllus primigenus
0.71 Botrylloides leachi
1 Botrylloides diegensis
0.45 Botryllus planus
0.97Botrylloides violaceus
0.29
Polyandrocarpa tincta
0.39 Polyzoa opuntia
0.96 Metandrocarpa taylori
0.7
Distomus variolosus
1
0.31
Stolonica socialis
Cnemidocarpa finmarkiensis
0.65 Polycarpa papillata
0.38 Polycarpa mytiligera
1 Polycarpa aurata
0.75 Polycarpa pomaria
0.99 Dendrodoa grossularia
1 Dendrodoa aggregata
0
2000 4000 6000 8000 10 000 12 000
rhumbline ranges (km)
Figure 2. Ultrametric phylogeny of molgulid and styelid ascidians from a consensus BEAST tree. The lower axis bar graph shows range size for each species in km.
Species with tailed larvae have a tail and eyespot, tailless species that hatch have a dotted circle and tailless species that do not hatch have a solid circle.
swimming in multiple tailless species [26]. It is still unclear,
however, why these derived modes of larval development
have evolved multiple times (figure 2). Species selection
may be acting to maintain tailed, hatching larval development in molgulid and styelid ascidians; this argument was
made to explain higher diversification rates in plant species with ancestral self-incompatibile reproduction than in
species with derived self-compatible reproduction [27].
Our results showing lower speciation rates in the derived
tailless and non-hatching species, which also have significantly
smaller geographical ranges, is contrary to the findings of
snails and urchins in the fossil record where derived species
with smaller geographical ranges have higher speciation rates
[6–9]. These contrary results may also be due to unforeseen
issues with comparing speciation rates estimated from fossil
data and molecular phylogenies. It is also possible that these
different results could be due to comparing speciation
rates for groups with alternative larval development that
are fundamentally different. The transition from feeding to
non-feeding larval development in fossil snails and sea
urchins may fundamentally affect dispersal and diversification dynamics in different ways than do the loss of the tail
and hatching in ascidians.
While these transitions to a less dispersive larval mode
decrease range sizes in all of the groups compared, range
size may not predict speciation dynamics entirely. The
findings of lower speciation rates in derived tailless and
non-hatching styelid and molgulid ascidian species could
also be influenced by the population dynamics of these
species with alternative modes of larval development. Some
simulation studies support lower speciation rates in species
with ecological and geographically patchy distributions
[28,29]. Species with non-hatching tailless larval development
typically have patchy distributions and are found in very
specific locations. For example, Molgula pacifica is found in
high wave action ‘blow holes’ [30].
Stanley’s work on burrowing bivalves predicted a lognormal relationship between mean population size and
speciation rate [31]. This curve would predict small population
sizes at very low speciation rates, and we suggest that this may
apply for tailless non-hatching molgulids [31]. This rationale
was used to describe species with small average population
sizes that are going through a higher rate of extinction than
speciation, so ‘many entire species are dying out, then few
small populations representing incipient species will be able
to blossom into full-fledged species’ [32]. While we are
unable to reliably estimate extinction rates using our methods
[21], more work will be needed to understand the population
dynamics of species with different modes of development in
ascidians and other marine invertebrates.
We thank the FHL reading group and Richard Strathmann for
thoughtful comments on the manuscript, and also thank Luke
Harmon and Rich FitzJohn for advice on the Diversitree analyses.
M.E.M. was supported by PHS NRSA T32 GM007270 from
NIGMS. This material is based in part upon work supported by
the National Science Foundation under Cooperative Agreement no.
DBI-0939454.
References
12. Huber JL, da Silva KB, Bates WR, Swalla BJ. 2000
The evolution of anural larvae in molgulid ascidians.
Semin. Cell Dev. Biol. 11, 419 –426. (doi:10.1006/
scdb.2000.0195)
13. Maddison WP, Midford PE, Otto SP. 2007 Estimating
a binary character’s effect on speciation and
extinction. Syst. Biol. 56, 701–710. (doi:10.1080/
10635150701607033)
14. FitzJohn RG, Maddison WP, Otto SP. 2009
Estimating trait-dependent speciation and extinction
rates from incompletely resolved phylogenies. Syst.
Biol. 58, 595 –611. (doi:10.1093/sysbio/syp067)
15. FitzJohn RG. 2012 Diversitree: comparative
phylogenetic analyses of diversification in R.
Methods Ecol. Evol. 3, 1084–1092. (doi:10.1111/j.
2041-210X.2012.00234.x)
16. Katoh K, Toh H. 2008 Recent developments in the
MAFFT multiple sequence alignment program. Brief.
Bioinform. 9, 286–298. (doi:10.1093/bib/bbn013)
17. Akaike H. 1974 A new look at the statistical model
identification. IEEE Trans. Autom. Control 19, 716–
723. (doi:10.1109/TAC.1974.1100705)
18. Nylander JAA. 2004 MrModeltest v2.
Program distributed by the author. Uppsala,
Sweden: Evolutionary Biology Centre, Uppsala
University.
19. Fedonkin MA, Vickers-Rich P, Swalla BJ, Trusler P,
Hall M. 2012 A new metazoan from the Vendian of
the White Sea, Russia, with possible affinities to the
ascidians. Paleontol. J. 46, 1 –11. (doi:10.1134/
S0031030112010042)
20. Drummond A, Rambaut A. 2007 BEAST: Bayesian
evolutionary analysis by sampling trees. BMC Evol.
Biol. 7, 214. (doi:10.1186/1471-2148-7-214)
21. Rabosky DL. 2010 Extinction rates should not be
estimated from molecular phylogenies. Evolution
64, 1816–1824. (doi:10.1111/j.1558-5646.2009.
00926.x)
22. Hadfield JD. 2010 MCMC methods for multiresponse generalized linear mixed models: the
MCMCglmm R Package. J. Stat. Softw. 33, 1–25.
23. Liu L, Yu L, Kubatko L, Pearl DK, Edwards SV. 2009
Coalescent methods for estimating phylogenetic
trees. Mol. Phylogenet. Evol. 53, 320– 328. (doi:10.
1016/j.ympev.2009.05.033)
24. Van Name WG. 1945 The North and South American
ascidians. Bull. Am. Mus. Nat. Hist. 84, 1–476.
25. Davis MP, Midford PE, Maddison W. 2013 Exploring
power and parameter estimation of the BiSSE
method for analyzing species diversification. BMC
Evol. Biol. 13, 38. (doi:10.1186/1471-2148-13-38)
26. Swalla BJ, Just MA, Pederson EL, Jeffery WR. 1999 A
multigene locus containing the manx and bobcat
genes is required for development of chordate
features in the ascidian tadpole larva. Development
126, 1643– 1653.
27. Goldberg EE, Kohn JR, Lande R, Robertson KA,
Smith SA, Igic´ B. 2010 Species selection maintains
self-incompatibility. Science 330, 493–495. (doi:10.
1126/science.1194513)
28. Gavrilets S, Vose A. 2005 Dynamic patterns of
adaptive radiation. Proc. Natl Acad. Sci. USA 102,
18 040–18 045. (doi:10.1073/pnas.0506330102)
29. Birand A, Vose A, Gavrilets S. 2012 Patterns of
species ranges, speciation, and extinction. Am. Nat.
179, 1–21. (doi:10.1086/663202)
30. Young CM, Gowan RF, Dalby J, Pennachetti CA,
Gagliardi D. 1988 Distributional consequences of
adhesive eggs and anural development in the
ascidian Molgula pacifica (Huntsman, 1912). Biol.
Bull. 174, 39 –46. (doi:10.2307/1541757)
31. Stanley SM. 1986 Population size, extinction, and
speciation: the fission effect in Neogene Bivalvia.
Paleobiology 12, 89 –110.
32. Stanley SM. 1979 Macroevolution, pattern and
process. San Francisco, CA: W. H. Freeman.
Biol Lett 9: 20130068
Thorson G. 1950 Reproductive and larval ecology of
marine bottom invertebrates. Biol. Rev. 25, 1 –45.
(doi:10.1111/j.1469-185X.1950.tb00585.x)
2. Strathmann RR. 2007 Three functionally distinct
kinds of pelagic development. Bull. Mar. Sci. 81,
167–179.
3. Hellberg ME. 2009 Gene flow and isolation among
populations of marine animals. Annu. Rev. Ecol.
Evol. Syst. 40, 291–310. (doi:10.1146/annurev.
ecolsys.110308.120223)
4. Emlet RB. 1995 Developmental mode and species
geographic range in regular sea urchins
(Echinodermata: Echinoidea). Evolution 49, 476–
489. (doi:10.2307/2410272)
5. Kohn AJ. 2012 Egg size, life history, and tropical
marine gastropod biogeography. Am. Malacol. Bull.
30, 163–174. (doi:10.4003/006.030.0115)
6. Hansen TA. 1978 Larval dispersal and species
longevity in Lower Tertiary gastropods. Science 199,
885–887. (doi:10.1126/science.199.4331.885)
7. Hansen TA. 1983 Modes of larval development and rates
of speciation in Early Tertiary neogastropods. Science
220, 501–502. (doi:10.1126/science.220.4596.501)
8. Jablonski D. 1986 Larval ecology and
macroevolution in marine invertebrates. Bull. Mar.
Sci. 39, 565– 587.
9. Jeffery CH, Emlet RB. 2003 Macroevolutionary
consequences of developmental mode in temnopleurid
echinoids from the Tertiary of southern Australia.
Evolution 57, 1031–1048. (doi:10.1554/00143820(2003)057[1031:MCODMI]2.0.CO;2)
10. Duda TF, Palumbi SR. 1999 Developmental shifts
and species selection in gastropods. Proc. Natl Acad.
Sci. USA 96, 10 272–10 277. (doi:10.1073/pnas.96.
18.10272)
11. Shenkar N, Swalla BJ. 2011 Global diversity of
Ascidiacea. PLoS ONE 6, 1 –12. (doi:10.1371/journal.
pone.0020657)
rsbl.royalsocietypublishing.org
1.
5
© Copyright 2026