
THE SHAPES OF SCORIA CONES ON MARS: DETAILED
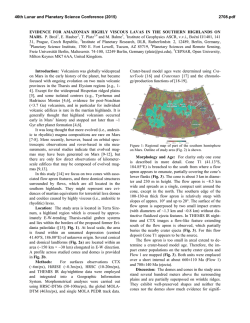
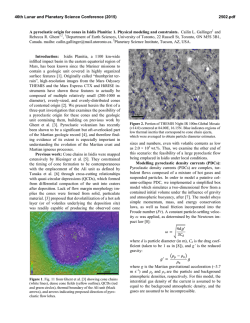
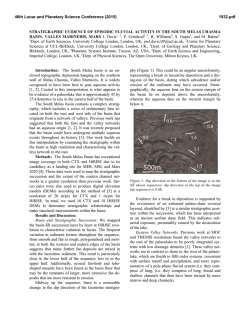
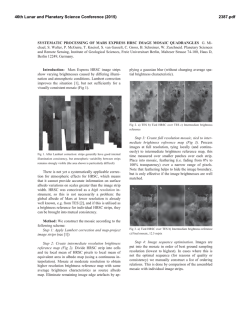
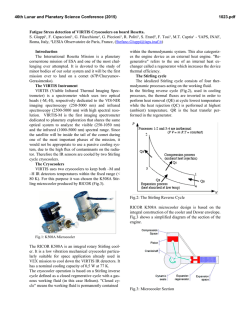
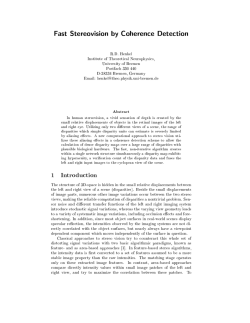
46th Lunar and Planetary Science Conference (2015)
1753.pdf
THE SHAPES OF SCORIA CONES ON MARS: DETAILED INVESTIGATION OF THEIR
MORPHOMETRY BASED ON HIRISE AND CTX DTMS. P. Brož1,2, O. Čadek3 E. Hauber4 and A. P. Rossi5,
1
Institute of Geophysics ASCR, v.v.i., Prague, Czech Republic, [email protected], 2Institute of Petrology and
Structural Geology, Charles University, Czech Republic 3Charles University, Faculty of Mathematics and Physics,
Department of Geophysics, V Holešovičkách 2, 180 00, Prague, Czech Republic, [email protected]
4
Institute of Planetary Research, DLR, Berlin, Germany, [email protected], 5 Jacobs University Bremen, Campus
Ring 1, 287 59, Bremen, Germany, [email protected].
Introduction: The existence of scoria cones was
suggested for several regions on Mars [1-4]; and at
least in three cases they form volcanic fields: Ulysses
Colles (UC) [4], Hydraotes Colles (HC) [3] and unnamed field in Coprates Chasma (CC) [5,6]. Although
the interpretation of these edifices as scoria cones was
mainly based on their morphological similarity with
terrestrial analogues, no detailed investigation of their
morphometry was performed to support such conclusion, with the only exception of the Ulysses Colles
cone field [4]. However, this study was based on data
obtained from High Resolution Stereo Camera data
(HRSC) which have a resolution that is of limited use
for the investigation of km-sized landforms. Hence,
these results came with some degree of uncertainty.
Therefore, we decided to use newly available highresolution digital elevation models (DEM) based on
HiRISE and CTX stereo image pairs to investigate
cones within three hypothesized volcanic fields and to
compare the results between these fields. We test if
there are similarities in morphometry and shapes. Such
comparison has the potential to provide additional
criteria how to distinguish their formational mechanisms, and eventually to indirectly confirm their volcanic origin.
Data: We used topographic data derived from
HiRISE (~30 cm/pixel, [7n]) and CTX (5–6 m/pixel;
[8]) stereo images. High-resolution DEM were computed from HiRISE and CTX stereo pairs using the
methods described, e.g., in [9], and accurate with single shot data from the MOLA PEDRs. HiRISE and
CTX DEM reach a spatial resolution of ~1 m/pixel and
~10 m/pixel, respectively, and the vertical accuracy of
the stereo-derived DEM can be roughly estimated to be
around few meters. The delineation of the volcano
shape in plan view was done by numerical tracing
where the slope exceeds 1°.
Results: To carry out this study we processed 8
stereo image pairs (5 HiRISE, 3 CTX). This allows us
to investigate 28 conical structures within three fields.
17 cones are covered by HiRISE DEMs, 11 by CTX
DEMs. In all fields, only a subset of cones is investigated as none of the fields is completely covered with
stereo data of sufficient quality. As individual cones
display morphologic inhomogeneities, we determine
for each cone the average shape (Fig. 1) and measure
the basic morphometric values: basal diameter, crater
diameter, maximum height, volume and average and
maximum flank slope.
Fig. 1: Normalized height versus average slope (°) for
several cones within the UC and HC fields. Profiles based on
HiRISE and CTX DTMs (marked in legend). Cones between
the fields are similar in shape. 0 corresponds to 0 % and 1 to
100% of the real height.
Discussion: The results of our measurements are
shown in Fig. 2. They allow investigating the similarities and differences between the studied cone fields.
From a morphometric perspective, the cone flanks in
HC are similar to those in UC (Fig. 1), even though the
HC cones are generally smaller in diameter, lower, and
thus less voluminous than the UC cones. Cones in both
fields rise gradually from the surrounding units and are
steepest in the second third of profile and then in vicinity of the central crater, average slope angles decrease.
Unfortunately, the data for cones in CC are not of
sufficient quality to investigate the relation of average
slopes to the height over the entire length of the profiles as data shows large oscillations. Only the average
slopes could be determined in CC, but as visible on
Fig. 2, the cones have similar volumes/sizes as cones
in HC, and also similar average slopes. The investigated cones flanks in all fields do not reach average values higher than 25°, in fact, most of the average values
are below 20° (Fig. 2b). The maximum slopes mostly
range from 20° to 27° (Fig. 2c). Such values are consistent with the previous prediction [10] that the angle
of repose for scoria cones is commonly not reached on
46th Lunar and Planetary Science Conference (2015)
1753.pdf
Fig. 2: Plots show several dependencies within individual cones as within various fields too based on HiRISE and CTX DTMs.
a) volume versus height b) average slope of flanks versus height and c) maximum slope of flanks versus height.
Mars. We also found that the values (e.g., height)
based on HRSC DTM measurements [4] were partly
overestimated and cones in UC are slightly smaller
than previously thought.
We also test the hypothesis that the cones in HC
and CC were formed by volcanic low-energetic eruptions, similar to the formation of cones in UC [4,10];
Fig. 3a]. If the shapes of cones in HC and CC can be
explained by ballistic emplacement (Fig. 3b,c), this
provides additional hints at the mechanism of their
formation. We find out that the calculated average
shapes of cones can be explained with a good match
(mostly less than <10 meters) by ballistic emplacement, even though cones in HC and CC seem to be
distinct from the cones in UC (Figs. 2a,b).
We find out that to reconstruct cones shapes in UC,
HC and CC, the initial velocities of ejected particles
typically have to be in the range of 50 m/s to 140 m/s,
and particles diameters need to range between 1 mm
and 5 mm. However, when the current atmospheric
pressure, which varies between the fields, is taken into
account, the individual fields show some differences in
these parameters. The mean values for individual fields
are the following: ~100 m/s and 1.8 mm for UC (based
on 7 cones); 91 m/s and 1.8 mm for HC (based on 15
cones) and 84 m/s and 1.3 mm for CC (based on 6
cones). Such variations may be explained by less energetic eruptions and/or higher atmospheric pressure at
the time of formation, which caused a deposition of
ejected particles closer to the vent and hence partly
different shapes of the cones between fields. Nevertheless, our findings are within the range of previously
calculated values for cones in UC based on HRSC and
CTX DTM, and consistent with theoretical predictions
[11]. For this reason, we conclude that a volcanic hypothesis about the origin of the cones is consistent with
the observed shapes.
Acknowledgements: This study was partly supported by the
Grant 580313 of the program of the Charles University Science Foundation GAUK
Fig. 3:. Average profiles of several cones within three fields
and results of numerical modeling of ballistic emplacement
based on [10]. As visible, model is able reconstruct observed
shapes with error less than 10 meters.
References: [1] Bleacher et al. (2009), JVGR 185,
96–102 [2] Keszthelyi et al. (2008), JGR 113, E04005
[3] Meresse et al. (2008), Icarus 194, 487-500 [4] Brož
and Hauber (2012), Icarus 218, 88-99 [5] Harrison and
Chapman (2008), Icarus 198, 351–364 [6] Hauber et
al. (2015) LPSC, XLVI, Abstract #1476. [7] McEwen
et al., (2007), JGR, 112, E05S02 [8] Malin et al.,
(2007), JGR 112, E05S04 [9] Moratto et al. (2010),
LPSC, XLI, Abstract #2364 [10] Brož et al. (2014),
EPSL 406, 14-23 [11] Wilson and Head (1994). Rev.
Geophys. 32, 221–263.


© Copyright 2026